georgia’s tax revenue portfolio
TRANSCRIPT
Georgia’s Tax Revenue Portfolio
The Fiscal Research CenterPresentation by Dr. Carolyn Bourdeaux
to the Special Council on Tax Reform and Fairness for GeorgiansJuly 28 2010July 28, 2010
Overview1. Principles for Evaluating a Tax System
2 State General Fund Tax Revenues2. State General Fund Tax Revenues a. Overviewb. Performance Over Time
3. State and Local Tax Revenuesa. Overviewb. Rank Compared to Other Statesc Performance Over Timec. Performance Over Time
4. Selected Taxesa. Income Taxb S l Tb. Sales Taxc. Corporate Income Taxd. Misc. Taxes
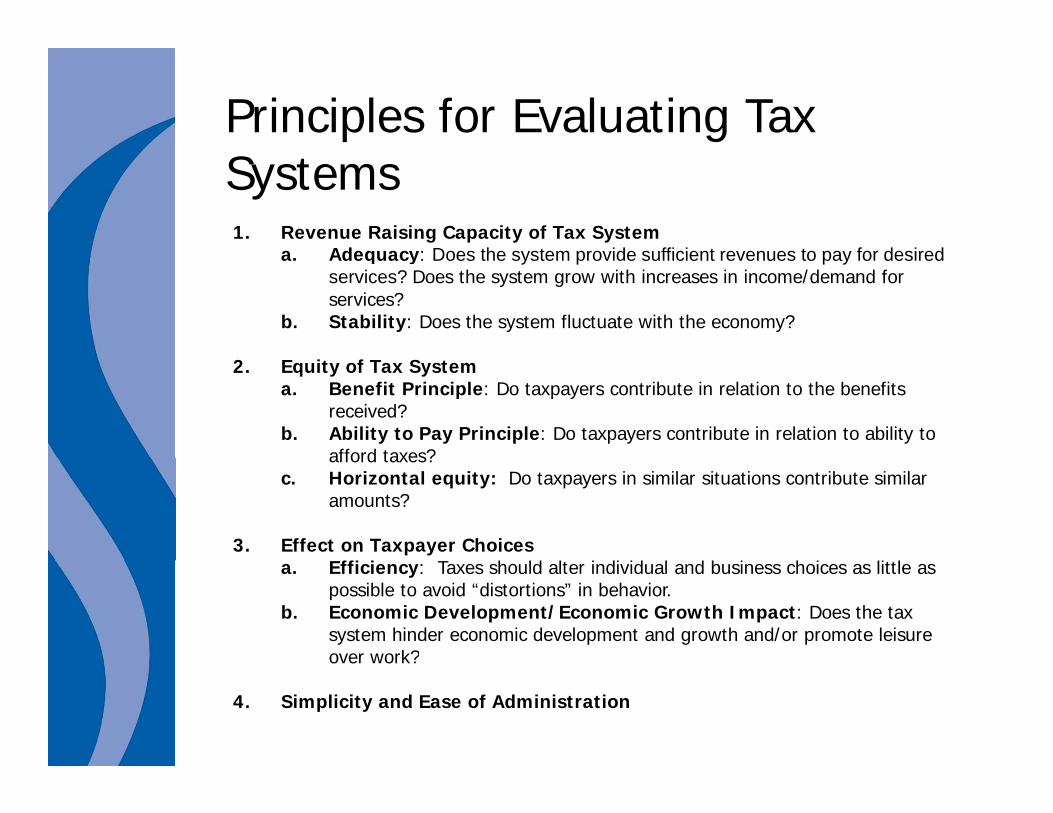
Principles for Evaluating Tax Systems1. Revenue Raising Capacity of Tax System
a Adequacy: Does the system provide sufficient revenues to pay for desireda. Adequacy: Does the system provide sufficient revenues to pay for desired services? Does the system grow with increases in income/demand for services?
b. Stability: Does the system fluctuate with the economy?
2. Equity of Tax Systema. Benefit Principle: Do taxpayers contribute in relation to the benefits
received?b. Ability to Pay Principle: Do taxpayers contribute in relation to ability to
afford taxes?afford taxes? c. Horizontal equity: Do taxpayers in similar situations contribute similar
amounts?
3. Effect on Taxpayer ChoicesEffi i T h ld l i di id l d b i h i li la. Efficiency: Taxes should alter individual and business choices as little as possible to avoid “distortions” in behavior.
b. Economic Development/Economic Growth Impact: Does the tax system hinder economic development and growth and/or promote leisure over work?over work?
4. Simplicity and Ease of Administration
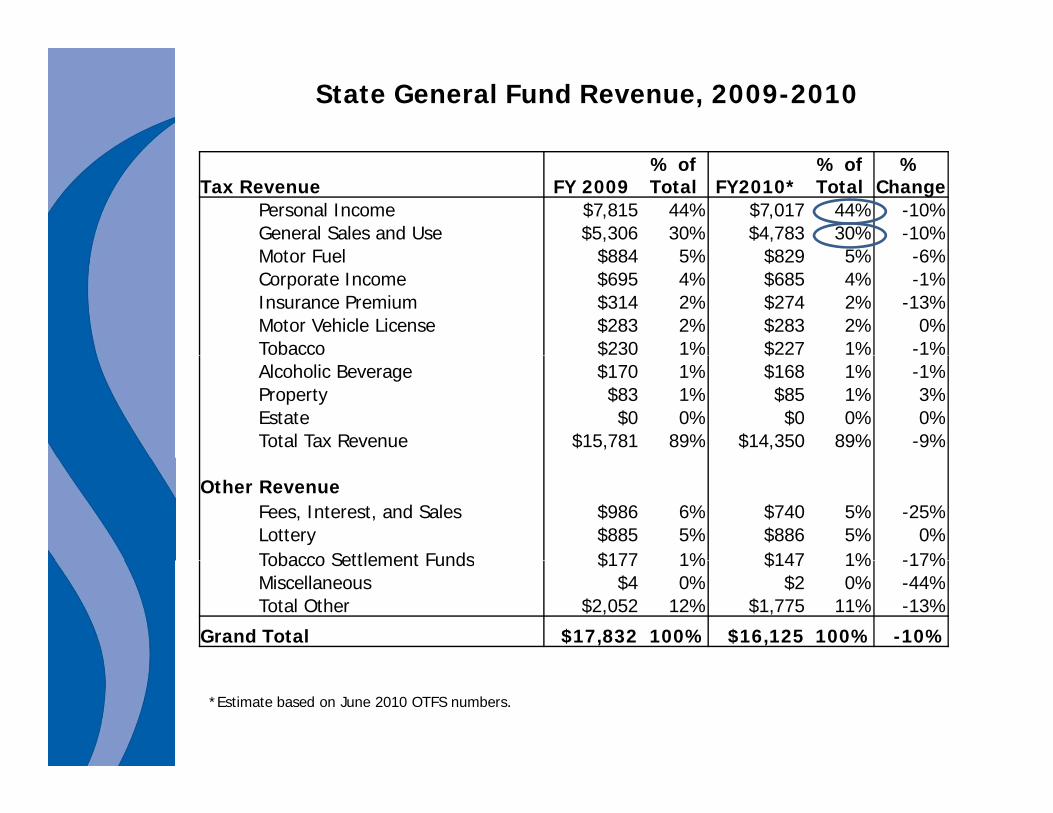
State General Fund Revenue, 2009-2010
Tax Revenue FY 2009% of Total FY2010*
% of Total
% Change
Personal Income $7,815 44% $7,017 44% -10%General Sales and Use $5,306 30% $4,783 30% -10%Motor Fuel $884 5% $829 5% 6%Motor Fuel $884 5% $829 5% -6%Corporate Income $695 4% $685 4% -1%Insurance Premium $314 2% $274 2% -13%Motor Vehicle License $283 2% $283 2% 0%Tobacco $230 1% $227 1% -1%$ $Alcoholic Beverage $170 1% $168 1% -1%Property $83 1% $85 1% 3%Estate $0 0% $0 0% 0%Total Tax Revenue $15,781 89% $14,350 89% -9%
Other RevenueFees, Interest, and Sales $986 6% $740 5% -25%Lottery $885 5% $886 5% 0%Tobacco Settlement Funds $177 1% $147 1% -17%Tobacco Settlement Funds $177 1% $147 1% -17%Miscellaneous $4 0% $2 0% -44%Total Other $2,052 12% $1,775 11% -13%
Grand Total $17,832 100% $16,125 100% -10%
*Estimate based on June 2010 OTFS numbers.
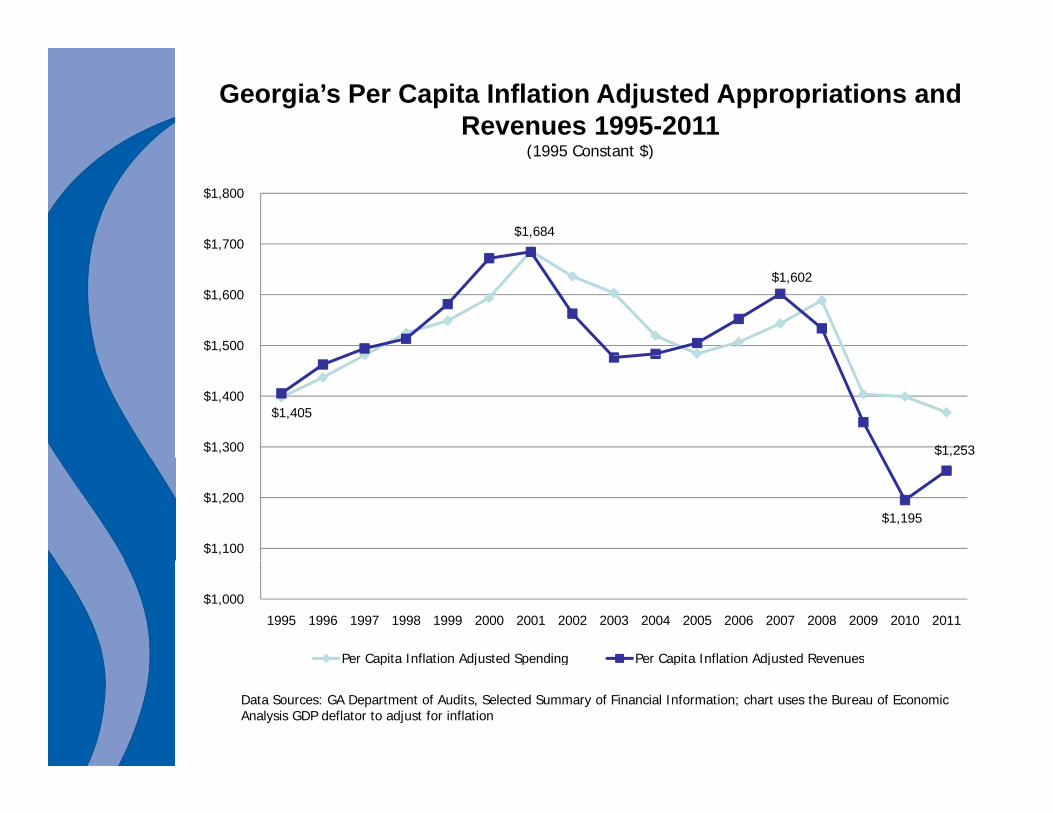
Georgia’s Per Capita Inflation Adjusted Appropriations and Revenues 1995-2011
(1995 Constant $)(1995 Constant $)
$1,684 $1,700
$1,800
$1,602
$1,500
$1,600
$1,405
$1,253 $1,300
$1,400
$1,195
$1,100
$1,200
$1,000
1995 1996 1997 1998 1999 2000 2001 2002 2003 2004 2005 2006 2007 2008 2009 2010 2011
Per Capita Inflation Adjusted Spending Per Capita Inflation Adjusted Revenues
Data Sources: GA Department of Audits, Selected Summary of Financial Information; chart uses the Bureau of Economic Analysis GDP deflator to adjust for inflation
e Cap a a o djus ed Spe d g e Cap a a o djus ed e e ues
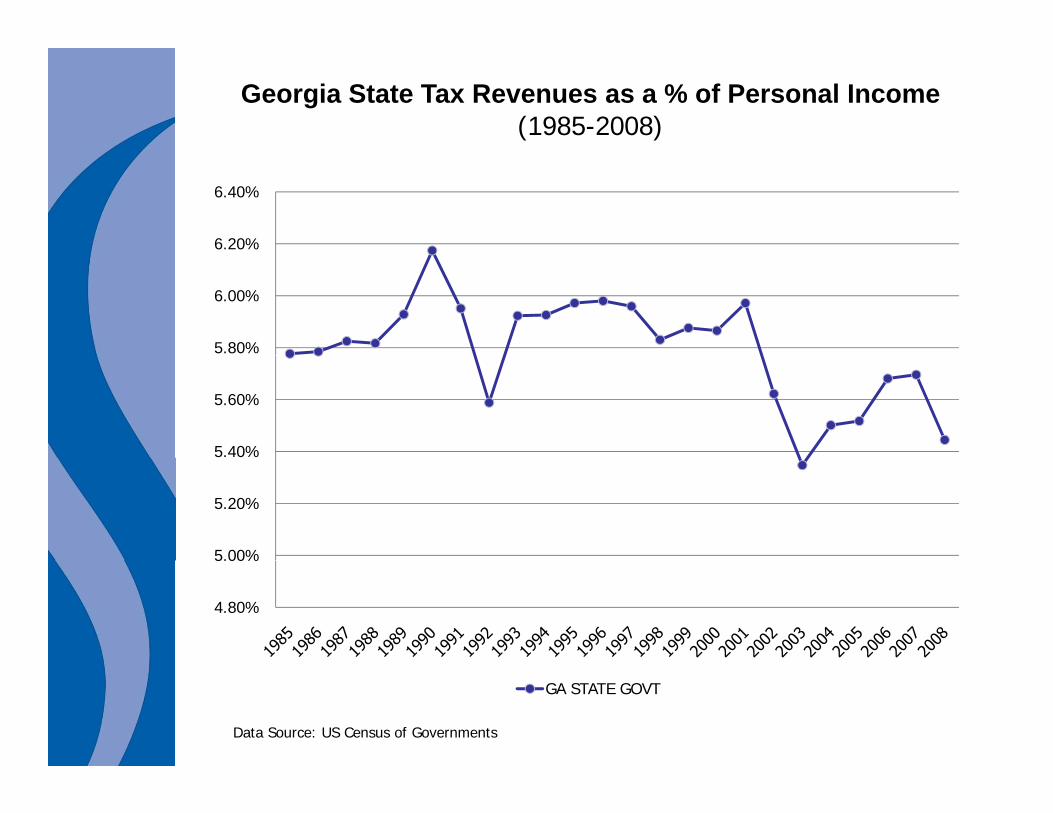
Georgia State Tax Revenues as a % of Personal Income(1985-2008)
6.20%
6.40%
5.80%
6.00%
5.40%
5.60%
5.00%
5.20%
4.80%
5.00%
GA STATE GOVT
Data Source: US Census of Governments
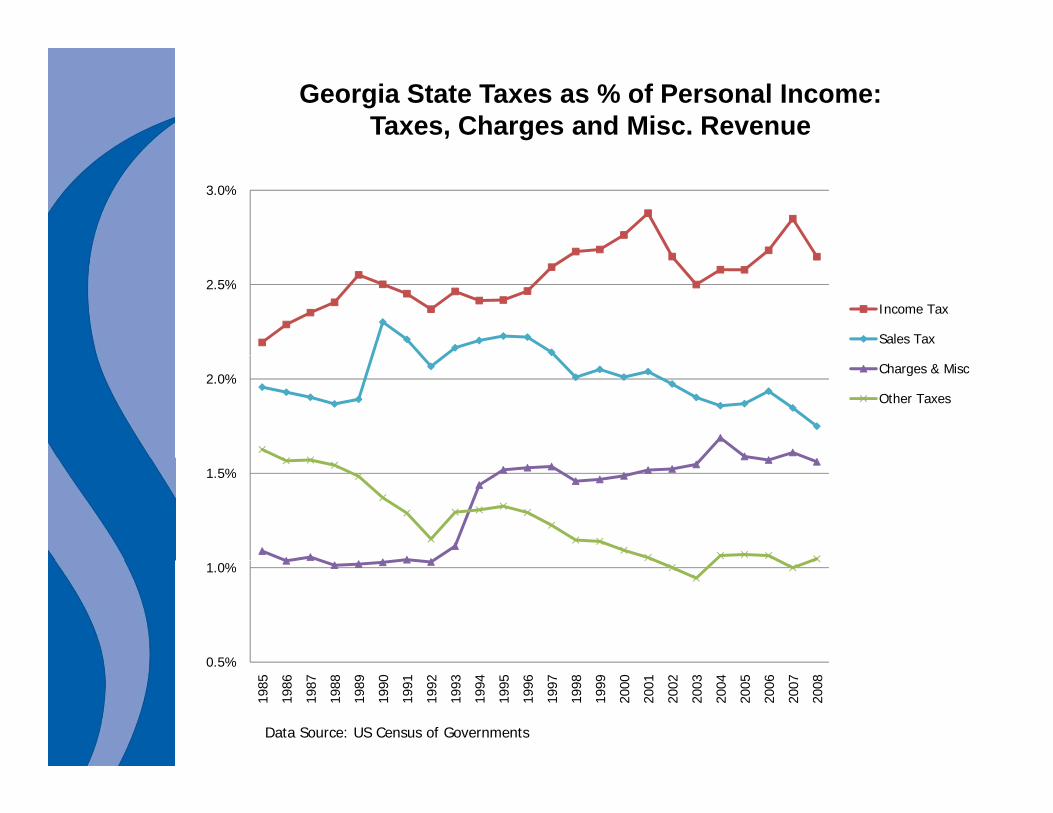
Georgia State Taxes as % of Personal Income: Taxes, Charges and Misc. Revenue
3.0%
2.5%
Income Tax
Sales Tax
2.0%Charges & Misc
Other Taxes
1.5%
0 5%
1.0%
0.5%
1985
1986
1987
1988
1989
1990
1991
1992
1993
1994
1995
1996
1997
1998
1999
2000
2001
2002
2003
2004
2005
2006
2007
2008
Data Source: US Census of Governments
Georgia State “Other” Taxes as % of Personal Income
0.50%
0.60%Corporate Income
Motor Fuel
MV License
0.40%
Tobacco
Alcoholic Beverage
0.30%
0.20%
0.00%
0.10%
1985
1986
1987
1988
1989
1990
1991
1992
1993
1994
1995
1996
1997
1998
1999
2000
2001
2002
2003
2004
2005
2006
2007
Data Source: US Census of Governments
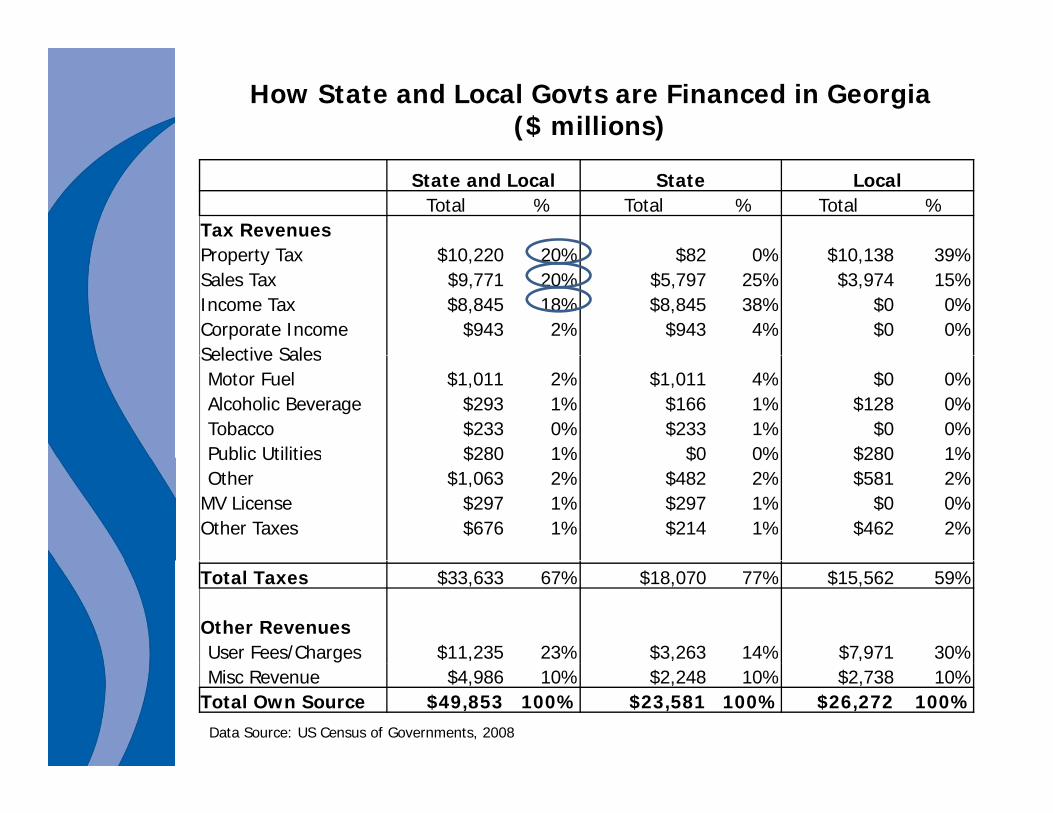
How State and Local Govts are Financed in Georgia($ millions)
State and Local State LocalTotal % Total % Total %
Tax RevenuesProperty Tax $10 220 20% $82 0% $10 138 39%Property Tax $10,220 20% $82 0% $10,138 39%Sales Tax $9,771 20% $5,797 25% $3,974 15%Income Tax $8,845 18% $8,845 38% $0 0%Corporate Income $943 2% $943 4% $0 0%Selective SalesSelective SalesMotor Fuel $1,011 2% $1,011 4% $0 0%Alcoholic Beverage $293 1% $166 1% $128 0%Tobacco $233 0% $233 1% $0 0%Public Utilities $280 1% $0 0% $280 1%Public Utilities $280 1% $0 0% $280 1%Other $1,063 2% $482 2% $581 2%
MV License $297 1% $297 1% $0 0%Other Taxes $676 1% $214 1% $462 2%
Total Taxes $33,633 67% $18,070 77% $15,562 59%
Other RevenuesUser Fees/Charges $11,235 23% $3,263 14% $7,971 30%Misc Revenue $4,986 10% $2,248 10% $2,738 10%
Total Own Source $49,853 100% $23,581 100% $26,272 100%Data Source: US Census of Governments, 2008

State and Local Tax Revenues Per Capita (2007)
All Taxes State and LocalRank State $ per capita
1 Alaska $7,2682 W oming $6 2052 Wyoming $6,2053 New York $6,898
Top Quintile Cutoff $4,71418 Virginia $4,205
50-State Mean $4,096Nat'l Median $4,011
26 Florida $4,009AAA Mean $3,849AAA Mean $3,849
33 North Carolina $3,58634 Georgia $3,481
SE Mean $3,415L Q i il C ff $3 312Last Quintile Cutoff $3,312
46 South Carolina $3,13448 Tennessee $3,00549 Mississippi $2,989
Data Source: US Census of Governments, 2007
pp50 Alabama $2,909
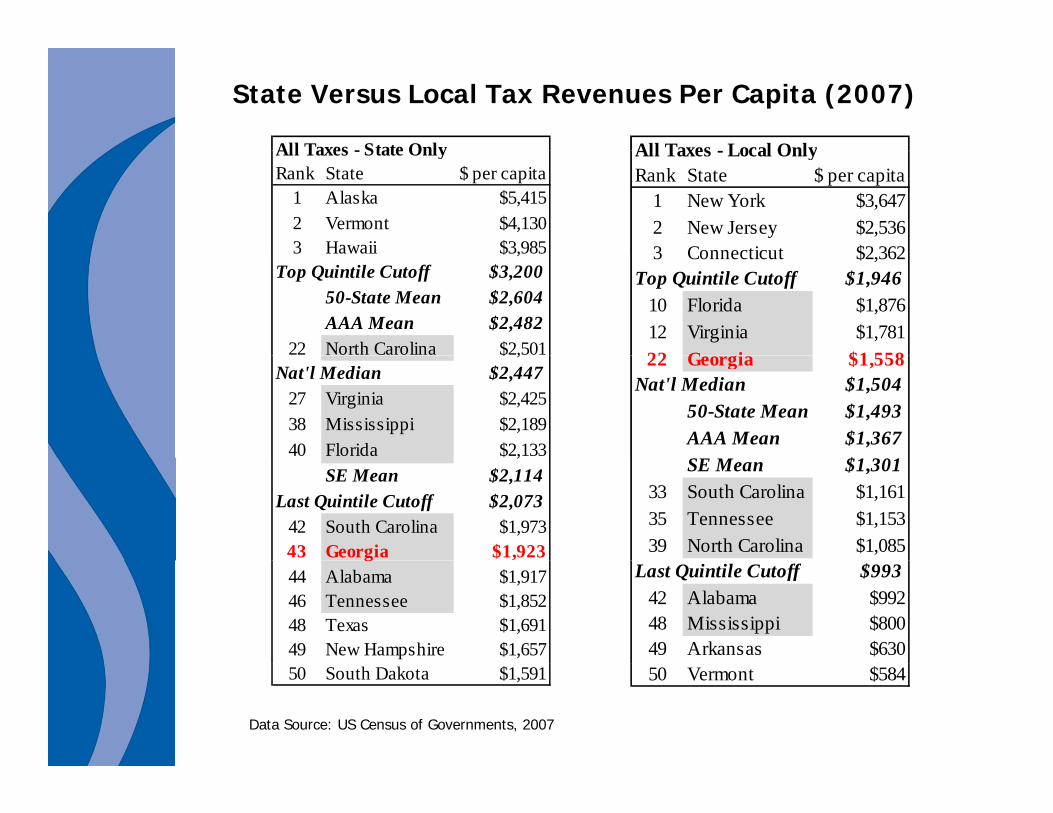
State Versus Local Tax Revenues Per Capita (2007)
All Taxes - State Only All Taxes Local OnlyAll Taxes - State OnlyRank State $ per capita
1 Alaska $5,4152 Vermont $4,1303 Hawaii $3,985
All Taxes - Local OnlyRank State $ per capita
1 New York $3,6472 New Jersey $2,5363 Connecticut $2 3623 Hawaii $3,985
Top Quintile Cutoff $3,20050-State Mean $2,604AAA Mean $2,482
22 North Carolina $2,501
3 Connecticut $2,362Top Quintile Cutoff $1,946
10 Florida $1,87612 Virginia $1,78122 G i $1 558$ ,
Nat'l Median $2,44727 Virginia $2,42538 Mississippi $2,18940 Florida $2,133
22 Georgia $1,558Nat'l Median $1,504
50-State Mean $1,493AAA Mean $1,367
$,
SE Mean $2,114Last Quintile Cutoff $2,073
42 South Carolina $1,97343 Georgia $1,923
SE Mean $1,30133 South Carolina $1,16135 Tennessee $1,15339 North Carolina $1,085g
44 Alabama $1,91746 Tennessee $1,85248 Texas $1,69149 New Hampshire $1,657
Last Quintile Cutoff $99342 Alabama $99248 Mississippi $80049 Arkansas $630
50 South Dakota $1,591 50 Vermont $584
Data Source: US Census of Governments, 2007

Income Tax Per Capita (State Only)
Individual Income Tax (State Only)Rank State $ per capita
1 New York $2,1962 Maryland $1,9123 Connecticut $1,8159 Virginia $1,330
Top Quintile Cutoff $1,245AAA Mean $1,172,
13 North Carolina $1,17125 Georgia $924
Nat'l Median $92150 State Mean $86250-State Mean $862
33 South Carolina $735SE Mean $668
37 Alabama $660Last Quintile Cutoff $480
41 Mississippi $48043 Tennessee $41
44T Florida $0Zero IIT: AK,FL,NV,SD,TX,WA,WY
Data Source: US Census of Governments, 2007

Personal Income Tax Structure7 states have no income tax
2 states tax only interest and dividends
37 states tied their income tax system to the federal income tax system
Number of tax brackets ranges from 1 to 12
Georgia has 6 brackets, but is essentially flat
For all states, taxable income at the highest tax bracket ranges from
Highest Tax Rate(as of January 1 2010) Number of States (includes DC)
$3,000 to $1,000,000
In Georgia, taxable income at the highest bracket is $7,000 (This is for a single filer.)
Highest Tax Rate(as of January 1, 2010) Number of States (includes DC)3.0 - 3.9% 34.0 - 4.9% 55.0 - 5.9% 66 0 6 9% 12 (Georgia)6.0 – 6.9% 12 (Georgia)7.0 – 7.9% 68.0 – 8.9% 59.0 – 9.9% 110 0 10 9% 210.0 – 10.9% 211.0 – 11.9% 2
Source: Federation of Tax Administrators
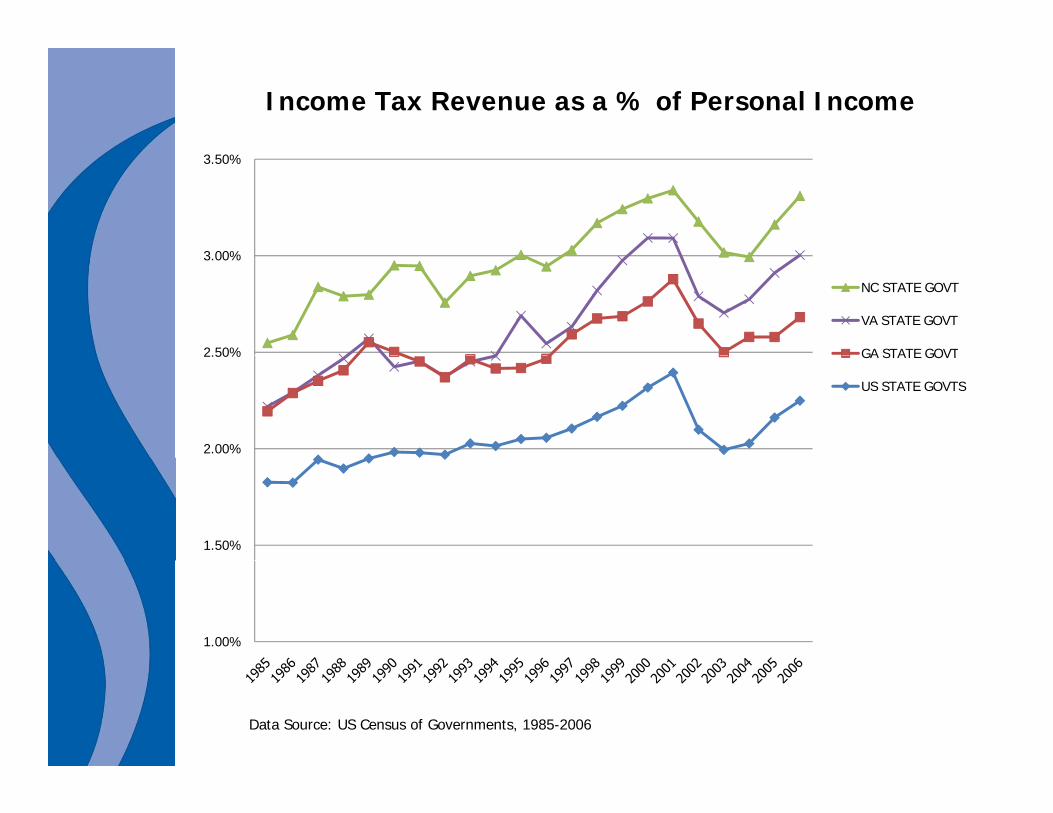
Income Tax Revenue as a % of Personal Income
3 00%
3.50%
2.50%
3.00%
NC STATE GOVT
VA STATE GOVT
GA STATE GOVT
2.00%
2.50% GA STATE GOVT
US STATE GOVTS
1.50%
1.00%
Data Source: US Census of Governments, 1985-2006
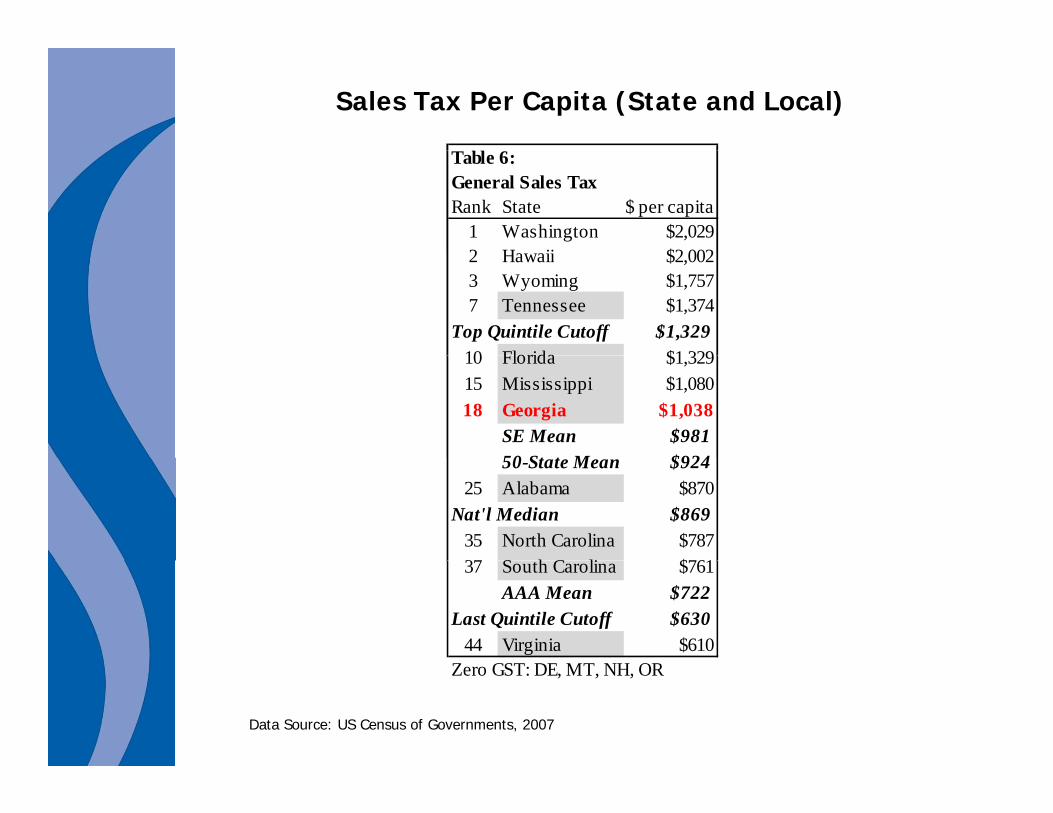
Sales Tax Per Capita (State and Local)
Table 6:General Sales TaxRank State $ per capita
1 Washington $2,0292 H ii $2 0022 Hawaii $2,0023 Wyoming $1,7577 Tennessee $1,374
Top Quintile Cutoff $1,32910 Florida $1 32910 Florida $1,32915 Mississippi $1,08018 Georgia $1,038
SE Mean $98150 St t M $92450-State Mean $924
25 Alabama $870Nat'l Median $869
35 North Carolina $78737 S h C li $76137 South Carolina $761
AAA Mean $722Last Quintile Cutoff $630
44 Virginia $610Z GST DE MT NH ORZero GST: DE, MT, NH, OR
Data Source: US Census of Governments, 2007
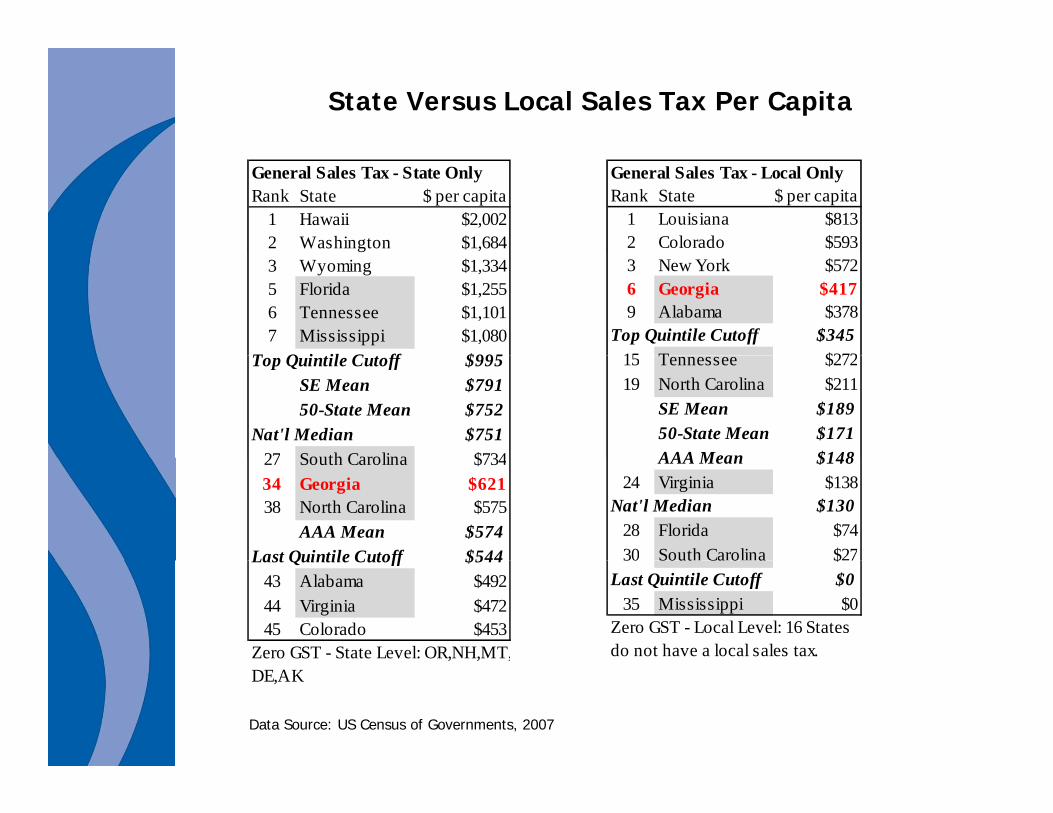
State Versus Local Sales Tax Per Capita
General Sales Tax - State OnlyRank State $ per capita
1 Hawaii $2,0022 Washington $1,684
General Sales Tax - Local OnlyRank State $ per capita
1 Louisiana $8132 Colorado $593
3 Wyoming $1,3345 Florida $1,2556 Tennessee $1,1017 Mississippi $1,080
T Q i il C ff $995
3 New York $5726 Georgia $4179 Alabama $378
Top Quintile Cutoff $34515 T $272Top Quintile Cutoff $995
SE Mean $79150-State Mean $752
Nat'l Median $75127 South Carolina $734
15 Tennessee $27219 North Carolina $211
SE Mean $18950-State Mean $171AAA Mean $14827 South Carolina $734
34 Georgia $62138 North Carolina $575
AAA Mean $574Last Quintile Cutoff $544
AAA Mean $14824 Virginia $138
Nat'l Median $13028 Florida $7430 South Carolina $27Last Quintile Cutoff $544
43 Alabama $49244 Virginia $47245 Colorado $453
Zero GST - State Level: OR,NH,MT,
30 Sout Ca o a $ 7Last Quintile Cutoff $0
35 Mississippi $0Zero GST - Local Level: 16 States do not have a local sales tax.
Data Source: US Census of Governments, 2007
DE,AK

Sales Tax Structure5 states have no sales taxNumber of services that are taxed ranges from 11 to 160 (Source: Federation of Tax Administrators, as of 2007)Food for home consumption: 32 states fully exempt; 7 states tax at aFood for home consumption: 32 states fully exempt; 7 states tax at a lower rate; 7 states tax at state tax rate (Source: Federation of Tax Administrators, as of January 1, 2010)Business to business purchases: Estimated percentage of tax base ranges from 11% to 72%. Georgia is at 36%. (Source: Raymond Ring, National Tax Journal, 1999)In Georgia, state and local sales taxes combined average about 6.8%
State Only Sales Tax Rates (January 1, 2010)
Number of State (includes DC)
1. – 1.9% 12.0 – 2.9% 03.0 - 3.9% 04.0 - 4.9% 10 (Georgia)5.0 - 5.9% 116.0 – 6.9% 187.0 – 7.9% 58.0 – 8.9% 1
Source: Federation of Tax Administrators
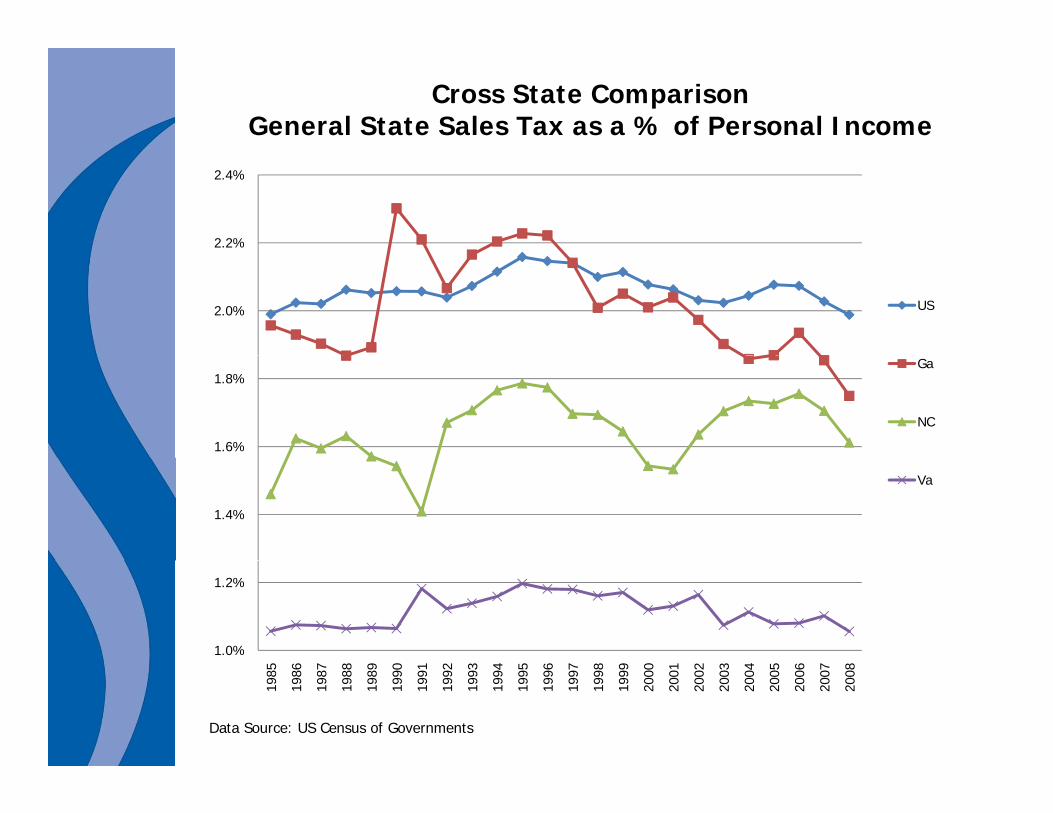
Cross State ComparisonGeneral State Sales Tax as a % of Personal Income
2.2%
2.4%
2.0% US
1.6%
1.8%Ga
NC
1.4%
Va
1.0%
1.2%
1985
1986
1987
1988
1989
1990
1991
1992
1993
1994
1995
1996
1997
1998
1999
2000
2001
2002
2003
2004
2005
2006
2007
2008
Data Source: US Census of Governments
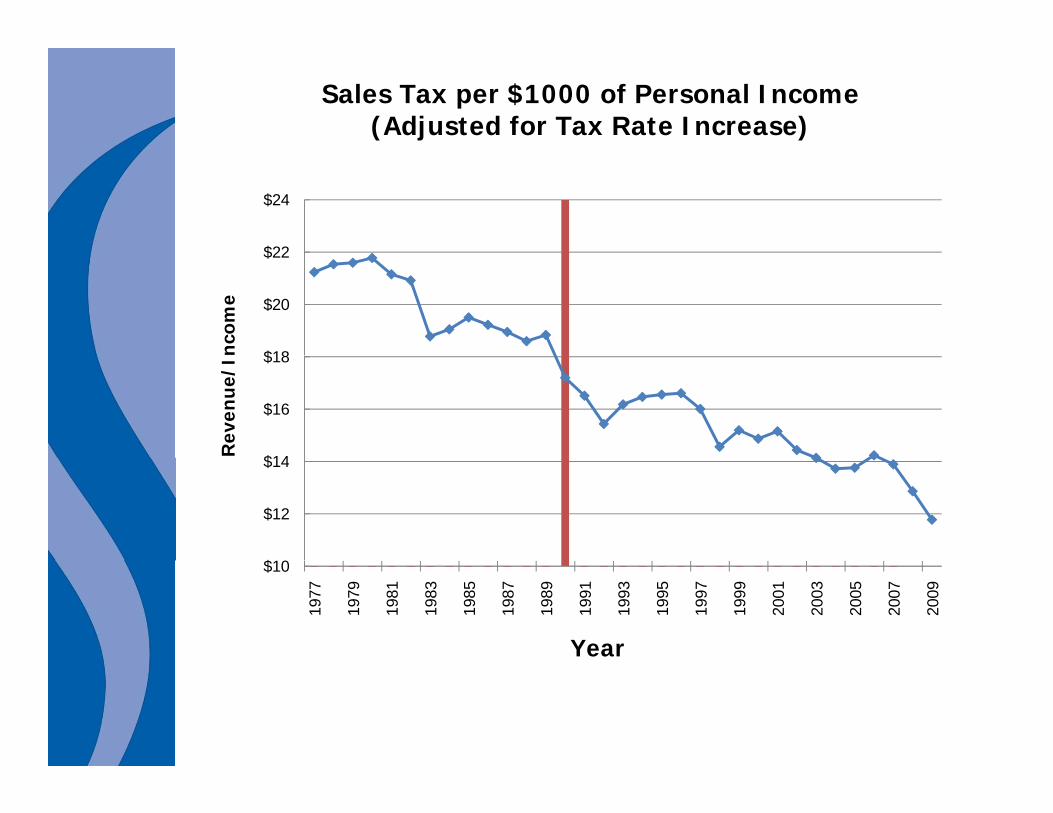
Sales Tax per $1000 of Personal Income(Adjusted for Tax Rate Increase)
$22
$24
$18
$20
$22n
com
e
$14
$16
$18
Rev
enu
e/I
$10
$12
$14
$10
1977
1979
1981
1983
1985
1987
1989
1991
1993
1995
1997
1999
2001
2003
2005
2007
2009
Year
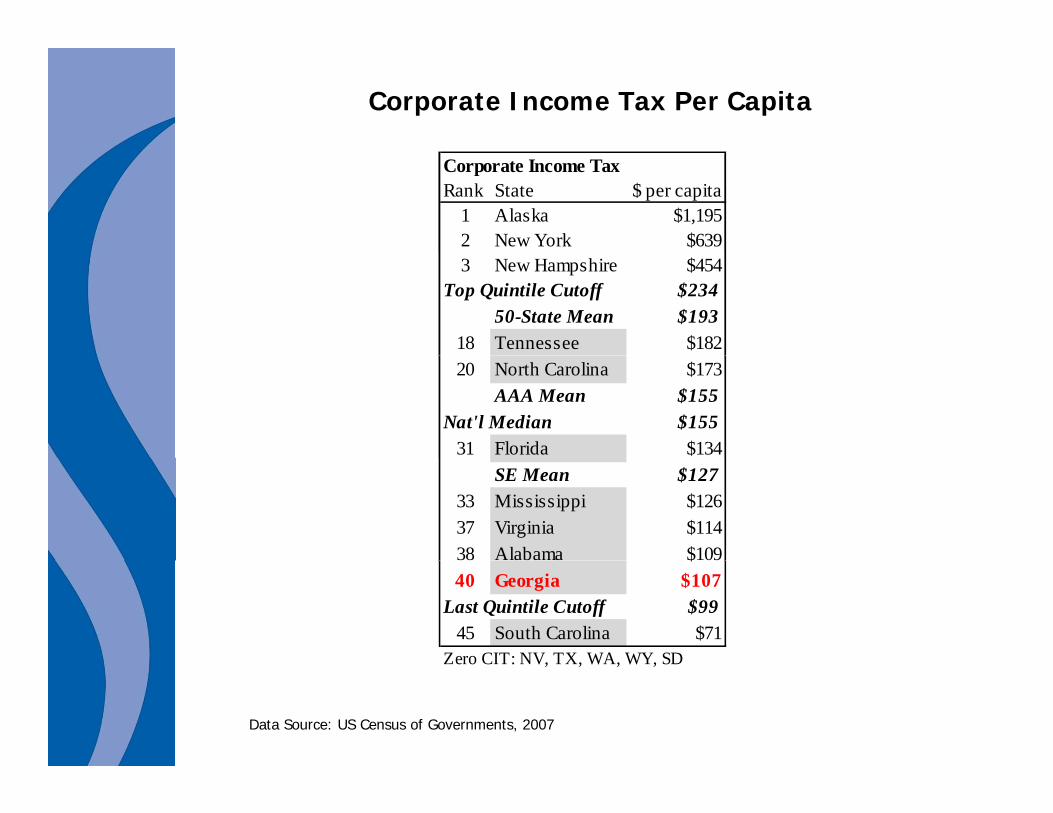
Corporate Income Tax Per Capita
Corporate Income TaxRank State $ per capita
1 Alaska $1,1952 New York $6393 New Hampshire $454
Top Quintile Cutoff $23450-State Mean $193
18 Tennessee $18220 North Carolina $173
AAA Mean $155Nat'l Median $155
31 Florida $134SE Mean $127
33 Mississippi $12637 Virginia $11438 Alabama $109$40 Georgia $107
Last Quintile Cutoff $9945 South Carolina $71
Zero CIT: NV, TX, WA, WY, SD
Data Source: US Census of Governments, 2007
Zero CIT: NV, TX, WA, WY, SD

0 80%
Georgia Corporate Income Tax as a % of Personal Income
0.70%
0.80%
US STATE GOVTS
0.50%
0.60% GA STATE GOVT
NC STATE GOVT
VA STATE GOVT
0.30%
0.40%
0.20%
0.30%
0.00%
0.10%

Miscellaneous Other Taxes (State and Local Combined)
Table 9:Selective Sales Taxes
Rank State $ per capitaMotor Fuel Alcohol Tobacco
Public Utilities Other
1 N d $996 12 23 27 13 1
Sub-Category Amount or Rank
1 Nevada $996 12 23 27 13 12 Vermont $832 23 10 6 40 23 Illinois $737 31 22 16 2 56 Florida $631 9 7 44 1 39
Top Quintile Cutoff $559 $173 $31 $87 $98 $26018 Alabama $518 24 2 36 4 3220 Virginia $499 40 16 40 9 15
50-State Mean $465 $138 $19 $59 $66 $183AAA Mean $437 $133 $19 $41 $52 $190
Nat'l Median $433 $138 $15 $56 $53 $15426 North Carolina $433 5 9 42 32 24
SE Mean $426 $143 $31 $25 $85 $14236 Mississippi $351 13 27 49 43 2939 South Carolina $343 38 8 50 41 22
Last Quintile Cutoff $332 $115 $9 $30 $18 $95Last Quintile Cutoff $332 $115 $9 $30 $18 $9541 Tennessee $332 20 3 47 42 3847 Georgia $303 42 12 43 37 4048 Oregon $296 41 50 14 23 4849 Wyoming $293 26 47 31 33 4750 Idaho $283 14 45 38 44 4550 Idaho $283 14 45 38 44 45
GA $114 $30 $25 $28 $106
Data Source: US Census of Governments, 2007
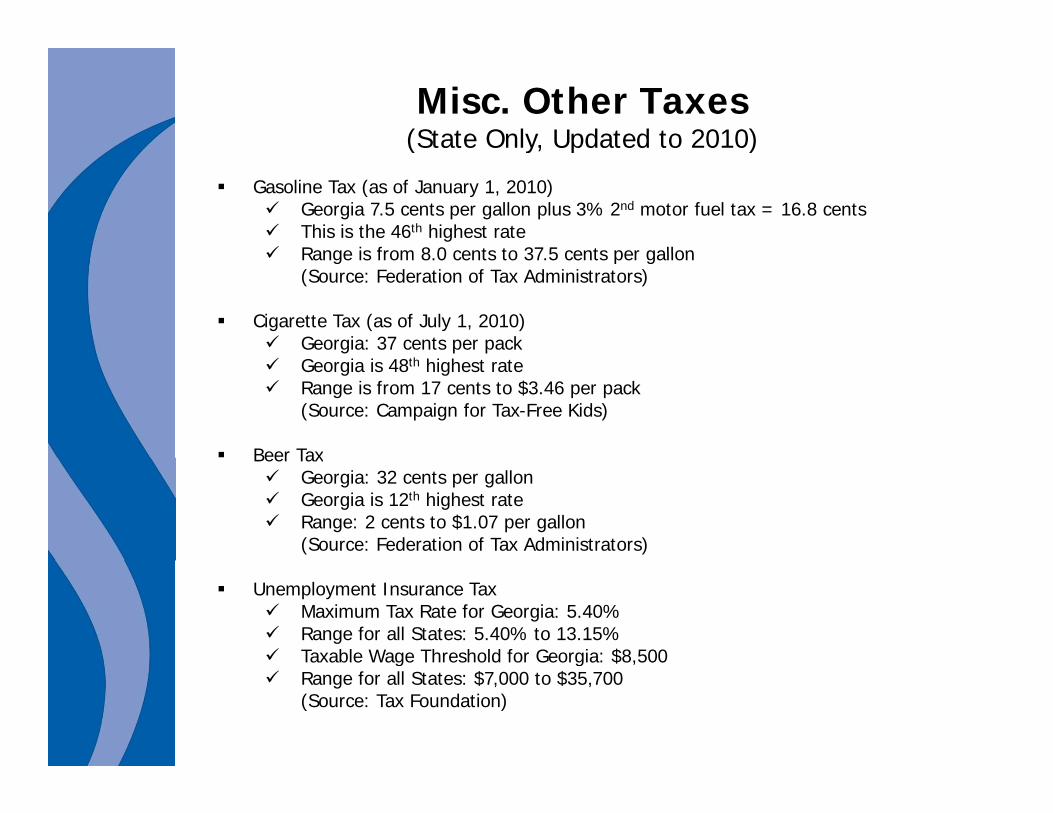
Misc. Other Taxes(State Only, Updated to 2010)( y, p )
Gasoline Tax (as of January 1, 2010)Georgia 7.5 cents per gallon plus 3% 2nd motor fuel tax = 16.8 centsThis is the 46th highest rateRange is from 8 0 cents to 37 5 cents per gallonRange is from 8.0 cents to 37.5 cents per gallon(Source: Federation of Tax Administrators)
Cigarette Tax (as of July 1, 2010)Georgia: 37 cents per packGeorgia is 48th highest rateRange is from 17 cents to $3.46 per pack(Source: Campaign for Tax-Free Kids)
Beer TaxBeer TaxGeorgia: 32 cents per gallonGeorgia is 12th highest rateRange: 2 cents to $1.07 per gallon(Source: Federation of Tax Administrators)
Unemployment Insurance Tax Maximum Tax Rate for Georgia: 5.40%Range for all States: 5.40% to 13.15%Taxable Wage Threshold for Georgia: $8,500g g $ ,Range for all States: $7,000 to $35,700(Source: Tax Foundation)

Business Climate Measures
Tax Foundation (High Ranking Number is Less "Business Friendly")(High Ranking Number is Less Business Friendly )
Overall Rank
Corporate Income Tax
Rank
Individual Income Tax
RankSales Tax
Rank
Unemployment Insurance Tax Index Rank
Property Tax Index Rank
Florida 5 15 1 32 3 22
Virginia 15 4 20 8 44 29
Alabama 19 23 17 25 16 17
Mississippi 21 13 18 35 4 23
Tennessee 22 11 8 49 32 46
South Carolina 26 9 28 18 43 26
G i 29 8 30 23 22 36Georgia 29 8 30 23 22 36
North Carolina 39 25 36 34 5 37
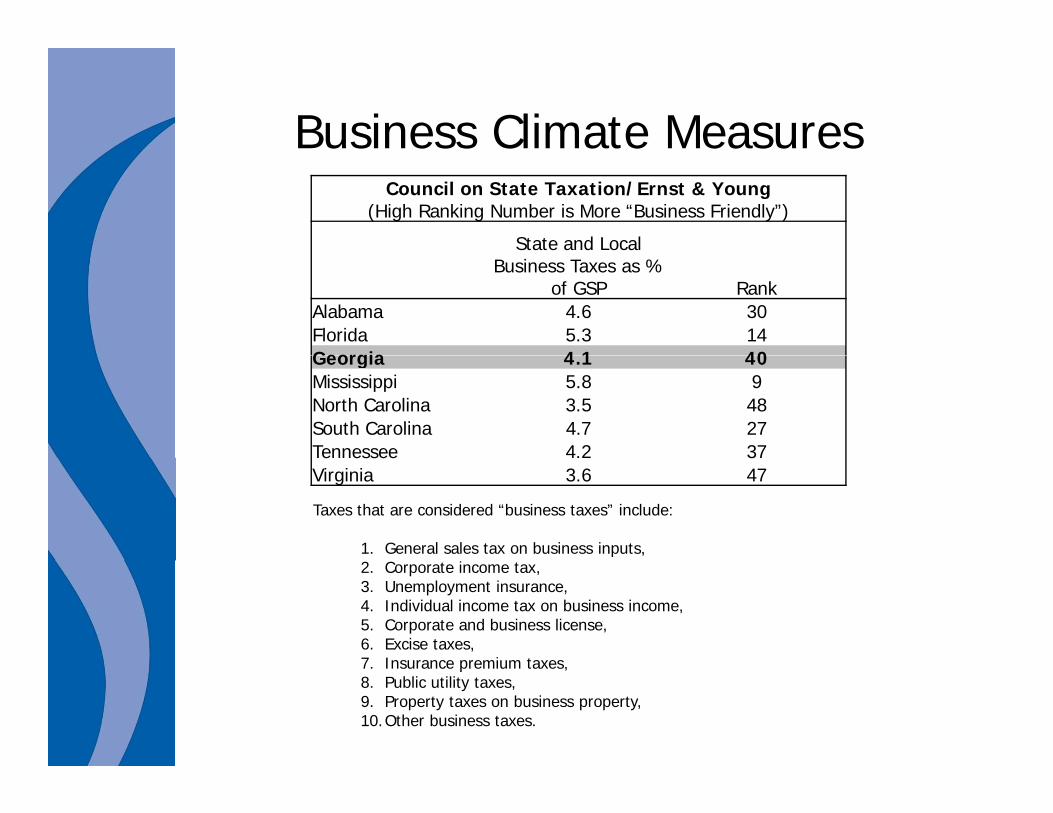
Business Climate MeasuresCouncil on State Taxation/Ernst & Young
(High Ranking Number is More “Business Friendly”)
State and Local Business Taxes as %
of GSP RankAlabama 4.6 30Florida 5.3 14Georgia 4 1 40Georgia 4.1 40Mississippi 5.8 9North Carolina 3.5 48South Carolina 4.7 27Tennessee 4.2 37e essee 3Virginia 3.6 47
Taxes that are considered “business taxes” include:
1. General sales tax on business inputs, 2. Corporate income tax, 3. Unemployment insurance,4. Individual income tax on business income, 5. Corporate and business license, 6. Excise taxes, 7 Insurance premium taxes7. Insurance premium taxes, 8. Public utility taxes, 9. Property taxes on business property, 10.Other business taxes.
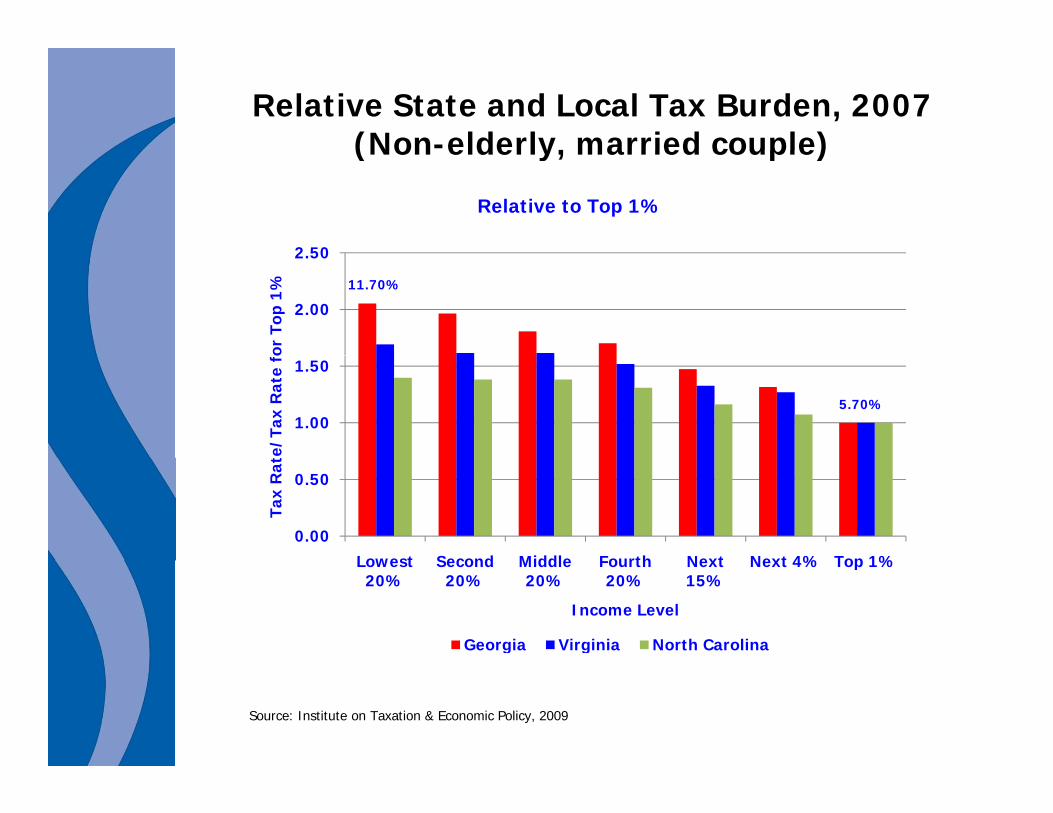
Relative State and Local Tax Burden, 2007(Non-elderly, married couple)(Non elderly, married couple)
2 50
Relative to Top 1%
2.00
2.50or
Top
1% 11.70%
1.00
1.50
te/T
ax R
ate
fo
5.70%
0.00
0.50
Lowest Second Middle Fourth Next Next 4% Top 1%
Tax
Rat
Lowest 20%
Second 20%
Middle 20%
Fourth 20%
Next 15%
Next 4% Top 1%
Income Level
Georgia Virginia North Carolina
Source: Institute on Taxation & Economic Policy, 2009

Relative to Top 1%
6.00
7.00
op 1
%
3 00
4.00
5.00x
Rat
e fo
r To
1.00
2.00
3.00
Tax
Rat
e/Ta
0.00
1.00
Lowest 20%
Second 20%
Middle 20%
Fourth 20%
Next 15% Next 4% Top 1%
Income Level
Georgia Oregon Washington
Source: Institute on Taxation & Economic Policy, 2009

Fiscal Research CenterAndrew Young School of Policy StudiesAndrew Young School of Policy Studies
Georgia State UniversityWebsite: http://frc.gsu.edu
This presentation is available at:
http://fiscalresearch.gsu.edu/taxreform/