public disclosure authorized reports desk|...
TRANSCRIPT

RETURN TO ~~~~~~~~~~R E S T R I C T E DRETURN TO REPORTS DESK| R e p o r t N o. TO-285a
WITHIN rILE COPYONE WEEK
This report was prepared for use within the Bank. It may not be publishednor may it be quoted as ropresenting the Bank's views. The Bank accepts noresponsibility for the accuracy or completeness of the contents of the report.
INTERNATIONAL BANK FOR RECONSTRUCTION AND DEVELOPMENT
APPRAISAL OF THE
DEAD SEA WORKS, LTD.
POTASH PROJECT
ISRAEL
June 7, 1961
Department of Technical Operations
Pub
lic D
iscl
osur
e A
utho
rized
Pub
lic D
iscl
osur
e A
utho
rized
Pub
lic D
iscl
osur
e A
utho
rized
Pub
lic D
iscl
osur
e A
utho
rized
Pub
lic D
iscl
osur
e A
utho
rized
Pub
lic D
iscl
osur
e A
utho
rized
Pub
lic D
iscl
osur
e A
utho
rized
Pub
lic D
iscl
osur
e A
utho
rized
APPRAISAL OF THE
DEAD SEA WORKS. LTD.
POTASH PROJECT(Israel)
SUMMARY AND CONCLUSIONS
i. The Dead Sea Works, Ltd. (DSW) is the successor of Palestine PotashConmpany, Ltd. which from 1931 through 1947 produced potash and bromine fromDead Sea brine. In 1947 production amounted to about 103,000 tons from twoplants, one at the north and one at the south end of the Dead Sea. After thewar only the southern plant was in Israel and it was damaged and isolated,since access to it had been by sea from the northernplant (paras. 5-7).
ii. In 1952, after the shareholders of Palestine Potash had been unableto secure financing to resume operations, the Government of Israel made asettlement with the shareholders, and took over the assets of the company inIsrael, forming the Dead Sea Works, Ltd. (paras. 7; 11-12).
iii. The first years of reconstruction were difficult; large sums hadto be expended for road construction, flood protection, power supply, freshwater wells and housing. Changes in the potash market required the develop-ment of a new refining process. Considerable effort was required to re-enterthe international markets (para. 8).
iv. Lack of proper management hampered the reconstruction until 1955,when a new General Manager was appointed. Since then progress has been rapidand in the 1960/61 fiscal year the DSW had potash production and sales of136,000 tons (paras. 8-10; 20-21).
v. Despite the success in overcoming operating problems and increasingproduction, the financial record has been poor since the DSW had to makelarge investments in non-productive facilities in order to commence and main-tain operations. Expenditures to date have been financed largely from Govern-ment sources (paras. 13-19).
vi. The DSW cannot expand beyond a level of about 190,000 tons per yearunless it undertakes a project to close off a portion of the Dead Sea itself.Technical considerations preclude undertaking this project in small steps andthe! DSW must either increase its capacity threefold or stop its growth at acapacity of about 190,000 tons (para. 27).
APPRAISAL OF THE
DEAD SEA WORKS, LTD.
POTASH PROJECT(Israel)
TABLE OF CONTENTSParagraphs
SUMMARY AND CONCLUSIONS . . .. . . . . . . . . . i - xvi
I. INTRODUCTION . . . . . . . . . . . . . . . . . . 1 - 4
II. THE COMPANY . . . . . . . . 5 - 21A. History . . .* . ........ 5-10B. Ownership .. . .. ....... 11 - 12C. Financial Record . . . . . ........ 13 - 19D. Management and Staff . . . . . . . . . .. 20 - 21
III. THE PROJECT . . . . . . . 22 -51A. General . . . . . . . . . . . . . . . . . 22 - 24B. Concession . . . . * . . . . 25-26C. Features of the Project. . . . . . . . . 27 - 39
1) Potash . . . . . . . . . . ... 27 - 292) Bromine and Bromine Compounds . . . . 30 - 323) Dead Burned Magnesia . . . . . . . . 334) Table Salt . . . . . . . . . . . . . 345) Other Construction . . . . . . .... 356) General Services . . . . . . . . . . 36 - 39
D. Labor . . . . . . . . . . . . . . . . . . 40 - 41E. Present Status of the Project . . . . . . . 42 - 44F. Construction Cost Estimates . . . . . . . . 45 - 48G. Construction Schedule ...... . . . . . 49 - 50H. Procurement . . . . . 51
IV. MARKETS AND IARKETING. . .. . . . . . . .. . . 52 -65A. The Market for Potash . . . . . . . . . . . 52- 57B. The Market for Bromine and Bromine Compounds 58 - 61C. Table Salt . . . . . . .. . . . . . . . . 62D. Magnesite . . . . . . . G. . . . . . .. 63E. Marketing ..... .. . . . .. .. .. . . . . 64 - 65
V. FINANCING PLAN AND FINANCIAL PROSPECTS . . 66 - 89A. General . . . . . . . . . . . ... . . . 66-70B. Proposed Capital Structure . . . . . . . . 71 - 72C. Organization and Management . . . . . . . . 73D. Financing Plan . . .. . . .. 74 - SOE. Financial Prospects . .... . . . . 81 - 89
VI. PROTECTIVE ARRANGEIENTS . . . . . . . . . . . . . 90 -91
VII. CONCLUSION . . . . . . . . . . . . . . . . . . . 92 -93

TABLE OF CONTENTS (Cont'd.)
ANNEXES
1 Palestine Potash Limited (Profit and Loss Accounts)
2 The Market for Potash
3 The Dead Sea Works, Ltd. (Income Forecasts)
4 The Dead Sea Works, Ltd. (Cash Flow Forecasts)
5 The Dead Sea Works, Ltd. (Balance Sheet Forecasts)
6 Assumptions for Financial Forecasts
Map 1 - ISRAEL
Map 2 - The Dead Sea Works, Ltd. - Present and Prospective Layoutof Pan Area
- ii -
vii. The DSW proposes to build about 47 kms. of dikes to enclose 100sq. kms. of sea area to be used as evaporating pans. Production capacitywould be increased by about 400,000 tons per year. Later, and at a rela-tively small additional cost, another 300,000 tons annual capacity could beobtained, making the ultimate annual capacity of the works about 900,000 tons.In addition, it is proposed to expand bromine and ethylene dibromide capacityfrom 2,900 and 1,500 tons to 10,000 and 6,000 tons respectively and to addfacilities for the production of other bromine compounds, 75,000 tons ofdead-burned magnesia and 20,000 tons of table salt (paras. 27-44).
viii. The project is estimated to cost $72 million equivalent, includingstart-up expenses, working capital, interest during construction and othermiscellaneous construction works. The plans for the project are technicallysound and cost estimates have been calculated on a conservative basis. Amarket study indicates that the DSW should be able to market its productsat a profit (paras. 45-65).
ix. Because of the magnitude of the project, the DSW cannot generateall the necessary funds and it has been apparent from the first that a finan-cial reorganization would be required to establish a financial structure whichwould permit the company to raise new equity and loan funds. A basic objec-tive has been to turn the company back to private control. During the pastyear discussions have centered on how this objective could best oe accomplished(paras. 66-67).
x. In considering the conversion of the company's debt to the Govern-ment, the Government has agreed that it would not hold more than 45% of theshares and that it would not have more than 35% of the voting rights. TheGovernment also stated its policy to encourage private investment in industry.In order to facilitate the raising of IL 27 million by a public share issue,it was agreed, on the advice of the underwriters, that the new shares shouldbear a fixed rate of interest during the construction period. Within thisframework it was then possible to work out a detailed plan for the recapi-talization of the company (paras. 68-70).
xi. Agreement has been reached among the interested parties on thedetails of the plan. The company has taken the necessary steps to amend itsArticles of Association and to carry out the other steps in the plan (paras.71-73).
xii. During the construction period, the total financial requirementsare estimated at $79.3 million equivalent for the project, including workingcapital and interest during the construction period, repayment of medium-term debt, replacements and renewals of equipment in the present plant andinterest payments on the new Ordinary Shares. It has been assumed that theserequirements would be met, in addition to company-generated funds of $21.1million equivalent, by the sale of $15 million equivalent of Ordinary Shares5long-term borrowings of $35 million equivalent and $8.2 million equivalentfrom other sources (paras. 74-8O).

- iii -
xiii. On the basis of these and other assumptions included in Annex 6,the long-term debt/equity ratio would not rise above 54:46 in the last yearof construction. The liquidity position would be poor in the last two yearsof construction but should improve rapidly thereafter. After capacity opera-tions are reached, expected in 1967, net income after taxes, should amountto 16% on the shareholders' average equity or 20% on share capital. Theseshould increase to 19% and 32% respectively on the assumption that the ex-pansion to the 900,000 ton level is completed in 1969. Income beforeinterest and taxes would amount to about 15% on the net investment in 1967arid 24% in 1970 (paras. 81-85).
xiv. Total debt service coverage is adequate. After 1967 when capacityoperations of the Project are expected, the DSW could maintain service on itstotal long-term debt if sales revenues were to decline by 28% or operatingcosts were to increase by 44% (paras. 86-89).
xv. Contractual arrangements provide for a restriction on borrowings,a restriction on investments in other than the Project and the achievementand maintenance of a current ratio (paras. 90-91).
xvi. The Project is soundly conceived technically and the market prospectsare favorable. The management of the company is good. The profitabilityprospects are good after the completion of the Project and should be morefavorable when the second stage expansion is completed. The financing plan,although it may be tight during the last two years, is, on the whole, satis-factory. Subject to the successful completion of the public share issue,the Project is a suitable basis for a Bank loan of $25 million equivalentfor a term of 15 years, including a 5-year grace period.

I. INTRODUCTION
1. Late in 1959 the Government of Israel asked the Bank to assist infinancing development projects of high priority. The Bank agreed to considerthis request and asked that details be submitted on a number of projects.After a preliminary examination of the data, it was decided that a projectto expand potash production should be examined in more detail in Israel.
2. A mission made a detailed field study of the Dead Sea Works, Ltd.program for the expansion of potash production and other related productsduring March and April 1960. The mission concluded that the expansion pro-gram was sound but that the company could not carry out the work unless itcould raise a substantial amount of new equity capital.
3. Throughout the remainder of 1960, and early 1961, discussions con-tinued with the company, the Government, and financial groups in order toarrive at a financing plan by which the company could undertake the expansionprogram. Such a plan has been developed and the expansion pr6gran can now beconsidered for a proposed loan from the Bank.
4. This report is based on the results of the field study and on in-formation submitted by the company and by the Government of Israel. Theinvestment cost estimates and market prospects were checked for the Governmentby the firm of Arthur D. Little, Inc.
II. THE COMPANY
A. History
5. The Dead Sea Works Ltd. is the successor of Palestine Potash CompanyLtd. formed in 1930. The late Mr. Moshe Novomeysky, the founder of the origi-nal company, began experiments in 1911 to determine whether the salts presentin the Dead Sea, principally potassium chloride (potash) and bromine, couldbe recovered commercially. In 1920 Mr. Novomeysky applied for a concessionbut it was not until 1929, after long and difficult negotiations that he ob-tained the concession. The concession was transferred to the Palestine PotashComparny Ltd. on January 1, 1930. Production of bromine started in 1931 andproduction of potash in 1932 at a plant constructed at the north end of theDead Sea; in 1937, potash production was started at a second plant at thesouth end of the Sea. In 1947 total production of potash amounted to about103,000 tons, of which about 58,000 tons were produced at the southern plant.
6. Although the complete records of the early years are not available,Palestine Potash had earnings from 1937 through 1947, the last year of opera-tiois, and made dividend payments on preference shares from 1938 through 1947inc'Luding the payment of arrears in 1940 (see Annex 1). After 1943, thecapital consisted of I, 390,000 6% preference shares and fl 610,000 ordinaryshares. In 1946, the company paid its first dividend of 5% on the ordinaryshares and in 1947 a 24% interim dividend on the ordinary shares. At theend of 1947 the company had an accumulated depreciation reserve of 3; 604,000and net assets of I; 774,000.

- 2-
7. Production stopped with the onset of the war in 1948. At theend of the war, the northern plant in Jordan was destroyed. The southernplant, near Sdomn, in Israel,9 was damaged and isolated since access to it hadbeen by sea from the northern plant (see Map 1). In 1952, after the share-holders of Palestine Potash Company Ltd. had been unable to secure financingto r-esume operations, the Government of Israel made a settlement with theshar-eholders and took over the assets in Israel, forming the Dead Sea WorksLtd. (DSW). Palestine Potash Co. Ltd. received 1.22 million shares (If, 1.0par value, Founders FIBI?) in the DSW plus I12 390,000 (If, 1.0 each) of 5% deben-tures due in Decem2ber 2002. The debentures were tied to the pound sterling.Palestine Potash Ltd. in turn distributed the debentures and 390,000 DSWshar-es to its shareholders.
8. ~The first years of reconstruction were difficult; large sums hadto be expended for non-productive purposes such as road construction, floodprotection, power supply, fresh water wells and housing. Changes in the potashmarkcet required developm~ent of a new refining process since the old plant coul-6not produce a product of the desired quality. In addition, considerable efforthad to be expended in re-entering the international markets. Lack of coordina-tioni of the work hampered the reconstruction unti'l 1955, when a new GeneralManager was appointed. Since 1955, the capacity of the plant has been tripled.
9. Potash production and sales have expanded rapidly since fiscal 1956/57, increasing from 41,000 tons in that year to 88,600 tons in 1957/58, 105,100tons in 1958/59, 115,000 tons in 1959/60 and 136.,000 tons in 1960/61.
10. Although. Palestine Potash had produced both potash and bromine, DSWset up a small wholly-owned bromine subsidiary which, in 19159/60, had a pro-duction of bromine and bromine compounds equivalent to 2,050 tons of elemen-tal bromine and in 1960/61, an equivalent of 2,900 tons of elemental bromine.
B. Owesi
11. On March 31,, 1961, DSW had outstanding 3,660,001 shares of 112 1.0par- value stock, denominated and held as follows:
Class Held bNI~umber Votel%
Fo-unders "Allf Government of Israel 1 51Fo-unders "B" Palestine Potash Co. Ltd. 830,000
Individuals (PPL Shareholders) 390, 000
1,220,000 16
Ordinary "All Solel Boneh 310,000Government of Israel 300.000
610,0008-j
Ordinary "B"t Government of Israel 610,000 81Ordlinary 'IC" Government of Israel 610,000Ordiinary I'D" Government of Israel 61,0
3,660,00C1
So-Lel Boneh is an Israeli construction company.

- 3 -
12. Each class of shares is entitled to the fixed percentage of thetotal votes, as shown above; within its class each share has one vote.
C. Financial Record
13. The DSW has been burdened with large investments in non-productivefacilities which were necessary for the company to start operations. Despitethe progress in eliminating operating problems and increasing production, theearnings record is poor. The financial requirements of the two companies havebeen met entirely from Government sources. With the present facilities, theprospects are that DSW would be able to cover only a modest interest rate onthe total debt to the Government.
14. Condensed comparative DSW income statements supplied by the companyand balance sheets are shown below (It 1000):
Year ended March 31, 1959 1960 1961
Net Sales 6,975 6,997 7,689Other Income 2L 114 833 2Total 6,999 7,111 8,522
Manufacturing Cost 3,741 3,853 3,558General Expense 903 665 690Depreciation 1,692 1,957 2,390
Operating Income 663 636 1,884
Interest:5% Debentures(due 2002) 98 98 98Government 123 - 1,050Other 141 204 42
Net Income 301 334 309
1/ Represents amount transferred from Contingency Reserve.2/ Interest on long-term Government loan for which
DSW did not charge any interest in its income accountsin previous years.
-4-
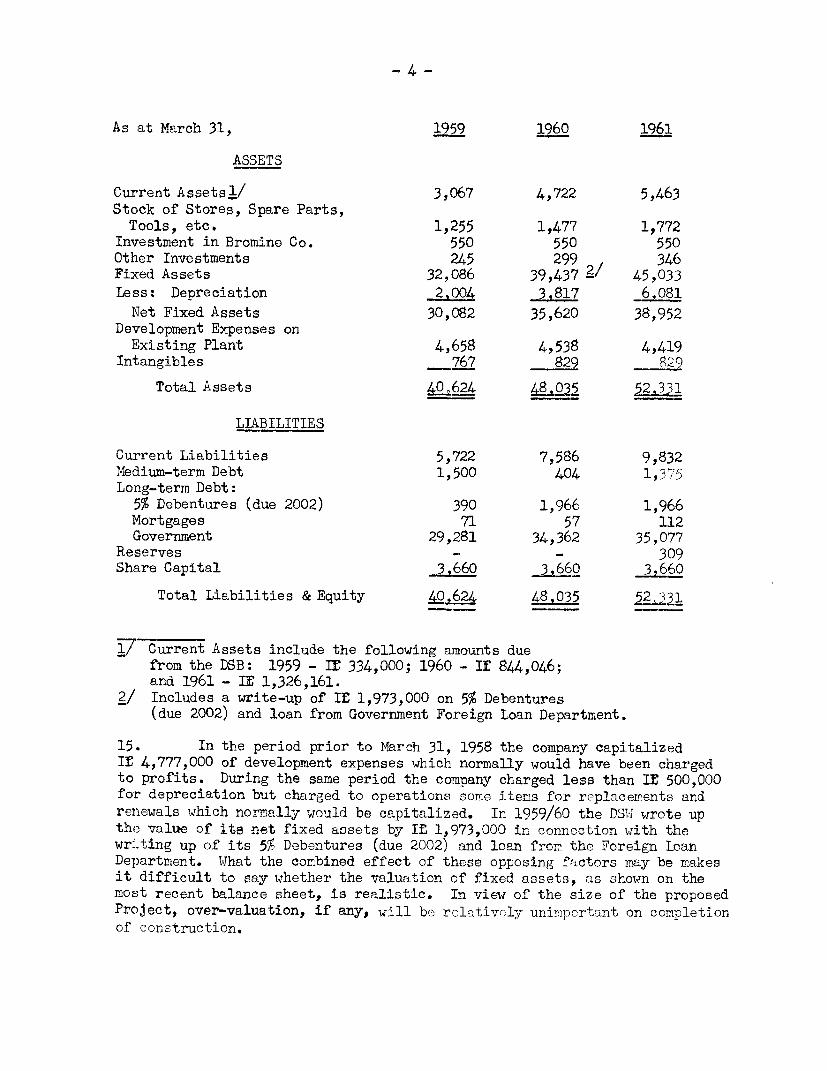
As at March 31, 1959 1960 1961
ASSETS
Current Assetsl/ 3,067 4,722 5,463Stock of Stores, Spare Parts,Tools, etc. 1,255 1,477 1,772
Investment in Bromine Co. 550 550 550Other Investments 245 299 346Fixed Assets 32,086 39,437 2/ 45,033Less: Depreciation 2,004 _63817 1
Net Fixed Assets 30,082 35,620 38,952Development Expenses onExisting Plant 4,658 4,538 4,419
Intangibles _ 767 829 529
Total Assets LO2624 48,035 331
LIABILITIES
Current Liabilities 5,722 7,586 9,832Medium-term Debt 1,500 404 1,375Lonig-term Debt:
5% Debentures (due 2002) 390 1,966 1,966Mortgages 71 57 112Government 29,281 34,362 35,077
Reserves - - 309Share Capital 3,660 3,660 3,660
Total Liabilities & Equity LOt624 48_035 5I L
71/Current Assets include the following amounts duefrom the DSB: 1959 - If 334,000; 1960 - If 844,046;and 1961 - IS 1,326,161.
2/ Includes a write-up of If 1,973,000 on 5% Debentures(due 2002) and loan from Government Foreign Loan Department.
15. In the period prior to March 31, 1958 the company capitalizedIf 4,777,000 of development expenses which normally would have been chargedto profits. During the same period the company charged less than IS 500,000for depreciation but charged to operations some items for replacerents andrenewals which normally would be capitalized. In 1959/60 the DSIi wrote upthe value of ite net fixed assets by IL 1,973,000 in connection with thewr.Lting up of its 5% Debentures (due 2002) and loan fror the Foreign LoanDepartment. What the combined effect of these opposing factors may be makesit difficult to say whether the valuation of fixed assets, as shown on themost recent balance sheet, is realistic. In view of the size of the proposedProject, over-valuation, if any, will be rclatively uninportant on completionof construction.
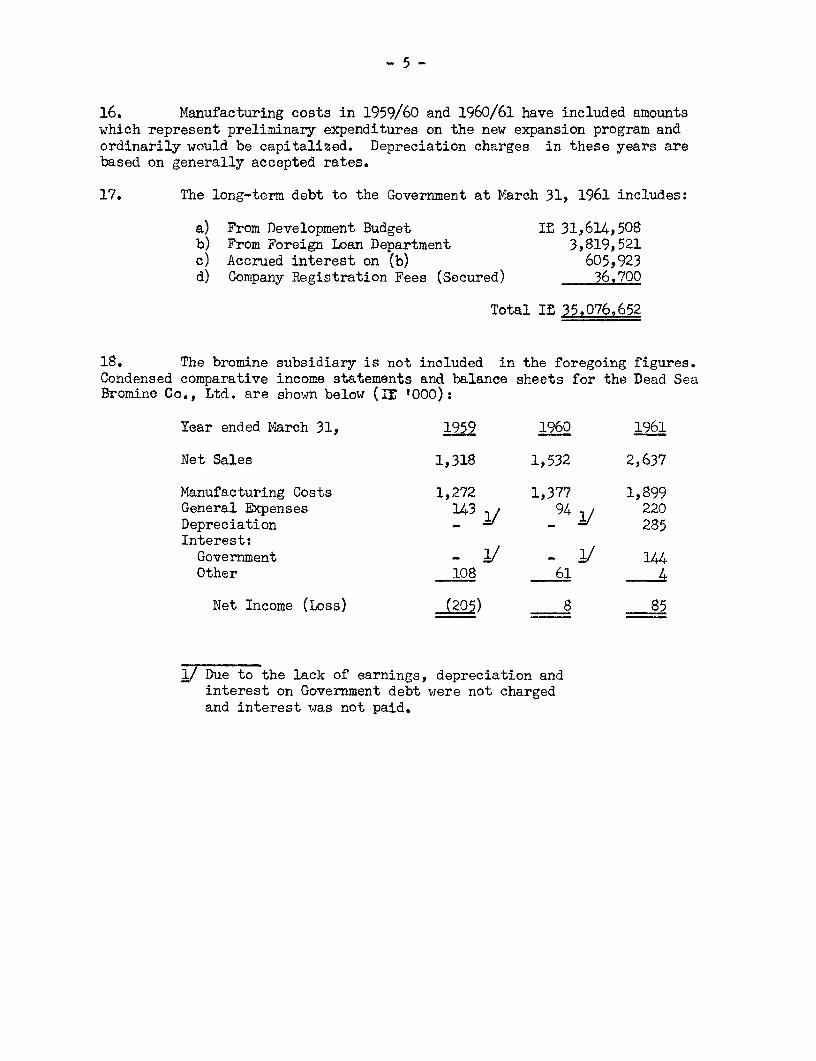
16. Manufacturing costs in 1959/60 and 1960/61 have included amountswhich represent preliminary expenditures on the new expansion program andordinarily would be capitalized. Depreciation charges in these years arebased on generally accepted rates.
17. The long-term debt to the Government at March 31, 1961 includes:
a) From Development Budget IS 31,614,508b) From Foreign Loan Department 3,819,521c) Accrued interest on (b) 605,923d) Company Registration Fees (Secured) 36,700
Total It 35.076,652
18. The bromine subsidiary is not included in the foregoing figures.Condensed comparative income statements and balance sheets for the Dead SeaBromine Co., Ltd. are shown below (IS '000):
Year ended March 31, 1959 1960 1961
Net Sales 1,318 1,532 2,637
Manufacturing Costs 1,272 1,377 1,899General Expenses 143 94 220Depreciation - - 285Interest:Government - / - / 144Other 108 61 4
Net Income (Loss) (205) 8 85
1/ Due to the lack of earnings, depreciation andinterest on Government debt were not chargedand interest was not paid.

-6-
As at March 31, 1959 1960 1961
ASSETS
Current Assets 1,041 870 1,137Stores, Spare Parts, etc. - 653 1,164Fixed Assets 3,298 3,559 4,398Less: Depreciation - - 285Net Fixed Assets 3,298 3,559 4,113
Intanigibles 313 772 868
Total Assets A.652 5,860 7.282
LIABILITIES
Current Liabilities 1,419 2,335 2,815Long-term Debt:Government 3,103 3,250 3,658Other - - 448Mortgages 16 12 12
Reserves (141) - -Capital (Paid in by DSW) 550 550 550Surplus (Loss) (295) (287) (201)
Total Liabilities and Equity 4.652 5____ 7,282
19. The accounts are audited by independent auditors, in accordance withIsraeli law.
D. Management and Staff
20. The DSW was fortunate in being able to rehire a number of key peoplewho had been with the old Palestine Potash Company. However, the rapid pro-gress in increasing production during the last few years has been due largelyto the organizational abilities of the Managing Director, General M. Makleff,who was appointed in 1955, and to his success in building up an outstandingtechnical staff, both for operations and research. Production facilities arenow operating smoothly and it appears that the difficult rehabilitation periodis over. The DSW has an aggressive sales policy. The present sales managerwas sales manager for Palestine Potash Co. Ltd. and is well acquainted withthe potash and bromine markets.
21. The management is capable and should be able to supervise the con-struction of the project and operate the expanded plant without difficulty.Additional top technical staff have been added in preparation for the projectbut the DSW intends to add senior staff to assist with long-range financialplanning.

III. THE PROJECT
A. General
22. The purpose of the proposed project is to increase the productionof potash and bromine from the Dead Sea brine and to add new facilities inorder to recover as by-products magnesia and table salt from a portion ofthe spent brine. The Dead Sea covers an area of about 880 sq. kms. and isabout 400 metres below sea level. The brine contains a number of salts:
Magnesium chloride - 130.0 gr. per litreSodium chloride - 87.0 " ? itCalcium chloride - 37.0 " t' "Potassium chloride - 11.5 " " "M4agnesium 'oromide - U " "Calcium sulfate - 1.0 " " "
It has been estimated that the Dead Sea contains two billion tons of potassiumchloride (potash).
23. The production of potash is divided into two main stages:
a) concentration of the brine in ponds by solar energyto precipitate first the sodium chloride and finallycarnallite. The carnallite is recovered by smallsuction dredgers and pumped to the refinery for finalprocessing;
b) at the refinery, decomposition of the carnallite resultsin the co-precipitation of sodium chloride and potassiumchloride. The mixture is being separated by flotationin the present plant but another method, the hot leachand crystallization process, is to be adopted for theproject.
24. From the spent carnallite brines, DSW plans to recover increasedamounts of bromine, to increase the production of bromine compounds and toinitiate production of dead burned magnesia and table salt.
B. Concession
25. As noted in para. 5, Palestine Potash Company, Ltd. had a concessionfor the production of potash and other products from the Dead Sea. A royaltyof about 5% of the fob plant sales prices were paid to the Palestine andJordanian Governments until production was stopped by war. However, the DSWhas been operating without a concession and to date has not made any royaltypayments to the Government.
- 8 -
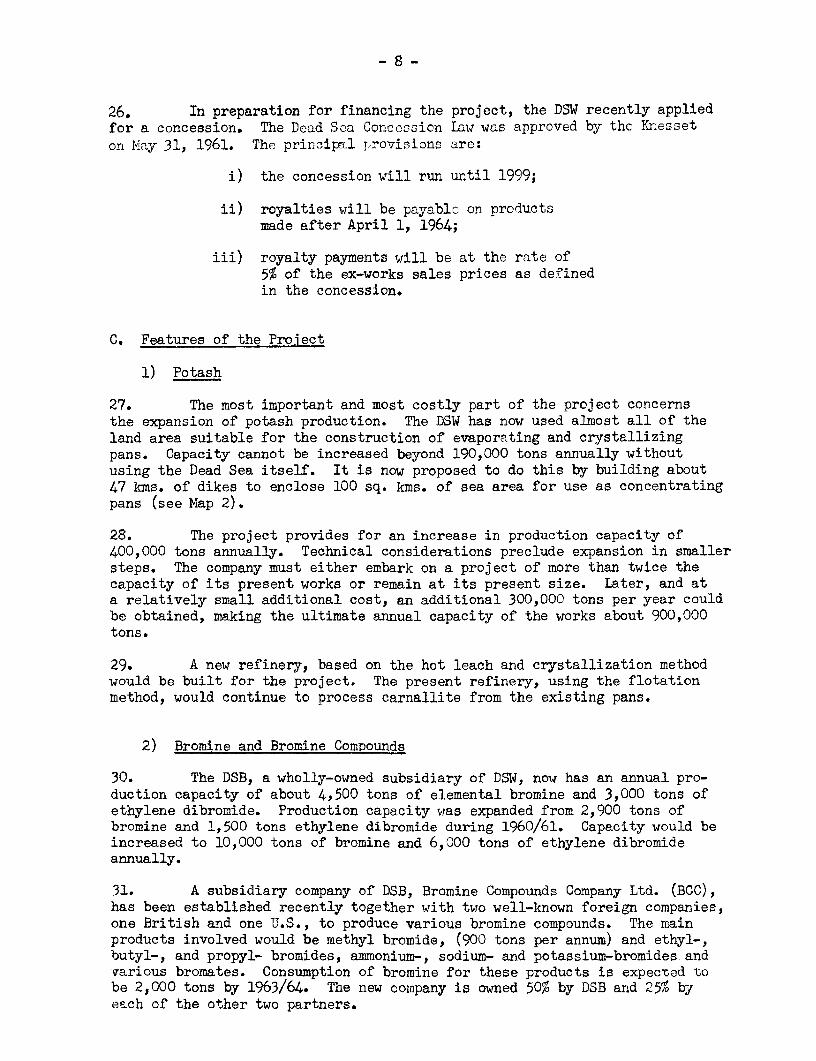
26. In preparation for financing the project, the DSW recently appliedfor a concession. The Dead Sca Concossion Law was approved by the Kr.esseton Hiay 31, 1961. The principal provisions are:
i) the concession will run until 1999;
ii) royalties will be payablc on productsmade after April 1, 1964;
iii) royalty payments will be at the rate of5% of the ex-works sales prices as definedin the concession.
C. Features of the Project
1) Potash
27. The most important and most costly part of the project concernsthe expansion of potash production. The DSW has now used almost all of thelandl area suitable for the construction of evaporating and crystallizingpans. Capacity cannot be increased beyond 190,000 tons annually withoutusing the Dead Sea itself. It is now proposed to do this by building about47 1ms. of dikes to enclose 100 sq. kms. of sea area for use as concentratingpans (see Map 2).
28. The project provides for an increase in production capacity of400,000 tons annually. Technical considerations preclude expansion in smallersteps. The company must either embark on a project of more than twice thecapacity of its present works or remain at its present size. Later, and ata relatively small additional cost, an additional 300,000 tons per year couldbe obtained, making the ultimate annual capacity of the works about 900,000tons.
29. A new refinery, based on the hot leach and crystallization methodwould be built for the project. The present refinery, using the flotationmethod, would continue to process carnallite from the existing pans.
2) Bromine and Bromine Compounds
30. The DSB, a wholly-owned subsidiary of DSW, now has an annual pro-duction capacity of about 4,500 tons of elemental bromine and 3,000 tons ofethylene dibromide. Production capacity was expanded from 2,900 tons ofbromine and 1,500 tons ethylene dibromide during 1960/61. Capacity would beincreased to 10,000 tons of bromine and 6,000 tons of ethylene dibromideannually.
31. A subsidiary company of DSB, Bromine Compounds Company Ltd. (BCC),has been established recently together with two well-known foreign companies,one British and one U.S., to produce various bromine compounds. The mainproducts involved would be methyl bromide, (900 tons per annum) and ethyl-,butyl-, and propyl- bromides, ammonium-, sodium- and potassium-bromides andvarious bromates. Consumption of bromine for these products is expected tobe 2,000 tons by 1963/64. The new company is owned 50% by DSB and 25% byeach of the other two partners.
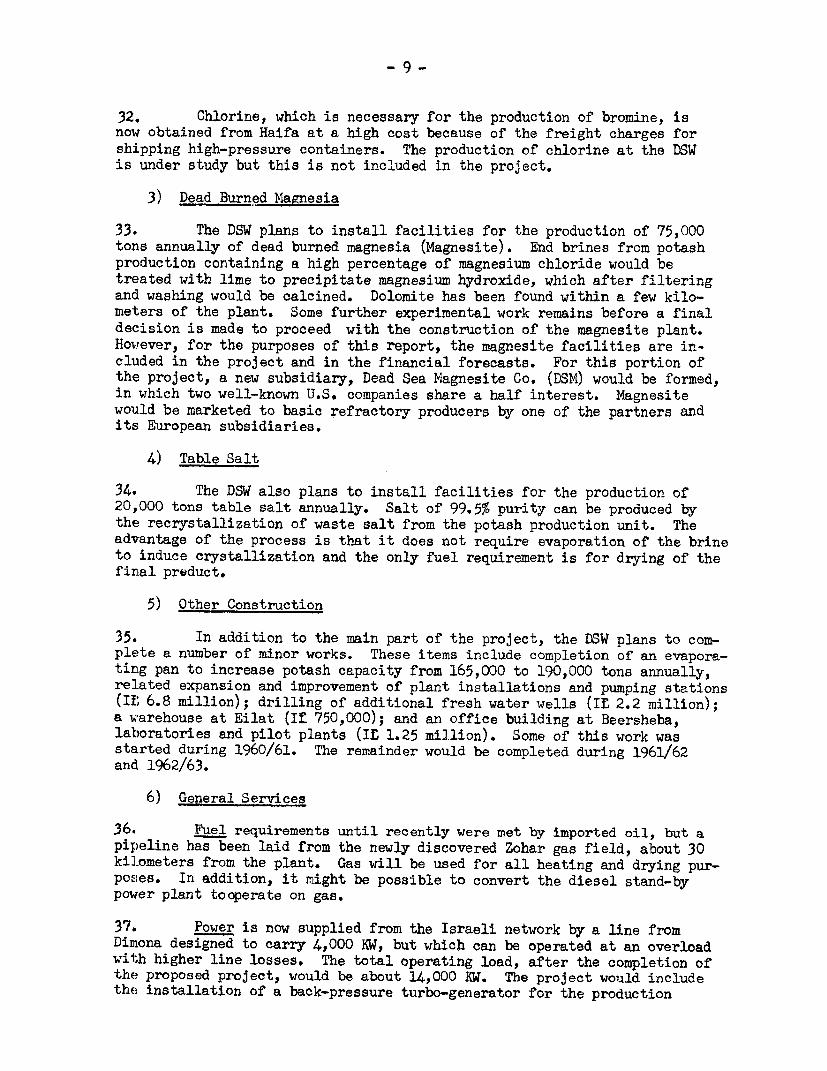
32. Chlorine, which is necessary for the production of bromine, isnow obtained from Haifa at a high cost because of the freight charges forshipping high-pressure containers. The production of chlorine at the DSWis under study but this is not included in the project.
3) Dead Burned Magnesia
33. The DSW plans to install facilities for the production of 75,000tons annually of dead burned magnesia (Magnesite). End brines from potashproduction containing a high percentage of magnesium chloride would betreated with lime to precipitate magnesium hydroxide, which after filteringand washing would be calcined. Dolomite has been found within a few kilo-meters of the plant. Some further experimental work remains before a finaldecision is made to proceed with the construction of the magnesite plant.However, for the purposes of this report, the magnesite facilities are in-cluded in the project and in the financial forecasts. For this portion ofthe project, a new subsidiary, Dead Sea Magnesite Co. (DSM) would be formed,in which two well-known U.S. companies share a half interest. Magnesitewould be marketed to basic refractory producers by one of the partners andits European subsidiaries.
4) Table Salt
34. The DSW also plans to install facilities for the production of20,000 tons table salt annually. Salt of 99.5% purity can be produced bythe! recrystallization of waste salt from the potash production unit. Theadvantage of the process is that it does not require evaporation of the brineto induce crystallization and the only fuel requirement is for drying of thefinal preduct.
5) Other Construction
35. In addition to the main part of the project, the DSW plans to com-plete a number of minor works. These items include completion of an evapora-ting pan to increase potash capacity from 165,000 to 190,000 tons annually,related expansion and improvement of plant installations and pumping stations(If 6.8 million); drilling of additional fresh water wells (It 2.2 million);a warehouse at Eilat (If 750,000); and an office building at Beersheba,laboratories and pilot plants (IL 1.25 million). Some of this work wasstarted during 1960/61. The remainder would be completed during 1961/62andL 1962/63.
6) General Services
36. Fuel requirements until recently were met by imported oil, but apipeline has been laid from the newly discovered Zohar gas field, about 30kilometers from the plant. Gas will be used for all heating and drying pur-poses. In addition, it might be possible to convert the diesel stand-bypower plant tooperate on gas.
37. Power is now supplied from the Israeli network by a line fromDimona designed to carry 4,000 KW, but which can be operated at an overloadwith higher line losses. The total operating load, after the completion ofthe proposed project, would be about 14,000 KW. The project would includethe installation of a back-pressure turbo-generator for the production
- 10 -
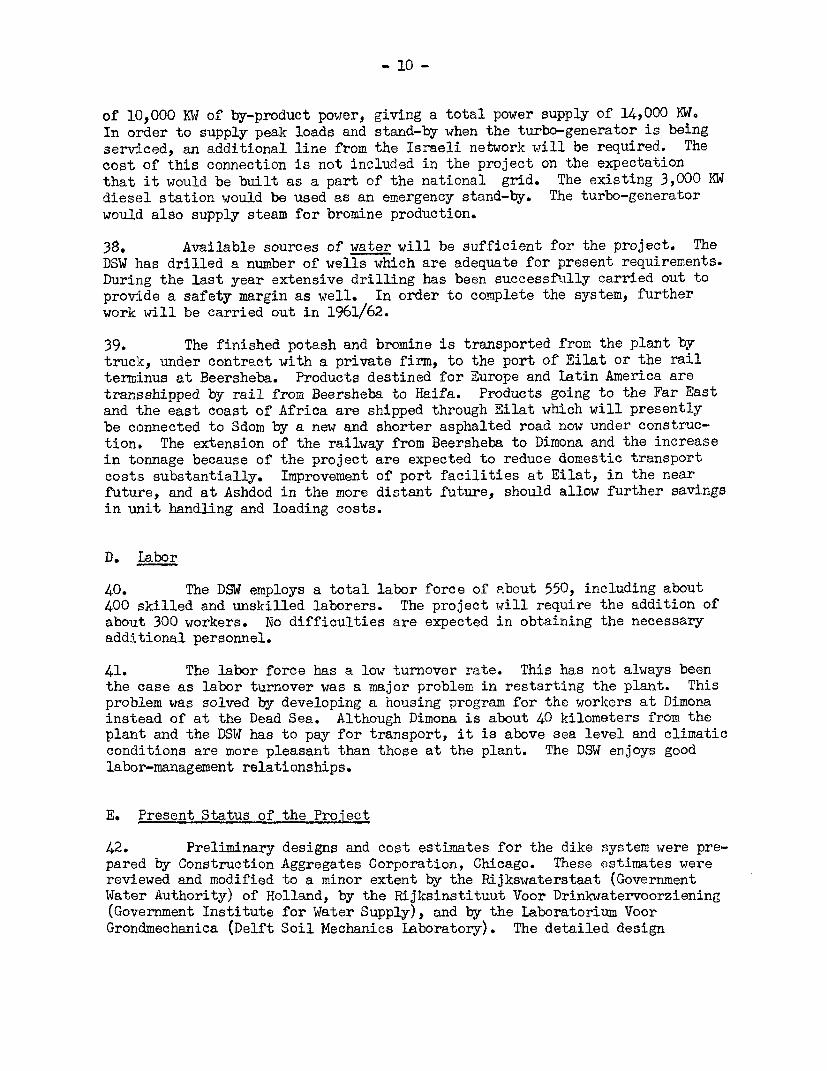
of 10,000 KW of by-product power, giving a total power supply of 14,000 KW.In order to supply peak loads and stand-by when the turbo-generator is beingserviced, an additional line from the Israeli network will be required. Thecost of this connection is not included in the project on the expectationthat it would be built as a part of the national grid. The existing 3,000 KWdiesel station would be used as an emergency stand-by. The turbo-generatorwould also supply steam for bromine production.
38. Available sources of water will be sufficient for the project. TheDSW has drilled a number of wells which are adequate for present requirements.During the last year extensive drilling has been successfully carried out toprovide a safety margin as well. In order to complete the system, furtherwork will be carried out in 1961/62.
39. The finished potash and bromine is transported from the plant bytruck, under contract with a private firm, to the port of Eilat or the railterminus at Beersheba. Products destined for Europe and Latin America aretransshipped by rail from Beersheba to Haifa. Products going to the Far Eastand the east coast of Africa are shipped through Eilat which will presentlybe connected to Sdom by a new and shorter asphalted road now under construc-tion. The extension of the railway from Beersheba to Dimona and the increasein tonnage because of the project are expected to reduce domestic transportcosts substantially. Improvement of port facilities at Eilat, in the nearfuture, and at Ashdod in the more distant future, should allow further savingsin unit handling and loading costs.
D. Labor
40. The DSW employs a total labor force of about 550, including about400 skilled and unskilled laborers. The project will require the addition ofabout 300 workers. No difficulties are expected in obtaining the necessaryadditional personnel.
41. The labor force has a low turnover rate. This has not always beenthe case as labor turnover was a major problem in restarting the plant. Thisproblem was solved by developing a housing program for the workers at Dimonainstead of at the Dead Sea. Although Dimona is about 40 kilometers from theplant and the DSW has to pay for transport, it is above sea level and climaticconditions are more pleasant than those at the plant. The DSW enjoys goodlabor-management relationships.
E. Present Status of the Project
42. Preliminary designs and cost estimates for the dike system were pre-pared by Construction Aggregates Corporation, Chicago. These estimates werereviewed and modified to a minor extent by the Rijkswaterstaat (GovernmentWater Authority) of Holland, by the Rijksinstituut Voor Drinkwatervoorziening(Government Institute for Water Supply), and by the Laboratorium VoorGrondmechanica (Delft Soil Mechanics Laboratory). The detailed design

- 11 -
and specifications of the dike system are being prepared by J. van Hasselt ende Koning Engineering Co., Holland. This company is also preparing all docu-men-ts necessary for international bidding and would supervise construction.It is expected that bids for the dike system would be called about August1961 in order that construction could start by the end of 1961.
43. Designs and cost estimates for the potash refinery were preparedby -the Stearns-Roger Corporation, Denver. This company is now in the laststage of preparing the detailed engineering estimates for this plant, whichare expected to be ready by mid June 1961. Stearns-Roger also will preparethe detailed designs and specifications and will supervise construction.Designs and estimates for the by-product facilities have been prepared bycompany engineers with the assistance of Pfaudler Co., Rochester, for thebromine expansion, F. W. Berk & Co. for the bromides production and ofHarbison-Walker Refractories Company and Stearns-Roger for the magnesiteproject.
44. The arrangements for engineering and construction supervision aresatisfactory.
F. Construction Cost Estimates
45. The estimated investment cost of the project is as follows (IfS '000equivalent):
Foreign LocalExchange Currency Total
Potash:Pans 27,350 21,408 48,758Refinery 16.370 10.919 27,289Sub-total Potash 43,720 32,327 76,047
Table Salt 230 406 636Bromine and Derivatives 2,240 1,690 3,930
Sub-total 46,190 34,423 80,613
Other Construction 5,500 5,500 11,000SteLrt-up Expenses - 226 226Working Capital 2,410 13,407 15,817Int;erest during Construction 9,788 - 9,78
,ub-total 63,888 53,556 117,444
Investment in B.C.C. - 540 540Investment in D.S.M. 7,110 4.590 11,700
Total 70,998 58,686 229%684
Total - $ '000 Equivalent 39,443 32,603 72,046

- 12 -
46. The estimate of the civil works for the evaporating pans isbased on extensive field data and engineering designs as stated above.Detailed construction drawings are expected to be ready by the beginningof July, 1961. The estimate for the refinery is based on U.S. prices cur-rent in Yarch, 1961. Stearns-Roger have designed several similar plantsin the United States during the last few years. Purchase of the equipmentin. Europe might reduce the refinery cost somewhat. Detailed designs forthe bromine expansion and salt plant are completed. Detailed designsfor the magnesite plant have not been started although the present esti-mates have been made on a sound basis. The company has only recentlycompleted bromine and ethylene dibromide facilities, thus the cost ofthese is known. All the estimates contain at least a 10% contingencyallowance, some contain 15%--20%. The total. allowance should be adequateto cover physical contingencies and reasonable increases in cost levelsduring the construction period.
47. On the basis of the work completed, an amount of IL 129.7 million(;,72.0 million equivalent) is a realistic estimate of the cost of the pro-ject, including working capital and interest capitalized during construction.
48. It is planned, in the future, to expand potash production byan additional 300,000 tons per year with an incremental investment of$]33-$15 million equivalent; a cost of about $50 per annual ton comparedto about 105 per annual ton for the present project.
G. Construction Schedule
49. The construction time of the dikes and pans is estimated at42 months; the refinery at 36 months. This schedule includes time forthe import and assembly of necessary heavy construction equipment forthe dikes. The plant will be operated before final completion of thedike system, to utilize raw material produced at intermediate stages,during the construction period. The DSW wishes to let contracts byNovember 1961 to assure that the pans will be ready for operation in April1965, at the beginning of an evaporation season.
5C). The bromine and ethylene dibromide plants are expected to becompleted by December 1961, and the bromine compounds plant by April 1962.The magnesite plant is expected to be completed by October 1963.
H. Procurement
5-L. The DSW intends to procure goods and services on an internationalcompetitive basis to the fullest practicable extent. Invitations to bid oncertain chemical process equipment may be limited necessarily to manufacturersw:Lth specialized experience.

- 13 -
IV. MARKETS AND MARKETING
A. The Market for Potash
52. Potash is one of the three major chemical fertilizer materials.Although it ranks behind phosphates and nitrogen in quantity consumed, itsconsumption has increased more rapidly than that of phosphates and only alittle less rapidly than that of nitrogen in the last 20 years. Sustainedhigh crop yields require properly balanced application of all three ferti-lizer materials; increased consumption of one has been accompanied orfollowed by increased consumption of the other two.
53. Consumption of potash in countries outside the Soviet Bloc amountedto about 6 million tons K20 in 1958/59.1 On the basis of reasonably conser-vative assumptions, it is estimated that it could reach 8.7 million tons K20by 1966/67 when the Dead Sea project is expected to be in full operation.This assumes a lower rate of growth than has occurred in recent years, exceptin India. The Third Five Year Plan calls for a very substantial increase infertilizer consumption, and although it seems unlikely that the targets willbe reached, it is assumed that the planned levels will be approached.
54., Potash is produced in a small number of countries: in 1958/59 5.5million tons K20 out of total world output estimated at 8.3 million tons K20were accounted for by West Germany, France, Spain and the United States and2.6 million tons by the U.S.S.R. and East Germany. This has facilitated atight control over marketing which has survived the disappearance in thesecond World War of an organized international syndicate.
55. It is estimated that by 1966/67, production capacity in the coun-tries outside the Soviet Bloc could amount to 8.4-9.1 million tons K20. Thistakes account of additions to capacity in Western Europe and the U.S. to 1960,and of the following further additions: 600,000-1.2 million tons K20 inCanada; two mines with a capacity of 600,000 tons K20 whose completion hasbeen long delayed by water problems are now expected to be completed by 1962.If it develops that the cost of sinking water-free shafts is not unreasonablyhigrh and demand justifies it, additional projects may bring Canadian produc-tion to the higher figure by 1966/67; 700,000 tons in the United States, froma new large mine being developed by Texas Gulf Sulphur at Moab, Utah and twosmaller projects nearing completion. It is assumed that any further expansionwould be balanced by cutbacks at Carlsbad where a reduction in production isneeded to extend the useful life of the area; 200-300,000 tons K20 in Sicil:from three projects being financed by the IBRD; 250-350,000 tons K20 in WestGer t France and Spain; and 280,000 tons K20 in Israel. Because of thelimited number of potash producers and their past record of concern fororderly marketing, expansions other than those already firmly planned seemsunlikely, unless justified by demand. The assumption of expansion in WesternEurope, outside of Sicily, is not based on firm plans, but the Western
1/ In previous paragraphs, tonnage figures have referredto potash or potassium chloride. In this section, thedata refers to K20 content. Potash materials vary inK20 content but DSW potash contains about 60-62% K20.

- 14 -
European producers may make such modest expansions as has been assumed tokeep abreast of rising Western European demand. The Soviet Bloc has plansfor a substantial increase in capacity but there is no way of appraisingtheir realism. In any case, there is room for considerable expansion ofconsumption by the Soviet Bloc's lagging agriculture. It is assumed, there-fore, that Soviet Bloc exports to other countries will remain urchanged.
56. As a result of the large planned expansion in North America, itsexportable surplus will grow. Until now, U.S. exports have gone mainly toCanada, Latin America, Japan and other Far Eastern countries, South Africaand Oceania. It may be expected that U.S. exports to these markets willgrow both as a result of growth in their demand and at the expense of theWestern European exporters. Western Europe's exportable surplus will remainat best unchanged and the Western European producers will be able to continueexporting on the present scale only if Western Europe continues its presentimports from the Soviet Bloc and, to a minor extent, Israel. Western Europeanproducers may choose to permit their exports to Latin America, Japan and otherFar Eastern countries, South Africa and Oceania to decline in order to keepstep with growing demand in their present profitable market on the east coastof the United States. Even in that case, there may be room for additionalexports from Israel to Western Europe. Israel's exports to Italy, now itslargest market in Western Europe, are likely to decline once Italian produc-tion is established, but Israel has also established markets in the UnitedKingdom, the Netherlands and Sweden. In the growing markets of Asia, outsideof the Far East, Africa, other than South Africa, it would have a decidedfreight advantage over the U.S. as well as Western Europe, which, in any case,would have only limited quantities for sale.
57. After declining from 1951 to 1959, the price of U.S. potash wasincreased by 3¢ per unit for the 1959/60 season (from 34.50 to 37.50 per unitof K20 for standard muriate in bulk at Carlsbad).1/ A further increase of20 per unit K20 has been annQunced for the 1960/61 season by several leadingproducers, but it is not yet certain that this increase will become general.U.S. export prices firmed last year; the U.S. producers are reported to haveasked for and obtained a price equivalent to the domestic price for the firsttime in several years. Although these price increases were attributable tothe improvement in the market situation, it seems unlikely that prices willfall below the level reached prior to the recent increases. Real prices ofU.S'. potash declined from 1951 to 1959 and even after the increase proposedfor 1960/61 would be below the 1957 level. Even in Canada, the cost ofbringing in new capacity could preclude any further decline. The DSW hasbased its forecasts on a price of $33 per ton of fertilizer fob Israeli portfor the next few years declining to $30 thereafter. The current price isabove $33. The company's estimate is consistent with the conclusions of theBanik's study and has been accepted as the basis for the financial forecasts.A more detailed analysis of the market and price prospects is contained inAnnex 2.
/ One unit equals 1% of K20 contained in one tonof potash. One tor of potash with a K20 contentof 60% contains 60 units.

- 15 -
B. The Market for Bromine and Bromine Compounds
58. The DSB expects to produce 10,000 tons of bromine of which it plansto sell some 2,400 tons as elemental bromine for export, 2,000 tons to theBroraine Compounds Co. Ltd. and to use the balance to produce ethylene dlbro-mide. Proposed sales of eler-ental bromine are o4ly slightly greater than pre-sent sales. At present the DSB supplies about 80% o-5 the bromine imported intoEurope and it should be able to retain this share. Western Germany and Franceare the only European producers exporting small quantities of bromine. Thedemand for Israeli bromine is very strong at present.
59. Of the production of 6,000 tons of ethylene dibromide (EDB), allbut about 200 tons annually would be exported. The DSB has long-term contractswith European consumers for the sale of the bulk of its output.
60. EDB is used mainly as a gasoline additive along with tetraethyllead.Although consumption has declined in the United States in the past few years,as Et result of changes in refining techniques and the introduction of jet air-craft on a large scale, in Europe and Asia where DSB will be selling most ofits output, the growth of demand for gasoline, coupled with an expected im-provrement in quality, should result in an increase in the now small EDB con-sumption. EDB is also used as a crop fumigant and insecticide although thetoxicity of the residue limits its application on certain crops. In view ofthe relatively small tonnage of EDB to be produced, the DSB should be able todispose of its output at a reasonable price.
61. In addition to EDB, the DSB expects to produce some 600 tons, of1p 2, Dibromo-3 - Chloro Propane, a fumigant and insecticide which is lesstoxic than Methyl Bromide. Methyl Bromide to be produced by Bromine CompoundsCo. Ltd. is a grain and soil fumigant and insecticide with a low toxicity.Methyl Bromide has been particularly effective in the fumigation of tobaccoseed beds and as a coffee insecticide and the DSB has been quite active indeveloping the African markets for the bromine compounds. The other brominecompounds to be produced are intended for use in the pharmaceutical, photo-graphical and textile and other industries.
C. Table Salt
62. The DSW expects to sell 20,000 tons of refined salt to the Africanmarket. This market is now supplied by high-cost imports or poor qualitylocal production. The company has made an extensive study of the market fortable salt and is considering the possibility of setting up a packaging plantwith local capital in West Africa.
D. Magnesite
63. Magnesia or synthetic magnesite is widely used to make high tempera-ture refractories for the metallurgical industries. The DSW has reached anagreement that the total production of the plant would be sold through S.A.Des Minerais, Luxembourg, a subsidiary of the Continental Ore Corporation,New York.
- 16 -
E. Marketing
64. Aside from the long-term sales agreements under consideration forEDB and magnesite, sales of potash, bromine and bromine compounds are madeon an annual and, in some cases, a spot basis. The company has had no diffi-culty in selling all of the potash and bromine it has been able to produce.The company also offers technical services to its customers.
65. Lack of adequate supplies of potash has prevented the developmentof the Asian and African markets but as production increases the DSW willconcentrate on the development of its natural market area in these locations.

- 17 -
V. FINANCING PLAN AND FINANCIAL PROSPECTS
A. General
66. The DSW is now operating smoothly and the expansion plans are sound,from both the technical and market aspects. However, because of the magnitudeof the project, the DSW cannot generate all the necessary funds and it mustlook to outside financial assistance. It has been apparent from the first thata financial reorganization of the DSW would be required to establish a financialstructure which would permit the company to raise new equity and loan funds.
67. The Government of Israel, as the controlling shareholder with 79.8%of the voting power and holding over 98% of the long-term debt, would be mostaffected by any reorganization. Although the DSW has been able to operatewithout undue Government interference in operations, it nevertheless had tobe considered as a Government-owned organization. A basic objective has beento turn the company back to private control and, during the past year, many ofthe discussions have centered on how this objective could best be accomplished.One particular problem, in order to prepare for raising new private equityfunds, was the treatment of the oustanding debt to the Government.
68. The Government has agreed with the Bank that it would not hold morethan 45% of the shares and that it would not have more than 35% of the votingrights. Government shares in excess of 35% of the total outstanding would beheld by a Trustee and would have voting rights only when sold to private in-vestors. The Government has stated its policy to encourage private investmentin industry. In line with this policy, the Government, in the future, couldconsider selling some of its shares to private investors.
69. One other major problem concerned the terms of the public share issuein Israel. The share issue of If, 27.0 million is large in relation to theIsraeli market. Therefore, on the advice of the underwriters, it was agreedthat the new shares should bear a fixed rate of interest (5%) during the con-struction period.
70. Within this framework it was then possible to work out a detailedplan for the recapitalization of the company.
B. Proposed Capital Structure
71. Agreement has been reached among the interested parties on the detailsof the plan and the company has taken necessary steps to amend its Articles ofAssociation. The essential features of the plan are outlined below:
- 18 -
1) The Dead Sea Bromine Co. will remain a wholly-ownedsubsidiary of DSW;
2) The Bromine Compounds Company has been organized andthe Dead Sea Magnesite Co. will be organized in which theDSB and DSW will own 50<- of the share capital respectively;
3) The DSW is increasing its share capital from IL 3,660,001to It 57.6 million, composed of It 30.6 million "A" sharesand IS 27.0 million Ordinary shares. All present classesof shares are to be converted to "A" shares;
4) The DSB debt of IL 3,641,096 to the Government has beentransferred to the DSW. The combined debt of the DSWand DSB to the Government of Israel amounted to IL 38,717,748as at March 31, 1961. This is being converted intoIL 26,939,999 of "A" shares and IS 11,777,749 of JuniorDebentures (see tab'le on following page);
5) Non-government shareholders had certain pre-emptive rights.In order to obtain agreement to a public issue, privateholders of Founders "B" and Ordinary "A" shares were offeredand have accepted to receive from the Government certain ofits "A" shares and Junior Debentures obtained from the debtconversion above. Founders "B" shareholders will receiveIt 2.806 million "A" shares and It 610,000 Junior Debentures;Ordinary "A" shareholders It 344,000 of "A" shares andIt 360,000 Junior Debentures. Total share holdings willincrease from If 1.220 million to IL 4.026 million and fromIf 310,000 to It 654,000 for the Fcunders "B" and Ordinary"A" shareholders, respectively (see table on following page);
6) The IE 27.0 million Ordinary shares are to be sold by apublic issue in Israel to yield not less than par to DSW.The issue is to be underwritten by a consortium of Israelibanks under the leadership of Bank Leumi Le Israel Ltd. andis to be sold only to private investors, including institu-tional investors other than Government pension funds. Inorder to make possible the sale of such a large issue inIsrael the company will pay 5% interest on the Ordinaryshares until the end of the construction period but notlater than March 31, 1965;
7) The payment of interest at 5% and principal on the JuniorDebentures is subordinate to existing secured loans and tothe new foreign loans to be contracted for the project.Redemption of the debentures would start September 30, 1971and would be in 10 equal annual instalments;
- 19 -
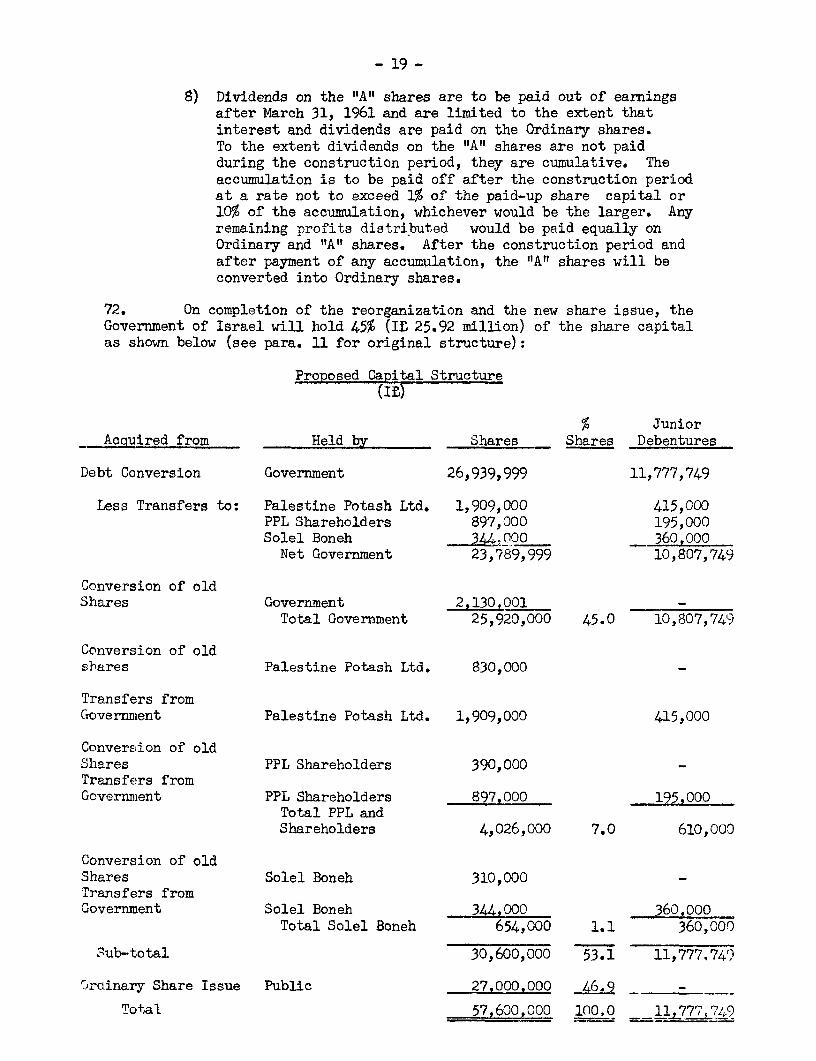
8) Dividends on the "A" shares are to be paid out of earningsafter March 31, 1961 and are limited to the extent thatinterest and dividends are paid on the Ordinary shares.To the extent dividends on the "A" shares are not paidduring the construction period, they are cumulative. Theaccumulation is to be paid off after the construction periodat a rate not to exceed 1% of the paid-up share capital or10% of the accumulation, whichever would be the larger. Anyremaining profits distributed would be paid equally onOrdinary and "All shares. After the construction period andafter payment of any accumulation, the "A" shares will beconverted into Ordinary shares.
72. On completion of the reorganization and the new share issue, theGovernment of Israel will hold 45% (IL 25.92 million) of the share capitalas shown below (see para. 11 for original structure):
Proposed Capital Structure(IS)
% Junior_Acquired from Held by Shares Shares Debentures
Debt Conversion Government 26,939,999 11,777,749
Less Transfers to: Palestine Potash Ltd. 1,909,000 415,000PPL Shareholders 897,000 195,000Solel Boneh 344,000 360,000Net Government 23,789,999 10,807,749
Conversion of oldShares Government 2,130,001- -
Total Government 25,920,000 45.0 10,807,749
Conversion of oldshares Palestine Potash Ltd. 830,000 -
Transfers fromGovernment Palestine Potash Ltd. 1,909,000 415,000
Conversion of oldShares PPL Shareholders 390,000 -TransfeXrs fromGovernment PPL Shareholders 897,000 195,000
Total PPL andShareholders 4,026,000 7.0 610,000
Conversion of oldShares Solel Boneh 310,000Transfers fromGovernment Solel Boneh 344,000 360,000
Total Solel Boneh 654,000 1.1 360,000
sub-t;otal 30,600,000 53.1 11,777.749
Cirainary Share Issue Public 27.000,000 46.9 -
Total 57 600 000 100,0 11L77§49

- 20 -
C. Organization and Management
73. The DSW will now have 15 directors, 14 elected by the shareholdersplus the General Manager. Five directors would be appointed by the Governmentso long as it holds 35% of the shares. In the past the Chairman has beenappointed by the Government but) in the future, he would be elected by theBoard of Directors. This change is not expected to bring about any changein the plant nanagenent (see para. 20).
D. Financing Plan
74. Financial projections are attached showing the expected incoreof the company (Annex 3), the cash flow (Annex 4) and the balance sheets(Annex 5) for the construction period and the first five years of operations.The assumptions on which these forecasts are based are listed in Annex 6.
75. The estimated cost of the Project is IS 129.7 million ($72.0 mil-lion equivalent) (see para. 45). This includes interest capitalized duringthe construction period, working capital for the Project and existing opera-tions. During the construction period, the DSW would also spend IL 2.0 mil-lion for equipment replacement and renewals and It 5.06 million for intereston the new Ordinary shares. At the beginning of the construction period thecompany would also reduce its short and medium-term loans by If, 5.9 million,most of which were contracted in 1960 to start construction on certain por-tions of the Project. Thus, for the construction period, the total financialrequirements would be:
$ '000IS '000 Equivalent
Project 129,684 72,047Replacements and Renewals 2,000 1,111Interest on Ordinary Shares 5,063 2,813Amortization of Mortgages 22 12Reduction of Short and Medium-term Debt 5,900 3,278
Total 142,669 79,261
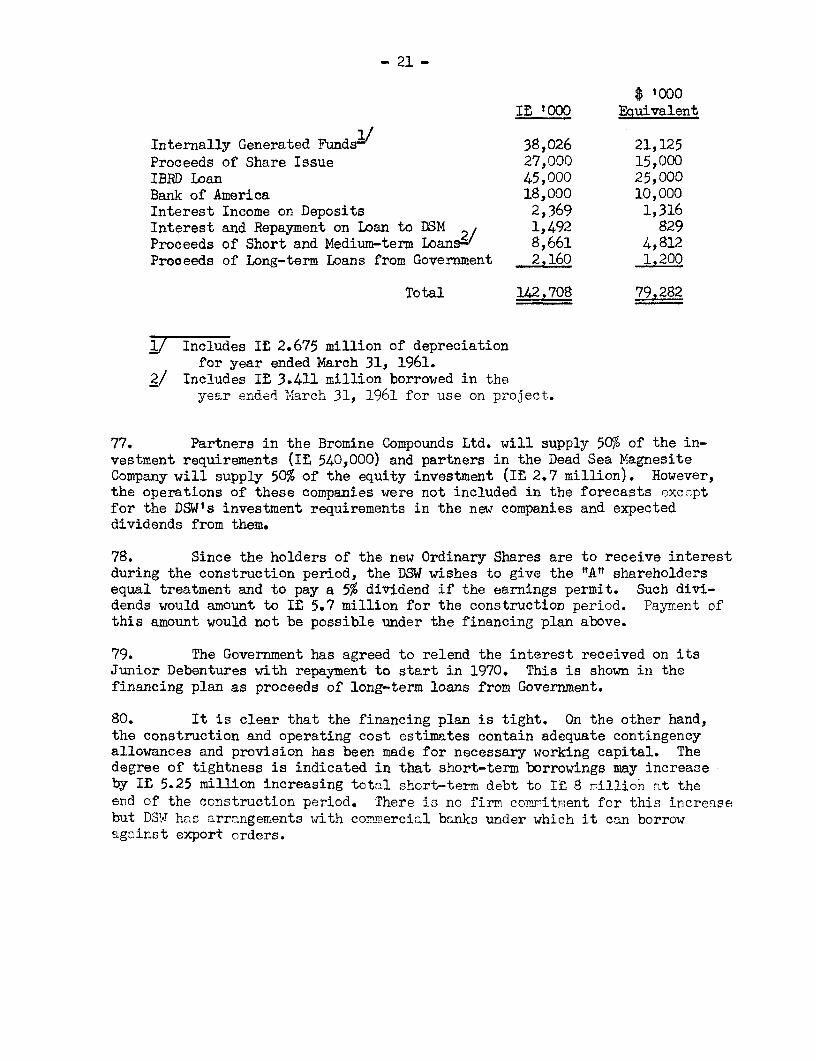
76. Against these requirements, it has been assumed the following re-sources would be available during the construction period:
- 21 -
$ 1000IL 1000 Equivalent
Internally Generated Fundsa/ 38,026 21,125Proceeds of Share Issue 27,000 15,000IBRD Loan 45,000 25,000Bank of America 18,000 10,000Interest Income on Deposits 2,369 1,316Interest and Repayment on Loan to DSM 1,492 829Proceeds of Short and Medium-term Loansa/ 8,661 4,812Proceeds of Long-term Loans from Government 2,160 1,200
Total 142,708 79,282
2/ Includes IL 2.675 million of depreciationfor year ended March 31, 1961.
2/ Includes It 3.411 million borrowed in theyear ended March 31, 1961 for use on project.
77. Partners in the Bromine Compounds Ltd. will supply 50% of the in-vestment requirements (IL 540,000) and partners in the Dead Sea MagnesiteCompany will supply 50% of the equity investment (IE 2.7 million). However,the operations of these companies were not included in the forecasts excoptfor the DSW's investment requirements in the new companies and expecteddividends from them.
78. Since the holders of the new Ordinary Shares are to receive interestduring the construction period, the DSW wishes to give the "A" shareholdersequal treatment and to pay a 5% dividend if the earnings permit. Such divi-dends would amount to In 5.7 million for the construction period. Payment ofthis amount would not be possible under the financing plan above.
79. The Government has agreed to relend the interest received on itsJunior Debentures with repayment to start in 1970. This is shown in thefinancing plan as proceeds of long-term loans from Government.
80. It is clear that the financing plan is tight. On the other hand,the construction and operating cost estimates contain adequate contingencyallowances and provision has been made for necessary working capital. Thedegree of tightness is indicated in that short-term borrowings may increaseby IE 5.25 million increasing total short-term debt to IE 8 rillion at theend of the construction period. There is no firm conritment for this increasebut DSW has arrangements with commercial banks under which it can borrowagainst export orders.

- 22 -
E. Financial Prospects
81. Sales during the construction period from the present plant havebeena assumed at prices somewhat below current prices. Sales from the newplant, and for total sales after 1966, have been assumed at prices about13% below current prices. Production costs have been estimated conservatively,and contingencies have been included to cover possible increases in local costs.
82. On the basis of these and the other assumptions included in Annex 6,the income forecasts indicate that the net income of the DSW should increase ata rapid rate as the new facilities are brought into production. Net incomeafter taxes should increase from 10% of the shareholders' average equity oncompletion of construction in 1965 to 16.0% in 1967 when the capacity opera-tions are expected to be reached, corresponding to 11% and 20% respectivelyon share capital.
83. On the assumption that expansion to a 900,000 ton level and provisionof necessary additional working capital is financed wholly from retainedearnings, and that the DSW would be able to produce and sell this amount in1970, comparable figures would be 19.1% (32% on share capital).
84. Income before interest and taxes would amount to 14.7% on the netinvestment in 1967 and 24.3% in 1970.
85. During the last two years of construction the projected currentratios would be poor. However, improvement would be rapid after completionof construction and the DSW should be able to virtually eliminate its short-term debt by 1967 and still pay a reasonable dividend (assumed at a rate of8% for the purposes of the forecasts).
86. Interest coverage and debt service coverage are adequate. Bothwould improve substantially on completion of the expansion to the 900,000torL level.
87. The long-term debt/equity ratio reaches a maximum of 54:46 atthe end of construction and improves to 46:54 by March 31, 1967 when theDSW7 assumes it would begin the planned expansion which would increase potashcapacity by an additional 300,000 tons per year at an estimated cost ofIE 26.3 million. The cash flow indicates that the expansion could befinanced in 1968 and 1969 entirely from self-generated funds if no dividendswere paid on 1968 earnings.

- 23 -
88. Depreciation charges alone are more than sufficient to cover amor-tization payments on all long-term debt. After 1967,when capacity operationsof the Project are expected to be reached, the DSW could maintain service onits total long-term debt if sales revenues were to decline by 28% or operatingcosts were to increase by 44%. These "break-even points" should be even morefavorable on completion of the expansion to the 900,000 ton level.
89. It will be noted in the income forecasts (Annex 3) that a consider-able portion of the total revenues would come from an export premium and ithas been assumed that the present system would be continued. The questionwas considered what the effect on the company would be if at some future timethese premiums were replaced with a uniform rate of exchange at a par valueabove the present rate. Indications are that the financial prospects of thecompany would not be affected unfavorably.
- 24 -
VI. PROTECTIVE ARRANGEMENTS
90. The contractual arrangements for the proposed Bank loan containprovisions to the following effect:
a) Dividends would be payable only from earnings accumulatedafter March 31, 1961;
b) During the construction period, the company would notincur, without the Bankts consent, any additional long-term debt. After the completion of construction thecompany could contract additional long-term debt so longas the amount of debt did not exceed equity (share capitalplus surplus);
c) The company would use its best efforts to achieve aposition by March 31, 1968 whereby current assetswould exceed current liabilities in a ratio of 1.25-1;
d) Pricr to the corploticn of the Project, the companywould not make any investment for other than tho Projectwhich would cost more than 5250,000 equivalent, exceptin accordance with a financial plan approved by the Bank.
91. These arrangements should be adequate to ensure that the companycould meet its financial obligations without jeopardizing its liquidity orrunning short of working capital.
VII. CONTCLUSION
92. The DSW would be embarking on a Project which is very large in re-lation to existing facilities. However, the Project is soundly conceivedtechnically and the market prospects are favorable. The management of thecompany is good. On completion of construction the profitability prospectsof the Project are favorable. Profits should be further increased when thesecond stage expansion is completed. The financing plan, although it maybe tight during the last two years of construction is, on the whole, satis-factory.
93. Subject to the successful completion of the public share issue,the Project is a suitable basis for a Bank loan of $25 million equivalentfor a term of 15 years, including 5-year grace period. The loan would beguaranteed by the State of Israel.
June 3, 1961.
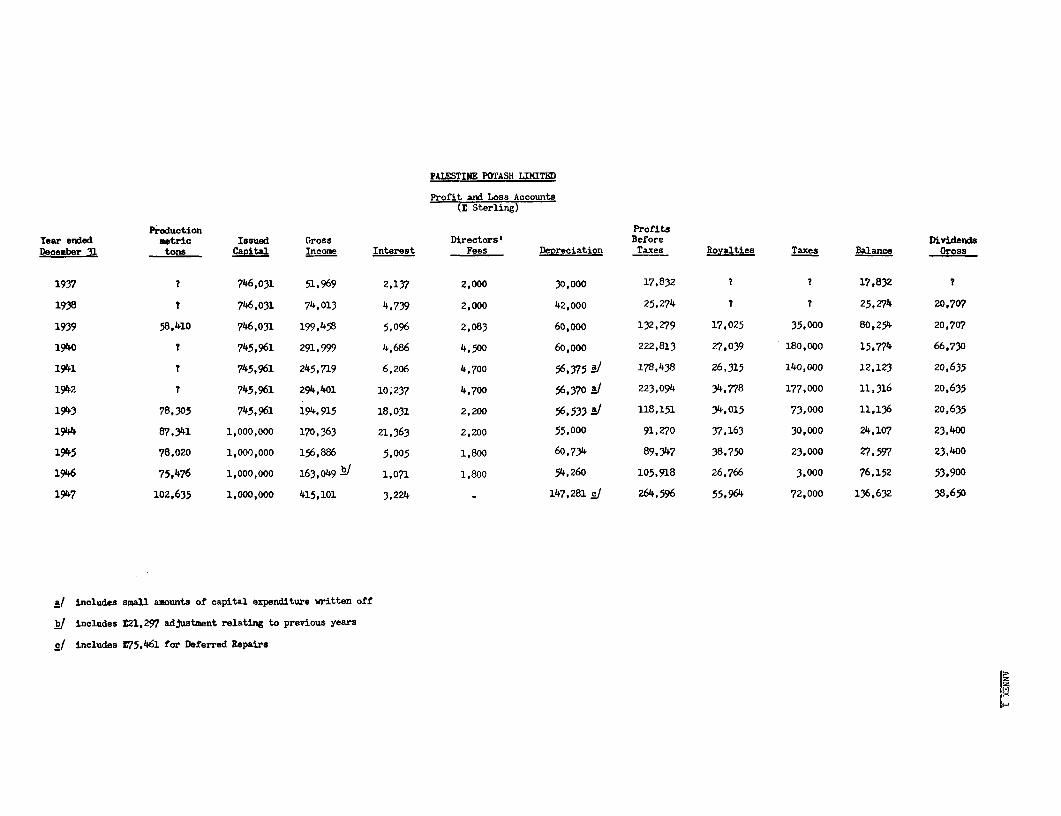
PALESTINE POTASH LINITED
Profit and Loss Accounts(E Sterling)
Production ProfitsYear ended metric Issued Gross Directors' Before DividendsDecember 31 tons Capital Income Interest Fees Depreciation Taxes Royalties Taxes Balance Gross
1937 ? 746,031 51,969 2,137 2,000 30,000 17,832 ? ? 17,832 7
1938 t 746,031 74,013 4,739 2,000 42,000 25,274 7 ? 25,274 20,707
1939 58,410 746,031 199,458 5,096 2,083 60,000 132,279 17,025 35,000 80,254 20,707
1940 7 745,961 291,999 4,686 4,500 60,000 222,813 27,039 180,000 15,774 66,730
1941 7 745,961 245,719 6,206 4,700 56,375 178,438 26,315 140,000 12,123 20,635
1942 7 745,961 294,401 10,237 4,700 56,370 / 223,094 34,778 177,000 11,316 20,635
1943 78,305 745,961 194,915 18,031 2,200 56,533 118,151 34,015 73,000 11,136 20,635
1944 87,341 1,000,000 170,363 21,363 2,200 55,000 91,270 37,163 30,000 24,107 23,400
1945 78,020 1,000,000 156,886 5,005 1,800 60,734 89,347 38,750 23,000 27,597 23,400
1946 75,476 1,000,000 163,049 ! 1,071 1,800 54,260 105,918 26,766 3,000 76,152 53,900
1947 102,635 1,000,000 415,101 3,224 - 147,281 s 264,596 55,964 72,000 136,632 38,650
a includes small amounts of capital expenditure written off
!/ includes L21,297 adjustment relating to previous years
£1 includes E75,461 for Deferred Repairs

ANNEX 2Page 1
Market Prospects for Dead Sea Potash
Introduction
The Dead Sea Works project has as its aim an increase in potashproduction from 135,000 tons in the fiscal year 1960/61 to 590,000 tonsin 1966/67 (in terms of K20, from about 80,000 tons to about 360,000 tons).Production would continue to be mainly for export. Western Europe is ex-pected to remain an important market, in spite of the expected large in-crease in potash production in Italy, which is now the largest WesternEuropean purchaser of Israeli potash, but in addition, the Dead Sea Worksexpects to increase sales to Africa, Asia and Australasia as consumptionin these regions rises from present low levels.
The proposed increase in Dead Sea potash output (280,000 tonsK20) is roughly equal to the average annual increase in consumption incountries outside the Soviet Bloc during the last half dozen years. Presentcapacity outside the Soviet Bloc is little in excess of present production,and expansion possibilities in Western Europe and in the Carlsbad area ofthe U.S. which accounts for 90% of current U.S. production are limited.However, a substantial increase in capacity is expected in the next fewyears in North kAerica, both in Canada where long delayed projects are ex-pected to come into production and at a new large mine in Utah. The pros-pects of the potash industry and of the Dead Sea Works depend upon how thetotal increases in capacity--both those firmly in prospect in Canada, theU.S., Italy and Israel and potential increases from older workings in theU.S., West Germany, France and Spain and in East Germany and the U.S.S.R.-will compare with increases in demand over the next half dozen years. Thatquestion is explored below.
The Potash Market
Potash production is concentrated in a very limited number ofcountries. In the fertilizer year 1958/59, when world production of fer-tilizer potash V/(including estimates for the U.S.S.R. and East Germany)amounted to about 8.3 million tons K20, about 38% (3.15 million tons K20)was produced in West Germany and France, 25% (2.1 million tons K20) in thein the U.S. and an estimated 32% (2.7 million tons K20) in the U.S.S.R. andEast Germany. Virtually all the remainder was accounted for by Spain andIsrael. (See Table 1).
The Soviet Bloc and the rest of the world constitute two generallydistinct markets. East Germany and the Soviet Union meet the requirementsof the Soviet Bloc countries. The remaining producers meet most of therequirements of countries outside the Bloc. However, consumption outsidethe Soviet Bloc slightly exceeds production; in 1958/59, it amounted to 6million tons K20 compared with a production of 5.6 million tons K20. Theshortfall is made good by exports from East Germany and the U.S.S.R.
l/ Complete data on potash production and consumption are available onlyfor fertilizer potash. Chemical grade potash accounts for about 5%of total potash consumption in the U.S. and somewhat smaller percentageselsewhere.

ANNEX 2Pae:e 2
About 90% of the potash consumed by countries outside the SovietBloc is accounted for by Western Europe, the Urited States and Japan, whichconsumed respectively 53%, 32% and 7% of the total in 1958/59. WesternEurope and the United States each had a net surplus of production over con-sumption of about 200,000 tons K20 in 1958/59, but exports from both regionsto other regions considerably exceed these net surpluses. (See Table 2)
Western European potash consumption has been increasing morerapidly than production since 1954/55, and the net regional surplus declinedfrom 525,000 tons K20 in that year to 240,000 tons K20 in 1958/59.]! Inthat same year, however, the Western European producers exported close to600,000 tons K20. 2/ 3/ The difference is largely accounted for by importsfrom East Germany and the U.S.S.R. and, to a minor extent, Israel. TheWestern European producers export potash to all parts of the world, in-cluding the U.S. (See Tables 3-5 and 7)
Since 1955/56, U.S. potash production has been equal to or inexcess of consumption. However, because U.S. potash is produced in thewest (over 90% near Carlsbad, New Mexico and the balance in Utah andCalifornia) the U.S. has always imported potash from Europe for use on theeast coast, where European potash can be delivered at a lower price thanU.S. potash. A quantity equal to the imports plus the net surplus, if any,is exported. The principal markets for the U.S. are Canada, Latin Americaand Japan, but U.S. potash is exported also to other Far Eastern countries,in particular Taiwan and the Philippines, the Union of South Africa andOceania. (See Tables 6 and 7)
Israel exports the bulk of its output. In the last two years,its major market has been Western Europe, in particular Italy, the U.K.and the Netherlands, but it has also sold potash to Japan, other Far Easterncountries and Africa. (See Table 8)
Because the Soviet Bloc and countries outside the Bloc constitutedistinct markets, and because data on production and consumption in SovietBloc countries are neither complete nor reliable, this study will concernitself primarily with the market prospects in countries outside the SovietBloc. Account will be taken, however, of the potential contributions fromEast Germany and the U.S.S.R. to the supplies of the countries outside theB;loc.
]j The net surplus for the region rose to an estimated 310,000 tons K20in 1959/60.
/ Exports to non-CEEC countries, as reported by OEEC. The export datagiven in Tables 3-8 refer to potash materials. Commercial potash fer-tilizer materials have varying K20 contents. The average for all potashmaterials sold by European producers is probably around 55%, 'cr theU.S., it is probably around 60%.
/ OEEC's preliminary estimate of exports to non-OEEC countries in 1959/60was 760,000 tons K20.

ANNEX 2Page 3
Growth of Potash Consumption
In the twenty years between 1938 and 1958/59, consumption offertilizer potash in countries outside the Soviet Bloc has increasedthreefold, from two to six million tons K2 0. Consumption has risen sub-stantially in all regions, but patterns of growth have varied from countryto country.
U.S. consumption increased more than fivefold over the period1938 to 1958/59. The bulk of the increase occurred during the 1940's andearly 1950's; from 1953/54 to 1957/58 there was very little increase inconsumption. In 1958/59, however, growth was resumed, and censumption in-creased by 8% that year. Preliminary figures indicate that there was atleast as great an increase in 1959/60.
Western European consumption increased only a little over two-fold between 1938 and 1958/59, but the modesty of the increase is attri-butable to the war. Since 1947/48, when consumption regained the prewarlevel, growth has been steady and substantial. Although there has beensome slowing up since 1953/54, the increase between that year and 1959/60is equivalent to 5.5% per year on the average. In the last three years,the increase has amounted on the average to over 5% per year.
Japanese consumption increased fourfold in the period 1938-1958/59,with the bulk of the rise occurring in the early 1950's. Japan was slowerthan Western Europe to regain its prewar level of consumption of 140,000tons K2 0, and consumption was below that level up to 1950/51. Betweenthat year and 1955/56, however, consumption almost trebled, rising from140,000 tons to 385,000 tons K20. Available data for consumption representapparent rather than actual consumption (i.e. they do not take account offluctuations in stocks) and they show wide fluctuations in the followingyears. The average for the three years (1956/57-1958/59) is a little over400,000 tons K2 0, which would seem to indicate that growth has slowed downin recent years.
In all other regions outside the Soviet Bloc, the increase inconsumption over the period 1938-1958/59 has approached the fivefold in-crease shown by the United States, but since 1953/54, growth in theseregions has been much more rapid than in the three major consuming areas.
Rates of growth in consumption for countries or groups of coun-tries outside the Soviet Bloc since 1938 and for the shorter period since:L953/54 are given below. To minimize the influence of short-term fluctua-tions averages for 1952/53-1954/55 and for 1956/57-1958/59 are used insteadof figures for 1953/54 and 1958/59. For countries other than the majorconsumers, the averages for 1956/57-1958/59 may understate actual consump--tion in those years. Where reports are late in coming in, the FAQ followsthe practice of assuming that consumption has remained at the level reachedin the latest year for which data are available. Late reports are mostcommon in the minor consuming countries, and since consumption in thesecountries has been rising rapidly, the FAQ assumption is likely to lead tounderstatements. (Further details are given in Table 9)

ANI'-EX 2Page 4
Averaae Annual IncreaseConsumption, 1938 to AverageAverage Average Average 1952/53-1954/551952/53- 1956/57- 1956/57- to Average
1938 1954/55 1958/59 1958/59 1956/57-1958/59- - -- '000 tons K20 - - - - - - - Per Cent - - - - -
Western Europe 1,380 2,345 3,020 4.0 6.5United States 360 1,640 1,800 8.3 2.3Japan 112 300 400 6.5 7.4Canada 21 74 79 6.8 1.6Other America 11 80 140 13.6 15.6Asia (excludingJapan) 27 58 108 7.2 16.8
Africa 20 47 73 6.7 11.3Oceania 13 31 56 7.6 15.9
Total 1.945 4.580 _680 5.5 5.5
Consumption Prospects
Estimates are given below of probable rates of growth in potashconsumption in countries or groups of countries over the period 1956/57-1958/59 to 1966/67 when the Israeli project is expected to reach full pro-duction. The average for the three years 1956/57-1958/59 was used as a basisfoIr the projection instead of the single year 1958/59 in order to minimizethe effect of short-term fluctuations. Since estimates are already availablefor' 1959/60 consumption in Western Europe and the U.S., actual developmentsbetween 1956/57-1958/59 and 1959/60 provide some check on the estimates ofgrowth rates for the longer period. In making the estimates, account wastaken of the recent rates of growth shown above, of the adequacy of presentlevels of consumption and of economic and social factors that may be expectedto promote or inhibit growth. The following sections discuss the considera-tions underlying the estimates.
Estimated RatesAverage of Increase Estimated
Consumption to 1966/67- Consumption1956/57-1958/59 1966/67 1969/70 1966/67 1969/70('000 tons K20) (Per Cent) 1(000 tons K20)
Western Europe 3,020 4 3 4,300 4,700United States 1,800 4.5 3 2,675 2,925Japan 400 5 3 620 680Canada 79 4.5 3 120 130Other America 140 10 8 330 415India 14 (33.5)/ (10)1/ 150 200Other Asia 94 10 8 220 275Africa 73 10 8 170 215Oceania 56 10 8 130 165
Total 5,680 8 715 9 700
17 Based on estimates of consumption discussed later.Note: Totals in this annex are rounded and contain
production from unlisted countries.

ANNEX 2Page 5
Western Europe. The level of consumption in Western Europe isrelatively high, but there is considerable variation from country to country.At the end of the scale are Belgium, with a consumption of close to 90 kgs.per ha. of agricultural land, West Germany (73 kgs.), the Netherlands (66kgs.) and Denmark (57 kgs.). At the other end are Ireland (12 kgs.), Italy(6.6 kgs.) and Spain, Portugal and Greece (2-3 kgs.). (See Table 10)
Increases in the consumption of countries at the upper end of thescale in recent years have been modest, and little further increase is ex-pected in the next few years. However, there is considerable room forgrowth in consiu-ption in countries now cons-uming 20-35 kgs. per ha. of agri-cu:Ltural land as well as in the countries with a very low level of consumption.Included among the countries consuming 20-35 kgs. are the United Kingdom andFrance which accoiunted for 12% and 22% respectively of total Western Europeanconsumption in 1958/59. A substantial increase in their consumption wouldhave a significant effect on consumption growth in the region as a whole.
Groeth prospects in the United Kingdom are good. Consumption ir theUnited Kingdom rose from 20.3 to 34.5 kgs. per ha. bet-ween 1953/54 and 1959/60or over 9% per year on the average. The rapid rise in use of fertilizerswas part of the improvement in farming techniques, encouraged by governmentprice supports. Use of fertilizers was encouraged by subsidies on nitrogenand phosphates; increased use of one fertililzer minkes necessary increaseduse of the others to maintain soil balance? and is promoted in England bythe fact that the comm.n practice is to apply m2 wd fertilizer. No changein British agricultural policies is in sigh1)-i, and fertilizer consumption isgenerally expected to continue growing. A particularly promising field areEngland's grasslanids, where the use of fertllizers is just starting.
Potash consumption in France is modest,(only 23 kgs. per ha.) par-ticularly since France is a major potash producer, and consumption increasedlittle from 1956/57 to 1959/60. This relatively low consumption is attri-butable to the fact that France's large area of agricultural land and rela-tively low population density have provided little incentive for intensivefarming. The situation seems ripe for a change, however. With France'scurrent high rate of industrial growth, it may be expected that there willbe a movement of the rural population to the cities, and a greater use bythe reduced agricultural labor force of all technical aids, including fer-tilizer, to meet the growing demands of an increasingly prosperous population.If, as is also possible, the development of the Common Market results in anincreased demand for French agricultural products in other Common Marketcountries, French consumption of fertilizer might increase very rapidly inthe next few years.
In the Western European countries where consumption is still modest--Ireland and the Mediterranean countries--consumption could obviously risesubstantially, and may be expected to do so once the process starts. In atleast two countries, that process appears to have begun. In Ireland, con-sumption rose from 8 to 12 kgs. per ha. of agricultural land between 1953/54and 1959/60; the plan of the government to expand agricultural productionshould lead to further rapid growth. In Italv, where consumption has alreadyrisen from 3.5 kgs. in 1956/57 to 6.6 kgs. in 1959/60, the initiation ofdomestic production on a large scale should make for continued rapid growth.

ANNEX 2Page 6
It does not seem unreasonable, therefore, to assume that WesternEuropean consumption of potash will increase by 4% per year over the pro-jection period. This compares with an increase of 6.5% per year over theperiod 1952/53-1954/55 to 1956/57-1958/59. In the first few years of theprojection period, consumption has risen by over 5% per year and forecastsby national experts indicate an expected increase in Western European con-sumption of another 5% in 1960/61. 1) For the remainder of the decade, itisE assumed that growth will amount to only 3% per year.
United States consumption of potash is low compared to that ofWestern Europe (5.5 kgs. per ha. of agricultural land). However, the averageis brought down by the inclusion in the land area of the large wheat growingarea of the Great Plains, where little or no fertilizer is used. In theregions where fertilizer is used, rates of application are comparable tothose in the U.K. In view of the many demonstrations that very much higherrates of application would be economically justified, experts look for a riseirn consumption. The resumption of fairly rapid growth after several yearsof unchanged consumption suggest that this view is well founded.
The variations in the rate of growth in recent years make it par-ticularly difficult to estimate future prospects. The rapid growth in con-sumption that began in 1957/58 has continued and there are no indicationsof a retreat to stagnation. Experts forecast future growth of 4-5% per year.An increase at a rate of 4% per year from the estimated level for 1959/60(something over 2 million tons K20) would, because of the rapid growth inthe past two years, be equivalent to an increase of 4.5% per year for theprojection period. It has been assumed therefore that over the period1956/57-1958/59 to 1966/67 U.S. potash consumption will grow at a rate of4.5% per year, declining thereafter to 3% per year.
Japanese consumption of potash in 1958/59 was equivalent to 72 kgs.per ha. of agricultural land, a level exceeded only by Belgium and Germany.However, the Japanese figures are not comparable to European or U.S. figures.In Japan, only cropland is classified as agricultural land; thus, only onesixth of the total land area of Japan is considered to be agricultural land.In Belgium and Germany in contrast, over 55% of the total land area is classi-fied as agricultural land; 40% of the agricultural land in each of thesecountries is grassland.
Recent developments in Japanese agricultural practice make it seemlikely that grasslands will be brought into the agricultural picture and openup a new market for potash. An FAO survey team which in 1960 studied thefertilizer situation in a number of Far Eastern countries attributed theslowing down of growth in Japanese consumption in recent years (which wasnoted above) to a shift to animal raising, as a result of which fertilizers
1 OEEC Chemical Products Committee, Report on Fertilizers, 1961(First Revision December 20, 1960).

ANNEX 2Page 7
have lost ground to feeding stuffs in the farm expenditure pattern. Theteam noted, however, that "there is a growing awareness of the possibilityof including fodder plants in the existing crop rotations. In the past,non-arable land has been treated as outside the farm industry. Livestockfarming may open this land to modern farming techniques, including the appli-cation of fertilizers. The same applies to the cultivation of sugar beet(grown as a second crop after early paddy) which is being introduced in thecrop rotation to an increasing extent." Y/
In response to the FAO team's request, Japanese Government expertsand fertilizer interests estimated that potash consumption would grow by3% per year between 1958/59 and 1963/64. Because of the fluctuations inconsumption in recent years that would be equivalent to an increase of almost4% per year from the projection base used in this study (the average for1956/57-1958/59). For the reasons set forth above, the FAO team noted thatthis estimate might well prove conservative. Their reservations seem cogent.The readiness of the Japanese to adopt modern methods in all fields and theJapanese farmers will, as the FAO experts suggested they might, begin fer-tilizing grasslands. It seems adequately conservative, therefore, to assumethat Japanese consumption will increase by 5% per year to 1966/67 and by 3%per year to the end of the 1960's.
Canada. Canadian potash consumption appears to have paralleledU.S. consumption in recent years, showing very little increase from 1953/54to 1957/58, but apparently rising rapidly since then. The FAO has not yetpublished data on Caradian potash consumption after 1957/58, but AmericanPotash Institute data on deliveries to Canada suggest that Canadian consump-tion may have increased even more sharply than U.S. consumption in 1958/59and 1959/60. If, as is expected, the large western Canadian potash minesovercome their difficulties and come into production in the next year ortwo, consumption may well be stimulated and increase more rapidly than inthe U.S. For the purposes of this study, however, it has been assumed moreconservatively that Canadian potash consumption will increase at the samerate as U.S. consumption--i.e. by 4.5% per year over the projection period(1956/57-1958/59 to 1966/67) and by 3% per year to the end of the decade.
Other Areas. Although the potential for an increase in potashconsumption in other areas is very great, growth is held back by the povertyof the farmers, their lack of krnowledge about modern techniques, inadequatetransportation which limits access to markets and increases the cost ofsupplies brought into rural areas, inadequate foreign exchange. Despitethese obstacles, there has been a very rapid growth in consumption in recentyears, and the growing concern of the countries likely to contribute fundsfor development and of international agencies over the position of the ruralpopulation in underdeveloped countries should, if anything, speed progress.Although all these regions must import potash, the foreign exchange expen-diture is so small compared with the potential increase in crop output thatshortages of foreign exchange are not likely to be a major obstacle.
FAQ, Preliminary Report of the Survey of the Fertilizer Economyof the Asia and Far East Region, Rore, 1960, p.67.

ANNEX 2Page 8
In Latin America, consumption increased by close to 16% per yearover the period 1952/53-1954/55 to 1956/57-1958/59. Awareness of the valueof fertilizer is leading several countries to undertake the production ofnitrogen. The resulting increase in nitrogen consumption is bound to stimu-late increased use of other fertilizers. It has seemed adequately conserva-tive, therefore, to assume that consumption of potash will increase by 10%per year to 1966/67, dropping to, say, 8% per year thereafter.
In Asia, the Indian Third Five Year Plan provides for a very sub-stantial increase in fertilizer consumption by 1966/67, the close of thePlan period. No official target was included in the published Plan, butthe target for potash is unofficially reported to be 200,000 tons K20;that would represent a tenfold increase compared with 1958/59. There islittle question that the quantities it is proposed to consume, and evenlarger quantities, could be used to advantage. The ITdian Ministry of Foodand Agriculture has estimated requirements in 1966/67 as 250,000 tons K90;its estimates assume average rates of application to crops benefitingfrom potash. The FAO survey team referred to above considered the assumedrates of application conservative, noting that experiments had indicatedthat applications two or three times as high would yield economic returns,There is a question, however, whether the reported target can be reached.The FAO mission commenting on an estimate for 1963/64 submitted by theIndian Government which was in line with a 1966-67 target of 200,000 tonsK20, said: "So far as can be ascertained, such growth rates have not beenachieved elsewhere in the world, even where domestic and foreign exchangeconditions were more favorable than in India".
The Indian Government expects to make great efforts to increasefertilizer consumption substantially in order to achieve the massive increasein crop output which it recognizes as essential. It has been highly success-ful in increasing nitrogen consumption (frca 142,000 tons N. in 1955/56 to257,000 tons N. in 1958/59, and potash consumption, though still small, hasgrowin from 6,700 tons K20 ̀n 1955/56 to 20,000 tons K20 in 1958/59). TheFAQ survey team was unwilling to pass judgment on the feasibility of thetarget set for 1963/64, but it seems likely that although the target of200,000 tons K20 may not be reached by 1966/67, it could be reached by1969/70, and that by 1966/67, consumption might amount to say 150,000 tonsK2 0.
Consumption of potash in Asia (outside of Japan) rose by 17% peryear between 1952/53-1954/55 and 1956/57-1958/59. Estirnatss of consumptiongrowth to 1963/64 for countries accounting for half the potash consumed inAsia (excluding Japan and Ind.a) given by the FAQ survey team which repre-sent revisions of estimates supplied by governments, to bring them to whatthe FAQ team considered a feasible level indicate that the team expectedconsumption in this group of countries to increase by about 10% per yearover the period 1958/59-1963/64. This seems an adequately conservativeestimate for the whole region for the longer period; it has therefore beenassumed that consumption in this region will increase by 10% per year to1966/67 and by 8% per year thereafter.
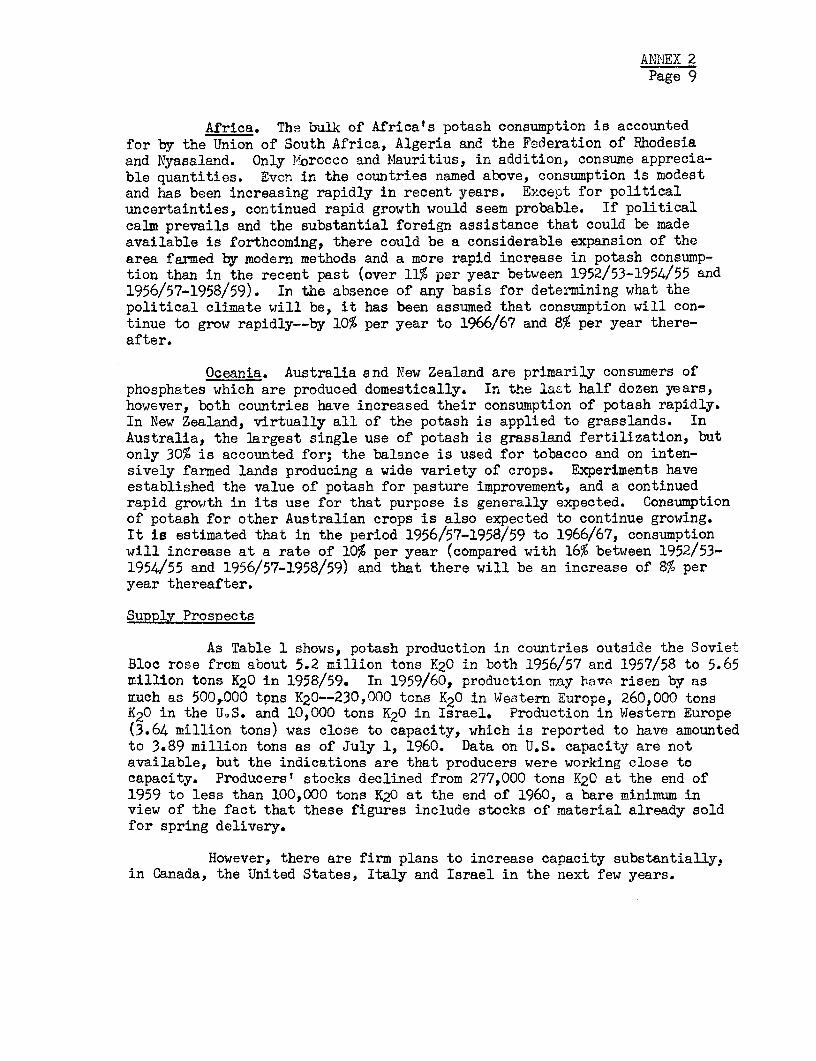
ANNEX 2Page 9
Africa. The bulk of Africats potash consumption is accountedfor by the Union of South Africa, Algeria and the Fsderation of Rhodesiaand Nyasaland. Only MJ�orocco and Mauritius, in addition, consume apprecia-ble quantities. Evcn in the countries named above, consumption is modestand has been increasing rapidly in recent years. Except for politicaluncertainties, continued rapid growth would seem probable. If politicalcalm prevails and the substantial foreign assistance that could be madeavailable is forthcoming, there could be a considerable expansion of thearea farmed by modern methods and a more rapid increase in potash consump-tion than in the recent past (over 11% per year between 1952/53-1954/55 and1956/57-1958/59). In the absence of any basis for determining what thepolitical climate will be, it has been assumed that consumption will con-tinue to grow rapidly--by 10% per year to 1966/67 and 8% per year there-after.
Oceania. Australia and New Zealand are primarily consumers ofphosphates which are produced domestically. In th.e lact half dozen years,however, both countries have increased their consumption of potash rapidly.In New Zealand, virtually all of the potash is applied to grasslands. InA.ustralia, the largest single use of potash is grassland fertilization, butonly 30% is accounted for; the balance is used for tobacco and on inten-sively farmed lands producing a wide variety of crops. Experiments haveestablished the value of potash for pasture improvement, and a continuedrapid growth in its use for that purpose is generally expected. Consumptionof potash for other Australian crops is also expected to continue growing.It io estimated that in the period 1956/57-1958/59 to 1966/67, consumptionwill increase at a rate of 10% per year (compared with 16% between 1952/53-1954/55 and 1956/57-1958/59) and that there will be an increase of 8% peryear thereafter.
Supply Prospects
As Table 1 shows, potash production in countries outside the SovietBloc rose from about 5.2 million tons K20 in both 1956/57 and 1957/58 to 5.65million tons K20 in 1958/59. In 1959/60, production may bave. risen by asguch as 500,000 tons K20--230,000 tons K20 in Western Europe, 260,000 tonsK20 in the U.S. and 10,000 tons K20 in Israel. Production in Western Europe(3.64 million tons) was close to capacity, which is reported to have amountedto 3.89 million tons as of July 1, 1960. Data on U.S. capacity are notavailable, but the indications are that producers were working close tocapacity. Producers' stocks declined from 277,000 tons K20 at the end of1959 to less than 100,000 tons K20 at the end of 1960, a bare minimum inview of the fact that these figures include stocks of material already soldfor spring delivery.
However, there are firm plans to increase capacity substantially,in Canada, the United States, Italy and Israel in the next few years.

AIN,EX 2Page 10
Canada. The greatest potential source of additional potash pro-duction in the Free World today is Saskatchewan, Canada, where large depositsof high-grade potash mineral were discovered in the 1940's. Much of thearea has been leased to producers, including leading U.S. and European pro-ducers and three properties are under development. Unfortunately, the de-posits are about 3,400 ft. deep, and a 200-ft. water bearing formation about1,800 ft. down has presented a serious problem. Work on one of the projects(Continental Potash) was stopped at a relatively early stage in 1958; someground stabilization work has been done since then but no completion datehas been announced. The Potash Co. of America completed its mine in late1958 and produced small quantities of potash in 1959, but water seepageforced the mine to shut down in the fall of 1959 and the company has notyet succeeded in making its shaft water-free. International Minerals andChemical Corporation has been making a similar effort at its mine, which wasoriginally scheduled for completion in early 1960. Neither company has yetarmounced a completion date, but it is generally believed that they will besuccessful and that they should be producing potash by some time in 1962.
The Potash Co. of America plant would have a capacity of 360,000tons K20. International Minerals' plant would have a capacity at the outsetof 250,000 tons K20, but is designed for expansion to twice that size. Ifthe two companies succeed in solving their technical problems, Canada couldhave a capacity of 600,000 tons K20 by 1962 or 1963. This could be in-creased to 850,000 tons K20 within a few years by the expansion of theInternational Minerals and Chemical Corporation plant and to say 1.1 milliontons K20 by the completion of the Continental Potash plant. Further expan-sion is more problematical. The Pittsburgh Plate Glass Co. and Armour andCo. recently announced a plan to construct a pilot plant and drill testwells for solution mining of potash, to be followed, if the test provessuccessful, by the construction of a large commercial plant. Its completionis, however, probably years away. The development of other properties alsoseems likely to wait since, as is indicated below, prospective expansion inNorth America is likely to raise production considerably above North Americanconsumption.
United States. The grade of Carlsbad ore has been decliningsteadily (from 20.5% K20 on the average in 1950-54 to 18.6% in 1959) andmining has been growing more difficult and costlier. It was for this reasonthat U.S. producers turned so eagerly to Saskatchewan. When U.S. consumptionbegan to rise again in 1958/59 and the Canadian properties failed to comeinto operation, existing properties in the U.S. were expanded to permit pro-duction of an estimated 2.38 million tons K20 in 1959/60 compared with 1.94million tons K20 in 1956/57. In addition, in the fall of 1960, Texas GulfSulphur, a newcomer to potash production announced that it would begindsevelopment of a large recently delineated high-grade potash deposit atMoab, Utah. Planned capacity is 625,000 tons K20, and completion is sche-duled for 1962.

AYNEX 2Page 11
Two other projects that may be regarded as firm would add about100,000 tons K20 to U.S. capacity. An expansion now in progress at theTrona, California plant of the American Potash & Chemical Corporation wouldadd about 50,000 tons K20. A new shaft now being sunk at the Carlsbad pro-perty of Duval Sulphur mainly to provide easier access to the ore body wouldprobably also result in a small increase in capacity.
Other prospects are more problematical. The Farm Chemical ResourcesDevelopment Corporation (owned jointly by the Farmers' Union and Kerr McGee)has done a little development work on a property near Carlsbad for a plantwhich was tentatively planned to have a capacity of about 175,000 tons K20.Southwest Potash has begun building a potassium nitrate plant at Vicksburgwhose completion may make necessary some expansion of its Carlsbad facili-ties. National Potash, which has been buying potash mineral from Southwestunder a five-year contract may have to develop a reserve it bought in 1957 ifSouthwest can no longer provide it with potash when that contract expires, Onthe other hand, it has been believed for some years that as soon as additionalsupplies from other sources became available, the Carlsbad producers wouldtake the opportunity to make a necessary cut in production to stretch theuseful life of this area.
It was estimated above that consumption of potash in the U.S. andCtnada might amount to 2.8 million tons K2 0 by 1966/67. Assuming that all theCanadian projects discussed above, the Texas Gulf Sulphur Moab plant and thetwro minor U.S. projects now nearing completion come into production beforethat date but that other expansions would be balanced by cut-backs, andmaking allowance for the fact that about 5% of the increase would be usedfor chemical grade potash, capacity in the U.S. could rise to 4.1 milliontons K20 by 1966/67 (2,365,000 tons K20 in 1959/60 plus 95% of the prospec-tive additions of 1,875,000 tons K20). This would be considerably in excessof prospective consumption. About 1,260,000 tons K20 would come in by 1962(the two first Canadian projects, Texas Gulf Sulphur's plant and the twominor U.S. projects). The additional Canadian projects would probably notbe undertaken if the North American producers are not able to market theirpotash abroad.
Western Europe. The only firm projects to expand production inWestern Europe are three projects in SicilZ, financed by the IBRD which wouldhave a total capacity initially of 210,000 tons K20 and of 280,000 tons K20b;y the mid 1960's. If there were no other increase in capacity in WesternEurope, its total capacity would amount to 4.16 million tons K20 (3.88 mil-lion tons K20 as of July 1, 1960 plus 28O,000 tons K20 from Italy) and wouldfall short of projected demand of 4.3 million tons K20.
Expansion possibilities in West Germany and France are limited.Both present much the same picture as Carlsbad. Ore grade is declining.Modernization is needed not only to maintain present production but to per-mit production of higher grade potash for which demand is increasing. Pro-duction at existing Spanish mines cannot be increased, but a new deposithas been lecated which could yield another 250,000 tons K20 if it were de-veloped. While it is altogether possible that the older European producerswould not attempt to increase their capacity, but rely on larger imports

AN'NEX 2Page 12
from Eastern Europe and Israel to enable them to continue supplying theirexisting foreign markets, it seems more prudent to assume that they willincrease their production by say 250-350,000 tons K20. This would givethem a net surplus position in 1966/67 of 100-200,000 tons K20, comparedwith their net surplus in 1958/59 of 230,000 tons K20.
Israel. The Dead Sea project would, as noted above, increaseIsraeli production by 280,000 tons K20 to 360,000 tons K20.
Free World Demand/Supply Balance
The figures given below compare the projected estimates of worlddemand for fertilizer potash with the estimates of supply set forth above.
EstimatedEstimated ProductionConsumption Capacity
1966/67 1969/70 1966/67('000 tons K20) (0000 tons K20)
Western Europe 4,300 4,700 4,400 - 4,500United States 2,675 2,925 3,065Japan 620 680 -Canada 120 130 570 - 1,185Other America 330 415India 150 200 -Other Asia 220 275 36Africa 170 215 -Oceania 130 165 __-
Total 8,715 98705 8,395 - 9,110
/ This includes potash from Israel only. There is a possibilityof producing potash in Jordan and the rehabilitation of a prewarplant at the north end of the Dead Sea has been studied, but nofirm plans have been reported.
The figures given above suggest that there should be no seriousimbalance between Free World demand for and supply of potash by 1966/67.Assuming a modest increase in Western European production capacity, in-creases in U.S. capacity from the completion of Texas Gulf Sulphur's projectand the two minor projects now nearing completion, with any other increasesoffset by cutbacks at Carlsbad, and the completion of only the two Canadianprojects expected within the near future, Free World supply would fall shortof demand by 400,000 tons K20, or roughly the current amount of the short-fall now apparently covered by importo from the Soviet Bloc. As was statedabove, any further expansion of Canadian capacity would probably not beundertaken until the North American producers had found it possible toexpand their exports.
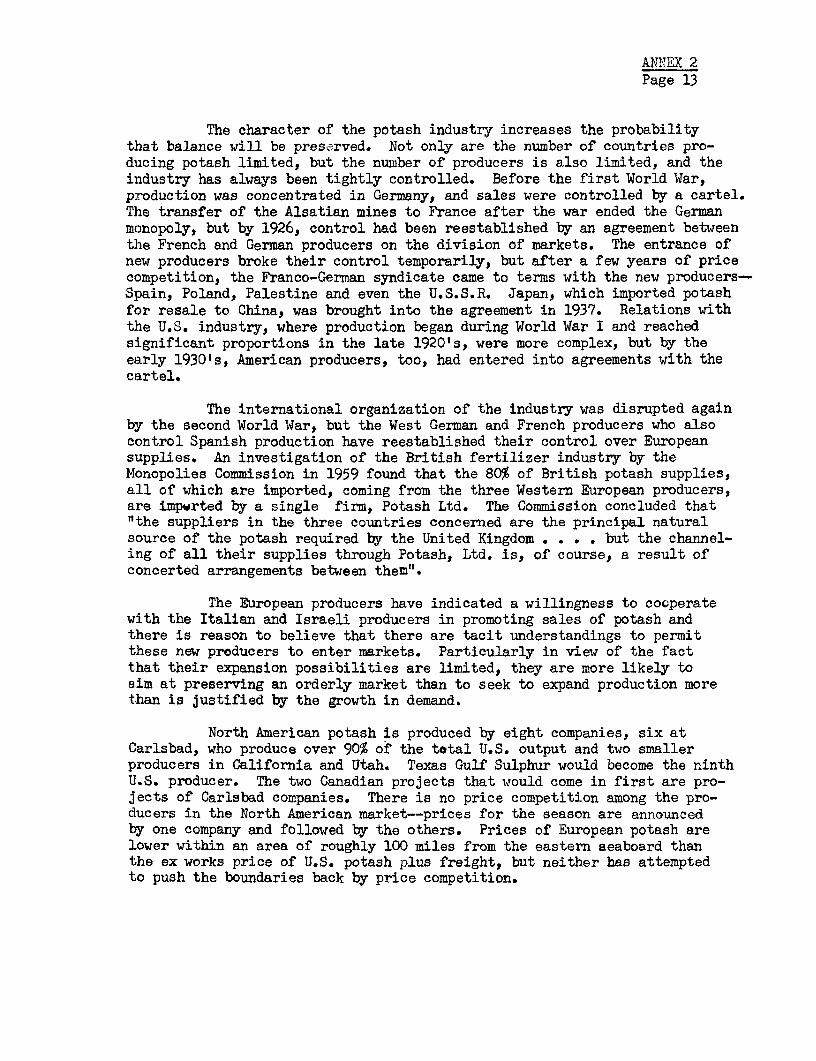
ANNEX 2Page 13
The character of the potash industry increases the probabilitythat balance will be preserved. Not only are the number of countries pro-ducing potash limited, but the number of producers is also limited, and theindustry has always been tightly controlled. Before the first World War,production was concentrated in Germany, and sales were controlled by a cartel.The transfer of the Alsatian mines to France after the war ended the Germanmonopoly, but by 1926, control had been reestablished by an agreement betweenthe French and German producers on the division of markets. The entrance ofnew producers broke their control temporarily, but after a few years of pricecompetition, the Franco-German syndicate came to terms with the new producers-Spain, Poland, Palestine and even the U.S.S.R. Japan, which imported potashfor resale to China, was brought into the agreement in 1937. Relations withthe U.S. industry, where production began during World War I and reachedsignificant proportions in the late 1920's, were more complex, but by theearly 1930's, American producers, too, had entered into agreements with thecartel.
The international organization of the industry was disrupted againby the second World War, but the West German and French producers who alsocontrol Spanish production have reestablished their control over Europeansupplies. An investigation of the British fertilizer industry by theMonopolies Commission in 1959 found that the 80% of British potash supplies,all of which are imported, coming from the three Western European producers,are impwrted by a single firm, Potash Ltd. The Commission concluded that"the suppliers in the three countries concerned are the principal naturalsource of the potash required by the United Kingdom . . . . but the channel-ing of all their supplies through Potash, Ltd. is, of course, a result ofconcerted arrangements between them".
The European producers have indicated a willingness to cooperatewith the Italian and Israeli producers in promoting sales of potash andthere is reason to believe that there are tacit understandings to permitthese new producers to enter markets. Particularly in view of the factthat their expansion possibilities are limited, they are more likely toaim at preserving an orderly market than to seek to expand production morethan is justified by the growth in demand.
North American potash is produced by eight companies, six atCarlsbad, who produce over 90% ot the total U.S. output and two smallerproducers in California and Utah. Texas Gulf Sulphur would become the ninthU.S. producer. The two Canadian projects that would come in first are pro-jects of Carlsbad companies. There is no price competition among the pro-ducers in the North American market--prices for the season are announcedby one company and followed by the others. Prices of European potash arelower within an area of roughly 100 miles from the eastern aeaboard thanthe ex works price of U.S. potash plus freight, but neither has attemptedto push the boundaries back by price competition.

ANMEX 2Page 14
There is reported to be price competition between the Europeanand U.S. producers on foreign markets, but competition is described asgenerally friendly. Competition for foreign markets is likely to be inten-sified when the two Canadian projects and Texas Gulf Sulphur's plant comeinto production in 1962 or 1963, but this is more likely to lead to restraintrather than to unrestrained further expansion, for the American,like theWestern European producers, have shown a preference for orderly marketsrather than for expansion unjustified by rising demand.
The Soviet Bloc
What is the likelihood that Soviet Bloc exports would alter thispicture? Unfortunately, there is little basis for arriving at a judgment.East Germany's plans call for an increase in production to 202 million tonsK20 by 1965, compared with an estimated 1.65 million tons K20 in 1958/59.U.S.S.R. plans call for a trebling of production (estimated by the U.S.Bureau of Mines at 1.05 million tons K20 in 1958/59). In both cases, theexpansions far exceed growth in recent years. Both countries presumablyhave the potash resources to make these planned expansions possible, althoughbo-bh have been expanding production only by very modest amounts in recentyears. A new Russian plant is reported to be nearing completion, but theprogram as a whole is reportedly behind schedule. Moreover, the extensiveRussian deposits near Soli Kamok are reported to present difficulties becauseof swampy conditions. Even if they were able to achieve a considerable (ifless than planned) expansion there is considerable room for an increase inconsumption in the Soviet Bloc's perenially disappointing agriculture. Inthe absence of a reliable basis for estimating how much potash could be madearailable to the Free World by the Soviet Bloc, it does not seem unreasonableto assume that the quantity will change little.
Potential Markets for Israeli Potash
If Free World demand for and supply of potash develop as has beenes-timated, the Dead Sea Works should have no difficulty in disposing of theirincreased output. Because of the world-wide character of the potash market,the requirements of individual countries can be met from several sources,andl the present pattern of trade may be altered to meet changed conditions.A review of the existing pattern may serve, however, to indicate how Israelipotash could fit into the world picture.
As has been noted above, from 1954/55 to 1958/59 consumption inWestern Europe increased more rapidly than production, and the net surplusfor the region fell from 540,000 tons K20 to 240,000 tons K20 (290,000 tonsK2() in 1959/60). However, at least until 1958, the latest year for whichexport data are available for all the Western European producers, exportsto other continents declined little after 1956. There was, however, a smallincrease in exports to the U.S. and availabilities for other markets de-clined.

ANNEX 2Page 15
The decline in Western European availabilities for non-Europeanmarkets other than the U.S. was made good by the U.S. whose exports in-creased from about 100,000 tons a year in the five years 1950-54 to 460,000tons in 1958 and 520,000 tons in 1959.1J The bulk of the increase wasaccounted for by Japan, but there were also increases in sales to Brazil,tc, the Philippines and Taiwan, to the Union of South Africa and to Oceania.
U.S. exports are limited to Canada and South America, Japan andother Far Eastern countries, southern Africa and Oceania. Western Europealso supplies all these markets--its share equals that of the United Statesin Latin America and exceeds it in Japan and Oceania--and it is by far thedominant supplier of Africa and Asia outside of the Far East as well as inWestern Europe. It clearly has a competitive advantage over the U.S. in thelatter markets, and a strong competitive position in all other markets.Israel's freight advantage over Western Europe would give it an even strongercompetitive position as compared with the U.S. in all markets except LatinAmerica.
As a result of the great expansion of North American productioncapacity, the exportable surplus of North America would grow substantially.The U.S. may be expected to take a commanding position in Latin America andthe Far East and to increase its penetration of Africa and Oceania. TheDead Sea Works should be well able to compete, however, except in LatinAnerica and possibly Oceania.
Israeli sales to Western Europe may also grow. If Western Europeandemand for and supply of potash develop as indicated, the net surplus forexport outside the continent will grow little, if at all. A reduction inexports to Latin America and a further reduction in exports to the Far East,including Japan, may not suffice to enable them to meet the growing demandin markets where they have a competitive advantage over the U.S., includingthe U.S. eastern seaboard. The maintenance of these established marketsmay depend on increased imports into Western Europe from Eastern Europe andIsrael. Although exports from Israel to Italy, now its principal WesternEuropean market, should decline once Italian production is established, theDead Sea Works is also exporting to the U.K., the Netherlands and Sweden.The United Kingdom may be expected to continue importing from Israel. Be-cause West German, French and Spanish potash coming into the United Kingdomis channeled through one company, potash consumers unwilling to depend uponPotash, Ltd. for their supplies must seek them from other sources.
Potash Prices
After declining steadily during the 1950's to 1959/60, the priceof U.S. potash was increased for the 1960/61 season from 34.50 to 37.50per unit K20. a! Several large producers have announced an increase to
/ It should be noted that the export data given in Tables 3-8 and referredto above relate to potash materials and not to their K20 content, andcover chemical as well as fertilizer grade potash.
g/ Price during January-May (the main purchasing months of the year) forstandard muriate in bulk at Carlsbad. Lower prices prevail in the offseason, and prices ranged from 300 to 34.5¢ per unit K20 in 1959/60 andfrom 330 to 37.50 in 1960/61.

ANIEX 2Page 16
40 per unit K20 V for 1961/62. It is not yet certain that these in-creases will be adopted; if the rest of the trade does not follow, thecompanies that announced the increases will probably rescind them.
U.S. export prices are also believed to have grown firm. Exportprices are negotiated with individual buyers, but it is reported that forthe first time in several years, U.S. exporters were asking and obtainingdomestic prices plus freight.
The strengthening of prices is undoubtedly attributable to theimprovement in demand for potash. Nevertheless, it seems unlikely thatprices will fall below the level reached before the recent increases.There is no indication that the cost of bringing in new capacity or pro-duction costs are declining. Indeed, the difficulty encountered by theCanadian producers have shown that Canadian production is likely to becostlier than was anticipated. Once the new North American capacity sche-duled for completion in 1962 comes in, there may be some weakening in prices,but, on the basis of their record, the North American producers seem morelikely to build up stocks and cut back production than to imperil the pricestructure by pushing their exports too aggressively. Further expansionwill probably wait on the growth of demand.
Although figures on the costs and profits of the European pro-ducers are not available, figures on British prices suggest that the DeadSea Works should be easily able to compete at present prices. The studyof the British potash industry by the Monopolies Commission, published July1959, brought out that the price c.i.f. U.K. ports charged by Potash, Ltd.,the leading importer of potash into Great Britain consisted of the followingitems: 1) the price paid to the supplier (f.o.b. or f.a.s.); 2) freight,insurance, dock charges, etc*; and 3) Potash Ltd.'s margin (I4% of thec.i.f. selling price).
Figures submitted to the Monopolies Commission by Potash, Ltd.showed that in January-April 1958, its buying price was lower than thedomestic price charged to the most favored buyers in France by $3.97 per tonand in West Germany by $3.70 per ton. Only in Spain which accounts for lessthan 10% of the total potash output of Western Europe did Potash, Ltd.'sbuying price exceed the domestic price charged to the most favored buyer(by $1.40 per ton). Potash, Ltd.ts arrangements with the suppliers ensurethat its buying price is as low as that of any other foreign purchaser ofpotash; the contracts specify that the suppliers shall not have sold potashsalts for shipment during the relevant season to other European countriesat prices below those mentioned in the contracts, and provide that if salesshould take place at lower prices to other European countries, the pricesto Potash, Ltd. would be reduced accordingly. Moreover, in order to competewith East German potash, Potash, Ltd. has been granting increasingly largerebates for quantity purchases.
/ The proposed increases amount to 2.5¢ per unit K20 only for purchasesmade in the main purchasing months. Only 2¢ per unit K20 increaseswere proposed for the other months of the year.

ANNEX 2Page 17
Thus, British prices appear to have been as low in 1958/59 as theprices in any other Western European countries (allowing for differences infreight). In 1958/59, the Monopolies Commission estimated that the Britishprice of potash was about $42.25 per long ton.
Gross price of potash (60% K20) in bulk,c.i.f. ports of entry L47.74
Less seasonal reductions ($1.12-3.36 per ton) Ave. 2.00Quantity rebates ($2.10 per ton for 200-599 tonsK20 to $5.88 per ton for 125,000 tons X20 andover) Est. 3.50
$42. 24
Based on past experience, the charges for freight from Israel toGreat Britain, insurance and unloading, etc., should not run over $10 perton. On this basis, Dead Sea potash could have competed in British marketsirn 1958/59 (and since British prices are as low as prices in any otherEuLropean country) if sold at around $30 per ton f.o.b. Current prices are,of course, higher. It seems unlikely that potash prices will fall belowthe 1958/59 level.
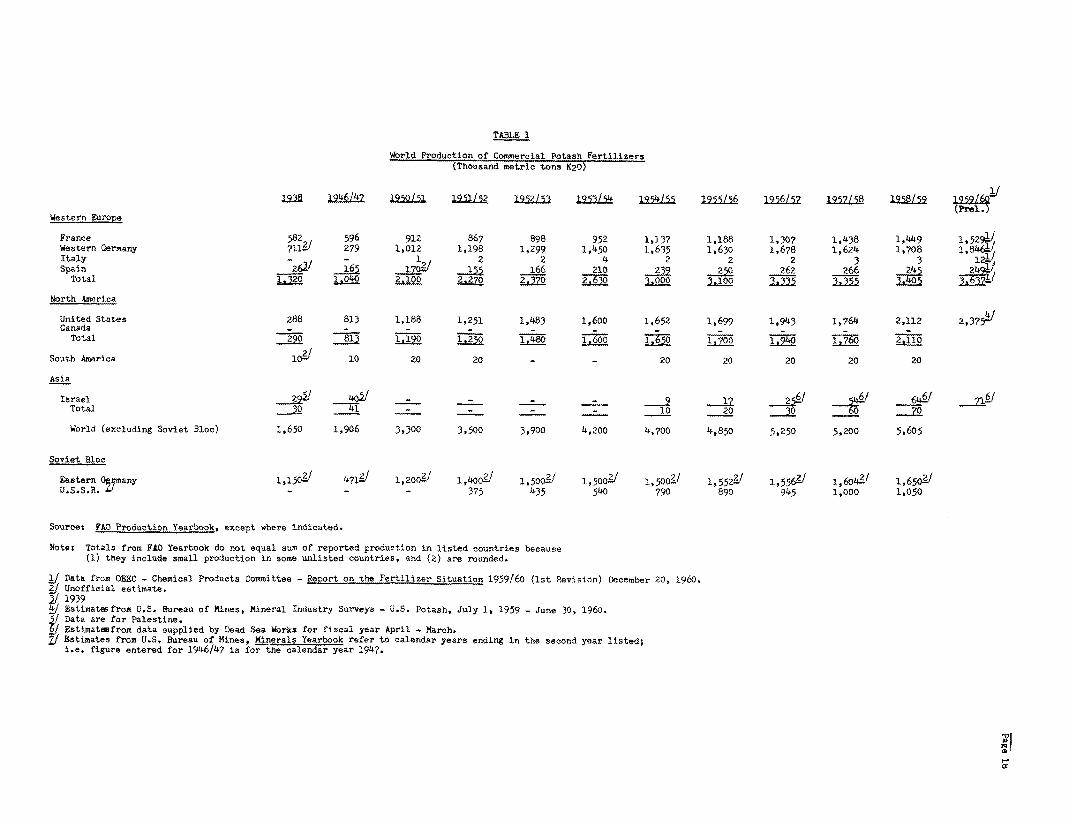
TABLE 1
World Production of Commercial Potash Fertilizers(Thousand metric tons K201
19_V 1946147 19S0L51 19S2 1952L53 1953/54 1954/51sis7 1 19571/5 195759 52
Western Europe
France 582 596 912 867 898 952 1,137 1.188 1,307 1,438 1,449 1,5291/
Western Germany 7112_ 279 1,012 1,198 1,299 1,450 1,635 1,630 1,678 1,624 1,708 1,8461/
Italy - - 1 2 2 4 2 2 2 3 3 121!
Spain 262! 16 5 ,2 166 210 39 25 262 2664
Total WT2 1.Z40 L2.100 2.270 2.370 230 3.000 3.100 8
North America
United States 288 813 1,188 1,251 1,483 1,600 1,652 1,699 1,943 1,764 2,112 2,375k4
Canada - - - - - -___
Total 290 81, 1940 1 05- 1,940_2LI 1.0
South America 10/ 10 20 20 - - 20 20 20 20 20
Asia
Israel - _6 - -.- l216/
Total - _0 _41 10 20 30 _ __
World (excluding Soviet Bloc) 1,650 1,906 3,300 3,500 3,900 4,200 4,700 4,850 5,250 5,200 5,605
Soviet Bloc
Eastern Ggrany 1,1501 4711/ 1,2001/ 1,40011 1,5009/ 1,5001 1,5002/ 1,5521! 1,556?1 1,6041/ 1,6501/
U.S.S.R. -L I 375 435 540 790 890 945 1,000 1,050
Source, FAO Production Yearbook, except where indicated.
Note: Totals from FAO Yearbook do not equal sum of reported production in listed countries because
(1) they include small production in some unlisted countries, and (2) are rounded.
1 Data from OEEC - Chemical Products Committee - Report on the Fertilizer Situation 1959/60 (lst Revision) December 20, 1960.
2/ Unofficial estimate.j/ 19394/ Estimatesfrom U.S. Bureau of Mines, Mineral Industry Surveys - U.S. Potash, July 1, 1959 - June 30, 1960.
/ Data are for Palestine.Estimatesfrom data supplied by Dead Sea Works for fiscal year April - March.
/ Estimates from U.S. Bureau of Mines, Minerals Yearbook refer to calendar years ending in the second year listed;
i.e. figure entered for 1946/47 is for the calendar year 1947.
WI

TABLE 2
World Consumption of Cou2 rcial Potash ertilizer (exclddi Soyiet Bloc)
Thousand etric tons K2 0
1938 1946/47 1950/51 1951/52 1952/53 1953/54 1954/55 1955/56 1956/57 1957/58 1958/59 !MZ6lWestern Europe
Austria 10 9 27 39 28 37 50 44 69 77 82 84Belgium - Luxembourg 61 74 102 148 137 149 140 154 163 150 158 156Denmark 46 50 103 130 153 152 145 157 169 160 168 175Finland 16 23 31 42 47 52 49 56 70 57 48 512France 306 350 390 411 371 451 493 581 580 685 705 686West Germany 604 3N0W 659 723 771 830 8592/ 847 879 986 1,004 1,046Greece 4 3 10 4 3 6 4J 4 8 7 8 7Iceland - - 1 1 1 1 2 3 2 2 2 2Ireland 8 8&/ 21 20 24 37 38 38 48 52 53 56Italy 18 9 19 26 35 38 47 57 60 69 79 112Netherlands 120 68 155 160 158 162 146 165 152 151 146 153Norvay 22 24 41 45 48 47 48 49 54 44 44 45Portugal 1 5 5 6 3 7 72/ 10 10 10 10 10Spain 28 16 35/- 55 47 75 69 82 85 90 90 78Sweden 55 44 54 63 68 74 83 87 100 85 79 92Switzerland 8 13 13 17 19 19 21 22 22 27 40 40United Kingdom 75 122 230 172 235 256 259 312 343 354 382 432Yugoslavia - _ 4 2 5 _19_ 14 23 2/0 67 101
Total 1,382 1,118 1,900 2.064 2,153 2.412 2.474 2,6 2.840 3,65 2 2
1.25
U.S. and Canada
United States (including Puerto Ricoand Hawaii) 357 780 1,311 1,434 1,578 1,661 1,691 1,701 1,758 1,756 1,892
Canada 21 47 57 66 71 77 75 106 75 77 85M'Total 827 1,368 1.500 9 1.7387 1,.833 12977
Other AmericaMexico and Central America 1 12 25 25 302/ 322/ 31 42 4622 52 532Brazil (lo 7 12 142/ 16 24 41 41 59_/ 59- 59-Other South America 20 19 16 21 27 30 2/ 12/ 3
Total 11 26 57 58 62 77 99 113 136 143 143
Asia
Japan 113 55 93 140 210 325 372 386 450 321 435India (27 (22 (27 (50 3 5 (68 7 8 13 20Other Asia 6 (7 SO 102 86 95
Total 140 77 120 190 260 440 460 S602 550
Africa
Algeria 11 n.a. 16 13 9 122/ 12 13-/ 20 22 n.a,2Union of South Africa 3 3 8 8 9 12- 22 22 20 24 2Other Africa 6 20 6 9 12 26 26 2S 20 34 n.a.
Total 20 02 30 30 30 S 60 6 0 80 80
Oceania
Australia 6 6 8 10 9 13 16 23 22 31 28New Zealand 7 3 7 12 11 20 25 21 18 4
Total 13 9 --- 15 22 20 31 41 44 40 66 -- 62
World (excluding Soviet Bloc) 1,944 2,080 3,490 3,864 4,174 4,690 4,880 5,175 5,469 5,597 5,977
Source: FAO Production Yearbook except where indicated.
]J Data from OEEC - Chemical Products Committee - Report on the Fertilizer Situation 1959/60 (First Revision) December 20, 1960.2/ Estimates by FAO.2! Estimates by IBRD.
-D 2
Ho >e

V TABLE 3 Cutiao etntoExports of Potash Materials from West uera. Countries of Destination
(Thousnd tric t_n)
1950 1951 1952 1953 1954 1955 1956 19 _58 59North America
United States 76.3 !85.9 77.3 46.7 82.6 94.7 104.3 103.0 120.3 155.7Canada 5.8 6.5 5.8 19.6 22.2 33.3 24.6 2o.4 19.6 21.6Puerto Rico - - 10.6 2.7 2.1 2.0 1.2 0 21.1
Total 4 130.1 T I34
Sooth America
Brazil - 11.1 1.7 7 23.5 141.1 30.3 25.2 26.1 15.4Colombia - - - 1.5 9.1 4.5 3.0 - 0.5 -Dominican Republic - 1.S 1 3.0 5.0 6.3
Total - T.7 =7 w 77 T
Austria - 10.8 35.2 43.9 38.2 30.0 26.6 31.4 40.0Belgiu.Luxs%bourg 8.1 17.5 132.0 147.4 134.8 90.9 152.9 150.1 - 124.7 123.1Demark 1.1 51.7 136.7 198.1 228.6 147.1 250.7 209.2 142.7 196.14Greece 7.0 12.0 - - 3.0 2.0 7.3 10.7 2.6 5.0Ireland 1.2 17.5 10.8 17.4 32.7 39.9 29.2 14.2 16.5 25.4Italy 9.1 1.3.5 7.6 25.8 19.7 30.2 37.3 34.1 35.5 34.9Netherland 0.3 6.6 191.9 196.9 214.5 152.5 194.6 167.2 170.7 153.6Norwa - - - 19.4 4.0 6.o 5.2 2.5 8.5 2.8Poland _ _ - - - - - 15.0 - -Swedmn 0.3 - 10.7 56.7 50.y 39.7 65.7 29.8 28.3 26.0Switzerland 6.5 3.3 16.5 19.0 17.5 18.4 23.6 27.0 32.3 28.5United Kingdom 96.2 103.5 114.8 235.8 175.7 199.9 222.0 147.9 189.4 209.2Yugoslavia - - - 8.1 18.1 30.0 43.8 94.7 1.2
Total IW6 95 3.1 79. 1,66n 92. 7 xC
Asia
Cylon 2.6 4.3 0.8 0.9 3.1 6.2 12.1 8.9 10.3 12.6India - 5.4 0.6 2.0 4.8 7.9 12.3 11.4 8.1 6.4Indonesia 4.2 1.5 - 1.8 1.4 3.5 2.4 2.5 2.1 8.2Japan 127.0 85.6 49.7 182.2 191.1 187.0 234.2 138.3 149.1 128.0rorea, Republic of 2.4 - 6.5 - 8.5 15.1 6.o 3.8 7.2 n.a.Malaya - - - 1.0 1.9 3.8 1.7 5.1 5.5 8.2Taiwan - 17.5 _ - 1.2 10.4 5.1 15.7 7.5 19.5Turkey rTotal 13] ± 23;., 7 XB 7
Africa
Federation of Rhodesia and Nyaala ) 1.9 11.9 4.9 10.0 14.5 18.3 13.9 13.5 11.1 13.7Union of South Africa ) * 24.3 25.5 13.2 17.8 18.8
Total I5;12; 0 ;;
Oceania
Anstrall - 2.2 5.6 9.5 8.4 19.9 16.6 21.3 27.4New Zealand 2.7 1.8 15.0 6 1 13.1 18 25.8
Total - . 2 M75 IN 17 94 Other Countries 17.3 18.6 26.7 18.1 37.9 16.9 21.4 40.8 30.4 58.4
Grand Total 367.3 574.2 830.2 1,276.3 1,382.6 1,280.4 1,602.5 1,369.2 1,253.6 1,392.0
Source: U.S. Bureau of Hines, Mionrals yearbook. Cmpiled from Customs Returns of West GerRany.
t/ 1950 snd 1951 include chloride and sulfate only. 1952 through 1959 include crude salts, chloride, sulfate, iagnesiug sulfate end beet ash.
Ii

ANNEX 2Page 21
TABLE 4
Exports of Potash Materials!/ from France, by Countries of Destination(Thousand metric tons
195O 1951 1952 1S 195S 1956 1957 1958
North AmericaUnited States 50.4 67.3 63.8 49.7 26.0 60.4 58.1 50.6 94.5Canada 24.7 19.9 19.0 31.0 10.4 28.8 13.9 27.7 26.1Cuba 9.4 5.6 8.2 - 2.9 - - 13.6 5.2Martinique -_ 70 6.4 5.9Total 84.5 92.9 91.0 80.7 39.3 89.2 79.1 98.2 131.7
South AmericaBrazil 18.8 16.6 15.3 41.6 22.0 11.2 9.9 22.9 17.0Colombia - 1 - 4.7 - - 6.4 2.5
TotaL 18.8 27.4 18.2 41.6 26.7 11.2 9.9 29.3 19.5
EuropeAustria 16.7 16.9 13.0 6.o 7.9 11.6 27.3 26.6 31.5Belgium-Luxembourg 152.9 96.0 168.3 131.0 149.2 115.6 159.4 169.4 194.3Denmark 52.2 25.2 15.3 11.4 12.7 6.4 11.9 53.5 31.0Finland - 8.9 9.2 3.3 3.9 7.1 6.1 3.2 6.6Ireland - - 3.3 30.2 25.6 27.3 33.0 37.0 39.2Italy 31.6 30.3 17.6 22.4 35.2 43.7 52.4 52.8 60.1Netherlands 223.2 177.2 206.4 188.9 139.3 136.3 165.3 131.7 148.5Norway 27.1 11.3 16.0 10.3 11.3 14.3 16.1 15.1 15.2Sweden 44.9 19.7 24.2 69.2 13.6 34.2 37.6 45.2 30.3Switzerland 28.0 27.1 25.2 29.4 30.7 36.9 39.5 49.4 57.2United Kingdom 188.8 155.0 119.6 156.4 234.8 189.5 270.0 253.6 243.8Yugoslavia 0.2 6.5 4.6 8.6 0.1 - 5.0 10.8 -Total 765.7 574.1 622.6 9 iT7F7: 66. 622.8 823.6 87458.0 857.7
AsiaCeylon 12.0 19.2 8.9 21.4 28.2 21.5 23.8 19.3 21.1China (including Taiwan) 6 0 9.1 29.6 28.8 8.22/India 2:.4o/ _ 4.6 9.4 9. 9.4 11.5 5.5Japan 78.2 45.4 54.5 141.2 162.2 144.6 220.3 127.7 169.8Turkey - - -_3 - 10.8 0.6 -Total 98.6 77.8 3-4 1 217.0 185.0 293.9 187.8 204.6
AfricaAlgeria 19.9 22.9 14.8 15.6 19.1 14.9 15.2 16.6 20.5Morocco, Southern Zone - 10.0 8.1 6.9 - 11.1 2.5 4.0 9.4Rhodesia and Nyasaland,Federation of - - - - 2.5 7.3 15.7
Union of South Africa - - 7.9 5.4 3.32 8.0 6.o 15.7 10.4Total 19.9 32.9 30.8 27.9 22.4 33.8 2971 43.7 56.0
OceaniaAustralia ) 25.3 10.1 14.2 8.7 10.7 10.4 7.9 25.3 31.1New Zealand ) 8.6 15.6 8.S 16. .1 15.3 20.3Total 25.3 18.7 29.8 17.2 20.6 2.9 24.9 40. 51.4
Other Countries 64.1 54.2 34.5 41.1 59-5 59.2 62.2 84.1 64.5
Grand Total l.076.8 877.9 890.4 1.042.8 1,049.9 1,028.1 1,319.8 1.331.8 1,385.4
Source: U.S. Bureau of Mines, Minerals Yearbook. Compiled from Customs Returns of France.
If Includes salts, carbonate, chloride and nitrate of potash.2/ Plus Burma.3/ Taiwan only.
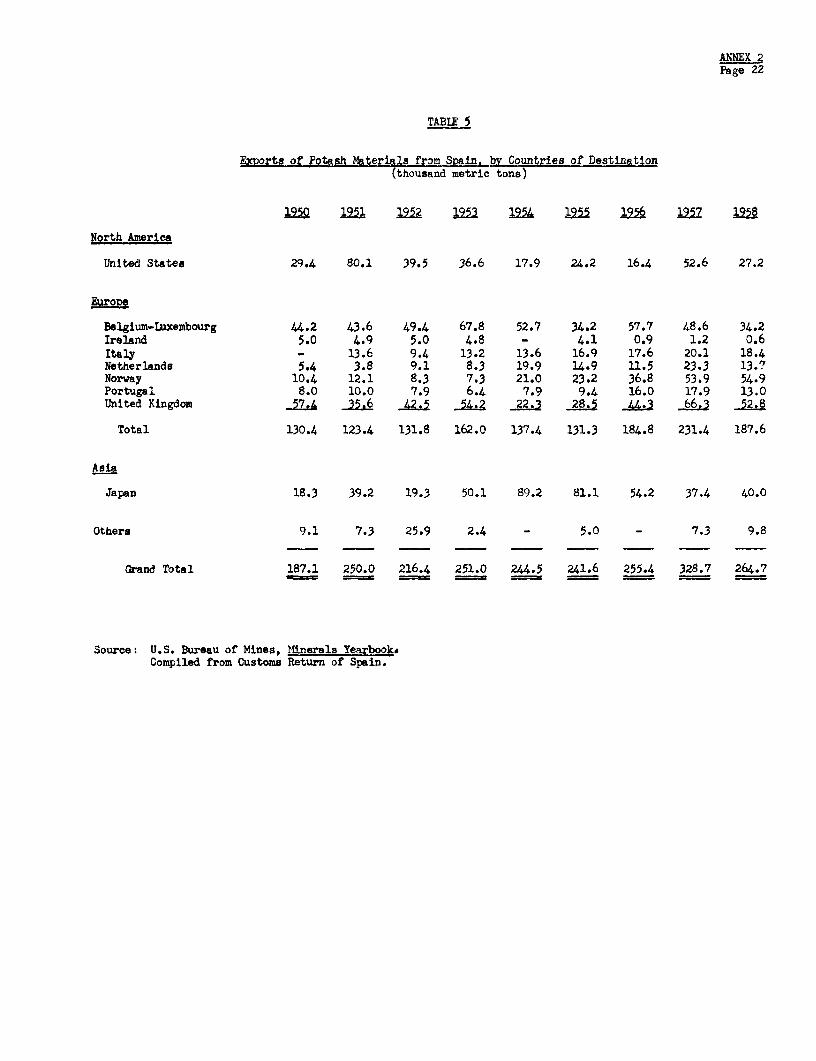
ANNEX 2Page 22
TABLE 5
Exports of Potash Materials from Spain, by Countries of Destination(thousand metric tons)
1950 1951 1952 15 1 1956 1957 1958
North America
United States 29.4 80.1 39.5 36.6 17.9 24.2 16.4 52.6 27.2
Europe
Belgium-Luxembourg 44.2 43.6 49.4 67.8 52.7 34.2 57.7 48.6 34.2Ireland 5.0 4.9 5.0 4.8 - 4.1 0.9 1.2 0.6Italy - 13.6 9.4 13.2 13.6 16.9 17.6 20.1 18.4Netherlands 5.4 3.8 9.1 8.3 19.9 14.9 11.5 23.3 13.7Norway 10.4 12.1 8.3 7.3 21.0 23.2 36.8 53.9 54.9Portugal 8.0 10.0 7.9 6.4 7.9 9.4 16.0 17.9 13.0United Kingdom 57.L.4 36 42.5 54.2 22.3 28.5 L. 66.3 52.8
Total 130.4 123.4 131.8 162.0 137.4 131.3 184.8 231.4 187.6
Asia
Japan 18.3 39.2 19.3 50.1 89.2 81.1 54.2 37.4 40.0
Others 9.1 7.3 25.9 2.4 - 5.0 - 7.3 9.8
Grand Total 187.1 250.0 216.4 251.0 244.5 241.6 255.4 328.7 264.7
Source: U.S. Bureau of Mines, iffnerals Yearbook.Compiled from Customs Return of Spain.

ANNEX 2Page 23
TABLE 6
Exports of Potash Materials from the United States. by Countries of Destination(Thousand metric tons)
195-0 19S-1 22 2 25 2 19_S6 197 95 Y9
North AmericaCanada 63.0 72.3 72.0 66.o 70.5 78.0 90.1 83.7 88.8 73.2Cube 15.4 9.0 10.5 8.4 7.6 19.1 23.8 18.5 16.9 8.9Mexico 4.7 3.5 2.4 2.2 4.4 7.2 7.9 10.0 14.3 15.4Other North America 3-4 I.L 0.9 0.3 1.5 1.3 2i6 2.9 .L 2.0Total 86.5 86.2 84.9 76.8 84.0 105.7 124.3 115.1 123.4 99.5
South AmericaBrasil 14.1 17.6 3.9 o.6 16.0 24.6 20.7 17.0 51.9 52.9Other South America _1_2 3.2 o,8 0.9 1.L 6.L 2.8 7.0 1.1 2.LTotal 17.4 20.8 £4.7 1.6 17.4 29.1 23.5 24.0 53.0 55.3
Europe 0.6 3.4 0.8 0.1 3.4 1.2 o.6 0.7 4.3 12.7
AsiaJapan - - - - 54.6 177.6 257.9 218.2 248.9Korea, Republic of - - - - - 0.1 6.0 6.o 0.3 2.1Philippines 1.0 0.9 0.8 1.4 1.6 0.1 2.4 2.4 13.1 7.5Taiwan 0.1 - - - - - 12.5 - 18.7 25.3Other Asia 0.5 0.5 _0. 0.1 0.1 0.1 0.7 0.1 0.1 0.1Total 1.6 1.4 0.9 1.5 1.7 54.9 199,2 266.5 250.3 283.9
AfricaUnion of South Africa - 0.3 0.1 - - 0.1 - - 16.2 23.0Other Africa 0.1Total - 0.3 0.1 - - 0.1 - - 16.3 28.3
Oceania _ 0.2 - - - 17.1 12.8 17.8 12.5 38.8
Grand Total 106.3 112.7 91.5 80.0 106.5 208.0 360.7 424.1 459.6 518.6
Sourcei U.S. Bureau of Mines, Minerals YearbookCompiled from Customs Returns, published by U.S. Bureau of the Census.

ANNEX 2Page 24
TABLE 7
Exports of Potash Materials from Western Europe and the United States(Bulk weight in thousand tons)
1 9 55 1 9 5 6 1 9 5 7 1 9 5 8Western Western Western Western
Markets Europe U.S.A. Europe U.S.A. Europe U.S.A. Europe U.S.A.
Western Europe 1,549 1 2,071 1 2,008 1 1,830 4
No.& So.AmericaU.S. 179 - 178 - 207 - 241 -Canada 62 78 39 90 48 84 46 89Othars 60 57 55 53 83 55 72 88
Total 301 135 272 148 338 139 359 177
AsiaJapan 413 55 508 178 303 258 359 218Other 87 - 127 22 107 8 76 32
Total 500 55 635 200 410 266 435 250
Africa 77 - 65 - 71 - 85 16
Oceania 42 17 50 13 71 18 91 12
Others 81 - 83 132 _ 104 _
Grand Total 2.550 208 3.177 II6 3.030 424 2.904 460
Notet Exports from Western Europe represent sumof exports from Germany, France and Spain.

ANNEX 2Page 25
TABLE 8
Exports of Potash Materials from Israel(Thousand Metric Tons)
1958/59 1959/60Western Europe
Belgium 2.0 4.3Italy 30.4 39.9Netherlands 7.6 15.7Norway 1.0 -Sweden 0.6 6.9Switzerland 1.0 4.2United Kingdom 13.3 13.0
Total 55.9 84.0
South America 4.5 0.3
Asia
Ceylon 3.2Japan 17.1 11.3Taiwan 10.2 -Philippines - 1.5
Total 30.5 12.8
Africa 1.1 4.3
Australia
Grand Total 92.0 101.4
Source: Data submitted by Dead Sea Works, Ltd.

ANNEX 2Page 26
TABLE 9
Changes in World ConsUmption of Potash, by Regions
Average Annual Increases1952/53-
Consumption 1938 1954/55Average Average to Average to Average1952/53- 1956/57- 1956/57- 1956/57-
1938 19542 55_ 1958/59 1958/59 1958/59(Thousand metric tons K20) (Per cent)
Western EuropeAustria 10 38 76 10.7 19.9Belgium-Luxembourg 61 142 157 4.9 2.5Denmark 46 150 166 6.7 2.5Finland 16 49 58 6.8 4.3Franoe 306 438 657 3.9 10.7West Germany 604 820 956 2.3 3.9Greece 4 5 8 3.5 12.5Iceland - 1 2 - 19.9Ireland 8 33 51 9.7 11.5Italy 18 40 69 6.9 14.6Netherlands 120 155 150 1.11Norway 22 48 47 3.9 -Portugal 1 6 10 12.2 13.6Spain 28 64 88 5.9 8.3Sweden 55 75 88 2.4 4.1Switzerland 8 20 30 6.8 10.7United Kingdom 75 250 360 8.2 9.5Yugoslavia 13 48 - 38.5Total 1,382 2,346 3,020 4.0 6.5
United States and CanadaUnited States (includingPuerto Rico and Hawaii) 357 1,643 1,802 8.4 2.3
Canada 21 74 79 6.8 1.6Total 378 1,718 1,881 8.3 2.3
Other AmericaMexico and Central America 1 31 51 21.3 13.3Brazil ) 10 27 59 15.8 21.5Other South America ) 21 31 10.2Total 11 79 141 13.6 15.6
AsiaJapan 113 302 402 6.5 7.4India ) 27 ) 58 14 ) 7.2 )16.8Other Asia ) ) 949.1
Tcotal 140 360 510 6.7 9.1
AfricaAlgeria 11 11 n.a. - -Union of South Africa 3 14 24 11.0 14.4Other Africa 6 Li n.a. - -Total 20 47 73 6.7 11.3
OceaniaAustralia 6 13 27 7.8 20.0New Zealand 7 19 29 7. 11.1Total 13 31 56 7.6 15.9
Grand Total 1,.944 4,581 5,6l 5.5 5.5

Table 10
Consumption of Potash Fertilizers
l/in Kg. per Ha. of Agricultural Land -
1953/54 1954/55 1955/56 1956/57 1957/58 1958/59 1959/60
Austria 12.8 17.6 15.2 24.0 26.8 28.5 29.6
Belgium 82.0 77.9 85.9 92.0 83.7 88.6 85.9Denmark 51.6 47.5 51.5 55.2 52.3 55.0 57.1France 16.6 18.0 20.2 20.1 23.0 23.7 22.9Germany 58.2 60.2 59.3 61.6 69.3 70.6 73.0Greece 1.0 1.2 1.1 2.1 2.0 2.3 2.0Iceland 25.0 29.7 28.1 28.8 31.9 33.3 28.2Ireland 7.8 8.1 8.0 10.0 11.0 11.0 11.9
Italy 2.2 2.7 3.4 3.5 4.1 4.7 6.6Luxembourg 36.9 33.3 38.6 36.4 40.0 42.8 44.9Netherlands 69.9 63.0 71.7 65.7 65.7 63.4 66.1Norway 47.4 47.0 48.1 53.9 43.2 42.9 44.5Portugal 1.3 1.4 1.7 1.9 1.9 2.2 2.2Spain n.a. 3.0 3.3 3.9 4.1 4.3 3.5Sweden 19.3 21.9 22.6 26.1 22.5 21.6 24.2Switzerland 16.0 17.6 18.5 18.5 22.7 33.7 33.7United Kingdom 20.3 20.4 24.7 27.3 28.2 30.0 34.5
Average OEEC 18.3 18.6 19.6 20.6 19.6 20.1 20.9
United States 4.7 5.0Japan 71.6
1/ Crop land, temporary grassland and permanent grassland, excluding rough grazings.
Source: OEEC - Fertilizers Production, Consumption, Prices and Tradein Europe and U.S.A., 1957-60; Statistical Annexes Reprint,1956-61, FAD, Production Yearbook, 1959 (for Japan).

THE DEAD SEA WORKS, LTD.
Income Forecasts(I '000)
Year ending March 31, 196_1 1962 1963 1964 1965 1966 1967 1968 1ig9 1970
Sales F.O.B. after Selling Commission 8,119 15,592 20,585 21,285 29,385 37,485 41,345 41,345 41,345 57,545Export Premium 2,207 4,239 5,443 5,543 8,177 10,811 12,355 12,355 12,355 17,875Other Income 833 - 176 876 1,385 1 414 1,41 1,414 1 414
Total Revenues 11,159 19,831 26,028 27,004 38,438 49,681 55,11 55,114 55,114
Manufacturing Cost 3,597 8,945 12,109 12,409 15,316 15,316 15,316 15,316 15,316 18,320General Expenses 910 2,000 2,251 2,251 2,881 3,511 3,511 3,511 3,511 4,456Transport Expense 1,860 2,358 3,427 3,436 4,536 6.111 5,904 5,904 5,904 8,415Royalties - - - - 1,408 1,858 2,140 2,140 2,140 3,088Depreciation 2,675 300 3.360 3360 5 770 8,379 8,379 8,379 8,379 9.703
Total Operating Expenses 9,042 16,303 21,1476 29,911 35,175 35,250 35,250 35,250 43,982
Income before Interest and Income Taxes 2,ll7 i 3,528 5,548 8,527 14,506 19,864 19,864 19,864 32,852
Interest and Commitment Fees:5% Debentures (due 2002) 98 98 98 98 98 98 98 98 98 98Bank of America Loan - 360 1,080 1,080 1,080 1,026 810 594 378 162IBRD Loan - 450 1,236 1,914 2,588 2,588 2,542 2,354 2,155 1,944Mortgages 5 4 4 4 3 3 3 2 2 2Short and Medium-term Loans 426 700 268 688 793 577 204 50 50 50Junior Debentures - 589 589 589 589 589 589 589 589 589Government (at 5 3/4% after 1961) 1,194 - - 93 124 124 124 124 124 124Ordinary Shares - 1,013 _1,3 1,350 1,35 ---0
Total Interest Costs 1,723 3,214 4,625 5,816 6,625 5,005 4,370 3,811 2,396Less: Interest Capitalized during Construction - 810 2,316 2.9 3,668 -Interest Charged to Income 1,723 2,404 2,309 2,822 2,957 5,005 47° 3,811 3,396 2,969
Taxable Income 394 1, 2 2,572 2,726 5,570 9,501 15,494 16,468 29,883Corporate Income Tax - - - 108 2,660 4,338 4,495 4,611 11,409
Income after Taxes 394 1,124 2,572 2,726 5,462 6,841 11,156 11,558 11,85? 18,474Plus:
Interest Payment from Dead Sea Magnesite Co. - - - 468 540 497 434 369 300 227Interest Received on Dead Sea Works Cash Balances - 749 1,237 383 137 - -
Net Income 394 1,124 3,321 4,431 6.385 7,475 11,590 11,927 12,157 18,701
Net Income after Taxes plus InterestCharged to Income 2,117 3,528 5,630 7,253 9,342 - - -
Interest Coverage excluding InterestCapitalized 1.2 1.5 2.4 2.6 3.2 - - - -
Net Income after Taxes plus Total Interest 2,117 4,338 7,946 10,247 13,010 12,480 15,960 15,738 15,553 21,670Interest Coverage including InterestCapitalized 1.2 1.3 1.7 1.8 2.0 2.5 3.7 4.1 4.6 7.3
Net Income after Taxes plus Interesti/and Depreciation 4,792 7,338 11,306 13,607 18,780 2C,859 24,339 24,117 23,932 31,373
Debt Service 1/ 2,329 5,042 4,631 5,821 6,631 8,610 9,566 10,735 10,515 10,292Debt Service Coverage/ 2.1 1.5 2.4 2.3 2.8 2.4 2.5 2.2 2.3 3.0
Including interest capitalized during construction.i Includes IE 833,000 transferred from reserves.

M E MA SEA wA)BX. LTD.
Cash nbw Forecats
C*Mtroction
Tear Ending NArch 31, 1 -19s621 5 1966 1 1 12k2 1
not Icow before Interest and Yhooe Taxs 1,264 3,528 4,86 5,548 8,52? 22,484 14,506 19,86 19,864 19,864 32,852laterest received fom Doad Sea Magnesite Co, _ - _ 46B 54 1,008 497 434 369 300 227
naterest roeived on Deposits 749 1,237 383 2 369 137 -Depreciation 2,6,75 3;000 3,360 3,360 5,770 18,16 S,379 8,379 6,)79 8,37g 9,703Proceeda of Short-tern Loan I4,7 - * 4,20 1050 -Proceeds of .edfu-ter% a 1,Sl9 - - _-__Procod of -teg rm 14as 16
covornt ;t 2,078 __ 1,620 4 21IOR _ 91WO 9,000 13,500 13o50° 45,000-Bank of America - 18,000 - 18,000
Increase in 3hare Capital 2?,000 2- 7,000 _ _ _ _Repayment of Loan by Dead Sa Ragswsite W. 484 _44 1.011 1.- _ 3 4 _60 1281
Total Sourees 12,314 60,528 17,990 29*933 30,794 145,331 24,530 29,751 29,751 29,751 44,063
Plied Asse - Project 2,21Z 11,222 21,1?6 z8,856 17,14? 80,613 . _ 10,90? 10,90?Fixed Assts - Anilliary and Other 3,786 4,814 2,400 - . 11,000- - -Fixed Assets - Unrelated to Pro3et 487 - _ _letames t in B tromi Coepowids, Ltd. 540 -
westtent in Dead Sea M&7nesite CO, 88 578 8,622 2,412 _ 11A7001Rhnnig1-in Expenses _ 226 - - 226
quipeent enevis - 500 5°0 500 500 2,00 500 500 500 500 1,000lncrease in Inyantorlee ) 1,263 -_ 1,280 1120 3,663 - . 1,800 -Increase in Required Cash and Reconlables 1,310 3.605 6?3 2,260 5,616 12,134 6,32 1,625 49 2,749 (3,111)Interest nd Comitment Jeeat
5 Debentures due 2002 96 9S ga 98 98 392 98 98 98 g8 98lRD Loan 169 899 1,575 2,251 4,894 2,588 2,588 2,449 2,256 2,051Bank of America loan - 90 1.080 1,080 1,080 3,330 1,080 864 6b 432 216l*rtfac - '4 4 4 3 15 3 3 2 2 2M and Short-term Lean 425 700 268 688 793 2,449 5?7 204 50 50 50Junlor Debtntures 589 589 589 589 2,356 589 589 589 589 589Ooveritunt. 1,194 - - 93 124 217 124 124 124 124 124Ordinary Shares - - 1,013 1,350 1,350 3,713 1,350 _ - -
AsorisationsIND Loan , -190 3,319 3,513 3,718san of America Loan -_ 3,600 3,600 3,600 3,600 3,600
6 5 6 5 6 22 5 6 5 £ 5Conrneent 900 - - - - .. - -9
rAeuction of bediua-tern Debt 600 1,823 _ - 1,823iRction of Current Liabilities 1,206 4,077 - - 4,07? 4,300 3,127 - -InROMe TUAS 108 108 2,660 4,338 4,495 4,611 11,409Arrears on "A' Stares - - 574 574 55? 574 574Dvidenis on Or4nary Shames 2,160 2,160 _ 4,320Divideoe on 'Al Shares - 2,448 2.448 - __ &6
Total Application. 12,314 30,33 37,328 40,790 30,768 145,292 24,569 24,438 32,017 31,811 29,541
Cash Scrpiue for Year 30,225 (19,338) (10,857) 9 (39) 5,313 (2,266) (z,060) 14,522Cah Surplus 4t 8eginmng of Year - 30,2Z5 10,867 30 39 - 5,313 3,047 987Cash Surplus at End of Yaar - 30,225 10,887 30 39 - 5,313 3,047 987 15,509
.TV !~ea amounts in 1961.tJ lInludes It 1,892,00 borrowed in 1961.f Except in 1961, all loans from Goverment ame relending
of interest received oa Junior Debentures.
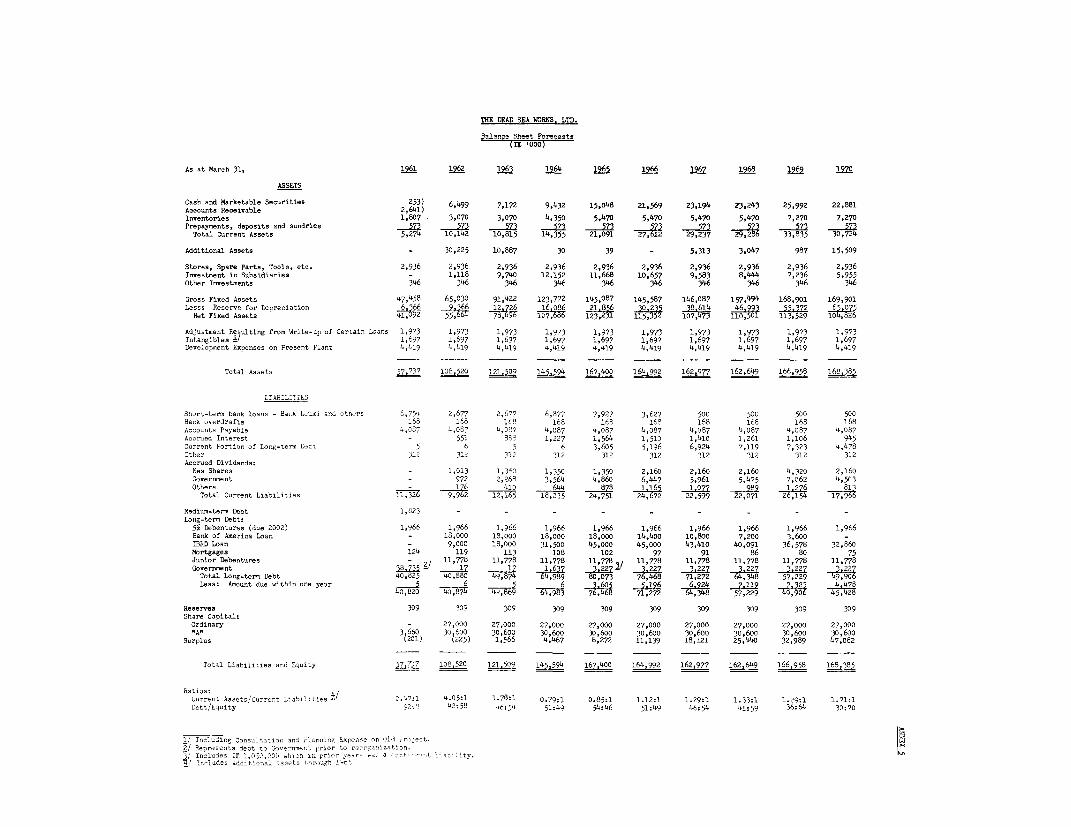
THE DEAD SEA WORKS. LTD.
Balar.ce5he-t Forecast-
As at March 31, 1961 1962 1963 1964 1965 1966 1967 1968 1969 1972
ASSETS
Cash and Marketable Securities 253) 6,499 7,172 9,432 15,048 21,569 23,194 23,243 25,992 22,881Accounts Receivable 2,641)Inventories 1,807 3,070 3,070 4,350 5,470 5,470 5,470 5,470 7,270 7,270Prepayments, deposits and sundries S7_ 573 573 553 S71 573 573 573 __32573Tatal Current Assets 5,274 10,142 10,815 14,355 21,091 27,612 29,237 29,286 333,835
Additional Assets _ 30,225 10,887 30 39 - 5,313 3,047 987 15,509
Stores, Spare Parts, Tools, etc. 2,936 2,936 2,936 2,936 2,936 2,936 2,936 2,936 2,936 2,936Investment in Subsidiaries - 1,118 9,740 12,152 11,668 10,657 9,583 8,444 7,236 5,955Other Investments 346 346 346 346 346 346 346 346 346 346
Gross Fined Assets 47,458 65,230 91,422 123,772 145,087 145,587 146,087 1 5 7 ,494 168,901 169,901Less; Reserve for Depreciation 6,366 66 12,72
616 086 215 38 614 46 5,372 65,079
Net Fixed Assets 41,02 5 5,64 7,69 2 107,473 110,501 113,529 104,826
Adjustment Re ulting from Write-ap of Certain Loans 1,973 1,973 1,973 1,973 1,973 1,973 1,973 1,973 1,973 1,973Intangibles / 1,697 1,697 1,697 1,697 1,697 1,697 1,697 1,697 1,697 1,697Development Expenses on Present Plant 4,419 4,419 4,419 4,419 4,419 4,419 4,419 4,419 4,419 4,419
Total Assets 57.73? 1 121.509 145,594 167.400 164,992 162,977 162,649 166,958 160,389
LIA&ILITThS
Short-term bank loar - Bank Le-.i and other 6,754 2,677 2,677 6,877 7,92? 3,627 500 50i 500 500Banh overdrafts lt3 1h5 lt 168 168 168 168 168 168 168Accounts Payable 4,D1P 4,007 4,037 4,087 4,087 4,087 4,087 4,087 4,087 4,o87Accrued Interest - 551 8&- 1,227 1,564 1,510 1,410 1,261 1,156 945
Current Portion of Lon-t-erm L-ht 6 6 3,605 5,196 6,924 7,119 7,323 4,478Other 3iZ 312 312 112 312 312 312 312 312 312Acoraed Dividends;
Nev Shares _ 1,013 1,350 1,350 1,350 2,160 2,160 2,160 4,320 2,160
Government - 972 2,268 3,564 4,860 6,447 5,961 5,475 7,062 4,503
Others 16 410 644 878 1,16S 1,077 989 1126 el9,96~~~~~~-Y2 .7,71 _
Total Current Liabilities l1,32 9,1 12,165 3 24,75 24, 22,599 22,071 26,154
Median-tern Debt 1,823 - - - - - - - -Long-term Debt:
5% Debentures (due 2002) 1,966 1,966 1,966 1,966 1,966 1,966 1,966 1,966 1,966 1,966Sank of America Loan - 18,002 18,000 18,000 18,000 14,400 10,800 7,200 3,600 -
IBRD Loan - 9,000 18,000 31,500 45,000 45,000 43,410 40,091 36,578 32,860Mortgages 124 119 113 108 102 97 91 86 80 75
Junior Debentures - 11,778 11,778 11,778 11,778 / 11,778 11,778 11,778 11,778 11,778
Government 38.735 2 17 17 1 637 3,227 __1.227 3 227 1 22Z 3,227 3,227Total Long-term Debt 40,825 40,880 49,874 64,989 60,073 76,468 71,272 ,4,348 57,229 49,906
Less: Amount due aithin one year 5 6 S 6 3,605 5.i96 6924 7.119 7,023 4,47840,820 48 4d,89 , 76,468 71,272 64,8 57,229 49,906 45,428
Reserves 309 309 309 309 309 309 309 309 309 309
Share Capital:Ordinary - 27,000 27,000 27,000 27,000 27,000 27,000 27,000 27,000 27,000-Ae 3 660 30 600 30 600 30,600 30,600 30,600 30,600 30,600 30,600 30,600
Surplus N201) ?225) 1,566 4,467 8,272 11,139 18,121 25,440 32,989 47,082
Total Liabilities and D1.ity 57,737 108,520 121,509 145,594 167,400 164,992 162,977 162,649 166,958 168.922
Ratios:Current A-set/C-urre,t Lcbiiltis -/ C.-7:1 4.05:1 1.78:1 0.79:1 0.85:1 1.12:1 1.29:1 1.33:1 1.29:1 1.71:1Onbt/Eq0ity 92; 42:58 4t:54 51:49 54:46 51:49 4c:54 41:59 36:64 30:70
1/ Including Tocc-ltati-c an- rioer - -rg oce in Old. rojoot.2/ Represents debt to iovrcvnmt lior t, ror- ioatOoc.7' Includes Ir ,05: .i1(.hi,h hih pi- i e-rs 0 . -r =-t <croInty.
f/Tncludes arddnri-al I scctc ihroLrgi 1t.
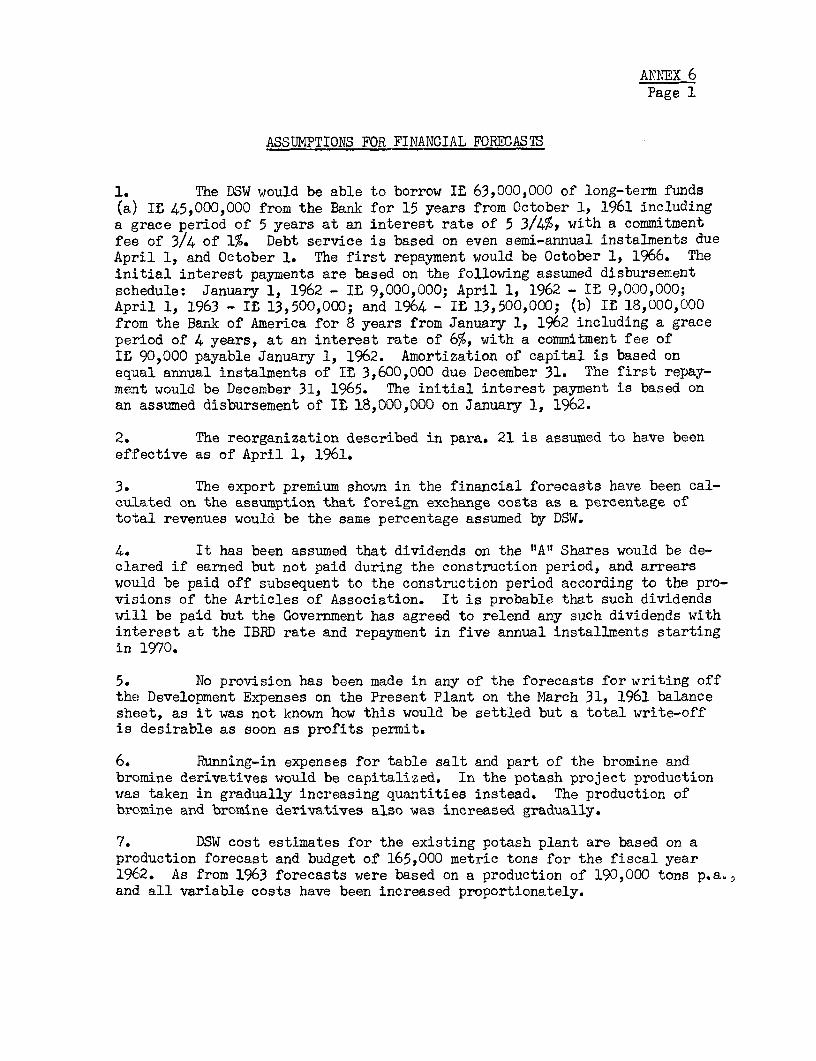
ANNEX 6Page 1
ASSUMPTIONS FOR FINANCIAL FORECASIS
1. The DSW would be able to borrow IL 63,000,000 of long-term funds(a) If, 45,000,000 from the Bank for 15 years from October 1, 1961 includinga grace period of 5 years at an interest rate of 5 3/4%, with a commitmentfee of 3/4 of 1%. Debt service is based on even semi-annual instalments dueApril 1, and October 1. The first repayment would be October 1, 1966. Theinitial interest payments are based on the following assumed disbursementschedule: January 1, 1962 - IL 9,000,000; April 1, 1962 - If 9,000,000;April 1, 1963 - IS 13,500,000; and 1964 - IS 13,500,000; (b) It 18,000,000from the Bank of America for 8 years from January l, 1962 including a graceperiod of 4 years, at an interest rate of 6%, with a commitment fee ofIt 90,000 payable January 1, 1962. Amortization of capital is based onequal annual instalments of IL 3,600,000 due December 31. The first repay-ment would be December 31, 1965. The initial interest payment is based onan assumed disbursement of IL 18,000,000 on January 1, 1962.
2. The reorganization described in para. 21 is assumed to have beeneffective as of April 1, 1961.
3. The export premium shown in the financial forecasts have been cal-cuLated on the assumption that foreign exchange costs as a percentage oftotal revenues would be the same percentage assumed by DSW.
4. It has been assumed that dividends on the "A" Shares would be de-clared if earned but not paid during the construction period, and arrearswould be paid off subsequent to the construction period according to the pro-visions of the Articles of Association. It is probable that such dividendswi;ll be paid but the Government has agreed to relend any such dividends withinterest at the IBRD rate and repayment in five annual installments startingin 1970.
5. No provision has been made in any of the forecasts for writing offthe Development Expenses on the Present Plant on the March 31, 1961 balancesheet, as it was not known how this would be settled but a total write-offis desirable as soon as profits permit.
6. Running-in expenses for table salt and part of the bromine andbromine derivatives would be capitalized. In the potash project productionwaEs taken in gradually increasing quantities instead. The production ofbromine and bromine derivatives also was increased gradually.
7. DSW cost estimates for the existing potash plant are based on aproduction forecast and budget of 165,000 metric tons for the fiscal year1962. As from 1963 forecasts were based on a production of 190,000 tons p.a. ,and all variable costs have been increased proportionately.

ANNEX 6Page 2
8. The estimates of potash production by the new project facilitiesfor the years ending March 31, 1965, 1966, 1967 are 150,000; 300,000 and400,000 tons respectively (37.5%, 75.0% and 100% of new capacity). MAanu-facturing costs and general expenses for the latter two years were takenat the same cost. Royalties were calculated on all products on the basisof 5% of the adjusted (as defined in the concession) ex-works price. Asagreed with the Government, royalties will be charged as from the year 1965.
9. Depreciation allowances calculated by DSW are based on generallyaccepted rates. The overall rate amounts to about 7.7% annually.
10. Transport expenses for potash and magnesia have been assumed tobe It 13 per ton in 1963 and in 1964; If 10.50 in 1965 and 1966 and IS 8.37from 1967 onwards. The decrease in price is assumed due to the increase inquantities and to the improvement of transport facilities and to the expectedinstallations in the then completed port of Ashdod.
11. "Additional Assets" are defined as cash or other assets readilyconvertible into cash, not immediately required in the business.
12. Tonnage sales of ethylene dibromide (EDB) and dibromo-chloropropane(DBCP) are assumed at the same rate as the production tonnages in the fore-casts. However, sales of elemental bromine are assumed at 2,400 tons p.a.with the balance used to produce EDB, DBCP, and 2,000 t.p.a. for the BromineCompounds Plant.
13. Bromine Compounds Company, Ltd., is not consolidated in the fore-casts. DSW's equity investment (through DSB) of IL 540,000 in this subsid-iary is included in funds required by DSW for the project (para. 45). Divi-dends (before payment of corporate tax on the income by BCC) from BCC areincluded in Other Income (Annex 3) in the following amounts (IS '000):1964 - 100; 1965 - 300; 1966 and years thereafter - 800. These amounts areshown before payment of corporate taxes because the tax law permits transfersfrom subsidiaries to parent without corporate tax.
14. DSW's interest in Dead Sea Magnesite Company is not consolidatedin the forecasts. DSW's equity investment of It 2,700,000 and a loan ofIt 9,000,000 (described in 15 below) to the Magnesite Company are includedin funds required by DSW for the project (para. 45). Dividends (beforepayment of corporate tax on the income by Dead Sea Magnesite) from Dead SeaMagnesite are included in Other Income (Annex 3) in the following amounts(IS '000): 1964 - 76; 1965 - 576; 1966 - 585; 1967 and thereafter - 614.
15. The DSW would make a loan of IL 9,000,000 to the Dead Sea MagnesiteCompany for 10 years from October 1, 1961, including a grace period of threeyears, at an interest rate of 6% with no commitment fee. Debt service wouldbe based on even semi-annual instalments due April 1 and October 1. Thefirst repayment date would be October 1, 1964. The initial interest paymentsare based on assumed disbursements of IL 6,588,000 on October 1, 1962 andIL 2,412,000 on April 1, 1963. The interest payments on this loan are shownas a separate item in Annex 3 as the company has an agreement with the Govern-ment that these payments will not be subject to tax.

ANNEX 6Page 3
16. At March 31, 1961, the company had accumulated losses amountingto about It 12 million which can be carried forward for tax purposes. Theforecasts indicate that this amount would exempt the company from any pay-ment of corporate taxes until 1965. After that year the company's corporatetaxes are computed on the basis of the normal 28% rate.
17. Israel also has a 25% income tax on profit declared after deductionof corporate taxes. This tax is distributed between "dividends declared"and'fetained profits" and insofar as the company is concerned, depends uponthe amount of dividends distributed. As an "approved enterprise" the companywill be exempt by law from the payment of the 25% income tax during the"period of benefits", which is normally the five years beginning with thefirst profitable year, but which may be extended. For tax purposes an"approved enterprise" may charge depreciation at two, and in some cases twoand one-half times the normal rate (used in these forecasts) for the firstfive years the facilities are used. As the forecasts indicate the "periodof benefits" for the 590,000 ton potash plant will expire in 1969, the incomefrom that plant (but none of the income from the additional 300,000 tons ofthe second stage) in 1970 is assumed to be subject to the 25% income tax.
18. During the period of construction it was assumed that the cash sur-plus would be deposited with financial institutions, guaranteeing a netinterest rate of 5 3/4% after taxes and linking the principal to the U.S.dollar or to other indices. It was further assumed that the interest wouldbe paid, after the close of the fiscal year, on the average balance ondeposit during the fiscal year.
19. The prices of all products except for potash from the existingplant were taken at approximately 10% below their present level. The priceof potash from the existing plant 190,000 t.p.a. was taken at $33 per tonfob (present price), whereas the additional quantities from the new projectare taken at $30 per ton. The price is equalized from 1966/67, when thefull quantities of potash from the new project are available.
20. Costs of production of existing plants (i.e. existing potash plantand bromine plant) include 7.5% contingency for an expected rise in thelevel of costs within the coming year and further contingency of 6% to coverprobable future increases. Costs of production in the new plants (potash,salt and magnesia) include a 6% contingency only.
21. It has been assumed that a further increase in potash productionin the new project (additional 300,003 t.p.a.) will be possible in 1970 aftertwo years of construction. The cost of this additional expansion is esti-mated at IS 26,300,000 which the forecast indicates should be available fromthe company's own funds provided no dividends are paid on 1968 income.
22. The sales of potash include about 6,000 tons sold on the localmarket at prices slightly higher than those assumed for external sales andalso includes about It 200,000 from sales of industrial salt produced in thepresent plant.
ANMEX 6Page 4
23. In general, working capital requirements, which were originallycalculated cm the basis of needs for cash, receivables and inventories, arenow based on the production costs (excluding depreciation) of the followingnumber of weeks of annual production: potash - 18; table salt - 16;bromine and derivatives - 6; and magnesia - 8.
24. The repayment of short-term borrowings in 1966 and 1967 is assumedto be made at the end of the year.
25. Interest on bank overdrafts has not been included in the forecasts.
26. Dividend payments at the rate of 8% on share capital have beenassumed on earnings in 1966 and thereafter, except in 1968 in order to meetthe costs of expansion wholly from self-generated funds.

UNITED ARAB REPUBLIC
X._._ 2 \
2t a
0~~~~~~~~~~~~~~~~~~~~~~~~~~~~~~~~~~~~~~~~~~~~~~~~~~
6~I '-E:

/z
ISRAEL
DEAD SEA WORKS LTD.PRESENT AND ROPOSED LAYOUT
OF PAN AREA s
=PRMOJECT PAN AREA
Sdo ?O -,i,l pAf
TLAIVR E Og,~o
40 DEAD W
~~~~~~~~~..' e..............
; ADimono | 1 5 ~~~~~~~~FeedmgCn .. J ~~~~~~~~~~~~~to e.'stmo cgs }<
'. I SfRA E L eeonf . ...Dee Sea
I UeveleoentEnc
Potash rerme,rY Js / W ~RESENT PAN AREA
MAY 19S. ORD-69ORO