public disclosure authorized zambia economic...
TRANSCRIPT
DECEMBER 2017 ISSUE 10
ZAMBIA ECONOMIC BRIEFHOW ZAMBIA CAN
BORROW WITHOUT SORROW
Pub
lic D
iscl
osur
e A
utho
rized
Pub
lic D
iscl
osur
e A
utho
rized
Pub
lic D
iscl
osur
e A
utho
rized
Pub
lic D
iscl
osur
e A
utho
rized
HOW ZAMBIA CAN BORROW
WITHOUT SORROW
1 0 t h Z A M B I A E C O N O M I C B R I E F
D e c e m b e r 2 0 1 7
@ 2017 The International Bank for Reconstruction and Development/THE WORLD BANK1818 H Street NWWashington, DC 20433USA
All rights reserved.
This report was prepared by the staff of the Macroeconomic and Fiscal Management Global Practice of the World Bank Group. The findings, interpretations, and conclusions expressed herein are those of the authors and do not necessarily reflect the views of the World Bank’s Board of Executive Directors or the countries they represent.
Cover design: Katarina ZeravicaPhotos: World Bank, Zambia and stock images

ICONTENTSAcronyms iForeword iiAcknowledgements iii
Executive Summary 1
Section 1: Recent Economic Developments 4A. Regional Economic Developments 4B. The State of the Zambian Economy 7C. Economic Outlook, Risks and Policy Challenges 17
Section 2: How Zambia Can Borrow Without Sorrow 19D. How much debt does Zambia have and is it too much? 22E. How well is the debt managed? 29F. How well has the debt been invested? 31G. Ideas to borrow without sorrow 34
Endnotes 36
Boxes1 Inflationandexchangeratedynamics 132 Government’s payment arrears 143 Progress with Zambia Plus 164 Emerging risks from frontier market access to capital markets 215 How will the Eurobonds be paid back? 286 DebtManagementOffice 307 Essential features of a PIM system 318 Have roads been completed at reasonable cost in 2011-16? 33
Figures1 Commodity prices have picked up in 2017 52 Eurobond spreads have narrowed in 2017 63 SSA Growth has picked up 64 All sectors of the economy are growing, but only slowly 75 Copperpriceshavefirmedin2017 86 Trade levels have improved in 2017 107 The rise and fall of the kwacha in 2017 108 Inflationremainswithintarget 119 Inflationhasremainedwithinthetarget(6-8%) 1110 Lending rates have remained high 1211 Publicsectorexternaldebt 2012 Public sector debt 2313 Externalpublicdebtdrivers 2414 Government securities auction yields 2515 Externaldebtsustainabilityanalysis 2616 Eurobond amortization 2717 Rising debt service costs 28
1 0 t h Z A M B I A E C O N O M I C B R I E F - H O W Z A M B I A C A N B O R R O W W I T H O U T S O R R O W
Tables1 Quarterly GDP 82 Private sector credit growth remains subdued in 2017 123 Fiscal Trends 134 Key Macroeconomic Data 175 Measuring Public Debt 226 Government Securities Outstanding 247 Eurobonds 2012 to 2015 32
AfDB African Development BankBoZ Bank of ZambiaCEMAC Central African Economic and Monetary CommunityCSO Central Statistical OfficeDEMPA Debt Management Performance AssessmentsDfID Department for International DevelopmentDMO Debt Management OfficeDRC Democratic Republic of CongoDSA Debt Sustainability AnalysisGDP Gross Domestic ProductGRZ Government of the Republic of ZambiaHIPC Heavily Indebted Poor CountriesIFMIS Integrated Financial Management Information SystemIMF International Monetary FundLCMS Living Conditions Monitoring Survey LIC Low Income CountryMoF Ministry of FinanceMoNDP Ministry of National Development PlanningMPC Monetary Policy CommitteeMPSAs Ministries, Provinces and Government Spending AgenciesNPL Non-performing LoansPAYE Pay As You EarnPFM Public Financial ManagementPIM Public Investment ManagementPPP Public-Private PartnershipsPPP Purchasing Power ParitySME Small and Medium EnterpriseSSA Sub-Saharan AfricaSOE State Owed EnterprisesUS$ United States DollarVAT Value Added TaxZEITI Zambia Extractive Industries Transparency InitiativeZMW Zambian Kwacha7NDP Seventh National Development Plan
IACRONYMS
1 0 t h Z A M B I A E C O N O M I C B R I E F - H O W Z A M B I A C A N B O R R O W W I T H O U T S O R R O W
i
I am pleased to share the tenth Zambia Economic Brief with a focus section on sustainable borrowing and improved debt management. This Brief is part of a series of short economic updates produced twice a year by the World Bank.
Each Brief includes two sections: the World Bank’s assessment of recent economic developments and the outlook in the short to medium term, and its analysis of a specific development topic or theme. Previous Briefs covered opportunities for improving revenue collection, public expenditure, agriculture, the power sector, mining, jobs, trade, and finan-cial inclusion. These can all be found on the World Bank’s Zambia website.
Zambia’s economy has picked up slightly in 2017 from the tougher conditions of 2015 and 2016. Cop-per prices have firmed and the economy is on the mend, but big challenges remain with higher and more risky debt levels. Bold actions are needed to ensure a more sustainable path.
We also see that the past decade of growth was not sufficiently pro-poor and the benefits have accrued mainly to the richer segments of the population in urban areas. Poverty remains far higher for the ru-ral population than their urban counterparts, and
income growth between 2006 and 2015 was great-est among those with higher incomes and relatively weak for those with lower incomes. There remains a need to look closely at ways to improve debt man-agement to ensure that economic growth has sus-tainable foundations and that borrowed money is invested wisely to ensure inclusive growth.
We hope that the findings of this Economic Brief will stimulate a healthy debate around these questions so that Zambia can shift to a path of more inclusive growth.
Ina-Marlene RuthenbergCountry Manager for Zambia
The World Bank
IFOREWORD
1 0 t h Z A M B I A E C O N O M I C B R I E F - H O W Z A M B I A C A N B O R R O W W I T H O U T S O R R O W
ii

The tenth Zambia Economic Brief has been prepared by Gregory Smith, Zivanemoyo Chinzara and Lars Jes-sen (World Bank).
Jeff Chelsky, Emre Balibek, Sebastien Dessus and Collins Chansa (World Bank), Alfredo Baldini (IMF), and An-nelies Raue (DFID) all provided very useful comments. The report was edited, and the layout and front cover was designed by Katarina Zeravica.
Paul Noumba, the Zambia Country Director; Ina-Marlene Ruthenberg, the Zambia Country Manager; Mathew Verghis, Practice Manager for the Macroeconomic and Fiscal Management Global Practice; and Sebastien Dessus, Program Leader for Zambia, provided overall guidance. Carlyn Hambuba and Sombo Samunete led the dissemination activities with support from Gebisa Chisanga and Hellen Mungaila.
IACKNOWLEDGEMENTS
1 0 t h Z A M B I A E C O N O M I C B R I E F - H O W Z A M B I A C A N B O R R O W W I T H O U T S O R R O W
iii

Regional economic developmentsEconomic recovery continued in Sub-Saharan Africa (SSA) in the second half of 2017 following a slump in 2015 and 2016. Growth is forecast to increase to 2.4% in 2017 from 1.3% in 2016, but will remain below population growth (2.7%). Recovery is under-pinned by improved global conditions for growth and easing domestic constraints. In most metal-ex-porting countries, growth remains below the long-term trend, but economic activity has improved driven by higher metal prices and the recovery of the agriculture sector.
SSA GDP growth is expected to reach 3.2% in 2018 and 3.5% in 2019, but remains insufficient to make a sizeable reduction in poverty. The medium-term outlook assumes a moderate increase in commod-ity prices and the implementation of reforms to ad-dress macroeconomic imbalances. There is a poten-tial upside to the region’s outlook, but the risks are tilted downwards. They include lower than expected commodity prices, faster than expected normaliza-tion of monetary policy in the United States, and a slower pace of economic reforms.
The state of the Zambian economy Despite a bumper harvest, improved electricity gen-eration, and an easing of monetary policy, economic recovery in Zambia has remained subdued in 2017. This follows weak performances of the services, mining and construction sectors, and lower levels of public investment (than in 2013-15). Growth is fore-cast to improve only modestly to 3.8% in 2017, up from 3.6% the previous year.
Following two El-Niño influenced agricultural sea-sons; a heavier and longer 2016-17 rainy season stimulated the agriculture, forestry and livestock sectors. All major crops recorded a bumper harvest, resulting in a 19% increase in overall crop produc-tion. However, the major drags on growth in H1 2017 were wholesale and retail, and financial ser-vices. These two sectors account for over a quar-ter of Zambia’s total GDP, and 40% of the output of the services sector. The wholesale and retail sec-
tor grew by 1.9% in Q1 2017, before contracting by 1.2% in Q2 following low consumer demand and expensive lending rates. The financial sector con-tracted by 3.0% in Q1 and a further 2.5% in Q2 as pressures from the slowdown and tight liquidity of 2016 spilled-over into 2017. The pressure on the fi-nancial sector is clearly illustrated in the build-up of non-performing loans, reaching 12.2% of outstand-ing loans in November 2016.
Over the first quarter of 2017, and helped by higher copper prices, exports increased at a faster pace than imports. This led to a merchandise trade sur-plus in Q1 2017 and narrow trade deficits in Q2 2017. However, temporary copper production dis-ruptions in August and September 2017 led to a fall in exports of 18% in September 2017.
The kwacha has been more stable in 2017, and it strengthened by 10.3% between January 2017 and end-July 2017. However, between August 2017 and November 2017, the kwacha came under renewed pressure and depreciated by 11.9% to ZMW 10.1 per US$. As inflation has been within the Bank of Zambia’s (BoZ) medium-term target range of 6-8% since December 2016, the gradual easing of mon-etary policy (started in November 2016) continued. At its Monetary Policy Committee (MPC) meeting in November 2017, the BoZ reduced the policy rate by 75 basis points to 10.25% and the reserve ratio by 150 basis points to 8.0%. These measures have been aimed at improving liquidity and reducing the cost of BoZ lending to commercial banks. However, lending rates have remained high and constrain pri-vate sector credit growth.
To clean up after fiscal slippages and the build-up of payment arrears in 2016, the government tar-geted a fiscal deficit of 7% (cash basis) in 2017 and issued an economic recovery plan (called Zambia Plus). The intention was to achieve ‘fiscal fitness’ via a well-planned fiscal consolidation alongside struc-tural reforms to boost inclusive growth. Progress in achieving fiscal fitness has been made in some ar-eas in 2017, but in other areas it lags. The expecta-
EXECUTIVE SUMMARY
1 0 t h Z A M B I A E C O N O M I C B R I E F - H O W Z A M B I A C A N B O R R O W W I T H O U T S O R R O W
1
tion is that the actual deficit will be slightly above the target at 7.6% (cash basis). The expectation is also that 2.7% of GDP’s worth of arrears will be cleared by the end of 2017, resulting in the fiscal deficit on a commitment basis reaching 4.9% of GDP.
Medium-term outlookWe forecast GDP growth for 2017 at 3.8%. This is down from our March 2017 forecast (of 4.1%) as the services sector’s recovery has been slower than expected in H1 2017. Reflecting on expectations for improved global conditions and eased domes-tic constraints, we maintain our forecast of 4.3% growth in 2018, and 4.7% in 2019. The outlook is subject to downside risks and the possibility of posi-tive developments. The main external risks are that recent copper price gains reverse and quicker than expected normalization of interest rates in the Unit-ed States would tighten global financing conditions and increase the cost of raising external financing over the medium term. The main domestic down-side risk would relate to delayed fiscal adjustment, which would further weaken the fiscal position, in-crease debt, and further subdue market sentiment.
Zambia can consolidate the gains from improved global and domestic conditions for economic re-covery and build a more inclusive economy. How-ever, to harness these gains, the government needs to take actions to address fiscal-debt issues and to expedite progress with structural reform. Key areas in which to focus efforts are: (i) continue the path of restoring fiscal fitness; (ii) restore investor con-fidence and rebuild reserves; (iii) Improve revenue collection; and (iv) calm down the rate of borrowing and improve debt management.
How Zambia can borrow without sorrowDebt is an important source of development finance, and a key tool for eradicating poverty. Countries all over the world borrow to finance their investment and development. Zambia is no different. There are huge and immediate needs, including that infra-structure must be improved and expanded. Howev-er, the debt needs to be managed carefully and the proceeds of borrowing shrewdly invested. There has recently been an increasing amount of discussion about Zambia’s debt levels. A little over 10 years af-ter a huge debt relief effort, the rapid accumulation of debt has once again put Zambia in the spotlight. Total public sector and publicly guaranteed debt was recorded at 60.5% of GDP (US$13.3 billion) at the end of 2016, up from 35.6% in 2014.
A recent World Bank and IMF debt sustainability analysis puts Zambia at high risk of debt distress, indicating that there are heightened vulnerabilities associated with public debt. This indicates that Zam-bia is accumulating too much debt too quickly and a calmer and more sustainable pace is now required.Zambia had limited borrowing options in the 1990s and early 2000s, and these were linked to cooperat-
ing partners like the World Bank or African Devel-opment Bank. Zambia would know the terms; the loans would be concessional; and support would be given to help design, appraise, and implement the projects. However, now that Zambia is tapping debt capital markets and has many sources of borrow-ing, a new ‘active’ approach to debt management is needed that contrasts with the ‘passive’ approach to debt management since debt relief.
The fact that investors will buy a country’s bonds should not be taken as a signal that an economy is doing well. It could mean that the risks are worth fac-ing for the investor, if the returns are high enough, or that the investor might not know exactly what they are buying if they are investing in indexes. This suggests that opportunities for finance should not be an automatic cause for celebration and signa-tures. Instead, a careful strategy and a more active approach to debt management is required
The environment for public debt management in Zambia has been changing, and will continue to change in the coming years. Access to grants and to funding on concessional terms will reduce, and debt issued on market terms will increase. The bad news is that costs will increase further. The good news is that market borrowing comes with financial choices, i.e. the government can better achieve its preferred debt composition and risk exposure.
The tragedy is not the recent rapid build-up of debt, but the lack of productive assets Zambia can show from the borrowing. The first two Eurobonds were accompanied by a detailed plan on how they would be spent. The third Eurobond had no such plan. Where resources have not been linked to speci-fied investment, it is most likely that they have been used to finance government’s consumption. Most of the resources were earmarked for the transport sector and mainly the road sector. Roads therefore are a good lens through which to assess how well borrowed resources have been invested. Unfortu-nately, when compared to the median cost of paving roads in the region, Zambia’s roads stand out as be-ing very expensive
A new approach, that closely links managing invest-ment and responsible borrowing, is required going forward. The following ideas are provided to sup-port government in meeting these challenges:
Halt the pace at which debt is accumulating: The World Bank and IMF debt sustainability analysis has shifted Zambia to a high risk of debt distress. This assumes that current policies continue and new loans totalling US$3.5 billion are added to the US$4 billion of already contracted debt over the next five years. However, there is another path (the adjustment scenario) in which the government halts the signing of any new non-concessional borrowing, except for a US$282 million government communi-
1 0 t h Z A M B I A E C O N O M I C B R I E F - H O W Z A M B I A C A N B O R R O W W I T H O U T S O R R O W 1 0 t h Z A M B I A E C O N O M I C B R I E F - H O W Z A M B I A C A N B O R R O W W I T H O U T S O R R O W
2

cations project and any issuance with the purpose of reducing the repayment risks or rolling-over the existing Eurobonds.
To take an alternative route, where Zambia shifts back to ‘moderate risk’ of debt distress, the govern-ment could: (i) carry out a full review of the non-concessional loan pipeline; and (ii) reduce refinanc-ing risks of the portfolio by dropping the idea of a sinking fund and instead plan to reduce the cost of borrowing, and extend maturities, by buying back some of the outstanding Eurobond debt in the years prior to their maturity.
Switch from passive to active debt manage-ment: Being ‘active’ means implementing a well-crafted strategy to reduce the cost of borrowing, extend the terms, and diversify the sources of debt funding. The following steps will help achieve this: (i) im-prove and annually update the debt strategy; (ii) complete the reorganization of the debt office; (iii) formulate a debt management reform plan; and (iv) strengthen public investment management.
1 0 t h Z A M B I A E C O N O M I C B R I E F - H O W Z A M B I A C A N B O R R O W W I T H O U T S O R R O W
3
SECT
ION
A. REGIONAL ECONOMIC DEVELOPMENTS
Economic recovery continued in Sub-SaharanAfrica (SSA) in the secondhalf of 2017 following aslumpin2015and2016.Growthisforecasttoincreaseto2.4%in2017from1.3%in2016,butwillremainbelowpopulationgrowth(2.7%).Recoveryisunderpinnedbyimprovedglobalconditionsforgrowth and easing domestic constraints, and is driven by a rebound of the Nigerian and South Afri-can economies. There is a potential upside to the region’s outlook, but the risks are tilted downwards. They include lower thanexpectedcommodityprices, faster thanexpectednormalizationofmon-etary policy in the United States, a slower pace of economic reforms, heightened policy and political uncertainty, and low rains in some parts of the region.
The World Bank’s Africa’s Pulse (October 2017 edition) highlights continued recovery in the SSA region1. In 2016, the region’s growth slumped to 1.3% (the lowest in two dec-ades), following tough global and domestic conditions for growth. However, conditions have improved in 2017, with strong global economic growth, robust global trade, higher prices for oil and metals and easier financing conditions.
Metal prices firmed in 2017 following strong demand from China, and are projected to record a 22% increase in 2017 (figure 1). Similarly, oil prices have also rebounded on strengthened demand and falling stocks, and are expected to be 24% higher than in 2016. Meanwhile, domestic constraints have eased across most of the region, on the back of improved rains, lower and stable inflation and accommodative monetary poli-cies. Domestic developments have boosted agriculture output and consumer demand. Consequently, regional growth is expected to pick up to 2.4% in 2017.
The region’s aggregate growth fluctuations typically mirror events in Nigeria, South Af-rica and Angola – the largest economies that account for more than 60% of the region’s output. As the ‘big three’ economies are emerging from very weak growth in 2016, they have lifted the growth prospects of the region. However, the pace of recovery in Nigeria and South Africa has been much slower than initially anticipated and their recovery re-mains fragile. Accordingly, the region’s growth recovery has been revised down slightly to 2.4% from an earlier projection of 2.6%.
SSA’s 2017 GDP growth will remain below the region’s population growth (2.7%), drag-ging the efforts to reduce poverty. In fact, weak growth has been associated with an increase in the proportion of people living under national poverty lines in both Nigeria and South Africa.
1RECENTECONOMIC DEVELOPMENTS
Robust global trade, higher commodity prices, and easier financing conditions are expected to drive SSA growth in 2017.
SSA’s GDP growth is forecast to remain below population growth in 2017.
1 0 t h Z A M B I A E C O N O M I C B R I E F - H O W Z A M B I A C A N B O R R O W W I T H O U T S O R R O W
4
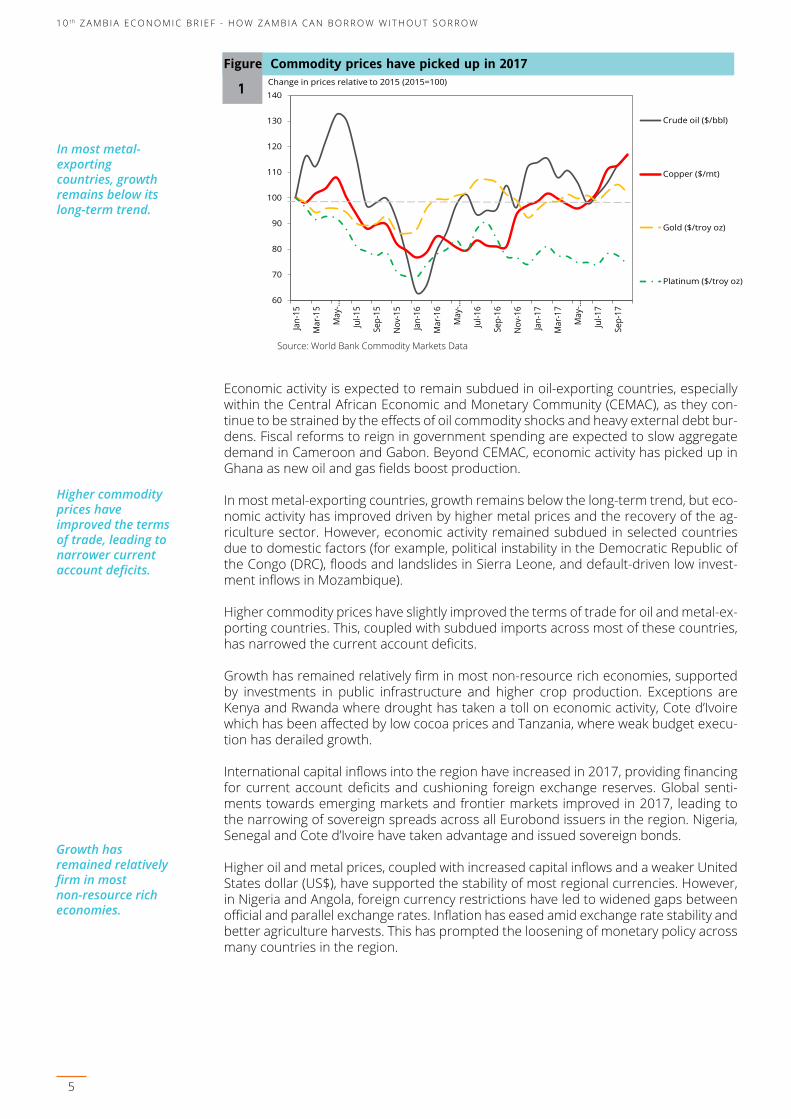
Economic activity is expected to remain subdued in oil-exporting countries, especially within the Central African Economic and Monetary Community (CEMAC), as they con-tinue to be strained by the effects of oil commodity shocks and heavy external debt bur-dens. Fiscal reforms to reign in government spending are expected to slow aggregate demand in Cameroon and Gabon. Beyond CEMAC, economic activity has picked up in Ghana as new oil and gas fields boost production.
In most metal-exporting countries, growth remains below the long-term trend, but eco-nomic activity has improved driven by higher metal prices and the recovery of the ag-riculture sector. However, economic activity remained subdued in selected countries due to domestic factors (for example, political instability in the Democratic Republic of the Congo (DRC), floods and landslides in Sierra Leone, and default-driven low invest-ment inflows in Mozambique).
Higher commodity prices have slightly improved the terms of trade for oil and metal-ex-porting countries. This, coupled with subdued imports across most of these countries, has narrowed the current account deficits.
Growth has remained relatively firm in most non-resource rich economies, supported by investments in public infrastructure and higher crop production. Exceptions are Kenya and Rwanda where drought has taken a toll on economic activity, Cote d’Ivoire which has been affected by low cocoa prices and Tanzania, where weak budget execu-tion has derailed growth.
International capital inflows into the region have increased in 2017, providing financing for current account deficits and cushioning foreign exchange reserves. Global senti-ments towards emerging markets and frontier markets improved in 2017, leading to the narrowing of sovereign spreads across all Eurobond issuers in the region. Nigeria, Senegal and Cote d’Ivoire have taken advantage and issued sovereign bonds.
Higher oil and metal prices, coupled with increased capital inflows and a weaker United States dollar (US$), have supported the stability of most regional currencies. However, in Nigeria and Angola, foreign currency restrictions have led to widened gaps between official and parallel exchange rates. Inflation has eased amid exchange rate stability and better agriculture harvests. This has prompted the loosening of monetary policy across many countries in the region.
In most metal-exporting countries, growth remains below its long-term trend.
60
70
80
90
100
110
120
130
140
Jan-
15
Mar
-15
May-…
Jul-1
5
Sep-
15
Nov
-15
Jan-
16
Mar
-16
May-…
Jul-1
6
Sep-
16
Nov
-16
Jan-
17
Mar
-17
May-…
Jul-1
7
Sep-
17
Crude oil ($/bbl)
Copper ($/mt)
Gold ($/troy oz)
Platinum ($/troy oz)
Change in prices relative to 2015 (2015=100)
Figure Commodity prices have picked up in 2017
1
Source: World Bank Commodity Markets Data
Higher commodity prices have improved the terms of trade, leading to narrower current account deficits.
Growth has remained relatively firm in most non-resource rich economies.
1 0 t h Z A M B I A E C O N O M I C B R I E F - H O W Z A M B I A C A N B O R R O W W I T H O U T S O R R O W
5

Outlook for Sub-Saharan Africa SSA GDP growth is expected to reach 3.2% in 2018 and 3.5% in 2019, but remain insuf-ficient to make a sizeable reduction in poverty. The medium-term outlook assumes a moderate increase in commodity prices and the implementation of reforms to address macroeconomic imbalances. Regional growth recovery reflects a slight pick-up in Ni-geria and South Africa, increased oil and gas production in Ghana, continued recovery and increased investments in metal-exporting economies, and continued investment-led growth in non-resource intensive economies.
The medium-term outlook is subject to both downside risks and a potential upside. On the upside, stronger than expected activity in advanced economies could boost exports demand and increased remittances. On the downside, externally: (i) slowdown in China would reduce commodity prices and heighten imbalances in the region; (ii) quicker and sharper-than-expected normalization of interest rates in the United States could tighten global financing conditions and trigger capital flow reversals. And domestically: (iii) slower domestic reforms to address macroeconomic imbalances could undermine private sector recovery; and (iv) heightened political instability and conflict in the DRC and South Sudan would weigh on growth.
Improved global sentiments towards emerging markets and frontier markets has led to narrower sovereign spreads.
SSA GDP growth is expected to reach 3.2% in 2018 and 3.5% in 2019.
0
250
500
750
1,000
1,250
1,500
Africa Ghana Namibia Nigeria
South Africa Zambia Global
Daily Sovereign Spreads
Figure Eurobond spreads have narrowed in 2017
2
Source: Bloomberg
0%
1%
2%
3%
4%
5%
6%
7%
8%
2011 2012 2013 2014 2015 2016 2017f 2018f 2019f
Zambia
Sub-Saharan Africa
SSA excl. Angola, Nigeria & South Africa
GDP Growth 3
Source: World Bank Africa’s Pulse (2017) Note: f= forecast
Figure SSA Growth has picked up
1 0 t h Z A M B I A E C O N O M I C B R I E F - H O W Z A M B I A C A N B O R R O W W I T H O U T S O R R O W
6
B. THE STATE OF THE ZAMBIAN ECONOMY
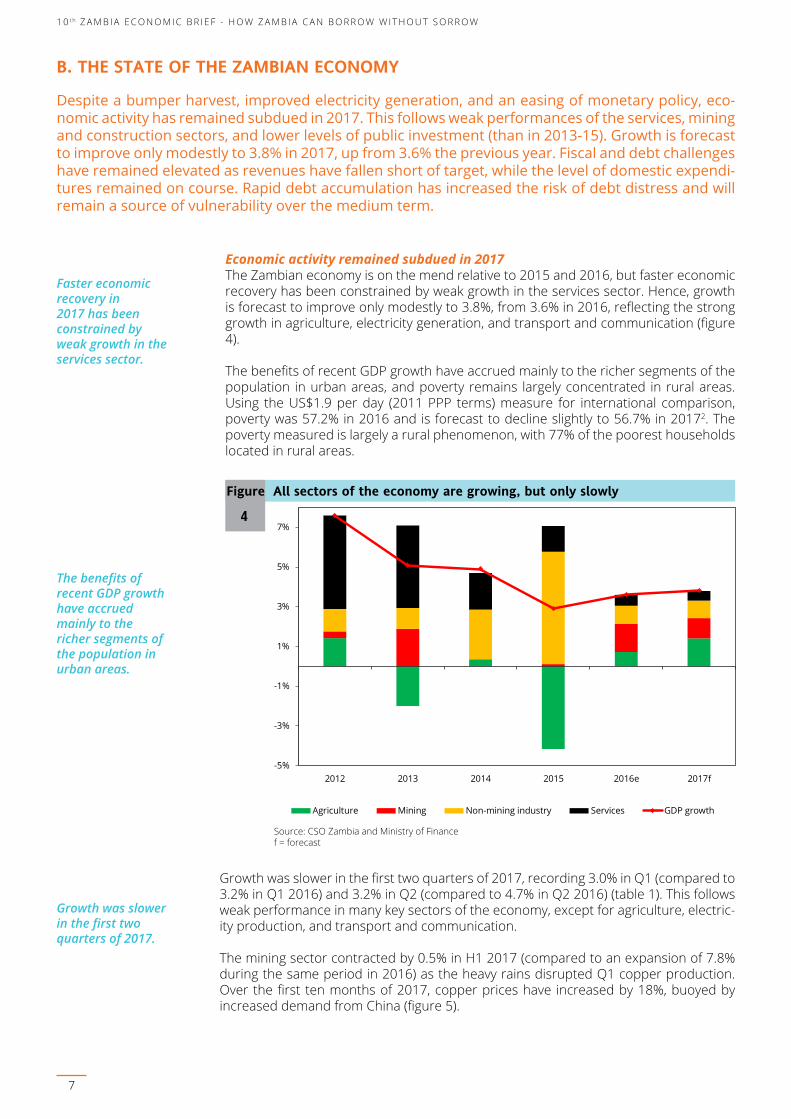
Despite a bumper harvest, improved electricity generation, and an easing of monetary policy, eco-nomic activity has remained subdued in 2017. This follows weak performances of the services, mining andconstructionsectors,andlowerlevelsofpublicinvestment(thanin2013-15).Growthisforecasttoimproveonlymodestlyto3.8%in2017,upfrom3.6%thepreviousyear.Fiscalanddebtchallengeshaveremainedelevatedasrevenueshavefallenshortoftarget,whilethelevelofdomesticexpendi-tures remained on course. Rapid debt accumulation has increased the risk of debt distress and will remain a source of vulnerability over the medium term.
Economic activity remained subdued in 2017The Zambian economy is on the mend relative to 2015 and 2016, but faster economic recovery has been constrained by weak growth in the services sector. Hence, growth is forecast to improve only modestly to 3.8%, from 3.6% in 2016, reflecting the strong growth in agriculture, electricity generation, and transport and communication (figure 4).
The benefits of recent GDP growth have accrued mainly to the richer segments of the population in urban areas, and poverty remains largely concentrated in rural areas. Using the US$1.9 per day (2011 PPP terms) measure for international comparison, poverty was 57.2% in 2016 and is forecast to decline slightly to 56.7% in 20172. The poverty measured is largely a rural phenomenon, with 77% of the poorest households located in rural areas.
Faster economic recovery in 2017 has been constrained by weak growth in the services sector.
Growth was slower in the first two quarters of 2017, recording 3.0% in Q1 (compared to 3.2% in Q1 2016) and 3.2% in Q2 (compared to 4.7% in Q2 2016) (table 1). This follows weak performance in many key sectors of the economy, except for agriculture, electric-ity production, and transport and communication.
The mining sector contracted by 0.5% in H1 2017 (compared to an expansion of 7.8% during the same period in 2016) as the heavy rains disrupted Q1 copper production. Over the first ten months of 2017, copper prices have increased by 18%, buoyed by increased demand from China (figure 5).
-5%
-3%
-1%
1%
3%
5%
7%
2012 2013 2014 2015 2016e 2017f
Agriculture Mining Non-mining industry Services GDP growth
Figure All sectors of the economy are growing, but only slowly
4
Source: CSO Zambia and Ministry of Financef = forecast
The benefits of recent GDP growth have accrued mainly to the richer segments of the population in urban areas.
Growth was slower in the first two quarters of 2017.
1 0 t h Z A M B I A E C O N O M I C B R I E F - H O W Z A M B I A C A N B O R R O W W I T H O U T S O R R O W
7

4,000
4,500
5,000
5,500
6,000
6,500
7,000
45,000
50,000
55,000
60,000
65,000
70,000
75,000
Figure Copper prices have firmed in 2017
5
Source: CSO Zambia and World Bank Pink Sheets
The mining sector contracted by 0.5% in H1 2017 (compared to an expansion of 7.8% in H1 2016).
The higher copper prices and improved electricity supply to the sector were expected to increase copper production in Q3 2017. However, supply disruptions in September 2017 reduced production as a smelter was closed for maintenance by Zambia’s largest copper mining company. Accordingly, copper production contracted by 5.8% in Sep-tember 2017 and copper export volumes fell by 28.8%. Meanwhile, the output of all non-copper minerals increased over the first half of 2017 (for example gemstones by 168% and gold by 7%). Furthermore, disputes between the government and mining firms over increased electricity tariffs and VAT arrears have persisted throughout 2017.
% Growth Q1 Q2 Q3 Q4 Q1 Q2 Q3 Q4 Q1 Q2 Q3 Q4 Q1 Q2
Agriculture, forestry and fishing
1.7 -0.6 -0.2 2.5 -8.5 -7.8 -6.1 -7.7 3.1 -1.0 0.7 -4.8 17.6 15.1
Mining and quarrying 3.5 -10.1 -0.7 -2.4 -4.7 17.1 -2.0 -6.1 8.0 7.5 5.0 7.8 -5.1 4.2Manufacturing 9.7 11.7 0.2 5.1 5.1 1.8 8.7 6.2 1.1 4.4 3.7 1.3 1.8 6.6Electricity 4.1 1.4 0.7 1.7 8.8 7.2 -2.9 -18.9 -15.4 -16.9 -3.2 17.5 25.6 27.1Construction -6.5 15.3 10.7 22.2 37.4 20.5 3.8 15.4 9.1 11.7 14.8 3.3 2.6 5.0Wholesale and retail trade -0.4 6.4 8.8 -0.9 1.8 -1.2 3.7 1.5 0.8 -1.0 -1.4 2.0 1.9 -1.2Financial and insurance activities
7.2 19.4 14.2 19.9 3.7 7.6 21.6 14.9 4.7 4.8 -9.2 -8.2 -3.0 -2.5
GDP at market prices 2.5 5.6 5.5 5.2 4.1 2.6 3.8 1.3 3.2 4.7 3.1 2.7 3.0 3.2
2017f2014 2015 2016eTable Quarterly GDP
1
Source: CSO Zambia Note: e = estimate. f = forecast
The construction sector recorded only sluggish growth in Q1 2017, after ten successive quarters of expansion. It grew by only 2.6% in Q1 2017 (compared to 9.1% in Q1 2016) and by 5.0% in Q2 2017 (compared to 11.7% in Q2 2016). Slow construction activity reflects disruptions caused by a long rainy season and reduced public investment rela-tive to 2013-15. Further, many construction firms are struggling because of delays in payment from the government for completed works (especially in the roads sector) and delays in receiving VAT refunds.
Manufacturing sector performance improved in H1 2017 when compared to 2016. It expanded by 1.8% in Q1 2017 (compared to 1.1% in Q1 2016) and 6.6% in Q2 2017 (compared to 4.4% in Q2 2016) on the back of reliable energy supply.
Following two El-Niño influenced agricultural seasons; a heavier and longer 2016-17 rainy season stimulated the agriculture, forestry and livestock sectors. All major crops recorded a bumper harvest, resulting in a 19% increase in overall crop production.3
Meanwhile, livestock and fisheries production increased in H1 2017 due to increased
Supply disruptions in September 2017 reduced production as a smelter was closed for maintenance.
1 0 t h Z A M B I A E C O N O M I C B R I E F - H O W Z A M B I A C A N B O R R O W W I T H O U T S O R R O W
8
Many construction firms are struggling because of delays in payment from Government for completed works.
A heavier and longer 2016-17 rainy season stimulated the agriculture, forestry, and livestock sectors.
The major drags on growth were wholesale and retail, and financial services.
demand, better disease control, an increased number of farmers venturing into live-stock production, and better enforcement of regulations related to combating illegal fishing4.
The major drags on growth in H1 2017 were wholesale and retail, and financial ser-vices. These two sectors account for over a quarter of Zambia’s total GDP, and 40% of the output of the services sector. The wholesale and retail sector grew by 1.9% in Q1 2017, before contracting by 1.2% in Q2 following low consumer demand and expensive lending rates (figure 10). The sluggish demand follows lower real incomes (after the eco-nomic slowdown of 2015-16) and higher prices of goods and services (following from the higher inflation in 2016).
The financial sector contracted by 3.0% in Q1 and a further 2.5% in Q2 as pressures from the slowdown and tight liquidity of 2016 spilled over into 2017. The pressure on the financial sector is clearly illustrated in the build-up of non-performing loans (NPL), reaching 12.2% of outstanding loans in November 20165. Further, many firms supply-ing government have experienced cash flow issues as they have not yet been paid for goods and services delivered in 2016. Government’s payment arrears have also con-tributed to the build-up on NPLs (discussed below).
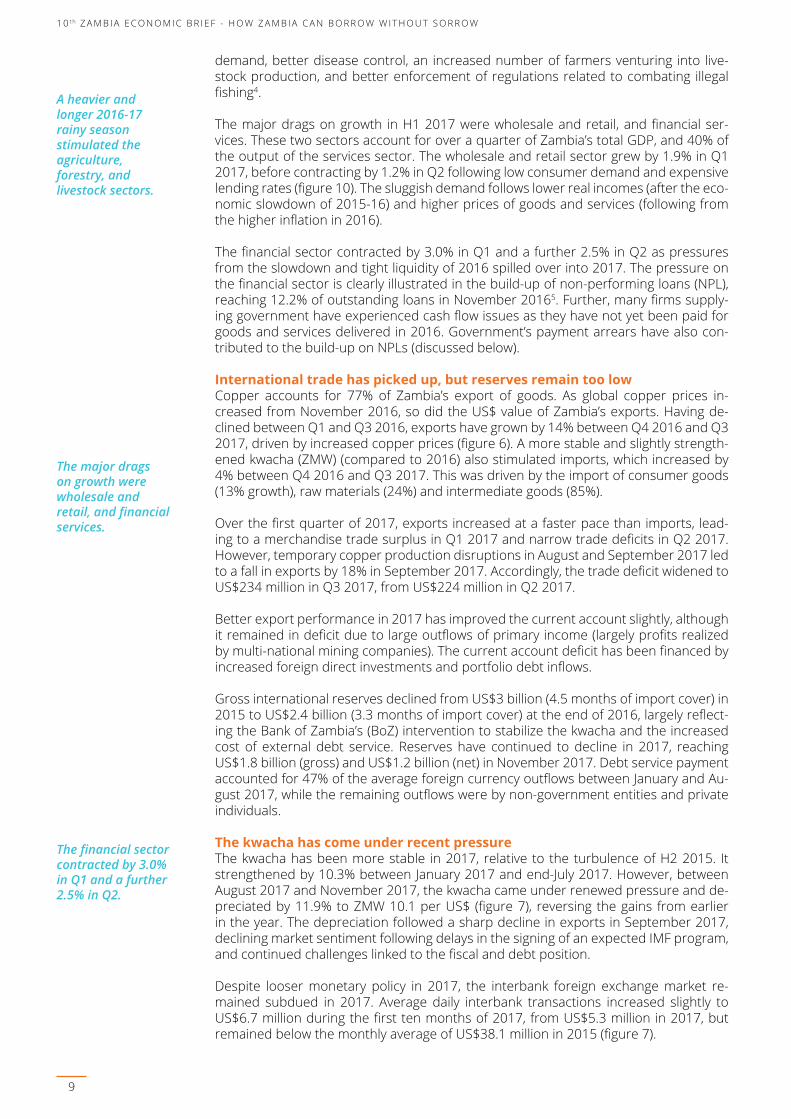
International trade has picked up, but reserves remain too low Copper accounts for 77% of Zambia’s export of goods. As global copper prices in-creased from November 2016, so did the US$ value of Zambia’s exports. Having de-clined between Q1 and Q3 2016, exports have grown by 14% between Q4 2016 and Q3 2017, driven by increased copper prices (figure 6). A more stable and slightly strength-ened kwacha (ZMW) (compared to 2016) also stimulated imports, which increased by 4% between Q4 2016 and Q3 2017. This was driven by the import of consumer goods (13% growth), raw materials (24%) and intermediate goods (85%).
Over the first quarter of 2017, exports increased at a faster pace than imports, lead-ing to a merchandise trade surplus in Q1 2017 and narrow trade deficits in Q2 2017. However, temporary copper production disruptions in August and September 2017 led to a fall in exports by 18% in September 2017. Accordingly, the trade deficit widened to US$234 million in Q3 2017, from US$224 million in Q2 2017.
Better export performance in 2017 has improved the current account slightly, although it remained in deficit due to large outflows of primary income (largely profits realized by multi-national mining companies). The current account deficit has been financed by increased foreign direct investments and portfolio debt inflows.
Gross international reserves declined from US$3 billion (4.5 months of import cover) in 2015 to US$2.4 billion (3.3 months of import cover) at the end of 2016, largely reflect-ing the Bank of Zambia’s (BoZ) intervention to stabilize the kwacha and the increased cost of external debt service. Reserves have continued to decline in 2017, reaching US$1.8 billion (gross) and US$1.2 billion (net) in November 2017. Debt service payment accounted for 47% of the average foreign currency outflows between January and Au-gust 2017, while the remaining outflows were by non-government entities and private individuals.
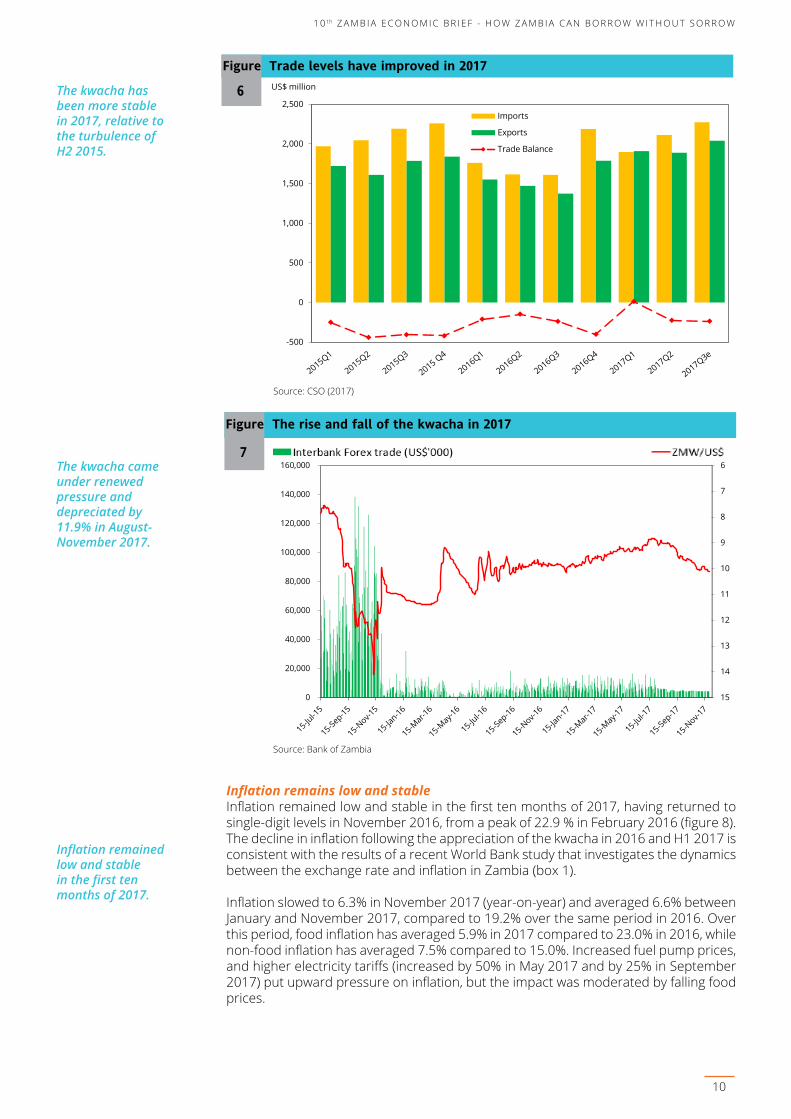
The kwacha has come under recent pressure The kwacha has been more stable in 2017, relative to the turbulence of H2 2015. It strengthened by 10.3% between January 2017 and end-July 2017. However, between August 2017 and November 2017, the kwacha came under renewed pressure and de-preciated by 11.9% to ZMW 10.1 per US$ (figure 7), reversing the gains from earlier in the year. The depreciation followed a sharp decline in exports in September 2017, declining market sentiment following delays in the signing of an expected IMF program, and continued challenges linked to the fiscal and debt position.
Despite looser monetary policy in 2017, the interbank foreign exchange market re-mained subdued in 2017. Average daily interbank transactions increased slightly to US$6.7 million during the first ten months of 2017, from US$5.3 million in 2017, but remained below the monthly average of US$38.1 million in 2015 (figure 7).
1 0 t h Z A M B I A E C O N O M I C B R I E F - H O W Z A M B I A C A N B O R R O W W I T H O U T S O R R O W
9
The financial sector contracted by 3.0% in Q1 and a further 2.5% in Q2.
The kwacha has been more stable in 2017, relative to the turbulence of H2 2015.
6
7
8
9
10
11
12
13
14
150
20,000
40,000
60,000
80,000
100,000
120,000
140,000
160,000
Figure The rise and fall of the kwacha in 2017
7
Source: Bank of Zambia
Inflation remained low and stable in the first ten months of 2017.
Inflation remains low and stable Inflation remained low and stable in the first ten months of 2017, having returned to single-digit levels in November 2016, from a peak of 22.9 % in February 2016 (figure 8). The decline in inflation following the appreciation of the kwacha in 2016 and H1 2017 is consistent with the results of a recent World Bank study that investigates the dynamics between the exchange rate and inflation in Zambia (box 1).
Inflation slowed to 6.3% in November 2017 (year-on-year) and averaged 6.6% between January and November 2017, compared to 19.2% over the same period in 2016. Over this period, food inflation has averaged 5.9% in 2017 compared to 23.0% in 2016, while non-food inflation has averaged 7.5% compared to 15.0%. Increased fuel pump prices, and higher electricity tariffs (increased by 50% in May 2017 and by 25% in September 2017) put upward pressure on inflation, but the impact was moderated by falling food prices.
-500
0
500
1,000
1,500
2,000
2,500Imports
Exports
Trade Balance
US$ million
Figure Trade levels have improved in 2017
6
Source: CSO (2017)
1 0 t h Z A M B I A E C O N O M I C B R I E F - H O W Z A M B I A C A N B O R R O W W I T H O U T S O R R O W
10
The kwacha came under renewed pressure and depreciated by 11.9% in August-November 2017.
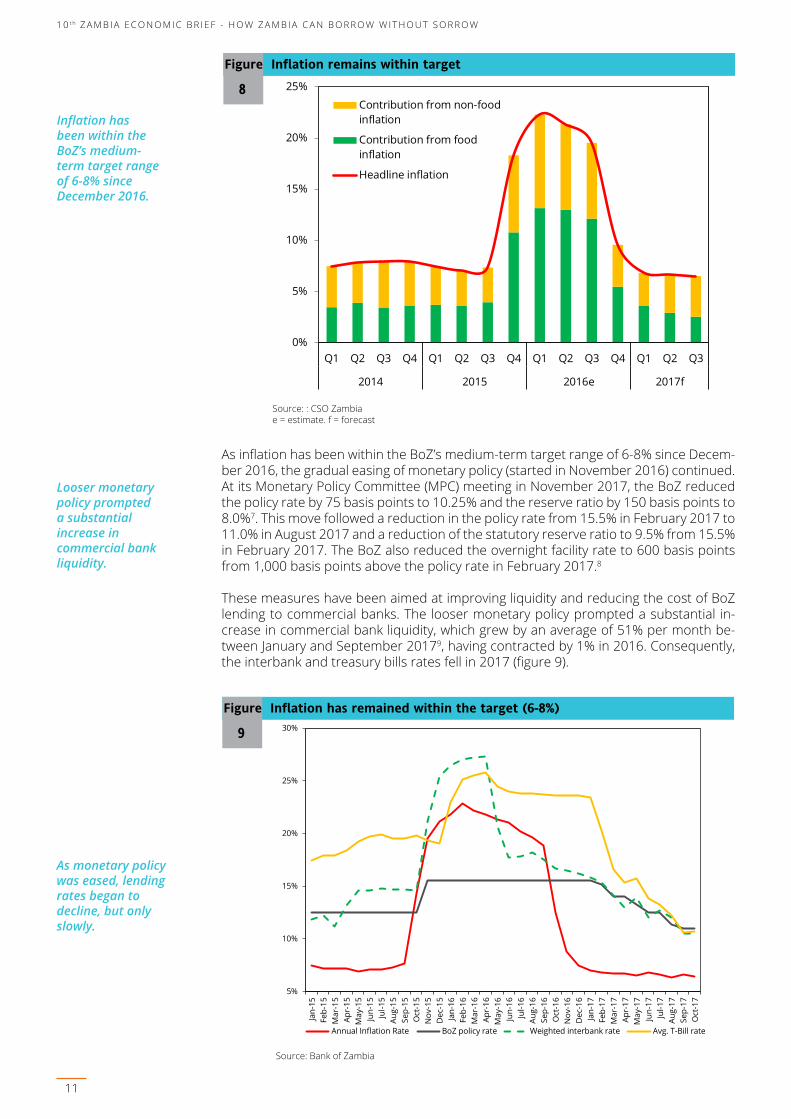
Inflation has been within the BoZ’s medium-term target range of 6-8% since December 2016.
Looser monetary policy prompted a substantial increase in commercial bank liquidity.
As monetary policy was eased, lending rates began to decline, but only slowly.
0%
5%
10%
15%
20%
25%
Q1 Q2 Q3 Q4 Q1 Q2 Q3 Q4 Q1 Q2 Q3 Q4 Q1 Q2 Q3
2014 2015 2016e 2017f
Contribution from non-foodinflation
Contribution from foodinflation
Headline inflation
Figure Inflation remains within target
8
Source: : CSO Zambia e = estimate. f = forecast
As inflation has been within the BoZ’s medium-term target range of 6-8% since Decem-ber 2016, the gradual easing of monetary policy (started in November 2016) continued. At its Monetary Policy Committee (MPC) meeting in November 2017, the BoZ reduced the policy rate by 75 basis points to 10.25% and the reserve ratio by 150 basis points to 8.0%7. This move followed a reduction in the policy rate from 15.5% in February 2017 to 11.0% in August 2017 and a reduction of the statutory reserve ratio to 9.5% from 15.5% in February 2017. The BoZ also reduced the overnight facility rate to 600 basis points from 1,000 basis points above the policy rate in February 2017.8
These measures have been aimed at improving liquidity and reducing the cost of BoZ lending to commercial banks. The looser monetary policy prompted a substantial in-crease in commercial bank liquidity, which grew by an average of 51% per month be-tween January and September 20179, having contracted by 1% in 2016. Consequently, the interbank and treasury bills rates fell in 2017 (figure 9).
5%
10%
15%
20%
25%
30%
Jan-
15Fe
b-15
Mar
-15
Apr-
15M
ay-1
5Ju
n-15
Jul-1
5Au
g-15
Sep-
15O
ct-1
5N
ov-1
5D
ec-1
5Ja
n-16
Feb-
16M
ar-1
6Ap
r-16
May
-16
Jun-
16Ju
l-16
Aug-
16Se
p-16
Oct
-16
Nov
-16
Dec
-16
Jan-
17Fe
b-17
Mar
-17
Apr-
17M
ay-1
7Ju
n-17
Jul-1
7Au
g-17
Sep-
17O
ct-1
7
Annual Inflation Rate BoZ policy rate Weighted interbank rate Avg. T-Bill rate
Figure Inflation has remained within the target (6-8%)
9
Source: Bank of Zambia
1 0 t h Z A M B I A E C O N O M I C B R I E F - H O W Z A M B I A C A N B O R R O W W I T H O U T S O R R O W
11

High lending rates have constrained private sector credit growth, especially for small businesses.
Q1 Q2 Q3 Q4 Q1 Q2 Q3Total credit growth -3.8 0.7 4.9 1.1 6.5 6.5 6.1
o/w Government -11.8 9.0 15.7 10.2 18.1 11.3 8.9
Public enterprises -11.0 -0.3 -3.1 -9.2 -10.0 28.9 89.3
Private sector 3.6 -5.2 -1.3 -4.6 -4.8 1.4 -2.2
Household -2.4 -2.1 -0.9 -7.1 -0.3 1.3 7.6
Total credit growth (excl. Gov.) 1.1 -3.7 -1.7 -5.4 -3.2 1.6 3.0
2016 2017
Table Private sector credit growth remains subdued in 2017 2
Source: CSO Zambia
As monetary policy was eased, lending rates began to decline, but only slowly, reach-ing 25.4% in October 2017 (figure 10). According to the Bankers Association of Zam-bia, lending rates have not declined faster because of two reasons.10 First, commercial banks entered costly contracts to carry fixed deposits from large corporate and insti-tutional depositors in response to low liquidity in 2016. Most of these contracts are expected to unwind in Q4 2017, and this might hasten the reduction in lending rates. Second is a deterioration in asset quality and increased NPLs arising from tough eco-nomic conditions and Government’s payment arrears.
0%
4%
8%
12%
16%
20%
24%
28%
Jan-
15
Mar
-15
May
-15
Jul-1
5
Sep-
15
Nov
-15
Jan-
16
Mar
-16
May
-16
Jul-1
6
Sep-
16
Nov
-16
Jan-
17
Mar
-17
May
-17
Jul-1
7
Sep-
17
Nominal lending rate
Real lending rate
Figure Lending rates have remained high
10
Source: Bank of Zambia
High lending rates have constrained private sector credit growth, especially for small businesses. Historically, small and medium enterprises (SME) have faced very high lend-ing rates in Zambia, with many facing lending rates as high as 40%.11 Credit to the private sector contracted in six out of seven quarters between Q1 2016 and Q3 2017 (table 2). Overall credit extended by the banking sector grew faster in 2017, following a sluggish 2016, but this growth is solely linked to Government’s increased use of govern-ment securities to meet its financing needs.
1 0 t h Z A M B I A E C O N O M I C B R I E F - H O W Z A M B I A C A N B O R R O W W I T H O U T S O R R O W
12
Historically, small and medium enterprises have faced very high lending rates in Zambia.
Overall credit extended by the banking sector grew faster in 2017, but this growth is solely linked to Government.

Following repeated large fiscal deficits (2013-15), there was significant fiscal adjustment in 2016.
1Box Inflation and exchange rate dynamics ArecentWorldBankpolicyresearchpaperinvestigatesthedynamicsbetweentheexchangerate andconsumerpriceinflationinZambia.Theanalysisusesastructuralvectorautoregression,withquarterly data for 1995–2014 and a combination of short-run sign- and zero-restrictions to identify relevant globalanddomesticshocks.Thefindingssuggest that thepass-throughofexchangeratestoconsumerpricesdependsgreatlyon theshock thatoriginallycausedtheexchangerate tofluctuate.Althoughthepriceofcopperisthemostimportantdriveroftheexchangerate,thefluctuationsitcausedareassociatedwithalowpass-throughofonlyabout7%.Exchangeratefluctuationscausedbymonetaryshockscomewithapass-throughofupto25%.Foodinflationisequallyaffectedbygenuineexchangerateshocks,butappears more reactive to changes in copper prices or the money supply. Historical variance decomposition showsthat,acrossperiods,themaindriversofexchangeratefluctuationsvariedsubstantially.Thefindingshavehelpedguideexpectationsabouttheimpactofthekwachaoninflation.Forexample,thedepreciationofthekwacha,inAugust-November2017,isexpectedtoputupwardspressureoninflation.
Source: Roger, Smith and Morrissey (2017)12.
Fiscal challenges persistFollowing repeated large fiscal deficits (2013-15), there was significant fiscal adjustment in 2016, although the quality of expenditure and its control deteriorated. In 2016, total public expenditure was reduced from 28.2% of GDP in 2015 to 23.8% in 2016 (table 3). However, revenues underperformed (by 7.6%) and many financing options were not available. Given it was an election year, this did not put the brakes on activity. The government continued to receive goods and services without cash being available, and many spending agencies by-passed financial management controls by not register-ing their commitments in the public financial management system. The stock of Gov-ernment’s payment arrears reached US$1.9 billion (8.6% of GDP) at the end of 2016 (box 2). Accordingly, the 2016 fiscal deficit registered 5.7% of GDP on a cash basis and 8.5% of GDP when all of Government’s 2016 payment arrears are included (table 3). When the 2016 payment arrears are considered, there was still a fiscal consolidation of 1.2% of GDP in 2016, despite a decline in revenues of 0.7% of GDP.
% GDP unless stated 2014 2015 2016
Actual Actual Actual Budget Prelim.
Revenue and Grants 19.0 18.8 18.1 19.4 17.5
Domestic revenue 18.2 18.6 17.9 18.4 17.3
Tax revenue 15.5 14.4 12.9 15.1 14.9
Non-tax revenue 2.7 4.2 5.0 3.3 2.4
Grants 0.8 0.2 0.2 1.0 0.2
Expenditure 24.4 28.2 23.8 26.4 25.1
Current expenditure 19.1 21.2 19.9 21.2 21.3
Wages and Salaries 9.5 8.8 8.7 8.6 8.8
Goods and Services 3.1 2.9 2.2 2.5 2.9
Interest Payments 2.2 2.8 3.4 3.6 4.3
Social Benefits 0.4 0.5 0.2 0.9 0.7
Subsidies 2.0 3.9 3.5 3.7 2.7
Intergovernmental transfers 1.9 2.3 1.9 1.8 1.9
Public investment (includes foreign projects) 5.3 7.0 3.9 5.2 3.8
Primary balance -3.2 -6.6 -2.3 -3.4 -3.3
Fiscal deficit (cash basis) -5.4 -9.4 -5.7 -7.0 -7.6Fiscal deficit (including change in payment arrears) -8.3 -12.0 -8.8 -2.1 -5.0Financing 5.5 9.4 5.7 7.3 7.6
Domestic financing 0.8 1.7 3.7 1.6 5.4External financing 4.7 7.7 2.0 5.7 2.1
Stock of Arrears 2.9 5.5 8.6 3.7 6.1Public and Publicly Guaranteed Debt 35.3 61.4 60.5 57.4 57.4GDP (Current ZMW, millions) 167,053 183,381 217,225 239,599 239,599
2017f
Table Fiscal trends
3
Source: Ministry of Finance and World Bank projections
1 0 t h Z A M B I A E C O N O M I C B R I E F - H O W Z A M B I A C A N B O R R O W W I T H O U T S O R R O W
13
The stock of Government’s payment arrears reached US$1.9 billion (8.6% of GDP) at the end of 2016.

2Box Government’s payment arrears Government payment arrears were a big issue in Zambia in the early 2000s, but reforms and political will had helped contain their growth. However, payment arrears returned in 2014 and the stockhadreachedZMW10billion(5.5%ofGDP)attheendof2015asfiscaldisciplinehadlapsed.
In 2016, the revenue shortfalls and large in-year reallocations should have been followed with a reduction in expenditure.However,thepressuresforexpenditurewereverystrong.Itwasanelectionyear,andbytheendof2016,thestockofGovernment’spaymentarrearsreachedUS$1.9billion(8.8%ofGDP).
The stock of arrears includes delayed payments to road contractors, for Government’s missed pension contributions, for imported fuel and electricity, to dealers for farming inputs procured by Government, and to farmers who had sold and delivered maize to the Food Reserve Agency.
Thepaymentarrearsputhugepressureonfirms.Whiletheyarewaitingtogetpaidforgoodsandservicetheyhavedelivered,theystrugglewithcashflow,cannotalwayspaytheirtaxesandfindithardertoservicetheir debts (leading to a build-up ofNPLs). Payment arrears impact on the broader economy as firmsawaitingpaymentarelesslikelytoexpandorcreatenewjobs.Thearrearsalsoleadfirmstoputuptheirpriceswhencontractingwiththegovernment,addingfurtherfiscalpressure.
As of mid-2017, the government had cleared close to a third of the payment arrears. To reduce future accumulationofarrears,effortsareneededtostrengthenthelegalandregulatoryframework,sothatthereare punitive measures for when goods and services are received without the available cash, or without putting the commitment into the financial management system. Strengthening the IFMIS system andTreasurySingleAccountwillhelp,buttheyarenotsufficient.Politicalwilltocurbthebuild-upofarrearsandachievefiscalfitnessisessential.
To clean up after 2016, the government targeted a fiscal deficit of 7% (cash basis) for 2017 and committed to clearing the large stock of payment arrears to boost economic growth. This commitment was reinforced when the Ministry of Finance (MoF) launched its Economic Stabilization and Growth Program (dubbed Zambia Plus) in Q4 2016. The intention was to achieve ‘fiscal fitness’ via a well-planned fiscal consolidation, alongside structural reforms, to boost inclusive growth.
Progress in achieving fiscal fitness has been made in 2017, but the expectation is that the actual deficit will be slightly above the target at 7.6% (cash basis) (table 3). The ex-pectation is also that 2.7% of GDP’s worth of arrears will be cleared by the end of 2017, resulting in the fiscal deficit on a commitment basis reaching 4.9% of GDP.
Between January and September 2017, revenues were below target by 4%, driven by weak performances of non-tax revenue (below target by 21%), while tax revenues were on track. The key components of non-tax revenue are user fees, fines and charges (53%) and non-mining revenue (41%). The former was below target by 24%, while the later was above target by 29% (due to high copper prices). The key components of tax revenue are income tax (41%), VAT (30%), and customs and excise duties (14%). Income tax was 5% below target due to lower PAYE collections (11% below target).
Contrastingly, mining revenue was above target by 11%. Better transparency in the mining sector has led to improved public revenue from the sector. Data from the Zam-bia Extractive Industries Transparency Initiative (ZEITI) illustrated that mining revenue now accounts for close to 30% of Government’s annual revenues. In addition, customs and excise duties were below target by 28% and VAT was above target by 33%. Despite accounting for just 0.2% of GDP in both 2016 and 2017, an ambitious target of 1% of GDP was set for grants in the 2017 budget. As at end-September 2017, grants fell short of their target by 79%.
Domestic expenditures were above target by 1%. Spending pressures included goods and services (6% above target) and interest payments (22% above target). Interest pay-ments have been increasing in recent years as debt has been accumulated at a faster rate and from more expensive sources (see Section 2 for a detailed account). Given these pressures, Government cut public investments relative to their plan by 24% and social cash transfers to the poorest citizens by 19%. Planned foreign expenditure via donor projects (1.8% of GDP) was 44% below target.
1 0 t h Z A M B I A E C O N O M I C B R I E F - H O W Z A M B I A C A N B O R R O W W I T H O U T S O R R O W 1 0 t h Z A M B I A E C O N O M I C B R I E F - H O W Z A M B I A C A N B O R R O W W I T H O U T S O R R O W
14
The expectation is that the actual fiscal deficit will be slightly above the target at 7.6%.
Better transparency in the mining sector has led to improved public revenue from the sector.

Achieving Fiscal FitnessThe Zambia Plus strategy provided a road-map for many economic reforms in 2017. By end-November 2017, the government had made progress with some areas, but in oth-ers, progress was lagging (box 3).
Positive steps have also been taken in reducing the cost of doing business. The major improvements relate to accessing credit (although it remains very expensive), condi-tions for cross-border trading, ease of paying taxes and enforcing contracts. Negligi-ble improvements were recorded in areas relating to starting a business, dealing with construction permits, getting electricity and registering property. However, there was regression regarding the ease with which insolvency issues could be dealt with.15
The 2018 Budget proposalThe 2018 Budget proposal was presented on September 29, 2017 with the theme: “Ac-celerating Fiscal Fitness for sustained inclusive growth, without leaving anyone behind”. The 2018 Budget highlighted how Government would increase public expenditures by 9.2% to ZMW 71 billion in 2018 from ZMW 65 billion in 2017. To maintain the planned level of social expenditure, while the cost of servicing the debt increases by 24%, the govern-ment plans to reduce the share of the budget going to the economic sectors (from 31% to 24%), despite their vital role in realizing economic diversification.
Domestic revenues are expected to reach 17.7% of GDP in 2018, up from 17.5% in 2017. Tax revenues are forecast to increase by 9%, and non-tax revenues are projected to increase by an ambitious 49%, although the budget address did not make it clear how this would be achieved. The government is building a system to start collecting property taxes in urban areas and plans to sell some of its assets, but revenue from these non-tax sources is far from certain in 2018.
The 2018 fiscal deficit (cash basis) is projected to increase to 7.3% of GDP, up from an initial target of 5.1% in Zambia Plus. The government proposes to finance the fiscal defi-cit through domestic borrowing (4.0% of GDP), foreign borrowing (3.2% of GDP), and grants (0.8 % of GDP). With this expansion, public debt is projected to increase to 59.9% of GDP in 2018 from 57.4% in 2017.
Public debt levels remain a core concernPublic sector debt has accumulated rapidly in recent years, following large and repeat fiscal deficits and huge external borrowing followed by a currency shock in 2015. Fiscal deficits have been financed by new non-concessional sources, including China and in-ternational debt markets. In 2015, total public and publicly guaranteed debt increased to 61.4% of GDP before declining slightly to 60.5% in 2016, following an appreciation of the kwacha. See Section 2 for a discussion of how Zambia can borrow without sorrow.
1 0 t h Z A M B I A E C O N O M I C B R I E F - H O W Z A M B I A C A N B O R R O W W I T H O U T S O R R O W
15
Between January and September 2017, revenues were below target by 4%, driven by weak performances of non-taxes revenue.
Interest payments have increased as debt has been accumulated at a faster rate and from more expensive sources.
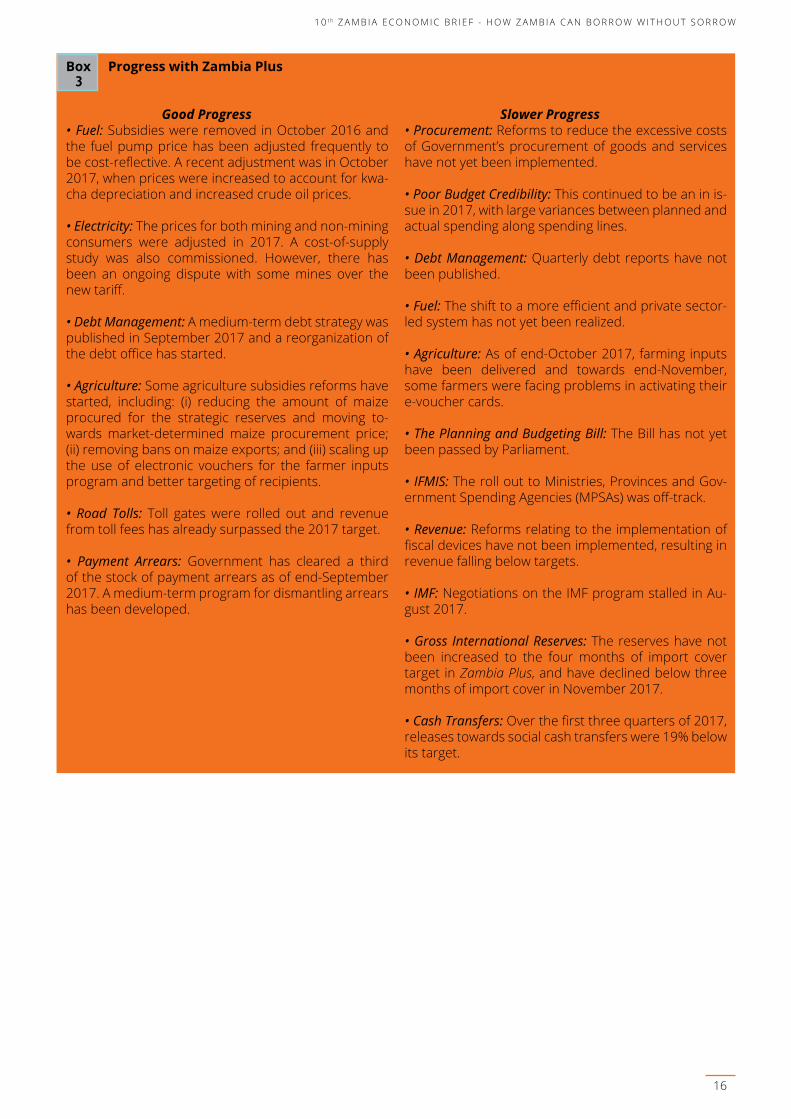
3Box Progress with Zambia Plus
Good Progress• Fuel: Subsidies were removed in October 2016 and the fuel pump price has been adjusted frequently to be cost-reflective. A recent adjustment was in October 2017, when prices were increased to account for kwa-cha depreciation and increased crude oil prices. • Electricity: The prices for both mining and non-mining consumers were adjusted in 2017. A cost-of-supply study was also commissioned. However, there has been an ongoing dispute with some mines over the new tariff.
• Debt Management: A medium-term debt strategy was published in September 2017 and a reorganization of the debt office has started.
• Agriculture: Some agriculture subsidies reforms have started, including: (i) reducing the amount of maize procured for the strategic reserves and moving to-wards market-determined maize procurement price; (ii) removing bans on maize exports; and (iii) scaling up the use of electronic vouchers for the farmer inputs program and better targeting of recipients.
• Road Tolls: Toll gates were rolled out and revenue from toll fees has already surpassed the 2017 target.
• Payment Arrears: Government has cleared a third of the stock of payment arrears as of end-September 2017. A medium-term program for dismantling arrears has been developed.
Slower Progress• Procurement: Reforms to reduce the excessive costs of Government’s procurement of goods and services have not yet been implemented.
• Poor Budget Credibility: This continued to be an in is-sue in 2017, with large variances between planned and actual spending along spending lines.
• Debt Management: Quarterly debt reports have not been published.
• Fuel: The shift to a more efficient and private sector-led system has not yet been realized.
• Agriculture: As of end-October 2017, farming inputs have been delivered and towards end-November, some farmers were facing problems in activating their e-voucher cards.
• The Planning and Budgeting Bill: The Bill has not yet been passed by Parliament.
• IFMIS: The roll out to Ministries, Provinces and Gov-ernment Spending Agencies (MPSAs) was off-track.
• Revenue: Reforms relating to the implementation of fiscal devices have not been implemented, resulting in revenue falling below targets.
• IMF: Negotiations on the IMF program stalled in Au-gust 2017.
• Gross International Reserves: The reserves have not been increased to the four months of import cover target in Zambia Plus, and have declined below three months of import cover in November 2017.
• Cash Transfers: Over the first three quarters of 2017, releases towards social cash transfers were 19% below its target.
1 0 t h Z A M B I A E C O N O M I C B R I E F - H O W Z A M B I A C A N B O R R O W W I T H O U T S O R R O W 1 0 t h Z A M B I A E C O N O M I C B R I E F - H O W Z A M B I A C A N B O R R O W W I T H O U T S O R R O W
16
C. ECONOMIC OUTLOOK, RISKS AND POLICY CHALLENGES
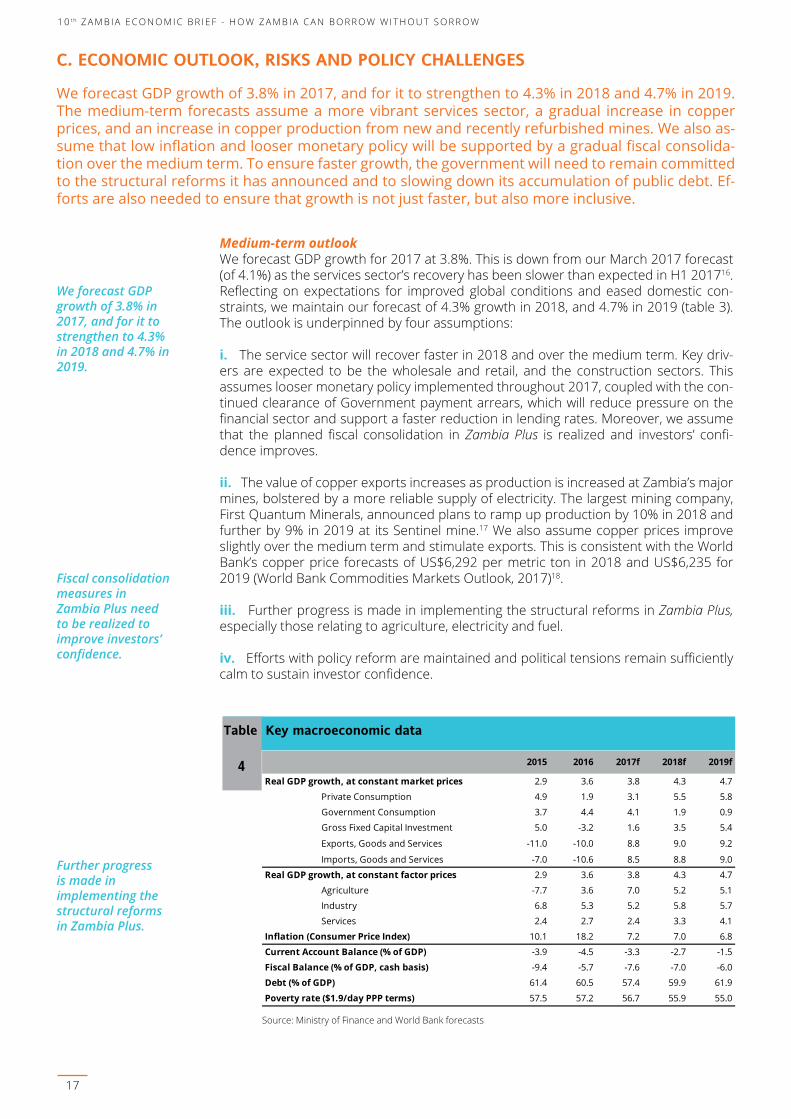
WeforecastGDPgrowthof3.8%in2017,andforittostrengthento4.3%in2018and4.7%in2019.The medium-term forecasts assume a more vibrant services sector, a gradual increase in copper prices, and an increase in copper production from new and recently refurbished mines. We also as-sumethatlowinflationandloosermonetarypolicywillbesupportedbyagradualfiscalconsolida-tion over the medium term. To ensure faster growth, the government will need to remain committed to the structural reforms it has announced and to slowing down its accumulation of public debt. Ef-fortsarealsoneededtoensurethatgrowthisnotjustfaster,butalsomoreinclusive.
Medium-term outlookWe forecast GDP growth for 2017 at 3.8%. This is down from our March 2017 forecast (of 4.1%) as the services sector’s recovery has been slower than expected in H1 201716. Reflecting on expectations for improved global conditions and eased domestic con-straints, we maintain our forecast of 4.3% growth in 2018, and 4.7% in 2019 (table 3). The outlook is underpinned by four assumptions:
i. The service sector will recover faster in 2018 and over the medium term. Key driv-ers are expected to be the wholesale and retail, and the construction sectors. This assumes looser monetary policy implemented throughout 2017, coupled with the con-tinued clearance of Government payment arrears, which will reduce pressure on the financial sector and support a faster reduction in lending rates. Moreover, we assume that the planned fiscal consolidation in Zambia Plus is realized and investors’ confi-dence improves.
ii. The value of copper exports increases as production is increased at Zambia’s major mines, bolstered by a more reliable supply of electricity. The largest mining company, First Quantum Minerals, announced plans to ramp up production by 10% in 2018 and further by 9% in 2019 at its Sentinel mine.17 We also assume copper prices improve slightly over the medium term and stimulate exports. This is consistent with the World Bank’s copper price forecasts of US$6,292 per metric ton in 2018 and US$6,235 for 2019 (World Bank Commodities Markets Outlook, 2017)18.
iii. Further progress is made in implementing the structural reforms in Zambia Plus, especially those relating to agriculture, electricity and fuel.
iv. Efforts with policy reform are maintained and political tensions remain sufficiently calm to sustain investor confidence.
We forecast GDP growth of 3.8% in 2017, and for it to strengthen to 4.3% in 2018 and 4.7% in 2019.
Fiscal consolidation measures in Zambia Plus need to be realized to improve investors’ confidence.
2015 2016 2017f 2018f 2019f
Real GDP growth, at constant market prices 2.9 3.6 3.8 4.3 4.7
Private Consumption 4.9 1.9 3.1 5.5 5.8
Government Consumption 3.7 4.4 4.1 1.9 0.9
Gross Fixed Capital Investment 5.0 -3.2 1.6 3.5 5.4
Exports, Goods and Services -11.0 -10.0 8.8 9.0 9.2
Imports, Goods and Services -7.0 -10.6 8.5 8.8 9.0
Real GDP growth, at constant factor prices 2.9 3.6 3.8 4.3 4.7
Agriculture -7.7 3.6 7.0 5.2 5.1
Industry 6.8 5.3 5.2 5.8 5.7
Services 2.4 2.7 2.4 3.3 4.1
Inflation (Consumer Price Index) 10.1 18.2 7.2 7.0 6.8
Current Account Balance (% of GDP) -3.9 -4.5 -3.3 -2.7 -1.5
Fiscal Balance (% of GDP, cash basis) -9.4 -5.7 -7.6 -7.0 -6.0
Debt (% of GDP) 61.4 60.5 57.4 59.9 61.9
Poverty rate ($1.9/day PPP terms) 57.5 57.2 56.7 55.9 55.0
Table Key macroeconomic data
4
Source: Ministry of Finance and World Bank forecasts
1 0 t h Z A M B I A E C O N O M I C B R I E F - H O W Z A M B I A C A N B O R R O W W I T H O U T S O R R O W
17
Further progress is made in implementing the structural reforms in Zambia Plus.
The main external risk is that recent copper price gains reverse.
The main domestic downside risk would relate to delayed fiscal adjustment.
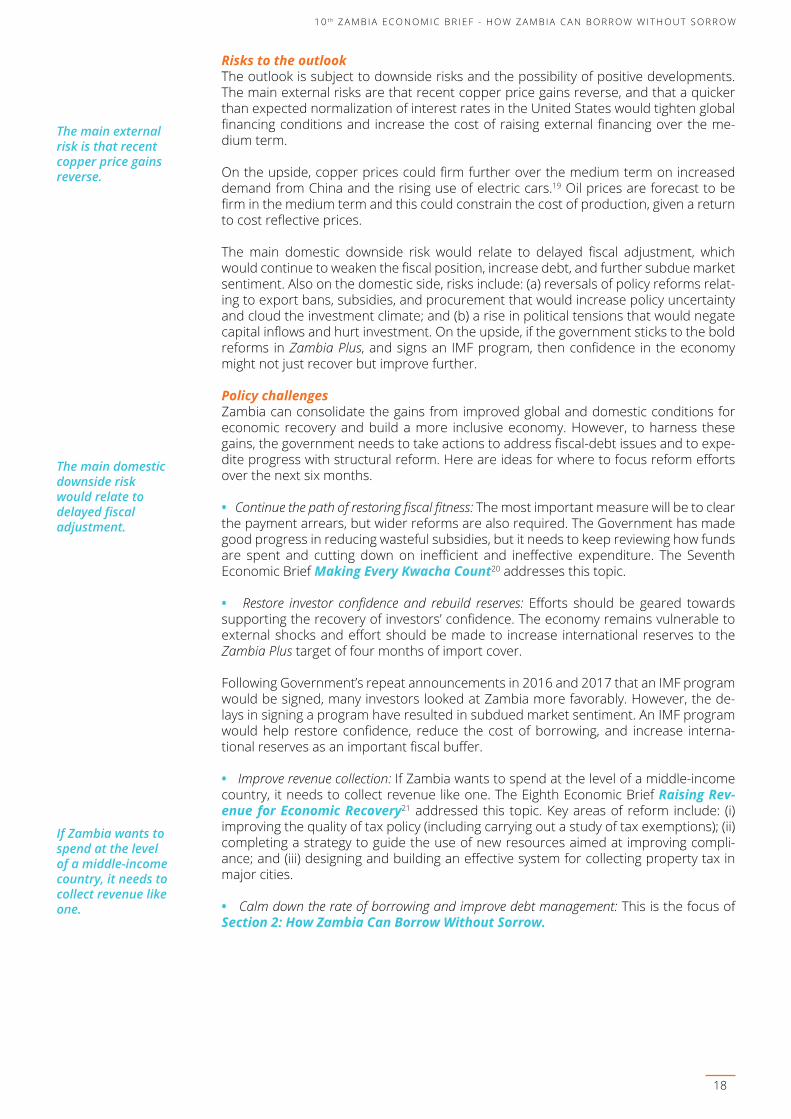
Risks to the outlookThe outlook is subject to downside risks and the possibility of positive developments. The main external risks are that recent copper price gains reverse, and that a quicker than expected normalization of interest rates in the United States would tighten global financing conditions and increase the cost of raising external financing over the me-dium term.
On the upside, copper prices could firm further over the medium term on increased demand from China and the rising use of electric cars.19 Oil prices are forecast to be firm in the medium term and this could constrain the cost of production, given a return to cost reflective prices.
The main domestic downside risk would relate to delayed fiscal adjustment, which would continue to weaken the fiscal position, increase debt, and further subdue market sentiment. Also on the domestic side, risks include: (a) reversals of policy reforms relat-ing to export bans, subsidies, and procurement that would increase policy uncertainty and cloud the investment climate; and (b) a rise in political tensions that would negate capital inflows and hurt investment. On the upside, if the government sticks to the bold reforms in Zambia Plus, and signs an IMF program, then confidence in the economy might not just recover but improve further.
Policy challengesZambia can consolidate the gains from improved global and domestic conditions for economic recovery and build a more inclusive economy. However, to harness these gains, the government needs to take actions to address fiscal-debt issues and to expe-dite progress with structural reform. Here are ideas for where to focus reform efforts over the next six months.
• Continue the path of restoring fiscal fitness: The most important measure will be to clear the payment arrears, but wider reforms are also required. The Government has made good progress in reducing wasteful subsidies, but it needs to keep reviewing how funds are spent and cutting down on inefficient and ineffective expenditure. The Seventh Economic Brief Making Every Kwacha Count20 addresses this topic.
• Restore investor confidence and rebuild reserves: Efforts should be geared towards supporting the recovery of investors’ confidence. The economy remains vulnerable to external shocks and effort should be made to increase international reserves to the Zambia Plus target of four months of import cover.
Following Government’s repeat announcements in 2016 and 2017 that an IMF program would be signed, many investors looked at Zambia more favorably. However, the de-lays in signing a program have resulted in subdued market sentiment. An IMF program would help restore confidence, reduce the cost of borrowing, and increase interna-tional reserves as an important fiscal buffer.
• Improve revenue collection: If Zambia wants to spend at the level of a middle-income country, it needs to collect revenue like one. The Eighth Economic Brief Raising Rev-enue for Economic Recovery21 addressed this topic. Key areas of reform include: (i) improving the quality of tax policy (including carrying out a study of tax exemptions); (ii) completing a strategy to guide the use of new resources aimed at improving compli-ance; and (iii) designing and building an effective system for collecting property tax in major cities.
• Calm down the rate of borrowing and improve debt management: This is the focus of Section 2: How Zambia Can Borrow Without Sorrow.
1 0 t h Z A M B I A E C O N O M I C B R I E F - H O W Z A M B I A C A N B O R R O W W I T H O U T S O R R O W 1 0 t h Z A M B I A E C O N O M I C B R I E F - H O W Z A M B I A C A N B O R R O W W I T H O U T S O R R O W
18
If Zambia wants to spend at the level of a middle-income country, it needs to collect revenue like one.

SECT
ION
2HOW ZAMBIACAN BORROWWITHOUT SORROW
Debtisanimportantsourceofdevelopmentfinance,andakeytoolforeradicatingpoverty.Countriesallovertheworldborrowtofinancetheirinvestmentanddevelopment.Zambiaisnodifferent.Therearehugeandimmediateneeds,includingthatinfrastructuremustbeimprovedandexpanded.However,the debt needs to be managed carefully and the proceeds of borrowing shrewdly invested. There has recently been an increasing amount of discussion about Zambia’s debt levels. A little over 10 years after ahugedebtreliefeffort,therapidaccumulationofdebthasonceagainputZambiainthespotlight.
After debt relief, responsible and sustainable borrowing was the goal. However, the accumulation of debt has accelerated at a rapid pace since 2012. So much so that in October 2017, Zambia was classified at ‘high risk of debt distress’ by the World Bank and IMF. Therefore, many people in Zambia are once again discussing issues of indebtedness, and questioning how debt problems and risks could return so soon.
The tragedy is not the rapid build-up of debt, but the lack of productive assets Zambia can show from the borrowing. A new approach, that closely links managing investment and responsible borrowing, is required going forward. This special section of the Brief is focused on these issues and how such an approach could be pursued.
Debt relief Many African countries started borrowing heavily from bilateral and market sources in the 1980s, leading to serious debt issues. This was also the case in Zambia, although heavy borrowing started earlier. With higher per capita income (relative to its peers in the region at the time) and large copper exports, Zambia began to borrow heavily starting in the 1970s. By 1990, this borrowing, followed by slower growth, left Zambia with a large external public debt burden of US$6.6 billion.
This debt burden was constraining the economy and development progress, and led to substantial debt relief in the mid-2000s. Zambia reached the Heavily Indebted Poor Countries’ (HIPC) initiative completion point in 2005. Following US$6.6 billion of (HIPC, Word Bank, IMF and Paris Club) debt relief, Zambia’s public sector debt declined to 25% of GDP in 2006 from 104% in 2005.
Throughout 2007-10, the debt build-up was slow and steady as the government remained cautious and ran only small fiscal deficits averaging 1.6% of GDP per year. GDP growth was also increasing at a much faster pace (8.9%), causing the debt-to-GDP ratio to decline to 18.9% in 2010. However, in 2012-16, the accumulation of external debt (borrowed in foreign currency, typically US$) has been rapid (figure 11).
1 0 t h Z A M B I A E C O N O M I C B R I E F - H O W Z A M B I A C A N B O R R O W W I T H O U T S O R R O W
19
The tragedy is not the rapid build-up of debt, but the lack of productive assets Zambia can show from the borrowing.
Throughout 2007-10, the debt build-up was slow and steady as the government remained cautious.
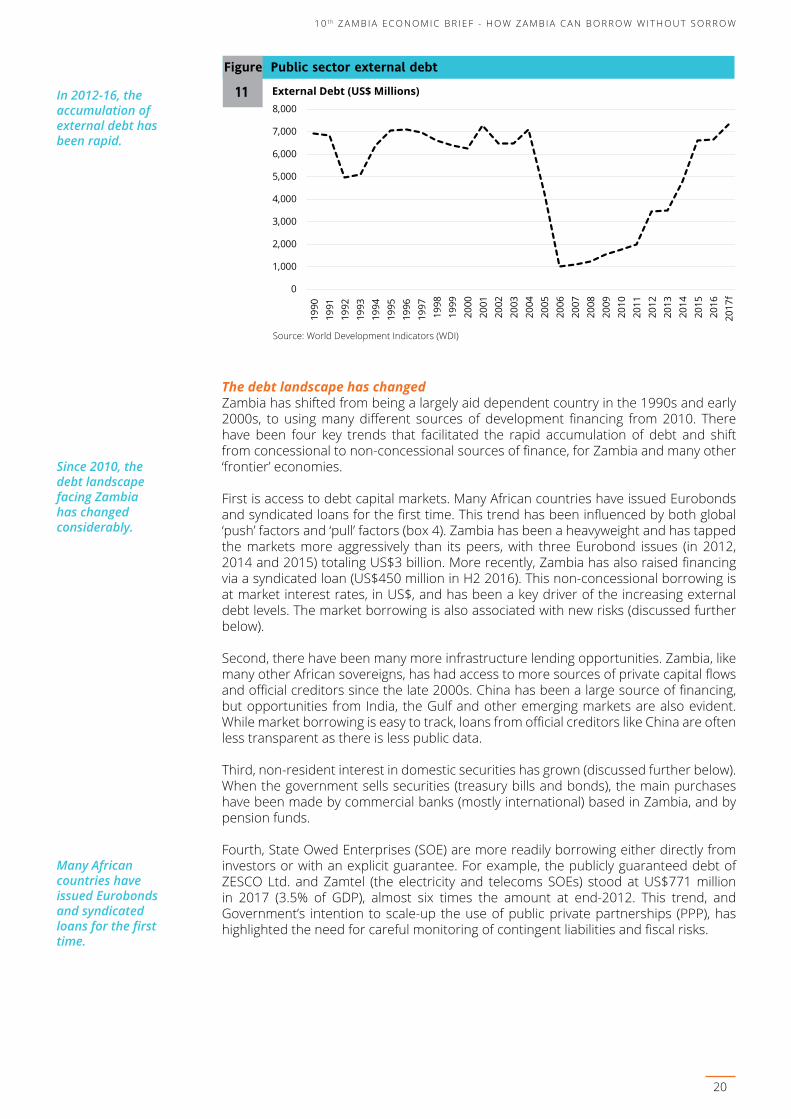
The debt landscape has changed Zambia has shifted from being a largely aid dependent country in the 1990s and early 2000s, to using many different sources of development financing from 2010. There have been four key trends that facilitated the rapid accumulation of debt and shift from concessional to non-concessional sources of finance, for Zambia and many other ‘frontier’ economies.
First is access to debt capital markets. Many African countries have issued Eurobonds and syndicated loans for the first time. This trend has been influenced by both global ‘push’ factors and ‘pull’ factors (box 4). Zambia has been a heavyweight and has tapped the markets more aggressively than its peers, with three Eurobond issues (in 2012, 2014 and 2015) totaling US$3 billion. More recently, Zambia has also raised financing via a syndicated loan (US$450 million in H2 2016). This non-concessional borrowing is at market interest rates, in US$, and has been a key driver of the increasing external debt levels. The market borrowing is also associated with new risks (discussed further below).
Second, there have been many more infrastructure lending opportunities. Zambia, like many other African sovereigns, has had access to more sources of private capital flows and official creditors since the late 2000s. China has been a large source of financing, but opportunities from India, the Gulf and other emerging markets are also evident. While market borrowing is easy to track, loans from official creditors like China are often less transparent as there is less public data.
Third, non-resident interest in domestic securities has grown (discussed further below). When the government sells securities (treasury bills and bonds), the main purchases have been made by commercial banks (mostly international) based in Zambia, and by pension funds.
Fourth, State Owed Enterprises (SOE) are more readily borrowing either directly from investors or with an explicit guarantee. For example, the publicly guaranteed debt of ZESCO Ltd. and Zamtel (the electricity and telecoms SOEs) stood at US$771 million in 2017 (3.5% of GDP), almost six times the amount at end-2012. This trend, and Government’s intention to scale-up the use of public private partnerships (PPP), has highlighted the need for careful monitoring of contingent liabilities and fiscal risks.
0
1,000
2,000
3,000
4,000
5,000
6,000
7,000
8,000
1990
1991
1992
1993
1994
1995
1996
1997
1998
1999
2000
2001
2002
2003
2004
2005
2006
2007
2008
2009
2010
2011
2012
2013
2014
2015
2016
2017
f
Figure Public sector external debt
11
Source: World Development Indicators (WDI)
External Debt (US$ Millions)
1 0 t h Z A M B I A E C O N O M I C B R I E F - H O W Z A M B I A C A N B O R R O W W I T H O U T S O R R O W 1 0 t h Z A M B I A E C O N O M I C B R I E F - H O W Z A M B I A C A N B O R R O W W I T H O U T S O R R O W
20
In 2012-16, the accumulation of external debt has been rapid.
Since 2010, the debt landscape facing Zambia has changed considerably.
Many African countries have issued Eurobonds and syndicated loans for the first time.
Box Emerging Risks from frontier market access to capital markets Over the past decade, many low- and lower-middle income ‘frontier economies’ have begun to access international private capital markets to meet fiscal financing needs. In a recent empirical paper, Haque, Bogoev and Smith (2017) seek to identify ‘push’ and ‘pull’ factors driving this trend, to identify associated risks, and to present policy implications for frontier-market policy-makers.
Push factors refer to global economic conditions, including global risks and interest rates. Pull factors are coun-try-specific, typically including growth rates, debt levels, reserve adequacy, and institutional performance.
A simple analysis of the characteristics of recent frontier market issuers shows that smaller, poorer, and less well-governed economies are now accessing global credit markets. While a broader range of frontier markets are now enjoying access to global credit markets, cross-country regression analysis shows pull factors continue to influence the likelihood of issuance and the pricing of bonds. Frontier countries with strong GDP growth, pru-dent fiscal policy, good external positions and sound institutions are more likely to be able to access global credit markets. Countries with good credit ratings are likely to face substantially lower prices for private sector debt.
The paper argues that the new cohort of frontier issuing economies should: (i) take careful account of debt risks and debt sustainability considerations when developing fiscal policy and debt strategies; (ii) work to reduce the costs of ongoing external borrowing through adopting sound economic policies and protecting credit ratings; and (iii) develop domestic debt markets as a potential alternative source of fiscal financing through which to re-duce reliance on foreign-denominated Eurobond debt with its associated refinancing and currency risks.
Source: Haque, T., Bogoev, J., and Smith, G. (2017), ‘Push and Pull: Emerging Risks in Frontier Economy Access to Inter-national Capital Markets’, MFM Global Practice Discussion Paper No. 7, World Bank, February 2017.
4
1 0 t h Z A M B I A E C O N O M I C B R I E F - H O W Z A M B I A C A N B O R R O W W I T H O U T S O R R O W
21

D. How much debt does Zambia have and is it too much?
There is consensus that Zambia’s debt levels have soared recently, but there has been an absence of precisiononwhattheexactnumbersare.Debtnumbersdifferacrosspublications,causingconfu-sion.Thisisbecausetherehasbeenalackofdebtreportingandtherearedifferentwaysofmeas-uring debt. A recent World Bank and IMF debt sustainability analysis puts Zambia at high risk of debt distress, indicating that there are heightened vulnerabilities associated with public debt. This indicates that Zambia is accumulating too much debt too quickly and a calmer and more sustainable pace is now required.
As debt levels soared in 2015, the government’s response was to stop publishing debt reports or mentioning the overall debt levels in their speeches and official documents. Some numbers were provided, but they were never aggregated. It was left to the reader to solve the puzzle. This led to a range of narratives, at times more negative than the reality.
Annual debt reports were last made public on the Ministry of Finance website in 2012, and since then, no quarterly debt reports have been published. Since 2012, the only published debt numbers have been found in government speeches and other eco-nomic reports. However, the external debt was often mentioned in US$, the domestic debt in kwacha, and the total ratios never summed or announced. Furthermore, other debt sources, such as guaranteed debt, are excluded from the discussion of total public debt.
Public sector debt typically includes both external and domestic debt (figure 12). The IMF and World Bank also include publicly guaranteed debt to measure ‘total public sec-tor debt and publicly guaranteed debt’. For Zambia, this was recorded at 60.5% of GDP (US$13.3 billion) at the end of 2016, up from 35.6% in 2014 (table 5). This includes all disbursed debt, but excludes government’s pipeline of future commitments or projects, and loans that have already been signed but where money has not yet been disbursed.
As debt levels soared in 2015, the government’s response was to stop publishing debt reports.
Annual debt reports were last made public on the Ministry of Finance website in 2012.
External debt has increased rapidly External debt grew from US$1.9 billion (8.4% of GDP) at end-2011 to US$8.0 billion (36.5 % of GDP) at end-2016 (figure 11). Key to note is that the external debt portfo-lio has shifted from concessional to non-concessional debt; the share of concessional sources declined to 21% in 2016 from close to 60% in 2011, while the share from pri-vate banks and investors has increased to 50%. This development is common as coun-tries grow, but the implication is that interest costs increase and access to long-term funding reduces. Also striking is the increase in the number of different loans that have been signed; up from 5 in 2011 to 30 in 2016, putting huge pressure on the debt office to manage the portfolio.
Whether payment arrears are included in domestic debt is debatable. At times, there are grounds to exclude them, because they are often not publicly guaranteed and not always audited, and they often do not have a known payment profile. However, they should be included if they have been securitized. From a statistical point of view, they should at the very least be reported as a memorandum item.
2014 2015% GDP % GDP
% GDP 20.1% 43.1%US$ m 5,263 7,193
Government Securities % GDP 11.7% 10.4%Other (domestic arrears + BoZ) % GDP 3.8% 7.6%
% GDP 31.8% 53.5%% GDP 35.6% 61.1%
External Debt (Public and Publicly Guaranteed)
Domestic Debt
Total Public and Publicly Guaranteed Debt External Debt (Public and Publicly Guaranteed) + Government Securities
Table Measuring public debt
5
Source: World Bank-IMF Debt Sustainability Assessment (2017)Note: Debt numbers are gross and end-period
1 0 t h Z A M B I A E C O N O M I C B R I E F - H O W Z A M B I A C A N B O R R O W W I T H O U T S O R R O W 1 0 t h Z A M B I A E C O N O M I C B R I E F - H O W Z A M B I A C A N B O R R O W W I T H O U T S O R R O W
22
Public sector debt was 60.5% of GDP (US$ 13.3 billion) at the end of 2016, up from 35.6% in 2014.
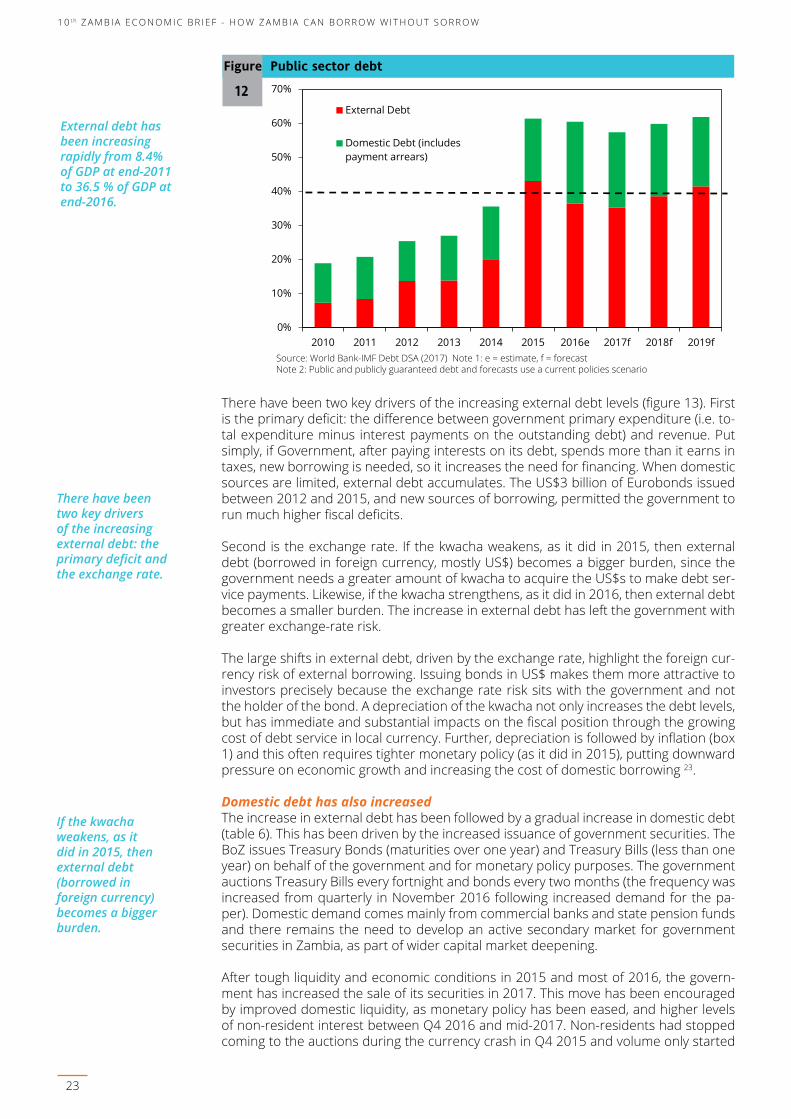
External debt has been increasing rapidly from 8.4% of GDP at end-2011 to 36.5 % of GDP at end-2016.
There have been two key drivers of the increasing external debt levels (figure 13). First is the primary deficit: the difference between government primary expenditure (i.e. to-tal expenditure minus interest payments on the outstanding debt) and revenue. Put simply, if Government, after paying interests on its debt, spends more than it earns in taxes, new borrowing is needed, so it increases the need for financing. When domestic sources are limited, external debt accumulates. The US$3 billion of Eurobonds issued between 2012 and 2015, and new sources of borrowing, permitted the government to run much higher fiscal deficits.
Second is the exchange rate. If the kwacha weakens, as it did in 2015, then external debt (borrowed in foreign currency, mostly US$) becomes a bigger burden, since the government needs a greater amount of kwacha to acquire the US$s to make debt ser-vice payments. Likewise, if the kwacha strengthens, as it did in 2016, then external debt becomes a smaller burden. The increase in external debt has left the government with greater exchange-rate risk.
The large shifts in external debt, driven by the exchange rate, highlight the foreign cur-rency risk of external borrowing. Issuing bonds in US$ makes them more attractive to investors precisely because the exchange rate risk sits with the government and not the holder of the bond. A depreciation of the kwacha not only increases the debt levels, but has immediate and substantial impacts on the fiscal position through the growing cost of debt service in local currency. Further, depreciation is followed by inflation (box 1) and this often requires tighter monetary policy (as it did in 2015), putting downward pressure on economic growth and increasing the cost of domestic borrowing 23.
Domestic debt has also increased The increase in external debt has been followed by a gradual increase in domestic debt (table 6). This has been driven by the increased issuance of government securities. The BoZ issues Treasury Bonds (maturities over one year) and Treasury Bills (less than one year) on behalf of the government and for monetary policy purposes. The government auctions Treasury Bills every fortnight and bonds every two months (the frequency was increased from quarterly in November 2016 following increased demand for the pa-per). Domestic demand comes mainly from commercial banks and state pension funds and there remains the need to develop an active secondary market for government securities in Zambia, as part of wider capital market deepening.
After tough liquidity and economic conditions in 2015 and most of 2016, the govern-ment has increased the sale of its securities in 2017. This move has been encouraged by improved domestic liquidity, as monetary policy has been eased, and higher levels of non-resident interest between Q4 2016 and mid-2017. Non-residents had stopped coming to the auctions during the currency crash in Q4 2015 and volume only started
There have been two key drivers of the increasing external debt: the primary deficit and the exchange rate.
0%
10%
20%
30%
40%
50%
60%
70%
2010 2011 2012 2013 2014 2015 2016e 2017f 2018f 2019f
External Debt
Domestic Debt (includespayment arrears)
Public Sector Debt (% GDP) Figure Public sector debt
12
Source: World Bank-IMF Debt DSA (2017) Note 1: e = estimate, f = forecastNote 2: Public and publicly guaranteed debt and forecasts use a current policies scenario
1 0 t h Z A M B I A E C O N O M I C B R I E F - H O W Z A M B I A C A N B O R R O W W I T H O U T S O R R O W
23
If the kwacha weakens, as it did in 2015, then external debt (borrowed in foreign currency) becomes a bigger burden.
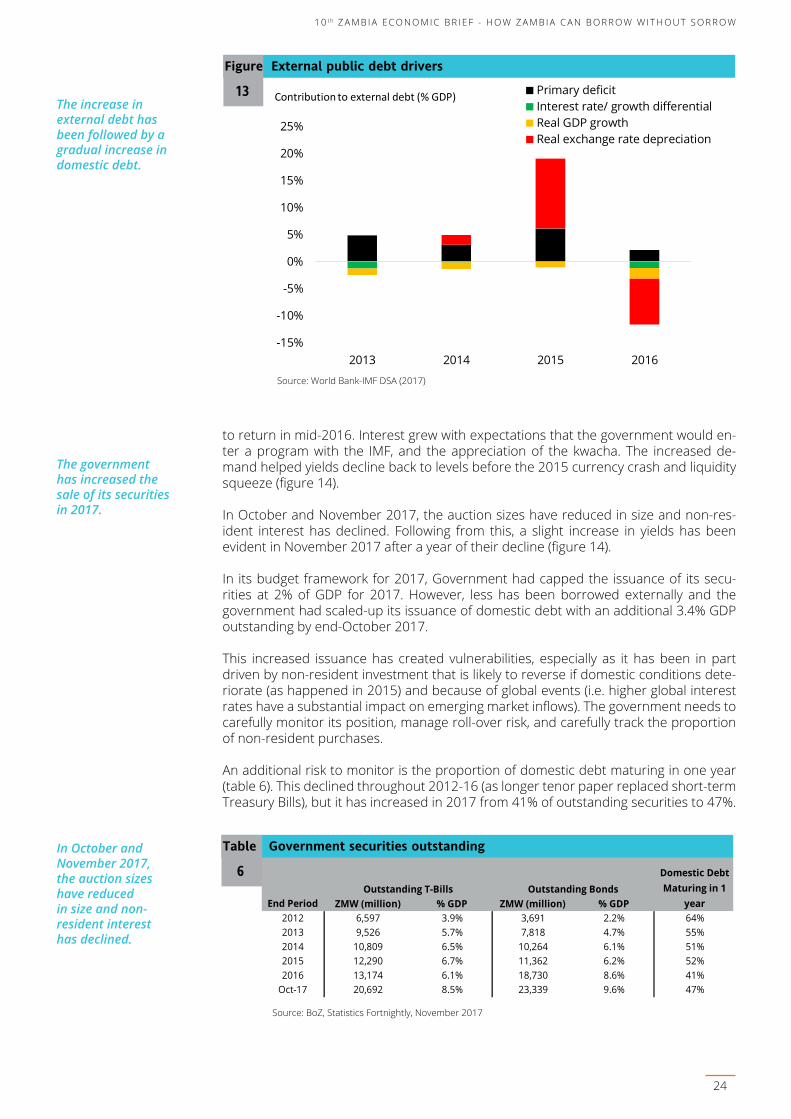
The increase in external debt has been followed by a gradual increase in domestic debt.
The government has increased the sale of its securities in 2017.
-15%
-10%
-5%
0%
5%
10%
15%
20%
25%
2013 2014 2015 2016
Primary deficitInterest rate/ growth differentialReal GDP growthReal exchange rate depreciation
Contribution to external debt (% GDP)
Figure External public debt drivers
13
Source: World Bank-IMF DSA (2017)
to return in mid-2016. Interest grew with expectations that the government would en-ter a program with the IMF, and the appreciation of the kwacha. The increased de-mand helped yields decline back to levels before the 2015 currency crash and liquidity squeeze (figure 14).
In October and November 2017, the auction sizes have reduced in size and non-res-ident interest has declined. Following from this, a slight increase in yields has been evident in November 2017 after a year of their decline (figure 14).
In its budget framework for 2017, Government had capped the issuance of its secu-rities at 2% of GDP for 2017. However, less has been borrowed externally and the government had scaled-up its issuance of domestic debt with an additional 3.4% GDP outstanding by end-October 2017.
This increased issuance has created vulnerabilities, especially as it has been in part driven by non-resident investment that is likely to reverse if domestic conditions dete-riorate (as happened in 2015) and because of global events (i.e. higher global interest rates have a substantial impact on emerging market inflows). The government needs to carefully monitor its position, manage roll-over risk, and carefully track the proportion of non-resident purchases.
An additional risk to monitor is the proportion of domestic debt maturing in one year (table 6). This declined throughout 2012-16 (as longer tenor paper replaced short-term Treasury Bills), but it has increased in 2017 from 41% of outstanding securities to 47%.
ZMW (million) % GDP ZMW (million) % GDP2012 6,597 3.9% 3,691 2.2% 64%2013 9,526 5.7% 7,818 4.7% 55%2014 10,809 6.5% 10,264 6.1% 51%2015 12,290 6.7% 11,362 6.2% 52%2016 13,174 6.1% 18,730 8.6% 41%Oct-17 20,692 8.5% 23,339 9.6% 47%
End PeriodOutstanding T-Bills Outstanding Bonds
Domestic Debt Maturing in 1
year
Table Government securities outstanding
6
Source: BoZ, Statistics Fortnightly, November 2017
1 0 t h Z A M B I A E C O N O M I C B R I E F - H O W Z A M B I A C A N B O R R O W W I T H O U T S O R R O W 1 0 t h Z A M B I A E C O N O M I C B R I E F - H O W Z A M B I A C A N B O R R O W W I T H O U T S O R R O W
24
In October and November 2017, the auction sizes have reduced in size and non-resident interest has declined.
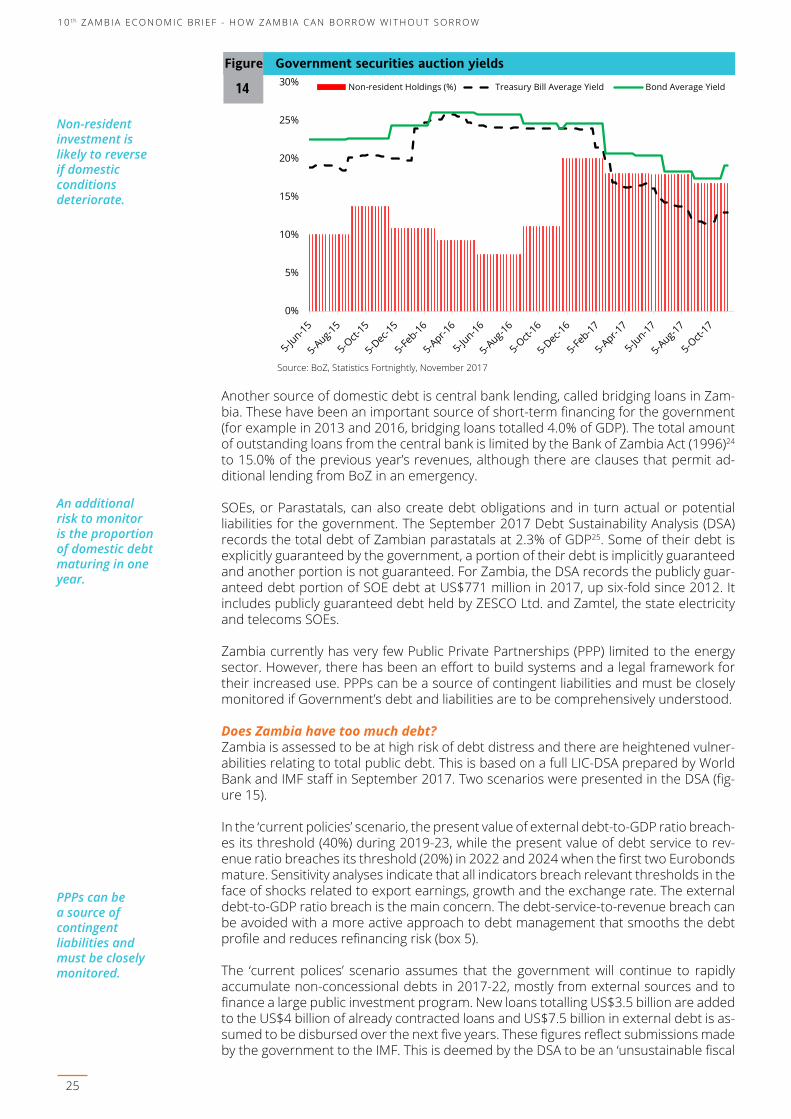
Non-resident investment is likely to reverse if domestic conditions deteriorate.
An additional risk to monitor is the proportion of domestic debt maturing in one year.
0%
5%
10%
15%
20%
25%
30% Non-resident Holdings (%) Treasury Bill Average Yield Bond Average Yield
Figure Government securities auction yields
14
Source: BoZ, Statistics Fortnightly, November 2017
Another source of domestic debt is central bank lending, called bridging loans in Zam-bia. These have been an important source of short-term financing for the government (for example in 2013 and 2016, bridging loans totalled 4.0% of GDP). The total amount of outstanding loans from the central bank is limited by the Bank of Zambia Act (1996)24 to 15.0% of the previous year’s revenues, although there are clauses that permit ad-ditional lending from BoZ in an emergency.
SOEs, or Parastatals, can also create debt obligations and in turn actual or potential liabilities for the government. The September 2017 Debt Sustainability Analysis (DSA) records the total debt of Zambian parastatals at 2.3% of GDP25. Some of their debt is explicitly guaranteed by the government, a portion of their debt is implicitly guaranteed and another portion is not guaranteed. For Zambia, the DSA records the publicly guar-anteed debt portion of SOE debt at US$771 million in 2017, up six-fold since 2012. It includes publicly guaranteed debt held by ZESCO Ltd. and Zamtel, the state electricity and telecoms SOEs.
Zambia currently has very few Public Private Partnerships (PPP) limited to the energy sector. However, there has been an effort to build systems and a legal framework for their increased use. PPPs can be a source of contingent liabilities and must be closely monitored if Government’s debt and liabilities are to be comprehensively understood.
Does Zambia have too much debt?Zambia is assessed to be at high risk of debt distress and there are heightened vulner-abilities relating to total public debt. This is based on a full LIC-DSA prepared by World Bank and IMF staff in September 2017. Two scenarios were presented in the DSA (fig-ure 15).
In the ‘current policies’ scenario, the present value of external debt-to-GDP ratio breach-es its threshold (40%) during 2019-23, while the present value of debt service to rev-enue ratio breaches its threshold (20%) in 2022 and 2024 when the first two Eurobonds mature. Sensitivity analyses indicate that all indicators breach relevant thresholds in the face of shocks related to export earnings, growth and the exchange rate. The external debt-to-GDP ratio breach is the main concern. The debt-service-to-revenue breach can be avoided with a more active approach to debt management that smooths the debt profile and reduces refinancing risk (box 5).
The ‘current polices’ scenario assumes that the government will continue to rapidly accumulate non-concessional debts in 2017-22, mostly from external sources and to finance a large public investment program. New loans totalling US$3.5 billion are added to the US$4 billion of already contracted loans and US$7.5 billion in external debt is as-sumed to be disbursed over the next five years. These figures reflect submissions made by the government to the IMF. This is deemed by the DSA to be an ‘unsustainable fiscal
1 0 t h Z A M B I A E C O N O M I C B R I E F - H O W Z A M B I A C A N B O R R O W W I T H O U T S O R R O W
25
PPPs can be a source of contingent liabilities and must be closely monitored.

Refinancing risks The Eurobond borrowing has also increased roll-over risk as the first two issues am-ortize in single bullet payments. Just as the money was received in a single day, it also needs to be paid back in one day. This is an issue for many African sovereigns that is-sued Eurobonds shortly after the financial crisis.
In a single day in 2022, Zambia must repay US$750 million and in 2024, it must repay US$1 billion. The third Eurobond (issued in 2015) has a different structure and amor-tizes in three equal installments in 2025-27. The mounting repayment risks reflect not only large payments in single years, but also the bunching of repayment years. Zambia’s redemption profile highlights how efforts will likely be needed to buy back some of this debt in the hope of smoothing repayments (box 5). The concentration of Zambia’s ma-turities coincides with that of many other African countries, a further potential source of roll-over risk (figure 16).
Rebasing GDP would not increase the ability of Government to service its debt.
Zambia is assessed to be at high risk of debt distress and there are heightened vulnerabilities relating to total public debt.
The results of the World Bank and IMF DSA are mirrored in the government’s own DSAs and Zambia Plus.
stance’ that, combined with subdued growth, results in the classification: ‘high risk of debt distress’.
The second ‘adjustment scenario’ has Zambia remaining at moderate risk of debt dis-tress. This would require the government to halt the signing of any new non-conces-sional borrowing, except for a US$282 million government communications project and any issuance with the purpose of reducing the repayment risks or rolling-over the existing Eurobonds.
The results of the World Bank and IMF DSA are mirrored in the government’s own DSAs and Zambia Plus: “Over the past few years, the composition of the external debt stock has substantially changed with more than 50 percent accounted for by private commercial debt. The capacity as a country to carry and service debt has been threatened especially in the face of the macroeconomic challenges the economy has recently experienced. Maintaining debt sustainability will be pivotal in rebalancing of the Zambian economy”.26
Despite this result, there is an argument in Zambia that the debt levels are sustainable because they are far below those of developed economies (Japanese debt levels are often quoted). However, this argument fails to acknowledge that different countries can carry different amounts of debt and that debt distress in emerging frontier econo-mies can occur at much lower levels. Furthermore, many advanced economies issue most of their borrowing in their own currency, have a diversified and stable investor base that allows them to issue more cheaply and in longer maturities, and have a more diversified composition of exports, relative to many frontier economies (and especially extractives dependent economies like Zambia).
It has also been argued that rebasing GDP would reduce the debt-to-GDP ratio and the risk of debt distress. This is correct, but it would not increase the ability of Government to service its debt. If the measure of GDP increases, then the debt-service-to-revenue and the revenue-to-GDP ratios would both fall (all else being equal) and both are close-ly monitored by credit rating agencies and investors.
1 0 t h Z A M B I A E C O N O M I C B R I E F - H O W Z A M B I A C A N B O R R O W W I T H O U T S O R R O W 1 0 t h Z A M B I A E C O N O M I C B R I E F - H O W Z A M B I A C A N B O R R O W W I T H O U T S O R R O W
26
Figure External debt sustainability analysis
15
Source: World Bank and IMF DSA, October 2017Note: The extreme shock in both was a combination shock (growth, exports, inflation and FDI)
Current Policies Scenario Adjustment Scenario

In a single day in 2022, Zambia must repay US$750 million and in 2024, it must repay US$1 billion.
An unsustainable debt burden would impact on poverty reduction in Zambia.
As the public debt has increased since 2012, so has the cost of servicing that debt.
Figure Eurobond amortization
16
Source: Bloomberg
As of November 2017, the spread on Zambian Eurobonds is above other African coun-tries (figure 2), including Ghana which, like Zambia, has tapped international capital markets more aggressively than its peers.
Development impacts of high levels of indebtednessAn unsustainable debt burden would impact on poverty reduction in Zambia. It would reduce not only public investment and income growth, but would also reduce fiscal space for social spending as the cost of servicing the debt increases. Less money would be available to finance the government’s national development plans. In the 1990s and early 2000s, high debt service costs directly reduced government budgetary allocations on health, education, and agriculture; and many social safety nets were eroded.
As the public debt has increased since 2012, so has the cost of servicing that debt. In addition, as the income level grows, access to concessional funding gradually reduces, implying an increase in expected cost going forward. In 2013, 9% of domestic revenues were needed to meet interest payment obligations (figure 17). In 2017, this has risen to 25%. The cost of servicing the Eurobonds has increased with each issuance, with the coupon rate increasing from 5.375% in 2012, to 8.5% in 2014 and 8.97% in 2015 (table 7).
This has left very little in the way of discretionary resources to fund service delivery, as over half the budget is needed to meet the government wage bill. This reduces the abil-ity of Government to respond to funding needs identified in the national development plan.
1 0 t h Z A M B I A E C O N O M I C B R I E F - H O W Z A M B I A C A N B O R R O W W I T H O U T S O R R O W
27

9% 12% 15% 19% 25%
49% 52% 47%
49% 51%
43% 36% 38% 32% 24%
2013 2014 2015 2016 2017fDebt Interest Payments Government Wage Bill Remaining Resources
Share of Domestic Revenue (%)
Figure Rising debt service costs
17
Source: Ministry of Finance
Box How will the Eurobonds be paid back? Countries are not ‘in the markets’ when they issue for the first time, but when they have a credible record of raising finance and paying it back. Ghana started this process when it repaid its first Eurobond (issued in 2007) in September 2017. To do this, it reduced the final outstanding payment over several other Eurobond issues. This strategy is something that Zambia should analyze and use to inform its own refinancing strategy.
The Zambian government must switch from ‘passive’ debt management to being ‘active’ and must implement a strategy to reduce the cost of borrowing, extend the terms, and diversify the sources of debt funding. By buying back some of the outstanding Eurobond debt in the years prior to its maturity, Government can reduce the repayment risks (especially as the first two Eurobonds have single bullet payments). Bondholders of existing paper can also be invited to exchange their holdings (for up to a stated amount) of a new issuance. This strategy has the government paying back existing debt with new debt, the Eurobonds essentially get rolled-over. At times, buy-back can only be achieved at a premium over market price. This would then require careful analysis of the trade-off between containing repayment risk and reducing cost.
There are few instances of African sovereigns using sinking funds to repay Eurobond debt. One example is Gabon, which pledged, prior to one of its issuances, that it would put a minimum of US$50 million per year in an account held at the Central African Development Bank and managed by the World Bank. These funds were to be used to buy back some of the issue. For this issue, the idea was that the design would lower the borrowing cost.
In Zambia, the government has often declared it was setting up a sinking fund to save US$ that could repay the Eurobonds when they are due. However, given the persistent large fiscal deficits, saving in this manner has not been possible. In addition, the level of international reserves has fallen short of the four months of import cover Zambia Plus target.
Considering the lack of ability to save and the inability to build the targeted fiscal buffers, and the large size of the repayments due, the refinancing route should be properly explored as the most practical solution.
5
1 0 t h Z A M B I A E C O N O M I C B R I E F - H O W Z A M B I A C A N B O R R O W W I T H O U T S O R R O W 1 0 t h Z A M B I A E C O N O M I C B R I E F - H O W Z A M B I A C A N B O R R O W W I T H O U T S O R R O W
28
This has left very little in the way of discretionary resources to fund service delivery, as over half the budget is needed to meet the government wage bill.
The fact that investors will buy a country’s bonds should not be taken as a signal that an economy is doing well.
There had been hope that debt management would be strengthened after HIPC, but reform was slow.
E. HOW WELL IS THE DEBT MANAGED?
Zambia had limited borrowing options in the 1990s and early 2000s, and these were linked to cooperating partners like the World Bank or African Development Bank. Zambia would know the terms; the loans would be concessional;andsupportwouldbegiventohelpdesign,appraise,andimplementtheprojects.However,nowthat Zambia is tapping debt capital markets and has many sources of borrowing, a new ‘active’ approach to debt management is needed that contrasts with the ‘passive’ approach to debt management since debt relief.
The fact that investors will buy a country’s bonds should not be taken as a signal that an economy is doing well. It could mean that the risks are worth facing for the investor, if the returns are high enough, or that the investor might not know exactly what they are buying if they are investing in indexes. This suggests that opportunities for finance should not be an automatic cause for celebration and signatures. Instead, a careful strategy and a more active approach to debt management are required.
Passive debt management: 2006-16As in many areas of governance and public financial management reform, Zambia has produced regular strategies and plans and has voiced intentions to reform, but the pace of transformation has been slow over the last ten years. Furthermore, over this same period, fiscal management has weakened (for example a growing wage bill, large repeat fiscal deficits and huge payment arrears).
There had been hope that debt management would be strengthened after HIPC, but World Bank and IMF Debt Management Performance Assessments (DEMPA), carried out in 2007 and 2011, highlighted that while some areas had improved (for example coordination between debt management and monetary policy), for many areas reforms had been very slow. In several areas, including conducting debt sustainability analyses and reporting, performance had declined. The lack of reporting relates to issues with data and debt database concerns, as there have been long delays with the upgrading of the debt database at the Ministry of Finance. Two different databases, one at BoZ for domestic debt and one at MoF for external debt, have persisted for several years.
Several debt management reform plans have been drafted, including in January 2013. They focus on improving the legal framework; operating the debt database; reorgan-izing the debt management office along functional lines; strengthening operational risk; and issuing a medium-term debt strategy. Despite technical assistance, little had been achieved by the end of 2016.
Debt management remained passive in 2012-16, at a time when the accumulation of debt grew rapidly, the number of new loans increased (from 5 in 2011 to 30 in 2016), the portfolio became less concessional, and the types of borrowing were more numer-ous and more complex. Each of these factors made debt management harder and the need for improved debt management more critical. The striking variation in the compo-sition of financing from year to year (table 3) is in part due to the intermittent issuance of Eurobonds, but it also signals that a borrowing strategy was lacking.
To make matters worse, Government chose to erode some of the institutional and ac-countability checks on public debt. This was done to increase borrowing at a faster rate. For example, the public debt ceiling (put in place to keep borrowing at sustainable levels) was all but removed in 2015 (it was shifted up to 87% of GDP from 33% of GDP to permit the issuance of the 2015 Eurobond after the event). This allowed the govern-ment to accumulate more debt without strict parliamentary oversight. Furthermore, as discussed above, Zambia stopped reporting on its public debt in 2012, and in late-2015 and 2016 avoided stating the overall debt levels in government speeches and docu-ments.
More active debt management: from 20172017 has seen some progress with debt management reforms that have been dis-cussed and not acted on for over a decade. First, a medium-term debt strategy was published for the first time. It is not yet of the necessary quality to guide sustainable borrowing well, but its issuance is a good start. Going forward, it should be updated
1 0 t h Z A M B I A E C O N O M I C B R I E F - H O W Z A M B I A C A N B O R R O W W I T H O U T S O R R O W
29
Debt management remained passive in 2012-16, at a time when the accumulation of debt grew rapidly.

2017 has seen some progress with debt management reforms that have been discussed and not acted on for over a decade.
annually to provide an opportunity for its improvement. Second, an internal debt sus-tainability analysis (covering all public debt) has been conducted (although it was not published as of end-November2017). Third, efforts have been made to actualize the reorganization of the debt management office along functional lines (box 6). Finally, efforts have been made to draft revisions of the legal framework so that practices are consistent with the constitutional amendments of January 2016.
However, the move to loan-by-loan approval by Parliament should be considered care-fully. Otherwise, it might be the source of delays and might lead to higher costs of borrowing. If more parliamentary scrutiny is the objective, then this might be better achieved through fiscal responsibility acts or debt limits, rather than by loan-by-loan ap-proval. Parliament is often not a good place to discuss whether to issue debt in US$ or EUR for example, or whether a fixed or floating rate is most appropriate.
Further accountability to Parliament could come via an annual debt bulletin that ex-plains actual debt management decisions compared to the Cabinet approved debt strategy. Good practice is that the responsibility for debt management is delegated to the Minister of Finance. The Ministry of Finance then develops the plan for borrowing and risk exposure – the debt management strategy that is subsequently approved by the Cabinet.
Box Debt Management Office A government debt management office (DMO) is responsible for designing strategy options and presenting them to policy-makers who will ultimately approve a strategy based on the government’s level of risk tolerance. The DMO implements the strategy after it is approved by policy-makers, a process that involves regular contact with market participants such as commercial and official lenders. It also processes and records transactions and manages debt data.
Government debt management requires a combination of financial market and public policy skills. The skills needed include portfolio management and risk analysis, transaction processing, public policy skills and an understanding of basic macroeconomics. Debt managers must also have access to legal advice and guidance to ensure that the transactions they undertake are conducted per relevant domestic and international securities laws, and that decisions are made in accordance with public sector laws such as public debt and fiscal responsibility laws.
The core functions of a DMO are: • Funding and transactions execution – ‘front office’.• Debt management strategy design (including risk assessment) – ‘middle office’.• Transaction processing and recording – ‘back office’.
6
1 0 t h Z A M B I A E C O N O M I C B R I E F - H O W Z A M B I A C A N B O R R O W W I T H O U T S O R R O W 1 0 t h Z A M B I A E C O N O M I C B R I E F - H O W Z A M B I A C A N B O R R O W W I T H O U T S O R R O W
30
Sector ministries plan and implement their own investments with very limited support or oversight.
F. HOW WELL HAS THE DEBT BEEN INVESTED?
Africancountriesareunder-invested.Abuild-upofdebtisfineifproductiveassetsarebeingbuilt.However,intoomanycasesitisnot.Debtisaflowandthereremainsaneedtolookatanychang-esinassetsitprovoked;bothphysicalcapital(structures,cities,infrastructure),andhumancapital(skills,health,population).InZambia,majorshortcomingsremainwithGovernment’smanagementofpublicinvestment.Alltoofrequently,reasonablecostisnotachieved(examplesincludethehighcostsperkilometreofroad).
Following the increased levels of borrowing, the amount of public investment increased from 3.4% of GDP in 2011 to 7.0% of GDP in 2015 (in 2016 and 2017, it has declined following a drop in available financing). However, the scale-up in public investment was rather haphazard, and there are many shortcomings linked to the absence of a public investment management (PIM) system.
Public investment management (PIM) systemDespite a rhetoric of reform and per a public assessment in 2014: “the PIM system re-mains largely inefficient and certain key functions of project evaluation are missing or present in rudimentary form”27. Since 2014, progress has also been very limited. In 2015, the government split the finance and planning ministry into the Ministry of Finance and the Ministry of National Development Planning (MoNDP), with the MoNDP responsible for establishing and utilizing a PIM system and ensuring investments are in support of the national development plan. However, as of November 2017, there is still no central challenge function.
Sector ministries plan and implement their own investments with very limited support or oversight. There is no comprehensive and central database of projects and there is limited coordination, while ideas for large public investment projects come directly from the political level and progress to financial closure without screening or appraisal. Some are not even adequately designed before financing is sought. Improving the challenge function of the MoF and MoNDP regarding public investment is essential if value for money is to be achieved and the national development plan is to be followed.
The Minister of Finance stressed in the 2018 budget proposal that the government would strengthen its PIM system28. Efforts are needed to focus the PIM reform agenda on the key bottlenecks (the characteristics of a functioning PIM system are noted in box 7). The World Bank Public Financial Management (PFM) project has a PIM component that could be used by the government to finance the development of the system.
Box Essential features of a PIM system 1. Preliminary Screening. A first level screening of all project proposals should be undertaken to ensure that they meet the minimum criteria of consistency with the strategic goals of Government.
2. Formal Project Appraisal. Projects or programs that meet the first screening test should undergo more rigorous scrutiny of their cost and benefits. Where departments and ministries (rather than a central unit) undertake the appraisal, an independent peer review might be necessary.
3. Project Selection and Budgeting. The process of appraising and selecting public investment projects must be appropriately linked to the budget cycle, even if the project evaluation cycle runs on a different timetable.
4. Project Implementation. Project design should include clear organizational arrangements and a realistic timetable to ensure the capacity to implement the project. There should also be a review process to take account of changes in project circumstances.
5. After Project Evaluation. This process should be focused on comparing the project’s outputs and outcomes with the established objectives in the project design.
Source: Adapted from Rajaram and others (2010)29.
7
1 0 t h Z A M B I A E C O N O M I C B R I E F - H O W Z A M B I A C A N B O R R O W W I T H O U T S O R R O W
31

The first two Eurobonds were accompanied by a detailed plan on how they would be spent, the third Eurobond had no such plan.
Use of the EurobondsThe first two Eurobonds were accompanied by a detailed plan of how they would be spent (table 7). The third Eurobond had no such plan, but statements were made after it was issued that it would be used for infrastructure, and some areas were highlighted in the media by the then Deputy Minister of Finance30. Most of the resources were earmarked for the transport sector and mainly the road sector. Roads therefore are a good lens through which to assess how well borrowed resources have been invested. Where resources have not been linked to specified investment, it is most likely that they have been used to finance Government’s consumption.
Most of the recent trunk road investments since 2011 have been delivered as part of the Link Zambia 8000 (US$5.4 billion for 8,000km of roads, 2012-17) and the Pave Zam-bia 200 project. Other urban road programs, include Lusaka 400 (US$350 million to rehabilitate and upgrade 400km) and the Copperbelt 400 (US$492 million for 406km).
To fund these ambitious programs, the government utilized lending from China, other traditional and non-traditional development partners, and US$ 28 million earmarked from the Eurobond proceeds. There is not much argument about whether investment in infrastructure is necessary (Zambia’s infrastructure lags that of southern African peers and is important for growth31), but there has been concern about whether the right projects have been selected and whether value for money has been achieved.
Source: : Bloomberg and Ministry of Finance Note: Recapitalization includes Development Bank of Zambia, National Saving and Credit Bank, Zambia National Building Society
Table Eurobonds 2012 to 2015
7
255
310
120
-
29
-
20
-
16
- 100 200 300 400 500
Electricity
Roads
Railway
Air and Maritime Transport
Health, Education and Youth
Agriculture
Recapitalisation of Banks*
Administration
Not-specified
-
218
40
83
172
28
54
153
252
- 100 200 300 400 500
Electricity
Roads
Railway
Air and Maritime Transport
Health, Education and Youth
Agriculture
Recapitalisation of Banks*
Administration
Not-specified
-
400
-
40
111
21
-
268
410
- 100 200 300 400 500
Electricity
Roads
Railway
Air and Maritime Transport
Health, Education and Youth
Agriculture
Recapitalisation of Banks*
Administration
Not-specified
Maturity = September, 20 2022.
US$750 million issued in 2012.
Coupon rate: 5.375 %
Semi-annual Coupon Payment US$20.2m.
Maturity = April, 14 2024.
US$1,000 million issued in 2014.
Coupon rate: 8.5%.
Semi-annual Coupon Payment US$42.5m.
Maturity = 2025, 2026, 2027 (3 equal installments).
US$1,250 million issued in 2015.
Coupon rate: 8.97%.
Semi-annual Coupon Payment US$56.1m.
Issue Planned Usage (US$ million)
1 0 t h Z A M B I A E C O N O M I C B R I E F - H O W Z A M B I A C A N B O R R O W W I T H O U T S O R R O W 1 0 t h Z A M B I A E C O N O M I C B R I E F - H O W Z A M B I A C A N B O R R O W W I T H O U T S O R R O W
32
Most of the resources were earmarked for the transport sector and mainly the road sector.
Zambia’s roads stand out as being very expensive.

The road programs were very ambitious (9,000km of roads in five year) and were not well prioritized. A framework was absent to direct resources if less than US$6 billion were made available. When the available resources fell short of this figure, the selec-tion of roads became haphazard and was not always motivated by economic and social returns.
The cost of the roads has also been high relative to the cost of construction elsewhere in the region. For Zambian roads, the median cost of construction and upgrading of paved roads under 100km was US$457,000 per km per lane, and for roads over 100km the median cost was US$360,000. When compared to the median cost of paving roads in the region, Zambia’s roads stand out as being very expensive (box 8).
It is often argued that Zambian roads are more expensive than other countries’ in the region because of the higher cost of inputs such as steel, cement and bitumen. Howev-er, the difference in the cost of bitumen and cement explains only some of the high cost of Zambia’s roads. The reason for the high costs relates more to poor public investment management (especially a lack of competitive tendering) and long delays in payments.
The much higher costs of road building increase the avenues for corruption. Interna-tional evidence highlights that the costs of road construction are higher in countries with higher levels of corruption and that these effects are robust to controlling for a country’s public investment capacity and business environment32. An investigation into roads contracts by the Auditor General in 2009 also showed that unit costs are substan-tially higher than they need be, based on detailed procurement, financial and technical audits that revealed widespread inefficiency in the management of road contracts33.
Box Have roads been completed at reasonable cost in 2011-16? A study of 172 World Bank and African Development Bank (AfDB) road projects in Africa revealed that the costs of roads depended on their length (longer roads were cheaper due to economies of scale). For the construction and upgrading of paved roads under 100km, the median cost was US$271,023 per km per lane (NB the figures have been deflated from 2006 US$ in the AfDB study to 2016 US$). For roads over 100km, the median cost was US$175,011 per km per lane. The top quartile (25%) of the roads cost US$506,116 per km per lane (under 100km) and US$192,738 per km per lane (over 100km).
A sample of 31 Zambian road projects (covering 3,470km) reveals that the median cost of construction and upgrading of paved roads was US$ 402,000 per lane per km (2016 US$) and the average cost was US$ 627,000. For roads under 100km, the median cost was US$457,000 per km per lane and over 100km, the median cost was US$360,000.
One very important consideration is that there is no such thing as a ‘typical’ unit cost. This is because (i) unit costs are calculated through a process of standardizing projects that are broadly similar but which differ in their design details and specific circumstances, and (ii) the size of the project invariably has an overriding effect on the unit rate (economy of scale). The first issue is largely overcome by excluding major project and location-specific factors (e.g. bridges, taxes). The second issue is something that anyone estimating or evaluating roads costs should be vigilant about.
Source: World bank calculations using RDA data and AfDB (2014)34.
8
1 0 t h Z A M B I A E C O N O M I C B R I E F - H O W Z A M B I A C A N B O R R O W W I T H O U T S O R R O W
33
International evidence highlights that the costs of road construction are higher in countries with higher levels of corruption.
G. IDEAS TO BORROW WITHOUT SORROW
Zambia has huge development needs, and access to new borrowing sources provides good opportu-nitiesfordevelopmentfinance.However,effortsareneededtobothreducethepaceatwhichdebthas been accumulating and to strengthen the management of debt and public investment, if debt distress is to be avoided. This includes shifting to an ‘active’ approach to debt management.
The environment for public debt management in Zambia has been changing, and it will continue to change in the coming years. Access to grants and to funding on conces-sional terms will reduce, and debt issued on market terms will increase. The bad news is that cost will increase further. The good news is that market borrowing comes with financial choices, i.e. the government can better achieve its preferred debt composition and risk exposure.
The tragedy is not the recent rapid build-up of debt, but the lack of productive assets Zambia can show from the borrowing. A new approach, that closely links managing in-vestment and responsible borrowing, is required going forward. The following ideas are provided to support the government in meeting these challenges:
1. Halt the pace at which debt is accumulating.The World Bank and IMF debt sustainability analysis has shifted Zambia to high risk of debt distress. This assumes that current policies continue and new loans totaling US$3.5 billion are added to the US$4 billion of already contracted debt over the next five years. However, there is another path (the adjustment scenario) in which the gov-ernment halts the signing of any new non-concessional borrowing, except for a US$282 million government communications project and any issuance with the purpose of re-ducing the repayment risks or rolling-over the existing Eurobonds. To achieve this alter-native route, where Zambia shifts back to ‘moderate risk’ of debt distress, the govern-ment could:
• Carry out a full review of the non-concessional loan pipeline: (i.e. those that have not yet started to disburse). This can be done with the intention of reducing the number and scale of commitments. A verification could be conducted of whether the projects contribute to the 7NDP, and whether they have been well designed and appraised. Only projects with the highest returns should be short-listed and some of these might need to be delayed in order ensure debt sustainability.
• Reduce refinancing risks of the portfolio: Drop the idea of a sinking fund and instead plan to reduce the cost of borrowing, and to extend maturities by buying back some of the outstanding Eurobond debt in the years prior to their maturity.
2. Switch from passive to active debt management.Being ‘active’ means implementing a well-crafted strategy to reduce the cost of borrow-ing, extending the terms, and diversifying the sources of debt funding. The following steps will help achieve this:
• Annually Update the Debt Strategy: A medium-term debt strategy has been published for the first time in 2017. Going forward, the quality of the strategy needs to be improved and it should be a ‘rolling’ strategy that is updated annually. The strategy should not only guide a slowdown of the accumulation of debt, but should also shift the composition and manage the risks of the portfolio. Government should have an internal borrowing plan that they use to achieve guided activities in pursuit of the objectives in the strategy.
• Complete the reorganization of the debt office: This should be along functional lines (box 6). A functioning back office should be responsible for debt recording and the initiation of debt service payments. Ensuring the debt database is being operated properly is also a core function. The middle office needs to do the analysis for internal and external purposes, and lead on the formulation of the strategy and sustainability analysis. The front office needs to be in regular contact with market participants such
1 0 t h Z A M B I A E C O N O M I C B R I E F - H O W Z A M B I A C A N B O R R O W W I T H O U T S O R R O W
34
The tragedy is not the recent rapid build-up of debt, but the lack of productive assets Zambia can show from the borrowing.
The World Bank and IMF debt sustainability analysis has shifted Zambia to high risk of debt distress.
Being ‘active’ means implementing a well-crafted strategy to reduce the cost of borrowing, extend the terms, and diversify the sources of debt funding.
as commercial and official lenders. The office should also prepare policies and regu- lations for issuing guarantees and guidelines for SOE and PPP related borrowing.
• Formulate a debt management reform plan: This plan would guide the next set of reforms, including the above, and would further strengthen the legal framework and improve operational risk management.
• Strengthen Public Investment Management: This is necessary because it is crucial that borrowed money is invested in an effective manner. The MoF and MoNDP crucially need to perform a gatekeeper function for public investment pro- jects. Efforts are needed to build the essential features of a PIM system presented in Section D (box 7). A full government-led evaluation of road sector investment in 2012-17 would also be an important step in lesson learning.
1 0 t h Z A M B I A E C O N O M I C B R I E F - H O W Z A M B I A C A N B O R R O W W I T H O U T S O R R O W
35
Strengthen Public Investment Management, because it is crucial that borrowed money is used in an effective manner.

1 World Bank (2017a), ‘Africa’s Pulse’, October 2017 edition, Washington DC.
2 World Bank (2017), ‘Macro-Poverty Outlook: Zambia’, October 2017.
3 Central Statistical Office (2017), ‘Crop Production Forecasts’, Government of the Republic of Zambia, Lusaka.
4 Ministry of Finance (2017), ‘Mid-Year Economic Review’, Government of the Republic of Zambia, Lusaka.
5 Bank of Zambia (2017), ‘Monetary Policy Committee Statement for Q3 2017’, November 2017, Lusaka.
6 Central Statistical Office (2017b), ‘October Monthly Report’, Government of the Republic of Zambia, Lusaka.
7 Bank of Zambia (2017), ‘Monetary Policy Committee Statement for Q3 2017’, November 2017, Lusaka.
8 Bank of Zambia (2017), ‘Monetary Policy Committee Statement for Q1 2017’, February 2017, Lusaka.
9 Bank of Zambia (2017), ‘Statistical Fortnight’, October 2017, Lusaka.
10 Bankers Association of Zambia (2017), ‘Why Interest Rates Remain High’, October 2017, Lusaka.
11 Bank of Zambia (2016), ‘Interest Rates and Bank Charges for Personal Accounts and Other Retail Accounts’, December 2016, Lusaka.
12 Roger, L., Smith, G., and O. Morrissey (2017), ‘Exchange Rate and Inflation Dynamics in Zambia’, Washington, D.C.: World Bank Group.
13 Ministry of Finance (2016), ‘Economic Stabilization and Growth Program – Zambia Plus’, Government of the Republic of Zambia, Lusaka.
14 ZEITI (2015), ‘Zambia Extractive Industries Transparency Initiative Reports’ Lusaka.
15 World Bank (2017), ‘Doing Business 2018: Zambia’, Washington DC.
16 World Bank (2017), ‘Reaping Richer Returns from Public Expenditures in Agriculture’, Zambia Economic Brief 9, Washington DC.
17 First Quantum Minerals (2017), ‘Condensed Interim Consolidated Financial Statements: Third Quarter’, September 2017.
18 World Bank (2017). Macro-Poverty Outlook: Zambia’, October 2017, Washington DC.
19 Reuters (2017), ‘Copper Demand for Electric Cars to Rise Nine-fold by 2027’, July 2017.
20 World Bank (2016), ‘Beating the Slowdown: Making Every Kwacha Count’, Zambia Economic Brief 7, Washington DC.
21 World Bank (2016), ‘Rising Revenue for Economic Recovery’, Zambia Economic Brief 8, Washington DC.
22 IMF (2017), ‘2017 Article IV Consultation’, IMF country Report N. 17/327.
23 Smith, G., F. Davies and Z. Chinzara (2016), ‘Beating the Slowdown: Reducing Fiscal Vulnerabilities for Economic Recovery’, MFM Policy Note,
September 2016.
24 Government of the Republic of Zambia (1996). ‘The Bank of Zambia Act, 1996’. Ministry of Justice.
25 IMF (2017), ‘2017 Article IV Consultation’, IMF country Report N. 17/327.
26 Ministry of Finance (2016), ‘Economic Stabilization and Growth Program – Zambia Plus’, Government of the Republic of Zambia, Lusaka.
27 Le, T. M., Raballand, G. and P. Palale (2014), ‘Zambia: Rebuilding a Broken Public Investment Management System’. World Bank, Washington,
DC. https://openknowledge.worldbank.org/handle/10986/21052 License: CC BY 3.0 IGO.
28 GRZ (2017) 2018 budget proposal.
29 Rajaram, A., Minh Le, T., Kaiser, K. Kim, JH, and F. Jonas. (2014), ‘The power of public investment management: transforming resources into
assets for growth.’ Washington, DC; World Bank Group. management-transforming-resources-into-assets-for-growth.
30 Lusaka times, July 2015: https://www.lusakatimes.com/2015/07/24/zambia-successfully-issues-us1-25-billion-eurobond/.
IENDNOTES
1 0 t h Z A M B I A E C O N O M I C B R I E F - H O W Z A M B I A C A N B O R R O W W I T H O U T S O R R O W 1 0 t h Z A M B I A E C O N O M I C B R I E F - H O W Z A M B I A C A N B O R R O W W I T H O U T S O R R O W
36
31 Foster, V. and C. Dominguez (2010), ‘Zambia’s Infrastructure: A Continental Perspective’ Country Report for the African Infrastructure Country
Diagnostic, World Bank.
32 Paul, C., Kirchberger, M. and M. Söderbom (2015), ‘The Cost of Road Infrastructure in Low and Middle Income Countries’, World Bank Policy
Research Working Paper 7408, September 2015.
33 Raballand, G. and A. Whitworth (2014), ‘Transport Policy’, in ‘Zambia: Building Prosperity from Resource Wealth’, edited by Adam, C., Collier,
P., and M. Gondwe; Oxford University Press.
34 AFDB (2014), ‘Study on Road Infrastructure Costs: Analysis of Unit Costs and Cost Overruns of Road Infrastructure Projects in Africa’, Statistics
Department (ESTA) May 2014.
1 0 t h Z A M B I A E C O N O M I C B R I E F - H O W Z A M B I A C A N B O R R O W W I T H O U T S O R R O W
37
ZAMBIA ECONOMIC BRIEF HOW ZAMBIA CAN BORROW WITHOUT SORROW
The World Bank GroupLusaka Country Office2nd Floor, Bank ABC House746 Church RoadP.O. Box 35410Lusaka, Zambia
Tel: +260 211 373200 +260 211 373217Fax: +260 211 373248www.worldbank.org/zambia
1 0 t h Z A M B I A E C O N O M I C B R I E F - H O W Z A M B I A C A N B O R R O W W I T H O U T S O R R O W