pt paiton energy compiled(1).docx
DESCRIPTION
case study of Paiton EnergyTRANSCRIPT
PT Paiton Energy Indonesia
Syndicate 3
Hanna Friska Stephanie 29111020
Firra Astria Noezar 29111306
Alfan 29111356
Ridzki Anfasa 29111358
Sandy Widya 29111359
Darmawan Wijaya 29111351
MASTER OF BUSINESS ADMINISTRATION
SCHOOL OF BUSINESS AND MANAGEMENT
INSTITUT TEKNOLOGI BANDUNG
2013
Literature Review
Project Finance
Based on International Project Finance Association (IPFA), project finance is the financing of long-term
infrastructure, industrial projects and public services based upon a non-recourse or limited recourse
financial structure where project debt and equity used to finance the project are paid back from the cash
flow generated by the project.
Project finance is different from traditional forms of finance because the financier principally looks to the
assets and revenue of the project in order to secure and service the loan. In contrast to an ordinary
borrowing situation, in a project financing the financier usually has little or no recourse to the non-
project assets of the borrower or the sponsors of the project. In this situation, the credit risk associated
with the borrower is not as important as in an ordinary loan transaction; what is most important is the
identification, analysis, allocation and management of every risk associated with the project.
Public Private Partnership (PPP)
Public Private Partnership is a contract between a public sector authority and a private sector entity
pursuant to which the private sector party agrees to perform some or all of the aspects of an
infrastructure project or public services (for example construction, operations and maintenance).
Through this agreement, the skills and assets of each sector (public and private) are shared in delivering
a service or facility for the use of the general public. In addition to the sharing of resources, each party
shares in the risks and rewards potential in the delivery of the service and/or facility. PPPs are used for
public and social infrastructure projects such as highways, power plants, bridges, pipelines, airports and
schools. Depending on the structure of the PPP and the nature of the project, ownership of the project
may be leased or owned by the private sector party for a specified period.
Build Operate Transfer (BOT)
Build Operate Transfer (BOT) is a type of arrangement in which the private sector builds an
infrastructure project, operates it long enough to payback project debt and equity investment and
eventually transfers ownership of the project to the government. In many instances, the government

becomes the firm's only customer and promises to purchase at least a predetermined amount of the
project's output.
The advantages of BOT are:
Increased speed to market off-shore for Client
Reduced risks of mistakes, particularly geo-political issues involved with start-up and operations
Reduced financial risk, the BOT financial commitment is only through the operate phase, while
building one’s own center from scratch would typically be a longer term financial commitment
by Client
Build Own Operate (BOO)
Build Own Operate (BOO) is a type of arrangement in which a private organization builds, owns and
operates some facility or structure with some degree of encouragement from the government. Although
the government doesn't provide direct funding in this model, it may offer other financial incentives such
as tax-exempt status. The developer owns and operates the facility independently. The advantages of
BOO is offering lowest price tariff than BOT and BOOT.
Build Own Operate Transfer (BOOT)
Build Own Operate Transfer (BOOT) is a type of arrangement in which a private organization conducts a
large development project under contract to a public-sector partner, such as a government agency. This
project is often seen as a way to develop a large public infrastructure project with private funding.
The BOOT steps are:
1. The public-sector partner contracts with a private developer - typically a large corporation or
consortium of businesses with specific expertise - to design and implement a large project.
2. The public-sector partner may provide limited funding or some other benefit (such as tax
exempt status) but the private-sector partner assumes the risks associated with planning,
constructing, operating and maintaining the project for a specified time period.
3. During that time, the developer charges customers who use the infrastructure that's been built
to realize a profit.
4. At the end of the specified period, the private-sector partner transfers ownership to the funding
organization, either freely or for an amount stipulated in the original contract.
The advantages of BOT are:
The majority of construction and long-term operating risk can be transferred onto the BOOT
provider.
Corporate structuring issues and costs are minimal within a BOOT model, as project funding,
ownership and operation are the responsibility of the BOOT operator
Limited Recourse Basis
Limited Recourse Basis is a financing arrangement where the lender can require the borrower to repay
only in special conditions that are spelled out in the loan agreement itself, and otherwise must look to
the collateral as a source of repayment. Borrowers may have to pay more for limited recourse financing.
Cost-plus Basis
An agreement to pay a company for a job based on the amount of money used to buy the materials
required to complete that job plus an added payment. A cost-plus basis fully reimburses a contractor for
the cost of materials and then adds additional money to arrive at the total cost of the job.
Case Review
Background
By 1994 Indonesia’s economy was growing at more than 7 percent a year and electricity demand was
growing at more than 14 percent a year. PLN had not been able to meet the demand. It was estimated
that Indonesia would require an additional 24.000 MW of capacity, an increase of 75 percent, over the
following 10 years, at a cost of US$35 – 60 billion. Most of this new capacity would come from
Independent Power Plants (IPPs) as part of the country’s independent power programme. PT Paiton
Energy is an Indonesian limited liability company owned by MEC Indonesia, an indirect subsidiary of
Edison Mission Energy Company. The project originated in 1991 when the Indonesian Ministry of Mines
and Energy invited competitive proposals for the private development of two 600 MW units in the
Paiton complex. In August 1992. after several clarification sessions with each bidding group, the
Government of Indonesia awarded the sponsors the exclusive right to conduct further negotiations on
the proiect. From the end of 1992 until March 1994, the sponsors negotiated the power purchase
agreement with the Government of Indonesia.
Principal Project Contracts
The principal project contracts are the PPA, the construction contract, the warranties, the operation and
maintenance agreement, the fuel supply agreement, the coal purchase agreement, the mining and
barging contract, the coal terminal services agreement, the contract of affreightment, and the Kelanis
Facility agreement.
The PPA defines the rights and obligations of Paiton Energy and PLN relating to development,
financing, construction, testing and commissioning of the project and operation and
maintenance of the plant; the making of capacity and energy payments. risk allocation in the
event of force majeure and changes in the regulatory environment; events of default; rights of
termination and consequences thereof; insurance, liability and indemnity obligations; and
dispute resolution.
The construction contract provides for the contractor, a consortium of Mitsui, Toyo, and
Duke/Fluor Daniel to provide design, engineering, procurement, construction, startup, testing
and commissioning services, and the equipment and materials necessary for construction of the
plant on a fixed-price, turnkey basis. If the plant is not in compliance with defined emissions
limits, the contractor pays US$750,000 per MW for each MW by which the net electrical output
has to be reduced in order to comply with emissions limits. If each unit does not achieve a
minimum electrical output of 61 5 MW, the contractor pays US$5 million per MW for each MW
by which the net electrical output falls below 61 5 MW.
The operation and maintenance agreement defines the terms under which Edison Mission
Energy's Indonesian affiliate will provide operations, maintenance, and repair services necessary
for the production and delivery of electricity.
The fuel supply agreement provides that BHP will be the exclusive supplier of coal to the project,
and defines BHP's obligations under the coal supply plan
The coal purchase agreement defines Adaro's obligations to sell to BHP all of the coal BHP is
obligated to deliver under the fuel supply agreement.
The mining contract between Adaro and PT Pamapersada defines PT Pamapersada's obligations
to mine coal, transport it to the Kelanis terminal, strip overburden, and provide routine
maintenance services on the roads between the mine and the terminal.
The barging contract between Adaro and PT Rig Tenders Indonesia describes the latter's
agreement to transport coal from Kelanis to the terminal.
The coal terminal services agreement describes PT Indonesia Bulk Terminal's agreement with
BHP to store coal in a terminal, blend coal located at the terminal, unload coal from barges, and
load coal onto vessels.
The contract of affreightment describes Louis Dreyfus et Cie's obligation to transport coal from
the Kelanis terminal to the Paiton plant.
The Kelanis facility agreement, signed by each of the sponsors, Paiton Energy, and Adaro,
defines Adaro's obligation to construct and operate a crushing and load-out facility and a coal
stockpile.
The coal supply plan, required under the PPA, is a plan for the reliable supply of coal submitted
to PLN by Paiton Energy.
The sponsors and lenders were concerned about the dependability of the fuel supply. Each hired
separate coal advisers. They did great deal of due diligence to verify the coal reserves, and to make sure
that it could be produced at a reasonable cost and delivered to the plant.

Negotiating the Power Purchase Agreement
Despite experience with private investors in other industries, the Indonesian government was just
beginning to learn about private power project financing. They explored the possibility of a corporate
commitment, but found the sponsors only willing to do a project financing on a limited recourse basis.
The Indonesian government was accustomed to purchasing plants on a cost-plus basis and needed to
learn why a fixed-price turnkey contract was required for a limited-recourse financing. The sponsors
persuaded PLN that the PPA should be more oriented toward defining the amount of power to be
delivered and giving the sponsors appropriate economic incentives.
Tariff Structure
The sponsors and PLN agreed on a tariff that declines over time. It was calculated to provide a
reasonable cost to PLN over the full 30 years on a discounted cash flow basis, but also to provide a cash
flow cushion in the early years when debt-service requirements would be particularly heavy. The
bankers thought that such a structure would help attract the debt that was required. The problem with
that structure was a public perception that the tariff was high in the earlier years, even though it was
lower in the final 18 years of the contract. The PPA defines four tariffs, tariffs A, B. C, and D. Tariffs A and
B are capacity payments that PLN has to make if the plant is ready to produce electricity, whether or not
PLN is taking it, and tariffs C and D are energy payments that PLN pays only when the plant is generating
electricity. The Tariffs structure can be seen on the following table
Year Tariffs (Cents / KWh)1-6 8.477-12 8.2713-30
5.45
Force Majeure Events
The PPA provides that if a force majeure event prevents PLN from receiving electricity, or is the result of
governmental action that affects the company's ability to produce electricity, the plant will be "deemed
dispatched" and PLN will remain obligated to make capacity payments as if the force majeure event had
not occurred. The plant will also be deemed dispatched if a coal supply force majeure event prevents

the Adaro mine from delivering coal and requires the company to limit output as a result of using
qualifying alternate coal to meet environmental requirements.
Event of default and termination
The events of default is divides by the PPA into remediable events and nonremediable events. Company-
remedial events include not achieving commercial operation by the target date, suspension of
construction or operation and various other obligations under the PPA. Non-remediable events that
remain uncured can lead to termination of the PPA (a party receiving notice of remediable event has 30
days to furnish the other party with a plan to cure the event). PLN can buy the plant at any time,
whether or not a nonremediable event has occured. PLN has the option not the obligation to purchase
the plant when there has been a company non-remediable event for an amount equal to principal and
interest under senior debt facilities minus unfunded sponsor commitments.
Foreign Exchange Protection
Based on the case, PLN is indicates willingness to provide rupiah-US dollar protection because most of
the country’s export earning are in dollars. but resisted rupiah-yen protection because Indonesia already
had heavy yen exposure and the yen was strengthening. If Paiton is unable to converts its rupiah
revenues to dollar, PLN has the responsibility to ensure that Paiton eventually gets the appropriate
amount of dollars.
Environmental Requirement
Environmental laws in Indonesia specified a maximum ground-level sulfur concentration for all eight
units at the Paiton site. The sponsors had to persuade PLN to establish specific environmental
requirements for Paiton Energy's two units. Othenvise, in the future, Paiton Energy could be penalised
for emissions of the other units. This was a risk that lenders would be unwilling to accept.
Negotiating Other Contract
The sponsors were reluctant to spend a lot of time negotiating the EPC, OGM, and fuel supply contracts
and requesting competitive bids for equipment before the PPA was finalised. The coordinating banks
had to try to move both the project contracts and the financing ahead at the same time. Some decision
on financing documents could not be made because the credit structure was not yet defined by the
project documents.

The Bank Underwriting
The sponsors wanted some kind of underwriting commitment from Chase and IBJ. Chase and IBJ had to
start by estimating the total amount that could be raised and the maximum tenor available from each
market such as the ECAs, the multilaterals, and the commercial banks.The ECAs were offering a
maximum maturity of 10 years for power plants, although there was some indication that they might go
out as far as 12 years in a competitive bidding situation. The commercial banks appeared to have a
capacity of about US$300-400 million dollars for uncovered Indonesian risk, and were willing to go out
as far as eight years, with a four-year construction period and four years of amortisation.
The two coordinating banks sought internal approval to underwrite the deal before syndication with as
much flexibility as possible. the coordinating banks talked to six additional commercial banks, hoping
that at least four would be willing to match Chase and IBJ's US$250 million underwriting commitments.
They all accepted, so all eight banks were ratcheted down to US$187.5 million.
The coordinating banks were used to working in a fluid environment. But the ECAs were not so flexible.
They said they didn't have enough information to analyse the credit because they didn't have the
project documents. Another delay was caused by Exim Banks, right from the beginning that they said
they would not assume construction risk, but after a lot of time and effort, the coordinating banks were
able to persuade Exim to take construction risk. An underwriting of this size prior to syndication was a
real milestone for the Asian market.
Structure of Financing
1. The US$900 million Jexim facility finances up to 85% of the amounts payable by Paiton Energy to
Mitsui for Japanese good and services pursuant to the construction contract, and for Indonesian
goods and services as long as they do not exceed 15 % of the amount exported from japan. The
Facility has two tranches:
• Tranches A: USS 540 million loan at a fixed rate of 9.44 %.
• Tranche B: Provide rates based on LIBOR ranging from 4.875% to 11.375%
2. US$ 540 Million four year US Exim loan with the interest rate of 9.382%
3. US$ 200 Million 12-year loan from OPIC based on LIBOR rates

4. The commercial bank facility has two tranches:
• Tranche A: USS180 million uncovered four-year construction loan at Libor plus 2.25 per
cent with a four-year amortisation period.
• Tranche B: US$93,750,000 uncovered stand-by contingent facility available for funding
project cost overruns after US$ 175 million sponsors' overrun equity is fully used.
5. US$ 374 Million subordinated debt from the sponsors
6. US$ 306 Million from equity
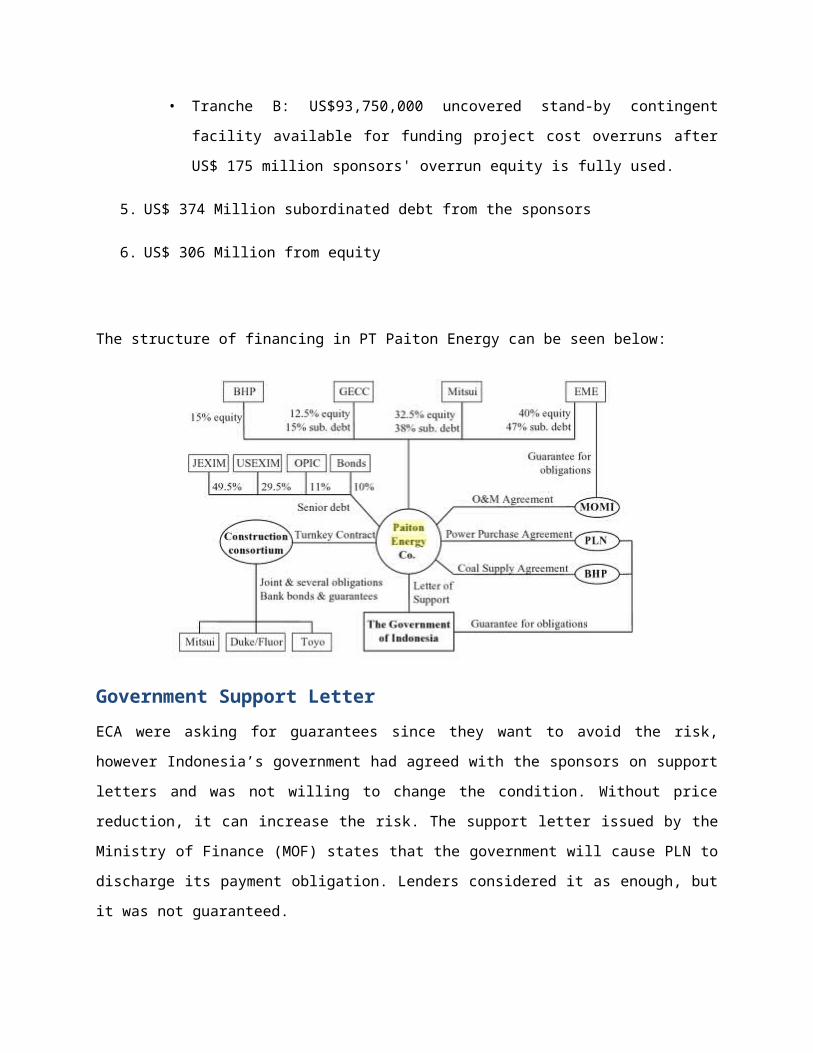
The structure of financing in PT Paiton Energy can be seen below:
Government Support Letter
ECA were asking for guarantees since they want to avoid the risk, however Indonesia’s government had
agreed with the sponsors on support letters and was not willing to change the condition. Without price
reduction, it can increase the risk. The support letter issued by the Ministry of Finance (MOF) states that
the government will cause PLN to discharge its payment obligation. Lenders considered it as enough, but
it was not guaranteed.

Meeting the Financial Closing Deadline
When PPA was signed in 12 February 1994, government set a one-year deadline for both signing loan
agreement and advancing the funds. If the deadline cannot be met, government could reopen
negotiations on the price defined in the PPA. As the deadline seemed unrealistic, the team kept
informing PLN for their milestone, therefor PLN can see the progress and the evidence. When the
documents were delivered, government decided to extend the closing from 12 February to 21 April.
Issues remaining until the end are the real estate security and the interpretation of the government
support letter. On the first issue, the lenders had to settle for a provision in the PPA that indemnified
project against claims against the site. For both issues, government is also unwilling to change their
mind. If the deal was not closed by 21 April, they would have the right to terminate PPA.
Intercreditor Issue
It is predicted that to arrange a deal with banks, bondholders, and ECA is very difficult due to the
intercreditor issue. Intercreditor issue is the problems among creditors about the set of position, right,
and liabilities of each creditors and its impact to the other creditors. Intercreditor agreements are often
used financing companies and lenders to determine relative rights of multiple creditors and establish
priorities in payments and other issues. It is common for the intercreditor agreement to include buy-out
rights that give the second lien lender the option to acquire, at par, the first lien lender’s claims and
liens. That purchase option is typically triggered by specified events, such as the filing of a bankruptcy
case by or against the borrower.
However, the 3 parties are able to sit together to reach agreements. If there is a default under the bank
ot the ECA agreement the bondholders can rely on cross-acceleration. Cross-acceleration is Common
stipulation in loan agreements under which a bank has a right to deny access to balances in any or all
loan accounts to a borrower (with several loans at the same bank) even if only one loan goes into
default. In fact, a bank can apply all available balance in all account of the borrower to satisfy any loan in
default. Bankers justify this clause on the logic that a default sours the bank client relationship, not a just
a loan agreement.
Credit Rating
Indonesia rating at that time was BBB according to Rule 144A. Therefore, Standard & Poor gave the US$
180 million of 9.75% bond privately placed. The primary risks are listed below:

- Three years of construction remained before commercial operation of the project began.
- Creditors’ right and enforcement were subject to uncertainty, lack of precedent, and
interpretative differently under Indonesian Law.
- Since the bond principle only presenting 10% of the US 1.8 billion debt outstanding, remedies
and abilities to take action would be controlled primarily by bank and agency lenders and not by
the bondholders.
Facing these risks, the rating agency listed number of strengths as the following:
- Project will help increasing capacity in Indonesia.
- The plant design.
- Project construction was to be under contract with highly qualified consortium.
- PPA and PLN are well-structured to hedge inflation, fuel price, and regulatory risk.
- The letter of support issued by the Government of the Republic of Indonesia.
- Project sponsors contributing 27% of the project capital and were obliged to provide up to
US$300 million in the overrun commitments.
Lesson Learned as of 1996
People from United States, Japan, and Indonesia were locked up in conference rooms for months. The
different cultures among them make it seemed that the deal was not going to get done. However, over
time they grew to understand each other.
The 12-month of deal was unrealistic. The common time in US on most independent power projects are
18 months. Most PPAs in US have sunset dates between 24-36 months from signing. The deadline would
be easier to be reached if the negotiations for more of contracts were started while PPA negotiations
were under way.
Indonesia’s Economy and Credit Rating
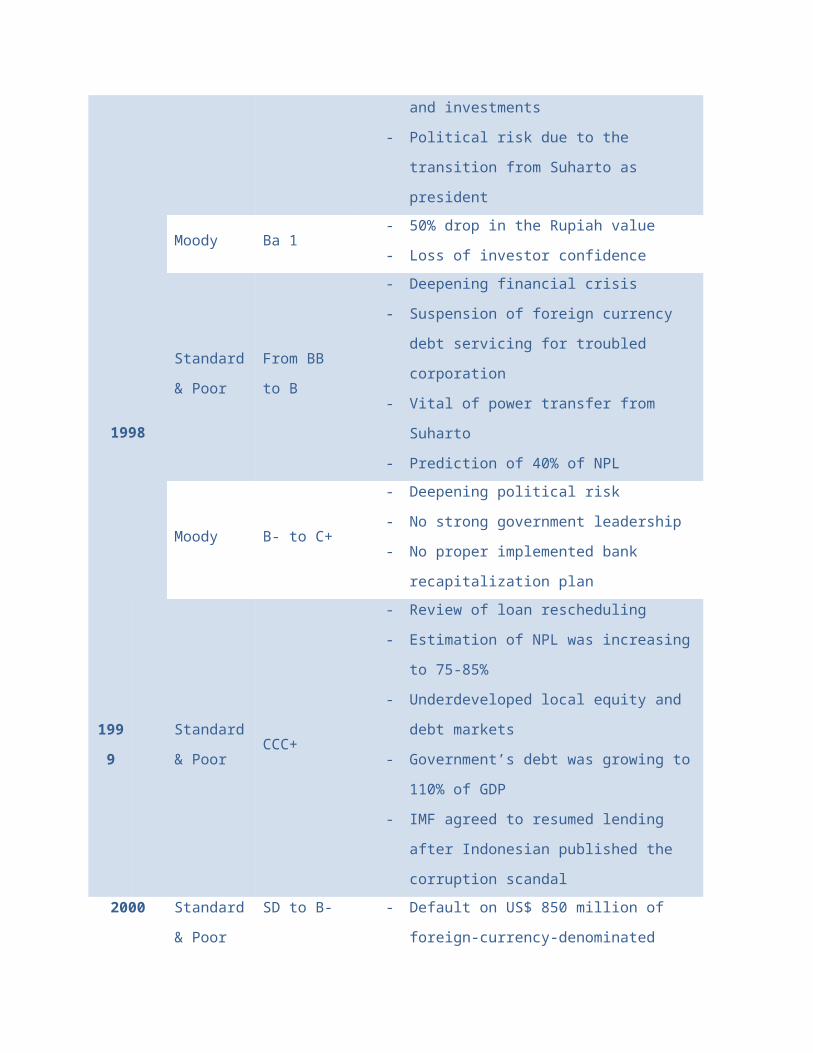
The following is the chronological of Indonesia’s economic condition affecting its credit rating since year 1997 to 2001:
Date Institution Credit Rating Economy
1997 Standard &
Poor
BBB - Market-oriented economic policies
- More than 30% of GDP on savings and
investments

- Political risk due to the transition from Suharto
as president
Moody Ba 1- 50% drop in the Rupiah value
- Loss of investor confidence
1998
Standard &
PoorFrom BB to B
- Deepening financial crisis
- Suspension of foreign currency debt servicing
for troubled corporation
- Vital of power transfer from Suharto
- Prediction of 40% of NPL
Moody B- to C+
- Deepening political risk
- No strong government leadership
- No proper implemented bank recapitalization
plan
1999Standard &
PoorCCC+
- Review of loan rescheduling
- Estimation of NPL was increasing to 75-85%
- Underdeveloped local equity and debt markets
- Government’s debt was growing to 110% of
GDP
- IMF agreed to resumed lending after
Indonesian published the corruption scandal
2000Standard &
PoorSD to B-
- Default on US$ 850 million of foreign-currency-
denominated commercial bank loans
- Rescheduling of about US$5.8 billion of
principal on bilateral debt
- Suffering from uncertainties regarding legal
reform, bank lending quality, and the sale of
assets by government-run Indonesian Bank
Restructuring Agency
2001 Moody B-
- Wahid’s faltering grip on power and interethnic
violence across archipelago
- Delay of IMF loan
Project Developments
In October 1997, Standard & Poor’s investigate that PLN was seeking to reopen the negotiation of PPAs
because the electricity tariffs that PLN was paying to the IPPs is higher than the tariffs that it charged to
consumers. Despite all of the country instability, in June 1998, no IPP had missed a payment from PLN
and Paiton project remained on schedule and would start operations in 1999. In September 1998 PLN
and Pertamina fail to make payment in full for electricity delivered by DSPL and CE Indonesia. Paiton
Energy power plant came on stream in May 1999, but PLN refused to buy power and paid Paiton Energy
only the cost of fuel. PLN also defaulted the first monthly bill to Paiton.
In October 1999, PLN filed a lawsuit seeking to nullify its PPA with Paiton Energy, because it was
negotiated on corrupt ground. But in December 1999, President Wahid ordered to drop the lawsuit and
renegotiate the original agreements. In February 2000, PLN and Paiton Energy reached an interim
agreement that PLN agrees to pay at a reduced rate. But this agreement was not sufficient as at the
reduced rate, Paiton could not make the principal payments on the bank loans. Later in 2000, tentative
agreement was reached which Paiton would gradually increase their rates starting from 2.6 cents per
KW hour with the opportunity to extend the 30-year term, build another power plant, and increase
electricity sales. By 2001, PLN reached another agreement with Paiton Energy to pay 4.93 cents per KW
per hour for 40 years and to pay arrears of $450 million.
In February 2002, PLN’s president expected that the electricity demand will grow at 8% annually. In
March 2002, Paiton Energy began to negotiate with lenders to finance Unit 3 and Unit 4 on Paiton
power plant site. In 2002, Paiton sponsors signed a term sheet for debt restructuring with the four major
agencies involved in the power plant.
Credit Rating of Paiton Energy
Date Institution Credit Rating
1997Standard & Poor’s From BBB to B
Moody’s From Baa3 to Ba1
1998Standard & Poor From B to CCC
Moody From Ba1 to Caa2
2000 Standard & Poor CCC to CC
2003 Moody’s B3
Risk Analysis
Risk Identification
No. Name of Risk Nature of Risk Remarks Manage Risk
1 Force majeure eventsDisaster Risk, Compliance Risk
Event prevents PLN from receiving electricity, or is the result of governmental action that affects the company's ability to produce electricity
Plant will be "deemed dispatched" and PLN will remain obligated to make capacity payments as if the force majeure event had not occured.
Event prevents the Adaro mine from delivering coal and requires the company to limit output as a result by using qualifying alternate coal to meet environmental requirements
Plant will be "deemed dispatched"
2 Underachievement risk Business RiskNot achieving commercial operation by the target date, suspension of construction or operation, and various other obligations under the PPA
Receiving notice of a remediable event has 30 days to furnish the other party with a plan to cure the event
3 Liquidity Risk Financial Risk Failure to make required payments
PLN has the option but not the obligation to purchase the plant when there has been a company non-remediable event for an amount equal to principal and interest under senior debt facilities minus unfunded sponsor commitments
4 Foreign Exchange Risk Market RiskRisk Exposed because Yen strengthened to US Dollar
Foreign exchange contracts
5 Emission Risk Environmental RiskEnvironmental laws in Indonesia specified a maximum d ground-level sulfur concentration for all eight units at the Paiton site
Using coal with a very low sulfur content
6 Undefine Project Documents Operational RiskSome decisions on financing documents could not yet be made because the credit structure was not yet defined by the project documents.
-
7 Construction RiskOperational Risk, Compliance Risk
Underachievment and not comply with government regulatory
If the plant is not in compliance with defined emissions limits, the contractor pays US$750,000 per MW for each MW by which the net electrical output has to be reduced in order to comply with emissions limits. If each unit does not achieve a minimum electrical output of615 MW,th e contractor pays US$5 million per MW for each MW by which the net electrical output falls below 615 MW.
8 Intercreditors disputes People Risk
Dealing across cultures, across time zones, and under time pressure made this project a particular challenge. People from the US, lapan, and Indonesia had very different approaches to business when they started to work together
Simply sitting down together and patiently working out each issue
9 Indonesian Risk Country riskRisk exposed because of political conditions in Indonesia
10 Credit Collateral Risk Financial Risk No actual guarantee from Government to banks
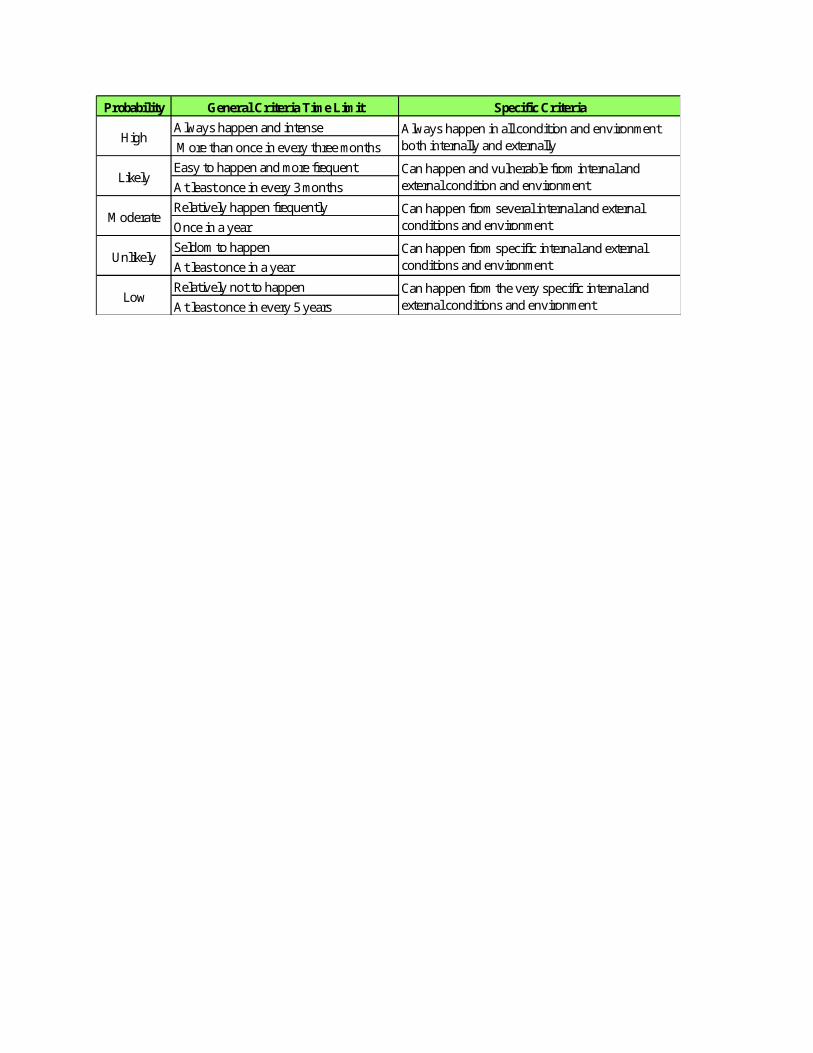
Risk Measurement
Probability General Criteria Time Limit Specific Criteria
Always happen and intense
More than once in every three months
Easy to happen and more frequent
At least once in every 3 months
Relatively happen frequently
Once in a year
Seldom to happen
At least once in a year
Relatively not to happen
At least once in every 5 years
ModerateCan happen from several internal and external conditions and environment
Low
UnlikelyCan happen from specific internal and external conditions and environment
Can happen from the very specific internal and external conditions and environment
HighAlways happen in all condition and environment both internally and externally
LikelyCan happen and vulnerable from internal and external condition and environment
Risk Mapping
Severity Corporate HR Finance
Long Term Negative ROI and ROE,
Credit Rating
Downgrade,
Stock Price Deterioration
MajorObjective may not be achieved, must modify strategy with big investment
Extra effort to maintain key personnelShort term stock price decline for one year
ModerateCorporate restructuring with moderate/low investment
Modify process business and review key personnelDecline ROI anbd ROE but price of stock relative stable
Minor Operation objectives can not be achieved Low motivation in key personnelDecline of ROI ad ROE compare with average industry
Insignificant Minor problems in operational objectives Key personnel only have minor problems ROI and ROE Still positive
CatastrophicObjective cannot be achieved, may have financial problems, incompetent, selling of SBU, even liquidation
Loss of key personnel bring losses to corporate competitiveness
Catastropic 1 Very Low
Major 3, 5, 10 4 8 Low
Moderate 9 2, 6, 7 Tolerable
Minor High
Insignificant Very High
Low Unlikely Moderate Likely High
No Name of Risk Nature of Risk Probability Severity Mapping
1 Force majeure eventsDisaster Risk, Compliance Risk
Unlikely Catastropic High
2 Underachievement risk Business Risk Likely Moderate High
3 Liquidity Risk Financial Risk Unlikely Major Tolerable
4 Foreign Exchange Risk Market Risk Moderate Major High
5 Emission Risk Environmental Risk Unlikely Major Tolerable
6 Undefine Project Documents
Operational Risk Likely Moderate High
7 Construction RiskOperational Risk, Compliance Risk
Likely Moderate High
8 Intercreditors disputes People Risk Likely Major Very High
9 Indonesian Risk Country risk Unlikely Moderate Low
10 Credit Collateral Risk Financial Risk Unlikely Major Tolerable

Financial Analysis
Initial Agreements
Energy Produced
To calculate the annual energy produced, the formula are:
Output=Capacity x Number of Hours x Availability Factors
Paiton energy installed 2 of 615 MW power plant, making it able to produce 1,230,000 KW per
hours
Total number of hours in a year is 24 x 365=8760hours
The availability factors of Paiton 1 is 83%
Based on the data above, the total energy that Paiton 1 produced each year are 8,943,084,000 KW.
Tariffs Structure
The initial tariffs that had agreed on the PPA between PLN and Paiton are:
Year Tariffs (Cents / KWh)
1-6 8.47
7-12 8.27
13-
30
5.45
The tariffs are based on four components, and the structures of the tariffs are:
No Cost Components First 6 years Cost
7-12 Year Cost
13-30 Year Cost
1 Component A (element of payback period of investment)
7.07 6.87 4.05
2 Component B (element of fixed costs for operations and maintenance)
0.4 0.4 0.4
3 Component C (element of fuel cost) 1.0 1.0 1.04 Component D (element of variable cost for
operations and maintenance)0.1 0.1 0.1
Total Cost of Generation (US Cents / KWh) 8.47 8.27 5.45The calculation of the generation cost is based on the following assumptions:
The price of component B,C,D did not change for the rest of the agreement
The calculation above does not include 30% tax
Calculation on Initial Agreements
Based on the above data and assumptions we can generate the annual Free Cash Flow of Paiton Energy
by :
FreeCashFlow=Component A x Energy Produced x (1−Tax)
Based on the formula above, the annual Free Cash Flow of Paiton are:
Year Free Cash Flow
1-6 US$ 442,593,227.16
7-12 US$ 430,072,909.56
13-
30
US$ 253,536,431.40
After the annual free cash flow is gained, we can calculate the Payback Period, Net Present Value and
Internal Rate of Return on this projects:
Initial AgreementsPayback Period 5.65 NPV $ 1,742,530,808.16 IRR 16%
The Assumption used in these calculations are:
Tax rate is 30%
The discounted factor is 8% as it is the growth rate of electricity demand
There are no new investment made during the years
There are no changes in the working capital
The detailed calculation of the Payback Period, NPV and IRR for the initial agreement can be seen in the following table:
Year Free Cash Flow Acc. FCF PVIF PV FCF0 (2,500,000,000.00)$ (2,500,000,000.00)$ 1.000 (2,500,000,000.00)$ 1 442,593,227.16$ (2,057,406,772.84)$ 0.926 409,808,543.67$ 2 442,593,227.16$ (1,614,813,545.68)$ 0.857 379,452,355.25$ 3 442,593,227.16$ (1,172,220,318.52)$ 0.794 351,344,773.38$ 4 442,593,227.16$ (729,627,091.36)$ 0.735 325,319,234.61$ 5 442,593,227.16$ (287,033,864.20)$ 0.681 301,221,513.53$ 6 442,593,227.16$ 155,559,362.96$ 0.630 278,908,808.82$ 7 430,072,909.56$ 585,632,272.52$ 0.583 250,943,411.99$ 8 430,072,909.56$ 1,015,705,182.08$ 0.540 232,355,011.10$ 9 430,072,909.56$ 1,445,778,091.64$ 0.500 215,143,528.80$
10 430,072,909.56$ 1,875,851,001.20$ 0.463 199,206,971.11$ 11 430,072,909.56$ 2,305,923,910.76$ 0.429 184,450,899.18$ 12 430,072,909.56$ 2,735,996,820.32$ 0.397 170,787,869.61$ 13 253,536,431.40$ 2,989,533,251.72$ 0.368 93,224,819.65$ 14 253,536,431.40$ 3,243,069,683.12$ 0.340 86,319,277.46$ 15 253,536,431.40$ 3,496,606,114.52$ 0.315 79,925,256.91$ 16 253,536,431.40$ 3,750,142,545.92$ 0.292 74,004,867.51$ 17 253,536,431.40$ 4,003,678,977.32$ 0.270 68,523,025.47$ 18 253,536,431.40$ 4,257,215,408.72$ 0.250 63,447,245.80$ 19 253,536,431.40$ 4,510,751,840.12$ 0.232 58,747,449.82$ 20 253,536,431.40$ 4,764,288,271.52$ 0.215 54,395,786.87$ 21 253,536,431.40$ 5,017,824,702.92$ 0.199 50,366,469.32$ 22 253,536,431.40$ 5,271,361,134.32$ 0.184 46,635,619.74$ 23 253,536,431.40$ 5,524,897,565.72$ 0.170 43,181,129.39$ 24 253,536,431.40$ 5,778,433,997.12$ 0.158 39,982,527.21$ 25 253,536,431.40$ 6,031,970,428.52$ 0.146 37,020,858.53$ 26 253,536,431.40$ 6,285,506,859.92$ 0.135 34,278,572.71$ 27 253,536,431.40$ 6,539,043,291.32$ 0.125 31,739,419.18$ 28 253,536,431.40$ 6,792,579,722.72$ 0.116 29,388,351.09$ 29 253,536,431.40$ 7,046,116,154.12$ 0.107 27,211,436.20$ 30 253,536,431.40$ 7,299,652,585.52$ 0.099 25,195,774.26$

Actual Conditions and New Agreements
Energy Produced
In the final agreements of PLN and Paiton in 2001, Paiton negotiated that they can generate more
capacity to 85%. To calculate the annual energy produced, the formula are:
Output=Capacity x Number of Hours x Availability Factors
Paiton energy installed 2 of 615 MW power plant, making it able to produce 1,230,000 KW per
hours
Total number of hours in a year is 24 x 365=8760hours
The availability factors of Paiton 1 is changed 85% based on the new agreements
Based on the data above, the total energy that Paiton 1 produced each year are 9,158,580,000 KW
Tariffs Structure
In remainder of 1999, PLN refuse to pay Paiton and only pay for the fuel cost (Component C) amount at
1 Cent per KWh. In 2000, PLN pays Paiton 3.3 cents per Kwh according to the interim agreements. In
2001 PLN and Paiton reached a tentative agreement to pay 2.6 Cents per KwH. And finally the tariffs
agreed on the PPA between PLN and Paiton had been negotiated in 2002 to the price of 4.93 Cents per
KWh for 40 Years.
Tahun Tahun ke
Tariffs (Cents / KWh)
1999 1 12000 2 3.32001 3 2.62002-2038 4-40 4.93
No
Cost Components New Agreement Cost
1 Component A (element of payback period of investment) 3.53

2 Component B (element of fixed costs for operations and maintenance)
0.4
3 Component C (element of fuel cost) 1.04 Component D (element of variable cost for operations and
maintenance)0.1
Total Cost of Generation (US Cents / KWh) 4.93
Calculation on Actual Condition and New Agreements
Based on the above data and assumptions we can generate the annual Free Cash Flow of Paiton Energy
by
FreeCashFlow=Component A x Energy Produced x (1−Tax)
Based on the formula above, the annual Free Cash Flow of Paiton are:
Tahun Tahun ke
Free Cash Flow Explanation
1999 1 64,316,700
PLN only pays fuel pricePaiton completed in May
2000 2 295,121,772 Based on interim agreements2001 3 232,520,184 Based on tentative agreements2002 4
676,308,512 Based on final agreements and PLN pays arrears of $450 Million
2003-2038
5-40 226,308,512
Based on final agreements
The assumptions used in the calculations above are:
In 1999, Paiton operate on June-December, the energy produced on the period are
6,431,670,000 KW. PLN only pays the fuel cost which is 1 cent per KWh.
In 2000, PLN pays Paiton the tariffs according to the interim agreement amounted at 3.3 Cents
per KWh
In 2001, PLN pays Paiton the tariffs according to the tentative agreements amounted at 2.6
Cents per KWh
In 2002, PLN pays Paiton the tariffs according to the final agreements amounted at 4.93 Cents
per KWh
In 2002, PLN pays arrears to Paiton amounted at US$ 450 Millions
In 2003-2038, PLN pays Paiton the tariffs according to the final agreements amounted at 4.93
Cents per KWh
After the annual free cash flow is gained, we can calculate the Payback Period, Net Present Value and
Internal Rate of Return on this projects
The Assumption used in these calculations are:
Tax rate is 30%
The discounted factor is 8% as it is the growth rate of electricity demand
There are no new investment made during the years
There are no changes in the working capital
New Agreements
Payback
9.44
NPV $ 443,339,817.76
IRR 10%

The detailed calculation of the Payback Period, NPV and IRR for the initial agreement can be seen in the following table:
Year FCF Acc. FCF PVIF PV FCF0 (2,500,000,000) (2,500,000,000) 1.000 (2,500,000,000)
1999 1 64,316,700 (2,435,683,300) 0.926 59,552,500 2000 2 295,121,772 (2,140,561,528) 0.857 253,019,352 2001 3 232,520,184 (1,908,041,344) 0.794 184,582,019 2002 4 676,308,512 (1,231,732,832) 0.735 497,106,946 2003 5 226,308,512 (1,005,424,320) 0.681 154,021,770 2004 6 226,308,512 (779,115,809) 0.630 142,612,750 2005 7 226,308,512 (552,807,297) 0.583 132,048,843 2006 8 226,308,512 (326,498,785) 0.540 122,267,447 2007 9 226,308,512 (100,190,273) 0.500 113,210,599 2008 10 226,308,512 126,118,239 0.463 104,824,629 2009 11 226,308,512 352,426,750 0.429 97,059,842 2010 12 226,308,512 578,735,262 0.397 89,870,224 2011 13 226,308,512 805,043,774 0.368 83,213,170 2012 14 226,308,512 1,031,352,286 0.340 77,049,232 2013 15 226,308,512 1,257,660,798 0.315 71,341,881 2014 16 226,308,512 1,483,969,309 0.292 66,057,297 2015 17 226,308,512 1,710,277,821 0.270 61,164,164 2016 18 226,308,512 1,936,586,333 0.250 56,633,485 2017 19 226,308,512 2,162,894,845 0.232 52,438,412 2018 20 226,308,512 2,389,203,357 0.215 48,554,086 2019 21 226,308,512 2,615,511,868 0.199 44,957,487 2020 22 226,308,512 2,841,820,380 0.184 41,627,302 2021 23 226,308,512 3,068,128,892 0.170 38,543,799 2022 24 226,308,512 3,294,437,404 0.158 35,688,702 2023 25 226,308,512 3,520,745,916 0.146 33,045,095 2024 26 226,308,512 3,747,054,427 0.135 30,597,310 2025 27 226,308,512 3,973,362,939 0.125 28,330,843 2026 28 226,308,512 4,199,671,451 0.116 26,232,262 2027 29 226,308,512 4,425,979,963 0.107 24,289,131 2028 30 226,308,512 4,652,288,475 0.099 22,489,936 2029 31 226,308,512 4,878,596,986 0.092 20,824,015 2030 32 226,308,512 5,104,905,498 0.085 19,281,495 2031 33 226,308,512 5,331,214,010 0.079 17,853,236 2032 34 226,308,512 5,557,522,522 0.073 16,530,775 2033 35 226,308,512 5,783,831,034 0.068 15,306,273 2034 36 226,308,512 6,010,139,545 0.063 14,172,475 2035 37 226,308,512 6,236,448,057 0.058 13,122,662 2036 38 226,308,512 6,462,756,569 0.054 12,150,613 2037 39 226,308,512 6,689,065,081 0.050 11,250,567 2038 40 226,308,512 6,915,373,593 0.046 10,417,192

Summary of Financial Analysis
To summarize, below is the difference between initial agreement and actual conditions and new
agreements in the term of Payback Period, NPV and IRR
Lesson Learned as of 2003
In an economic crisis the value of a government support letter is diminished because a project
participant can no longer afford to abide by their terms. In the future, lack of competitive bidding and
involvement of the relatives of the head of the state should be viewed as danger signals. One of the
main factors in the sponsors’ ability to salvage a difficult situation was their persistence including their
consistent denial of corruption charges and their willingness to explore other choice such as extending
the term of contract and building new power capacity and extending equity funding.