provincial report matabeleland south
TRANSCRIPT

333
QUALITY CONTROL MANUAL
Provincial Report
Matabeleland South
Central Census Office
P.O. Box Cy342
Causeway
Harare
Tel : (263-04) 793971/2 or 794756
Fax: (263-04) 794757
E-mail: [email protected]

ZIMBABWE POPULATION CENSUS 2012
Population Census OfficeP.O. Box CY342
CausewayHarare
Tel: 04-793971-204-794756
E-mail: [email protected]

MatabelelandSouthProvince
CENSUS RESULTS AT A GLANCE
Male Population 326 697
Female Population 356 926
Total Population 683 893
Average Size of Household(No. of Households) 4.4

MatabelelandSouthProvince
1

MatabelelandSouthProvince
1
Table of ContentsTable of Contents........................................................................................................................1
List of Tables ..............................................................................................................................2
Foreword ....................................................................................................................................7
Executive Summary....................................................................................................................8
Matabeleland South Fact Sheet (Final Results)..........................................................................12
Chapter 1: .................................................................................................................................14
Population Size and Structure ................................................................................................14
Chapter 2: .................................................................................................................................24
Population Distribution and Migration ...................................................................................24
Chapter 3: .................................................................................................................................30
Household Characteristics......................................................................................................30
Chapter 4: .................................................................................................................................45
Education ..............................................................................................................................45
Chapter 5: .................................................................................................................................68
Activity and Labour Force .....................................................................................................68
Chapter 6: .................................................................................................................................94
Fertility..................................................................................................................................94
Chapter 7: ...............................................................................................................................101
Mortality and Orphanhood...................................................................................................101
Chapter 8: ...............................................................................................................................107
Housing Characteristics .......................................................................................................107
APPENDICES........................................................................................................................116
Notations
- Magnitude zero
* (percent) insignificant value
NS Not Stated

MatabelelandSouthProvince
2
List of TablesTable 1.1: Percent Distribution of Population by District and Sex, Matabeleland South Province, Zimbabwe 2012 Census ............................................................................................................17
Table 1.2: Crude Birth and Death Rate and Rate of Natural Increase by District, Matabeleland South Province, Zimbabwe 2012 Census...................................................................................17
Table 1.3: Percent Composition of Population by Age Group and Sex, Matabeleland South Province, Zimbabwe 2012 Census ............................................................................................18
Table 1.4: Percent Distribution of the Population by District and Marital Status, Matabeleland South Province, Zimbabwe 2012 Census...................................................................................18
Table 1.5: Percent Distribution of the Male Population by Age Group and Marital Status, Matabeleland South Province, Zimbabwe 2012 Census.............................................................19
Table 1.6: Percent Distribution of the Female Population by Age Group and Marital Status, Matabeleland South Province, Zimbabwe 2012 Census.............................................................20
Table 1.7: Percent Distribution of the Total Population by Age Group and Marital Status, Matabeleland South Province, Zimbabwe 2012 Census.............................................................21
Table 1.8: Distribution of Total Population by Broad Age Groups and Ethnicity, Matabeleland South Province, Zimbabwe 2012 Census...................................................................................22
Table 1.9: Distribution of the Urban Population by Broad Age Groups and Ethnicity, Matabeleland South Province, Zimbabwe 2012 Census.............................................................22
Table 1.10: Percent Distribution of the Rural Population by Broad Age Groups and Ethnicity, Matabeleland South Province, Zimbabwe 2012 Census.............................................................22
Table 1.11: Distribution of the Total Population by Citizenship, Matabeleland South Province, Zimbabwe 2012 Census ............................................................................................................23
Table 2.1: Distribution of Population by District, Matabeleland South Province, Zimbabwe 2012 Census ......................................................................................................................................27
Table 2.2: Distribution of the Population for Rural and Urban Districts, Matabeleland South Province, Zimbabwe 2012 Census ............................................................................................27
Table 2.3: Population in Urban Centers by District, Matabeleland South Province, Zimbabwe 2012 Census .............................................................................................................................27
Table 2.4: Total Population by District of Enumeration and District of Usual Residence, Matabeleland South Province, Zimbabwe 2012 Census.............................................................28
Table 2.5: Population Not Usually Residing in Mashonaland West Province by Province of Usual Residence and District of Enumeration, Matabeleland South Province, Zimbabwe 2012 Census ......................................................................................................................................29
Table 3.1: Population in Private Households by Number of Households and Average Household Size and District, Matabeleland South Province, Zimbabwe 2012 Census .................................32
Table 3.2: Distribution of Private Households by Size and Sex of Head of Household Matabeleland South Province, Zimbabwe 2012 Census.............................................................32
Table 3.3: Distribution of private Households by Size and Sex of head of household Matabeleland South ..................................................................................................................33
MatabelelandSouthProvince
3
Table 3.4 Distribution of Heads of Private Households by Age Group and Sex, Matabeleland South Province, Zimbabwe 2012 Census...................................................................................36
Table 3.5 Distribution of Heads of Private Households by District, Age Group and Sex Matabeleland South Province, Zimbabwe 2012 Census.............................................................37
Table 3.6: Percent Distribution of Population in Collective Households by Age Group and Sex, Matabeleland South Province, Zimbabwe 2012 Census.............................................................42
Table 3.7: Distribution of Population in Collective Households by Age Group and Marital Status, Matabeleland South Province, Zimbabwe 2012 Census.............................................................42
Table 3.8: Population in Private Households by Urban/Rural, Relationship to Head of Household and Sex, Matabeleland South Province, Zimbabwe 2012 Census ..............................................43
Table 4.1: Distribution of the Population Age 3-24 by School Attendance and by Sex, Matabeleland South Province, Zimbabwe 2012 Census.............................................................48
Table 4.2: Percent Distribution of the Population Age 3-24 years who never attended school by Sex, Matabeleland South Province, Zimbabwe 2012 Census.....................................................49
Table 4.3: Percent Distribution of the Population Age 3-24 who never attended school by District and Sex, Matabeleland South Province, Zimbabwe 2012 Census ..............................................50
Table 4.4: Percent Distribution of the Population Age 3-24 who never attended school by Sex and District, Matabeleland South Province, Zimbabwe 2012 Census.........................................59
Table 4.5: Percent Distribution of Population ever been to school by Age Group and Sex, Matabeleland South Province, Zimbabwe 2012 Census.............................................................60
Table 4.6: Population Age 3-24 Years Currently Attending School by Current Level of Education Being Attended and Sex, Matabeleland South Province, Zimbabwe 2012 Census.....60
Table 4.7: Population Age 3-24 Years Currently Attending School by District and Current Level of Education Being Attended and Sex, Matabeleland South Province, Zimbabwe 2012 Census 61
Table 4.8: Population Age 3 - 24 years Who Left School by Sex and Age Matabeleland South Province, Zimbabwe 2012 Census ............................................................................................63
Table 4.9: Primary and Secondary School Enrolment for Population Age 3-24 Years Matabeleland South Province, Zimbabwe 2012 Census.............................................................64
Table 4.10: Population Age 3+ by Age Group, Sex and Highest Level of Academic Education Completed, Matabeleland South Province, Zimbabwe 2012 Census..........................................66
Table 4.11 Literacy Rates for the population Aged 15+ by Age Group and Sex, Matabeleland South Province, Zimbabwe 2002 Census...................................................................................67
Table 4.12: Literacy Rates for the Population Aged 15+ by District and by Sex, Matabeleland South Province, 2012 Census ....................................................................................................67
Table 5.1a: Percent Distribution of Economically Active Persons by Sex and Activity, Matabeleland South Province, Zimbabwe 2012 Census.............................................................75
Table 5.2: Percent Distribution of Economically Active Population by Sex and District, Matabeleland South Province, Zimbabwe 2012 Census.............................................................75
Table 5.3: Percent Distribution of Economically Active Population by Age Group, Sex and Activity, Matabeleland South Province, Zimbabwe 2012 Census ..............................................76
Table 5.4: Age-Sex-Specific Activity Rates for Age 15+ Years Matabeleland South Province, Zimbabwe 2012 Census ............................................................................................................77

MatabelelandSouthProvince
4
Table 5.5: Activity Rate by District for Age 15+ Years Matabeleland South Province, Zimbabwe 2012 Census .............................................................................................................................78
Table 5.6: Percent Distribution of Economically Active Persons by District and by Activity Matabeleland South Province, Zimbabwe 2012 Census.............................................................79
Table 5.7a: Percent Distribution of Economically Active Persons by Sex, District and by Activity Matabeleland South Province, Zimbabwe 2012 Census.............................................................79
Table 5.8: Percent Distribution of Economically Active Persons by District and by Age group, Matabeleland South Province, Zimbabwe 2012 Census.............................................................81
Table 5.9: Activity Rate by Age Group and District Matabeleland South Province, Zimbabwe 2012 Census .............................................................................................................................82
Table 5.10: Percent Distribution of Persons by Employment Status and Sex Matabeleland South Province, Zimbabwe 2012 Census ............................................................................................85
Table 5.11: Percent Distribution of Persons with a Disability by Employment Status and Sex, Matabeleland South Province, Zimbabwe 2012 Census.............................................................85
Table 5.12: Unemployment by District, Matabeleland South Province, Zimbabwe 2012 Census.................................................................................................................................................86
Table 5.13: Percent Distribution of Children (10 - 14 years) by Employment Status and Sex, Matabeleland South Province, Zimbabwe 2012 Census.............................................................86
Table 5.14: Percent Distribution of Economically Inactive Population by Various Activities, Matabeleland South Province, Zimbabwe 2012 Census.............................................................86
Table 5.15: Percent Distribution of Economically Inactive Population by Sex and Age, Matabeleland South Province, Zimbabwe 2012 Census.............................................................87
Table 5.16: Percent Distribution of Economically Inactive Population by Urban/Rural and by Activity, Matabeleland South Province, Zimbabwe 2012 Census ..............................................88
Table 5.17: Percent Distribution of Economically Inactive Population by Sex, Age Group and District, Matabeleland South Province, Zimbabwe 2012 Census ...............................................89
Table 5.18: Occupational Classification by Sex Matabeleland South Province, Zimbabwe 2012 Census ......................................................................................................................................91
Table 5.19: Occupational Classification by District Matabeleland South Province, Zimbabwe 2012 Census .............................................................................................................................92
Table 5.20: Proportion of Communal Farmers Among Employed Persons by District, Matabeleland South Province, Zimbabwe 2012 Census.............................................................93
Table 5.21: Persons with a Disability by Occupational Classification and Sex, Matabeleland South Province, Zimbabwe 2012 Census...................................................................................93
Table 6.1: Fertility Rates by District, Matabeleland South Province, Zimbabwe 2012 Census...98
Table 6.2: Total Fertility Rate by Level of Education of Mothers, Matabeleland South Province, Zimbabwe 2012 Census ............................................................................................................98
Table 6.3: Total Fertility Rate by Marital Status, Matabeleland South Province, Zimbabwe 2012 Census ......................................................................................................................................98
Table 6.4: Percent Distribution of Age at First Live Birth, Matabeleland South Province, Zimbabwe 2012 Census ............................................................................................................98

MatabelelandSouthProvince
5
Table 6.5: Percent Distribution of Age at First Live Birth for Urban and Rural, Matabeleland South Province, Zimbabwe 2012 Census...................................................................................99
Table 6.6: Percent Distribution of Age at First Live Birth by Level of Education, Matabeleland South Province, Zimbabwe 2012 Census...................................................................................99
Table 7.1(a) Infant Mortality Rates by Sex and District Matabeleland North Province, Zimbabwe 2012 Census ........................................................................................................................... 104
Table 7.1(b) Infant Mortality Rates by Sex and urban/rural, Matabeleland North Province, Zimbabwe 2012 Census ..........................................................................................................104
Table 7.2: Infant Mortality Rates by Level of Education of Mother, Matabeleland North Province, Zimbabwe 2012 Census ..........................................................................................104
Table 7.3: Crude Death Rates by District, Matabeleland North Province, Zimbabwe 2012 Census............................................................................................................................................... 104
Table 7.4: Maternal Mortality Ratio (MMR) by District, Matabeleland North Province, Zimbabwe 2012 Census ..........................................................................................................105
Table 7.5: Percent Distribution of Orphans by Type of Orphanhood, Matabeleland North Province, Zimbabwe 2012 Census ..........................................................................................105
Table 7.6: Percent Distribution of Orphans by Type of Orphanhood, Matabeleland South Province, Zimbabwe 2012 Census ..........................................................................................105
Table 8.1: Percent Distribution of Households by Tenure Status and District: Matabeleland South Province, Zimbabwe 2002 Census ..........................................................................................110
Table 8.2: Percent Distribution of Households by District and Type of Dwelling Unit: Matabeleland South Province, Zimbabwe 2012 Census........................................................... 110
Table 8.3: Percent Distribution of Households in Dwelling Units With Electricity by District, Matabeleland South Province, Zimbabwe 2012 Census........................................................... 111
Table 8.4: Percent Distribution of Households by Main Source of Water for Drinking and cooking and by Distance (metres) to the source, Matabeleland South Province, Zimbabwe 2012 Census .................................................................................................................................... 111
Table 8.5: Percent Distribution of Households by Main Source of Water for Drinking and Cooking and by Distance (metres) to the Source, Zimbabwe 2012 Census ..............................111
Table 8.6: Percent Distribution of Households by District, Type of Toilet Facility Mostly Used by the Household, Matabeleland South Province, Zimbabwe 2012 Census..............................115
Table 8.7: Percent Distribution of Households by District, Source of Energy Mainly Used by Households for Cooking, Matabeleland South Province, Zimbabwe 2012 Census...................115
Table A1.1: Distribution of Population by Sex in Districts and Wards, Total number of Household Size in Districts and Wards, Matabeleland South Province, Zimbabwe 2012 Census............................................................................................................................................... 116
Table A6.1 Number of Women, Children Ever Born, Births in the Last 12 Months, Average Parities and ASFR by Age Group, Matabeleland Province, Zimbabwe 2012 Census ...........134
Table A6. 2: Number of Women, Children Ever Born, Births in the Last 12 Months, Average Parities and ASFR by Urban /Rural Residence, Matabeleland South Zimbabwe 2012 Census134
Table A6.3: Number of Women, Children Ever Born, Births in the Last 12 Months, Average Parities and ASFR by Level of Education of Mother, Mat South Province, Zimbabwe 2012 Census .................................................................................................................................... 134

MatabelelandSouthProvince
6
Table A6.4 Number of Women, Children Ever Born, Births in the Last 12 Months, Average Parities and ASFR by Urban/Rural Residence, Matabeleland Province, Zimbabwe 2012 Census............................................................................................................................................... 136

MatabelelandSouthProvince
7
ForewordThis Provincial Report is one of a series of reports being prepared by the Zimbabwe National Statistics Agency (ZimStat) based on the final results of the 2012 Population Census. In preparing this Provincial Report, ZimStat seeks to put at the disposal of users detailed data which will assist in evidence-based policy formulation and administration.
The Provincial Report provides more details of the census findings that were summarized in the National Report. Further reports on the results of the census will be published in the form of a population census atlas as well as thematic analysis reports.
We would like to thank the following development partners and donors for their financial, material and technical assistance:-
Australian Agency for International Development, Danish International Development Agency, United Kingdom Department for International Development, European Union, Swedish International Development Agency, United Nations Development Programme, United Nations Children’s Fund and United Nations Population Fund.
ZimStat is appreciative of the funding and material provisions availed to the office by the Government of Zimbabwe. ZimStat would also like to thank all persons who were engaged in 2012 Population Census operations and the general public for its cooperation.
Director-General, Zimbabwe National Statistics Agency
Harare, October, 2013

MatabelelandSouthProvince Executive Summary
8
Executive SummaryThis profile summarizes the main findings of the 2012 Census for MatabelelandSouthProvince. In most cases attempts have been made to provide highlights at both the district and provincial levels. It is believed that the information provided will meet the demands of most users. However, detailed and more specific information is available at ZIMSTAT.
Population Size and Structure
The total population of the province was 683 893. There were 326 697 males and 356 926females. This is very close to the initial figure of 685 046 released in the preliminary report in December, 2012. It should be recalled that the earlier figures were compiled manually at the census districts immediately after the census count, and were therefore subject to clerical errors. The population in Matabeleland South Province was relatively young with 43 percent age below 15 years and about 6 percent age 65 years and above. The sex ratio in the province was nearly 92.
Population Distribution
The population in this province was mostly rural with only 12 percent of the total found in urban areas. Bulilima andBeitbridge rural are the only districts in the province that have no urban area.
Private and Collective Households
During the census, distinction was made between private and collective households. The latter included persons who were staying in institutions of all types. These people constituted a population of less than one percent in the whole province. There were 154 875 private households with an average size of about 4.4 persons per household. The largest proportion of households (16 percent) was in the four-person household size category while out of all households about 72 percent had at most 5 persons. Fifty-six percent of the households were headed by males.
Marital Status
It was further observed that about 36 percent of the population had never married.However, females seemed to have entered into such unions at much younger ages than the males. Around 48 percent of the population was currently married, while about 5 percent were divorced/separatedand 10 percent were widowed. As expected, proportionately more females than males were widowed. The same is also the case for those who were divorced/ separated.
Ethnic Origin and Citizenship
Persons of African origin made up almost the entire population while those of non-African ethnic origin accounted for a negligible 0.2 percent. Citizens of Zimbabwe constituted nearly the whole population and only 1 percent were citizens of other countries. Citizens of Malawi and South Africa constituted 13 and 24 percent respectively of the non –Zimbabweans.
Education and Literacy
Census information on education revealed that about 12 percent of the population age at 3-24years had never been to school. However, 87 percent of these were below 6 years of age and many of them likely to start school later. Fifty-five percent of the population was currently attending school. The proportion of the population age 3-24years that had left school at the census time was 32percent. Of the total female population age 3-24 years, 33 percent had left school while the proportion for males was 35 percent. The literacy for Matabeleland South was 95.
Activity and Labour force
Activity and labour force focused on the population age at least 15 years and this constituted 57 percent of the total population. Out of these, around 72 percent were in the labour force. The proportion of those in the labour force who were unemployed was about 11 percent. Threepercent of children aged10-14 years were economically active.

MatabelelandSouthProvince Executive Summary
9
The proportion of those not in the labour force who were students was 36 percent, homemakers (35 percent), andretired/sick/too old (29 percent).
Out of those who were employed, the highest proportion (46 percent) was engaged in agriculture related occupations, followed by services (22 percent).
Housing Conditions
Information on housing conditions in the province showed that 66 percent of the households lived in their own dwelling units, either as owners or purchasers. The proportion of lodgers was 30 percent. With regard to the type of dwelling units, it was observed that about 67 percent of the households in the province lived in traditional type of dwelling units, while a small percentage (26 percent) occupied dwelling units which were modern.
The proportion of households not using electricity in the province was 69 percent. The proportion of households occupying dwelling units without electricity ranged between 57 percent in Umzingwane and 89percentin Bulilima. This excludes the predominantly urban districts (Gwanda Urban, Plum Tree and Beitbridge Urban),where more than 68 percent of the householdshadaccess to electricity.
With regard to the source of water for drinking and cooking, sixty-seven percent households had access to safe water, i.e. either piped or from boreholes/protected wells. The remaining 33 percent relied on relatively unsafe water from unprotected wells, rivers, streams and dams. It was further noted that 17 percent of the households had water on their premises, while 25 percent had water within a distance of less than 500 meters. Twenty-three percent had to cover more than one kilometre for their water. It was further noted that households in Gwanda Urban, Beit Bridge and Plum Tree were better off than those in the rural districts both in terms of the quality of water and the distance to the source.
Information on the type of toilet facility mainly used by the household in the province indicated that a sizeable proportion (37 percent) of the households had no toilet facility at all. The proportion of households without any toilet facility was highest in Bulilima and Beitbridge Rural (69 percent) and lowest in Umzingwane (28 percent). This observation excludes Gwanda Urban,BeitbridgeUrban and Plum Tree. About 16 percent of the households mainly use flush toilets, 35 percent Blair toilets and 4percent pit latrines. The proportion of households which mostly used flush toilets in Bulilima was about 2 percent compared with 82 percent in Gwanda Urban.
With regard to the type of energy mainly used for cooking, it was observed that 79 percent of the households in the province used wood, while about 15 percent of them used electricity. Less than one percent of the households used gas, coal, paraffin and other forms of energy. Disparities were observed among the districts.
Fertility
Estimates of the level of fertility and mortality were made using the data from the census, mainly applying direct methods. In addition estimates of crude death rate, infant and maternal mortality rate, were made using direct techniques. The rate of natural increase was also calculated using direct estimates of both the birth and death rates.
It was observed that the total fertility rate for the province was about 3.6 children per woman. It was further noted that this level did not seem to vary much with level of education of mothers.
Mortality
The infant mortality rate was estimated at 50deaths per 1000 births for 2012. The rate was generally higher for males than for females. It was also higher in rural than in urban areas. In addition, the level of infant mortality seems to indicate a decline with increasing level of education of mothers.
The level of maternal mortality was also estimated using the data on reported deaths

MatabelelandSouthProvince Executive Summary
10
in the last 12 months before the census. The maternal mortality ratio was 677 deaths from maternal causes per 100 000 live births. There were wide variations among districts.
The average rate of natural increase for the whole province was 1.4 percent in 2011/2012. This growth rate is the difference between fertility and mortality and does not take into account any growth due to migration.
Defacto Count
Finally, it should be remembered that this report is based on the population which was enumerated in the province. However, not every person who was enumerated at a particular place was a usual resident there. Six percent of the population enumerated in Matabeleland South province usually resided outside the province.

MatabelelandSouthProvince Executive Summary
11

Matabeleland South Province Fact Sheet
12
Matabeleland South Fact Sheet (Final Results)Population SizeTotal 683 893Males 326 967Females 356 926
Sex RatioSex Ratio (Males/ 100 Females) 92
Urban PopulationPopulation in Urban Areas 80 162Percent 11.7
Age Composition/ PercentUnder 15years 4315 –64 5165+ years 6
Marital Status (Population Age 15years and Above) Percent Never Married 36Percent Married 48Percent Divorced/ Separated 5Percent Widowed 10
HouseholdsNumber of Private Households 154 875Average Household Size 4.4Percent Male Headed Households 56
Education for Population Age 3- 24 yearsPercent Never been to School 12.3Percent Currently at School 55.4Percent Left School 32.3
EthnicityPercent African Origin 99.8
CitizenshipPercent Zimbabwean 99
Activity and Labour ForceEconomically Active
Percent Employed 89Percent Unemployed 11
Economically InactivePercent Students 36Percent Home Makers 35Percent Retired/ Sick/ Too Old 29
Housing ConditionsPercent of Households: With Electricity 25With Safe water 67With Toilet facilities 57.8Source of EnergyPercent of Households Using Wood for Cooking 79
FertilityCrude Birth Rate (Direct Method)(Births/ 1000 Population) 26.8
Total Fertility Rate (Direct Method) 3.6
Mortality (Direct Methods)Crude Death Rate (Deaths/1000 Population) 12.5Infant Mortality Rate 50Maternal Mortality Ratio (Deaths from Maternal Cause / 100 000 Live Births) 677
Growth Crude Rate of Natural Increase (The Rate of Natural Growth/1000 Population) 1.4

Matabeleland South Province Fact Sheet
13

MatabelelandSouthProvince Chapter 1 Population Size and Structure
14
Chapter 1:
Population Size and Structure
Introduction
This chapter looks at the population size and structure of MatabelelandSouthProvince. The analysis is based on the population as enumerated with reference to the census night, which is August 17/18, 2012.
Population Size
Matabeleland South Province had a total population of 683893 people out of the population of Zimbabwe of 13061329. The proportion of male and female population was 48 and 52 percent respectively seeTable 1.1.This resulted in a sex ratio of 92. Sex ratio is the average number of males per 100 females. Therefore a ratio above 100 indicates an excess of males over females while a ratio below 100 depicts the opposite.
Appendix Table A1.1shows the distribution of the population by district, ward and sex. The distribution of the population by district, 5 year age-groups and sex is shown
in Appendix Tables A1. 2.
Gwanda Rural constituted about 17 percent of the population in the province whilst Beitbridge, Matobo, Bulilima, Insiza, Mangwe, Umzingwane, and Gwanda Urban districts contributed between 2 and 15percent respectively.
From Table 1.1 it can be observed that sex ratio varied among districts. The sex ratios for the districts were between 86 and 98.
Rate of Natural Increase
Estimates of the rates of natural increase for the province and districts are presented in Table 1.2.These rates were calculated from the crude birth and death rates which were obtained using the direct method. The crude birth and death rates were obtained by dividing the number of births and deaths respectively in the last twelve months (as reported) by the total population. Detailed discussions on the crude birth and death rates are presented in subsequent chapters on fertility and mortality respectively. The average rate of natural increase for the whole province was about 1.0 percent for the period September 2011 to August 2012. Gwanda Urban, Beitbridge and Plumtreehad rate of natural increase of almost 3 percent while Gwanda Rural, Matobo, Umzingwane, Mangwe and Bulilima had a rate around 1 percent while Insiza and Beitbridge Rural both had 2 percent
This rate of natural increase is the difference
between the level of fertility and mortality and does not take account of any growth due to migration. Information on migration movements between provinces will be available after the completion of data processing for all the provinces and analysis will be undertaken accordingly.

MatabelelandSouthProvince Chapter 1 Population Size and Structure
15
Age-Sex Structure
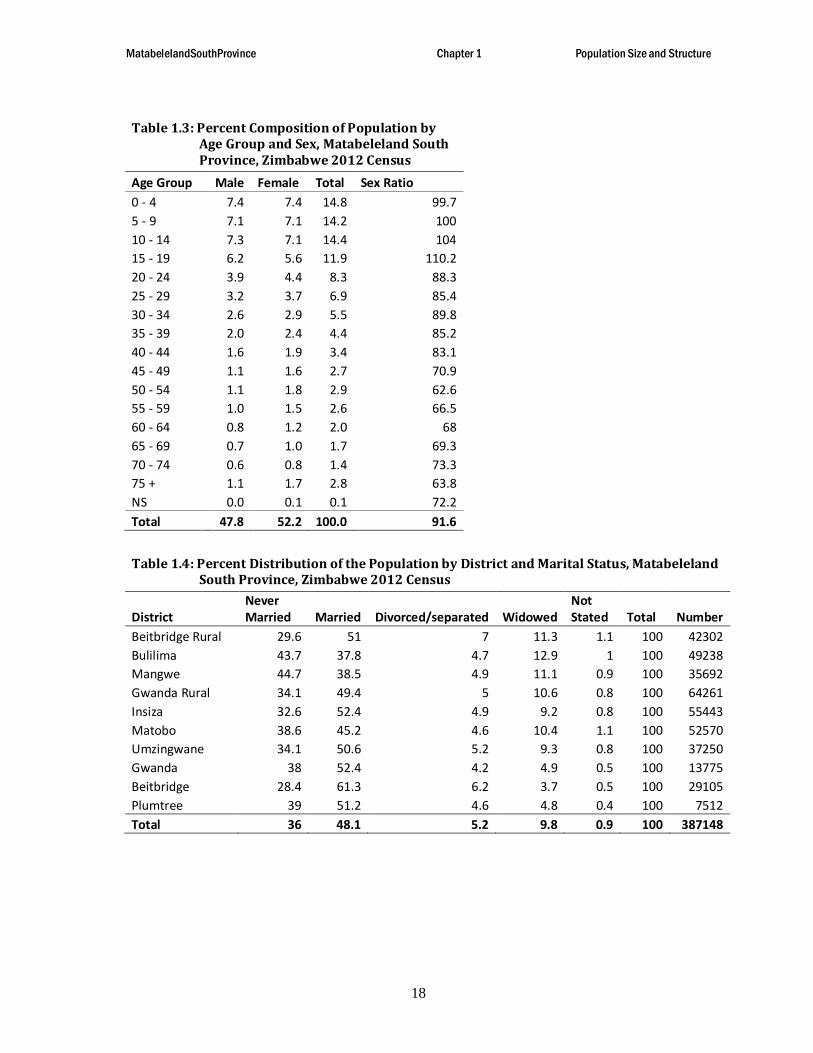
The composition of population by age group and sex is presented in Table 1.3. The 0-4year age group had the highest proportions of the population both with 15 percent .The 70-74 years age group had the least
proportion (1.4 percent). It can further be observed that the proportion of the young population, that is those age under 15 years, was 43 percent while that of the older population age 65 years and above was about 6 percent.
The age-sex structure of a population can be displayed by use of a population pyramid. This has been done using data from Table 1.3and is shown in Figure 1.1. It can be observed that the pyramid is broad-based and narrow at the top. This emphasises the fact that this population was young since a sizeable proportion of the population belonged to the younger age groups.
The sex ratios by age are also shown in Table 1.3and in Figure 1.2. The number of males in the population exceeded that of females for those agesbetween 10 and 19 years. Females were more than males in the age groups above 20 years.
Current Marital Status
Table 1.4reveals that a large proportion (48 percent) of the population 15 years and above in the province were in the marriedcategory, while 36percent were in the never-married" group. Similar patterns were observed in all the districts except Bulilima and Mangwe which shows the reverse.
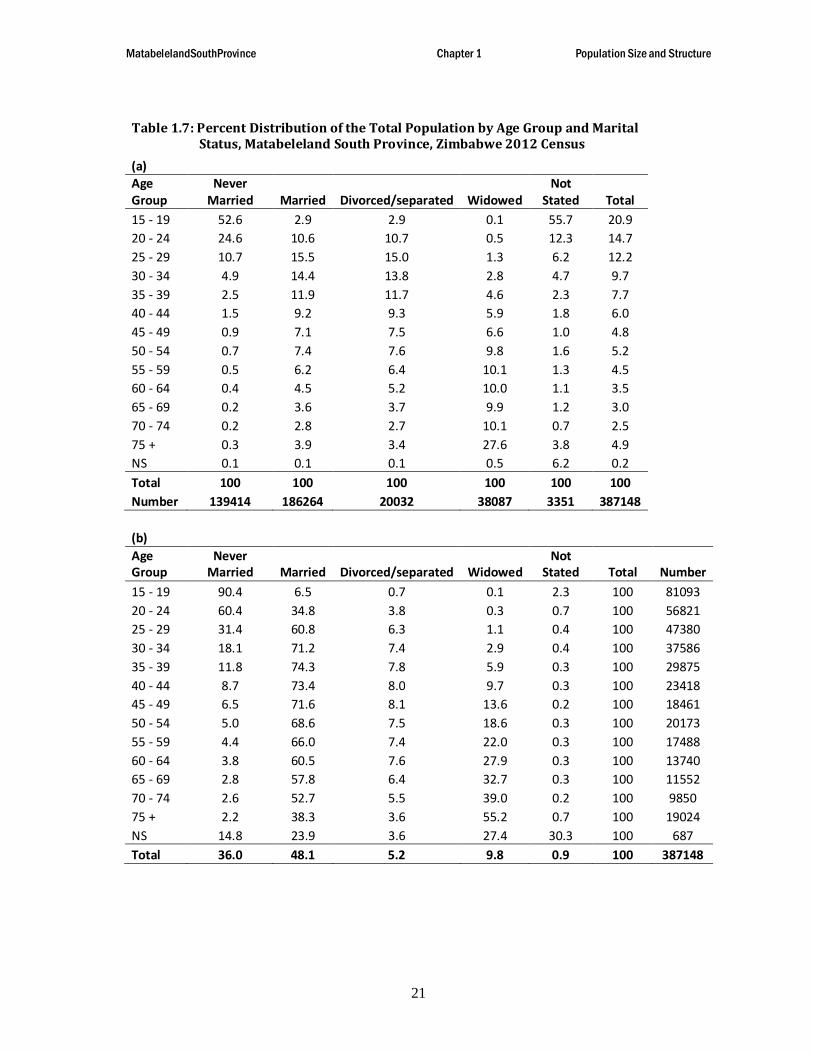
It is observed from Tables 1.5b and 1.6bthat about 45 and 29 percent of the males and females respectively had never been married, while 48 percent of both sexes were married. Proportions divorced/separated were, relatively smaller for males than for females.
From Tables 1.5a and 1.6ait can be observed that for those who were married, less than 1percent of the males as compared with 5 percent of the females were under 20 years of age. This disparity is further depicted in Tables 1.5b and 1.6b, where the percentages of those who were married in the 15-19 years age group were about 1percent for males and about 12 percent for females.In the case of those who were divorced/ separated,69 percent of the males compared with 72 percent of the females were age 15-49 years as shown in Tables 1. 5a and 1.6a. Again, a look at Tables 1.5b and 1. 6breveals that the percentages of persons in this marital category and in the age groups in this age range were relatively smaller for males than for females. Comparisons within age groups can be made using the same two Tables. From age 45 years upwards, the proportions for males ranged from about 6 percent in the 45-49 years age group to4 percent in the 75+ years age group, while those for females ranged from 3 percent in the 75+ years age group to 10 percent in the 45-49 years age group.
Widowers made up about 3 percent of the male population, while widows were about 16 percent of the female population. Comparisons between age groups show that

MatabelelandSouthProvince Chapter 1 Population Size and Structure
16
there were relatively higher proportions of widows than widowers in the older age groups, see Tables 1.5b and 1.6b.This phenomenon should be expected when female mortality is lower than that of males.
Ethnicity
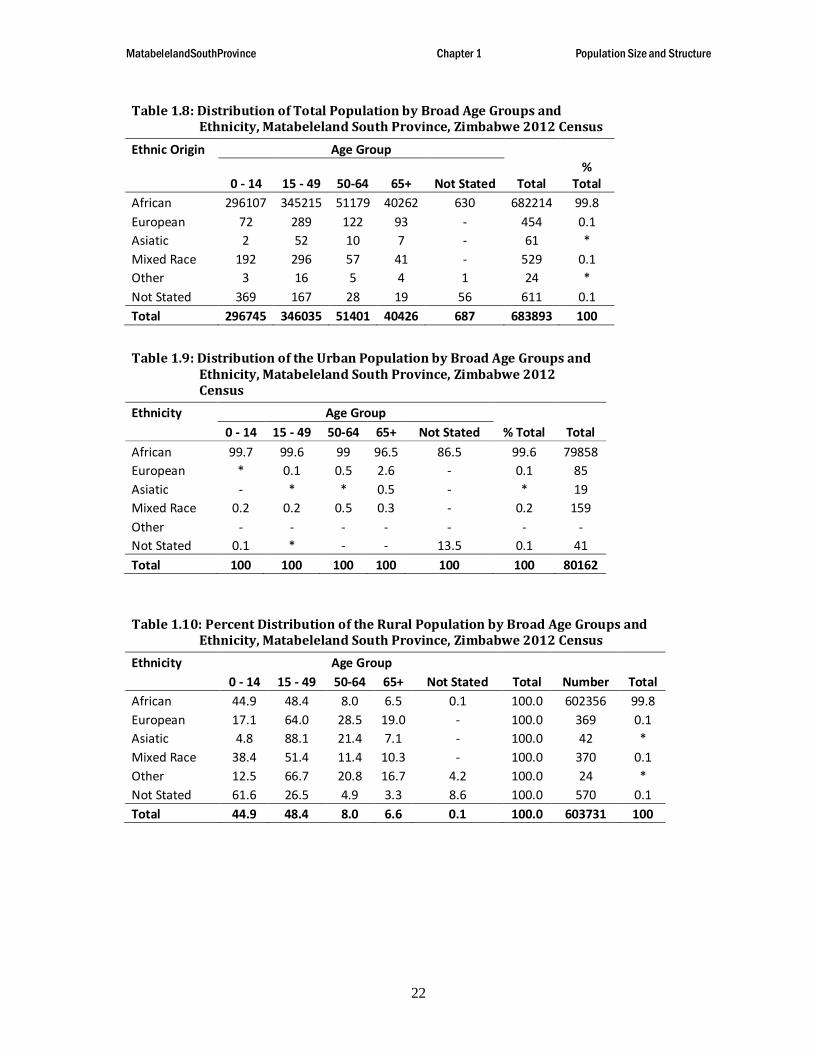
It can be observed from Table 1.8 thatalmost all (99.8 percent) of the population in Matabeleland South province was of African ethnic origin. A negligible percent accounted for persons of European, Asiatic and Mixed origin. The age distribution of the population of African ethnic origin was the same as for the whole population. The proportion of the population age 65 years and above was higher for persons of non-African ethnic origin than for African see Table 1.9 and 1.10
Citizenship
The composition of the population by country of citizenship is presented in Table 1.11. It can be observed that the majority, (about 99.3 percent) of the population in the province, was made up of Zimbabweans. About 40 and 22 percent of the non-Zimbabweans were South Africans andMalawians respectively. Zambians made up 13percent.
ConclusionMatabeleland South province had a total population of 683893 people. Sex ratio for Matabeleland South was about 92. The majority of the people in this province lived in Gwanda Rural and were Zimbabweans of African origin.

MatabelelandSouthProvince Chapter 1 Population Size and Structure
17
Table 1.1: Percent Distribution of Population by District and Sex, Matabeleland South Province, Zimbabwe 2012 Census
Mat South Male Female Percent Number PercentSex
RatioBeitbridge Rural 46.7 53.3 100 80083 11.7 88Bulilima 46.2 53.8 100 90561 13.2 86Mangwe 47.1 52.9 100 66218 9.7 89Gwanda Rural 48.2 51.8 100 115778 16.9 93Insiza 49.2 50.8 100 100333 14.7 97Matobo 47.8 52.2 100 93940 13.7 92Umzingwane 49.5 50.5 100 62990 9.2 98Gwanda 46.9 53.1 100 20227 3 88Beitbridge 48.5 51.5 100 42137 6.2 94Plumtree 46.1 53.9 100 11626 1.7 86Total 47.8 52.2 100 683893 100 92
Table 1.2: Crude Birth and Death Rate and Rate of Natural Increase by District, Matabeleland South Province, Zimbabwe 2012 Census
DistrictCrude Birth Rate
Crude Death Rate
Rate of Natural Increase
(per 1000) (per 1000) (percent)Beitbridge Rural 30.4 10.1 2Bulilima 23.8 15.5 0.8Mangwe 24.4 15.2 0.9Gwanda Rural 24.4 12.9 1.2Insiza 28 11.6 1.6Matobo 24.8 14.1 1.1Umzingwane 24.4 12.5 1.2Gwanda 35.4 6.6 2.9Beitbridge 37.3 7.2 3Plumtree 33.7 8.3 2.5Total 26.9 12.5 1.4
MatabelelandSouthProvince Chapter 1 Population Size and Structure
18
Table 1.3: Percent Composition of Population by Age Group and Sex, Matabeleland South Province, Zimbabwe 2012 Census
Age Group Male Female Total Sex Ratio0 - 4 7.4 7.4 14.8 99.75 - 9 7.1 7.1 14.2 10010 - 14 7.3 7.1 14.4 10415 - 19 6.2 5.6 11.9 110.220 - 24 3.9 4.4 8.3 88.325 - 29 3.2 3.7 6.9 85.430 - 34 2.6 2.9 5.5 89.835 - 39 2.0 2.4 4.4 85.240 - 44 1.6 1.9 3.4 83.145 - 49 1.1 1.6 2.7 70.950 - 54 1.1 1.8 2.9 62.655 - 59 1.0 1.5 2.6 66.560 - 64 0.8 1.2 2.0 6865 - 69 0.7 1.0 1.7 69.370 - 74 0.6 0.8 1.4 73.375 + 1.1 1.7 2.8 63.8NS 0.0 0.1 0.1 72.2Total 47.8 52.2 100.0 91.6
Table 1.4: Percent Distribution of the Population by District and Marital Status, Matabeleland South Province, Zimbabwe 2012 Census
DistrictNever Married Married Divorced/separated Widowed
Not Stated Total Number
Beitbridge Rural 29.6 51 7 11.3 1.1 100 42302Bulilima 43.7 37.8 4.7 12.9 1 100 49238Mangwe 44.7 38.5 4.9 11.1 0.9 100 35692Gwanda Rural 34.1 49.4 5 10.6 0.8 100 64261Insiza 32.6 52.4 4.9 9.2 0.8 100 55443Matobo 38.6 45.2 4.6 10.4 1.1 100 52570Umzingwane 34.1 50.6 5.2 9.3 0.8 100 37250Gwanda 38 52.4 4.2 4.9 0.5 100 13775Beitbridge 28.4 61.3 6.2 3.7 0.5 100 29105Plumtree 39 51.2 4.6 4.8 0.4 100 7512Total 36 48.1 5.2 9.8 0.9 100 387148

MatabelelandSouthProvince Chapter 1 Population Size and Structure
19
Table 1.5: Percent Distribution of the Male Population by Age Group and Marital Status, Matabeleland South Province, Zimbabwe 2012 Census
(a)Age Group
Never Married Married Divorced/separated Widowed
Not Stated Total
15 - 19 51.2 0.6 0.6 0.2 62.9 23.920 - 24 26.4 5.9 5.3 0.5 11.6 15.025 - 29 11.5 13.7 13.3 1.3 5.1 12.330 - 34 4.8 15.0 15.3 3.0 4.2 10.035 - 39 2.2 12.6 14.4 4.9 2.5 7.740 - 44 1.3 10.1 10.8 6.1 2.0 6.045 - 49 0.7 7.4 8.1 6.4 0.8 4.350 - 54 0.6 7.6 7.2 8.2 1.1 4.455 - 59 0.4 6.9 6.4 8.0 0.8 3.960 - 64 0.3 5.3 5.4 9.5 1.0 3.165 - 69 0.2 4.6 4.1 9.1 0.6 2.770 - 74 0.1 3.9 3.7 10.5 0.5 2.375 + 0.2 6.3 5.1 31.8 1.5 4.2NS 0.1 0.1 0.3 0.5 5.4 0.2Total 100 100 100 100 100 100Number 79678 85951 5762 4535 1769 177695
(b)Age Group
Never Married Married Divorced/separated Widowed
Not Stated Total Number
15 - 19 96.0 1.2 0.1 * 2.6 100 4250820 - 24 79.0 19.0 1.1 0.1 0.8 100 2664025 - 29 41.8 54.0 3.5 0.3 0.4 100 2182630 - 34 21.3 72.5 5.0 0.8 0.4 100 1778435 - 39 13.0 79.0 6.0 1.6 0.3 100 1374840 - 44 9.4 81.8 5.9 2.6 0.3 100 1062545 - 49 7.3 82.7 6.1 3.8 0.2 100 766150 - 54 5.8 83.8 5.4 4.8 0.2 100 776855 - 59 4.9 84.5 5.2 5.2 0.2 100 698360 - 64 4.1 82.2 5.6 7.8 0.3 100 556165 - 69 3.0 83.0 5.0 8.7 0.2 100 472770 - 74 2.8 80.4 5.1 11.5 0.2 100 4166
75 + 2.7 73.5 4.0 19.5 0.4 100 7410NS 25.0 28.5 5.6 7.6 33.3 100 288
Total 44.8 48.4 3.2 2.6 1.0 100 177695

MatabelelandSouthProvince Chapter 1 Population Size and Structure
20
Table 1.6: Percent Distribution of the Female Population by Age Group and Marital Status, Matabeleland South Province, Zimbabwe 2012 Census
(a)Age
GroupNever
Married Married Divorced/separated WidowedNot
Stated Total15 - 19 54.3 4.8 3.8 0.1 47.7 18.420 - 24 22.2 14.7 13.0 0.5 13.0 14.425 - 29 9.6 16.9 15.6 1.4 7.5 12.230 - 34 5.0 13.8 13.2 2.8 5.3 9.535 - 39 2.9 11.3 10.6 4.6 2.0 7.740 - 44 1.7 8.5 8.7 5.9 1.6 6.145 - 49 1.1 6.9 7.3 6.6 1.1 5.250 - 54 0.9 7.3 7.8 10.1 2.2 5.955 - 59 0.7 5.6 6.5 10.4 1.9 5.060 - 64 0.5 3.7 5.1 10.1 1.3 3.965 - 69 0.3 2.7 3.5 10.0 1.8 3.370 - 74 0.2 1.8 2.3 10.0 1.0 2.7
75 + 0.4 1.8 2.7 27.0 6.4 5.5NS 0.1 0.1 0.1 0.5 7.1 0.2
Total 100 100 100 100 100 100Number 59736 100313 14270 33552 1582 209453
(b)Age Group
Never Married Married Divorced/separated Widowed
Not Stated Total Number
15 - 19 84.1 12.4 1.4 0.1 2.0 100 3858520 - 24 43.9 48.8 6.1 0.5 0.7 100 3018125 - 29 22.5 66.5 8.7 1.8 0.5 100 2555430 - 34 15.2 70.1 9.5 4.8 0.4 100 1980235 - 39 10.7 70.2 9.4 9.5 0.2 100 1612740 - 44 8.2 66.5 9.7 15.5 0.2 100 1279345 - 49 5.9 63.8 9.6 20.6 0.2 100 1080050 - 54 4.5 59.1 8.9 27.2 0.3 100 1240555 - 59 4.1 53.7 8.8 33.1 0.3 100 1050560 - 64 3.5 45.7 9.0 41.5 0.3 100 817965 - 69 2.7 40.3 7.3 49.3 0.4 100 682570 - 74 2.4 32.3 5.9 59.1 0.3 100 568475 + 1.9 15.9 3.3 78.0 0.9 100 11614NS 7.5 20.6 2.3 41.6 28.1 100 399Total 28.5 47.9 6.8 16.0 0.8 100 209453
MatabelelandSouthProvince Chapter 1 Population Size and Structure
21
Table 1.7: Percent Distribution of the Total Population by Age Group and Marital Status, Matabeleland South Province, Zimbabwe 2012 Census
(a)Age Group
Never Married Married Divorced/separated Widowed
Not Stated Total
15 - 19 52.6 2.9 2.9 0.1 55.7 20.920 - 24 24.6 10.6 10.7 0.5 12.3 14.725 - 29 10.7 15.5 15.0 1.3 6.2 12.230 - 34 4.9 14.4 13.8 2.8 4.7 9.735 - 39 2.5 11.9 11.7 4.6 2.3 7.740 - 44 1.5 9.2 9.3 5.9 1.8 6.045 - 49 0.9 7.1 7.5 6.6 1.0 4.850 - 54 0.7 7.4 7.6 9.8 1.6 5.255 - 59 0.5 6.2 6.4 10.1 1.3 4.560 - 64 0.4 4.5 5.2 10.0 1.1 3.565 - 69 0.2 3.6 3.7 9.9 1.2 3.070 - 74 0.2 2.8 2.7 10.1 0.7 2.575 + 0.3 3.9 3.4 27.6 3.8 4.9NS 0.1 0.1 0.1 0.5 6.2 0.2Total 100 100 100 100 100 100Number 139414 186264 20032 38087 3351 387148
(b)Age Group
Never Married Married Divorced/separated Widowed
Not Stated Total Number
15 - 19 90.4 6.5 0.7 0.1 2.3 100 8109320 - 24 60.4 34.8 3.8 0.3 0.7 100 5682125 - 29 31.4 60.8 6.3 1.1 0.4 100 4738030 - 34 18.1 71.2 7.4 2.9 0.4 100 3758635 - 39 11.8 74.3 7.8 5.9 0.3 100 2987540 - 44 8.7 73.4 8.0 9.7 0.3 100 2341845 - 49 6.5 71.6 8.1 13.6 0.2 100 1846150 - 54 5.0 68.6 7.5 18.6 0.3 100 2017355 - 59 4.4 66.0 7.4 22.0 0.3 100 1748860 - 64 3.8 60.5 7.6 27.9 0.3 100 1374065 - 69 2.8 57.8 6.4 32.7 0.3 100 1155270 - 74 2.6 52.7 5.5 39.0 0.2 100 985075 + 2.2 38.3 3.6 55.2 0.7 100 19024NS 14.8 23.9 3.6 27.4 30.3 100 687Total 36.0 48.1 5.2 9.8 0.9 100 387148
MatabelelandSouthProvince Chapter 1 Population Size and Structure
22
Table 1.8: Distribution of Total Population by Broad Age Groups and Ethnicity, Matabeleland South Province, Zimbabwe 2012 Census
Ethnic Origin Age Group
0 - 14 15 - 49 50-64 65+ Not Stated Total%
TotalAfrican 296107 345215 51179 40262 630 682214 99.8European 72 289 122 93 - 454 0.1Asiatic 2 52 10 7 - 61 *Mixed Race 192 296 57 41 - 529 0.1Other 3 16 5 4 1 24 *Not Stated 369 167 28 19 56 611 0.1Total 296745 346035 51401 40426 687 683893 100
Table 1.9: Distribution of the Urban Population by Broad Age Groups and Ethnicity, Matabeleland South Province, Zimbabwe 2012 Census
Ethnicity Age Group0 - 14 15 - 49 50-64 65+ Not Stated % Total Total
African 99.7 99.6 99 96.5 86.5 99.6 79858European * 0.1 0.5 2.6 - 0.1 85Asiatic - * * 0.5 - * 19Mixed Race 0.2 0.2 0.5 0.3 - 0.2 159Other - - - - - - -Not Stated 0.1 * - - 13.5 0.1 41Total 100 100 100 100 100 100 80162
Table 1.10: Percent Distribution of the Rural Population by Broad Age Groups and Ethnicity, Matabeleland South Province, Zimbabwe 2012 Census
Ethnicity Age Group0 - 14 15 - 49 50-64 65+ Not Stated Total Number Total
African 44.9 48.4 8.0 6.5 0.1 100.0 602356 99.8European 17.1 64.0 28.5 19.0 - 100.0 369 0.1Asiatic 4.8 88.1 21.4 7.1 - 100.0 42 *Mixed Race 38.4 51.4 11.4 10.3 - 100.0 370 0.1Other 12.5 66.7 20.8 16.7 4.2 100.0 24 *Not Stated 61.6 26.5 4.9 3.3 8.6 100.0 570 0.1Total 44.9 48.4 8.0 6.6 0.1 100.0 603731 100

MatabelelandSouthProvince Chapter 1 Population Size and Structure
23
Table 1.11: Distribution of the Total Population by Citizenship, Matabeleland South Province, Zimbabwe 2012 Census
Citizenship Number PercentZimbabwean 679227 99.3Botswana 253 *Malawi 609 0.1Mozambique 236 *South Africa 1116 0.2Zambia 352 0.1Other African Countries 106 *United Kingdom 35 *Other European Countries 19 *American Countries 10 *Asian Countries 35 *Other Countries 21 *Invalid Value - -Not Stated 1874 0.3Total 683893 100

MatabelelandSouthProvince Chapter 2 Population Distribution and Migration
24
Chapter 2:
Population Distribution and Migration
Introduction
Population distribution is important for planning purposes as information is disaggregated to geographic subdivisions such as provinces, districts and wards. Another dimension of the distribution is between urban and rural areas. Also, of great interest are the factors which account for the redistribution of population in a country, province and/or district. Redistribution can occur as a result of internal migration, resettlement, geographic boundary changes, etc.
In this chapter, an analysis of population distribution on the basis of the 2012Population Census is made. In addition to this, an attempt is made to come up with a measure, of the extent of urbanisation and provide an insight into migration patterns.
Population Size and Distribution
According to the 2012 Population Census, Matabeleland South Province had a population of 683893 persons. Matabeleland South Province is divided into Ten Census Districts, BeitbridgeUrban,Beitbridge rural, Plumtree,Bulilima, Mangwe, Gwanda Rural, Insiza, Matobo, Umzingwane and Gwanda Urban see Fig.
2.1and boundary, descriptions in the appendix.
Table 2.1shows population size for the province. Gwanda Rural had the largest proportion of the population in the province (17 percent). This was followed by Insiza(15 percent) Matobo (14 percent), Bulilima (13percent), Beitbridge Rural (12 percent), Mangwe (10 percent), Umzingwane (9 percent),Beitbridge Urban (6 percent)Gwanda Urban (3 percent).
Rural and Urban Population
According to the 2012 Population Census, the definition of an urban area was based on the following criteria;
i) Designated urban areas
ii) Places which had all the following
characteristics were also defined as urban areas
- 2 500 inhabitants or more
- A compact settlement pattern
- The majority (more than 50 percent) of the employed persons engagedin non-agricultural occupationsTable 2.2shows that Bulilima,Beitbridge ruraland Insizaare the only completely rural districts in the province. BeitbridgeUrban’s population of 41767 represented the largest proportion of the province’s urban population (52 percent) while Gwanda urban had 25 percent, see Table 2.3.About 12 percent of the total population in the

MatabelelandSouthProvince Chapter 2 Population Distribution and Migration
25
province was living in an urban area. See Fig 2.2
Migration
In the 2012 Census, information was solicited through questions on i) place of enumeration, ii) place of birth iii) place of residence in August 2002.
.
InTable 2.4the enumerated population is presented by main place of usual residence It should be cautioned that "the usual place of residence" figures are for the population that was enumerated in the province. These are likely to change after the completion of data processing for the whole country.
Beitbridge Rural
Of the enumerated population, 94 percent usually resided in the same district. About 2 percent was from the other districts within the same province, another 3 percent from other provinces with Masvingo and Midlands being the major contributors.
Bulilima
In Bulilima district, about 93 percent of the enumerated population usually lived in the same district. About 1 percent was from other districts within the same province, 3 percent from other provinces with Bulawayo and Matabeleland North being the major contributors. Two percent came from other countries.
Mangwe
Approximately 95 percent of the enumerated
population usually resided in the same district while 2 percent usually resided in other districts within the same province. About 2 percent was from other provinces and the main contributor was Bulawayo. Two percentcame from other countries.
Gwanda Rural
In Gwanda Rural district, about 92 percent of the enumerated population usually lived in the same district. About 3 percent was from other districts within the same province, 4 percent from other provinces with Bulawayo and Midlands being the main contributors. A small proportion came from other countries.
Insiza
About 92 percent of the enumerated population usually resided in the same district. One percent usually resided in other districts while 6 percent and a negligible proportion were from other provinces and countries respectively. Insiza District Bulawayo and Midlands were the main contributors.
Matobo
Ninety- four percent of the enumerated population usually resided in the same district while 1 percent usually resided in other districts, another4 percent in other countries. Of the population from other

MatabelelandSouthProvince Chapter 2 Population Distribution and Migration
26
provinces, Bulawayo was the largest contributing provinces.
Umzingwane
About 91 percent of the enumerated population usually resided in the district, 2 percent usually resided in other districts and 6percent in other provinces with Bulawayo being the highest contributor.
Gwanda Urban
About 88 percent of the population enumerated in Gwanda Urban usually resided in the same district, 6 percent in other districts in the same province and 6 percent in other provinces. The major contributors were Bulawayo and Midlands. A very small proportion of the population enumerated in Gwanda Urban district usually resided in other countries.
Beitbridge UrbanAbout 78 percent of the population enumerated in Beitbridge Urban usually resided in the same district, 3 percent in other districts in the same province and 17percent in other provinces. The major contributors were Midlands,Harare andMasvingo. Two percent of the population enumerated in Beitbridge Urbandistrict usually resided in other countries.
PlumtreeAbout 84 percent of the population enumerated in Plumtree usually resided in the same district, 9 percent in other districts in the same province and 6 percent in other provinces. The major contributor was Bulawayo. One percent of the population enumerated in Plumtree district usually resided in other countries.
Table 2.5shows that 34256 persons counted in Matabeleland South province normally resided in other provinces and of these, 35 percent resided in Bulawayo.
Conclusion
About 12 percent of the population resided in urban areas. There was a sizeable movement of people from district to district
and also from other provinces. About 5 percent of the population enumerated in Matabeleland South Province usually resided in other provinces and the main contributor was Bulawayo. Overall, approximately 92 percent of the population enumerated in the province usually resided there.

MatabelelandSouthProvince Chapter 2 Population Distribution and Migration
27
Table 2.1: Distribution of Population by District, Matabeleland South Province, Zimbabwe 2012 Census
Mat South Total Population PercentBeitbridge Rural 80083 11.7Bulilima 90561 13.2Mangwe 66218 9.7Gwanda Rural 115778 16.9Insiza 100333 14.7Matobo 93940 13.7Umzingwane 62990 9.2Gwanda 20227 3.0Beitbridge 42137 6.2Plumtree 11626 1.7Total 683893 100.0
Table 2.2: Distribution of the Population for Rural and Urban Districts, Matabeleland South Province, Zimbabwe 2012 Census
District Urban Rural Total NumberBeitbridge Rural 0.0 100 100 80083Bulilima 0.0 100 100 90561Mangwe 0.6 99.4 100 66218Gwanda Rural 2.4 97.6 100 115778Insiza * 100 100 100333Matobo 0.6 99.4 100 93940Umzingwane 5.1 94.9 100 62990Gwanda 98.4 1.6 100 20227Beitbridge 99.1 0.9 100 42137Plumtree 100 - 100 11626Total 11.7 88.3 100 683893
Table 2.3: Population in Urban Centers by District, Matabeleland South Province, Zimbabwe 2012 Census
District Total Population PercentBeitbridge Rural - -Bulilima - -Mangwe 428 0.5Gwanda Rural 2729 3.4Insiza 2 *Matobo 519 0.6Umzingwane 3196 4.0Gwanda 19895 24.8Beitbridge 41767 52.1Plumtree 11626 14.5Total 80162 100

MatabelelandSouthProvince Chapter 2 Population Distribution and Migration
28
Table 2.4: Total Population by District of Enumeration and District of Usual Residence, Matabeleland South Province, Zimbabwe 2012 Census
District
Residing in Same District
Residing in Other Matabeleland South District
Residing in Other Provinces
Residing in Other Countries Total
Beitbridge Rural 75564 1458 2357 704 80083Bulilima 84652 1051 3094 1764 90561Mangwe 63037 991 1386 804 66218Gwanda Rural 106482 3742 4643 911 115778Insiza 92271 1404 6223 435 100333Matobo 87916 1080 3970 974 93940Umzingwane 57373 1305 3972 340 62990Gwanda 17709 1271 1138 109 20227Beitbridge 32908 1182 7285 762 42137Plumtree 9713 1015 727 171 11626Total 627625 14499 34795 6974 683893

MatabelelandSouthProvince Chapter 2 Population Distribution and Migration
29
Table 2.5: Population Not Usually Residing in Matabeleland South Province by Province of Usual Residence and District of Enumeration, Matabeleland South Province, Zimbabwe 2012 Census
Province of Usual Residence Beitbridge Rural Bulilima Mangwe
Gwanda Rural Insiza Matobo Umzingwane Gwanda Beitbridge Plumtree Total
Manicaland 70 47 17 45 78 75 71 34 588 20 1045Mashonaland Central 24 29 6 35 51 19 44 9 143 7 367Mashonaland West 65 32 18 127 99 42 69 29 372 21 874Matabeleland North 197 1024 429 596 919 831 722 120 172 143 5153Matabeleland South - - - - - - - - - - -Midlands 468 176 119 914 1739 239 455 227 1136 88 5561Masvingo 850 58 23 309 352 91 111 125 2136 51 4106Harare 88 75 40 121 221 66 132 70 1101 85 1999Bulawayo 240 1047 563 2089 2461 2329 2102 417 505 255 12008Not Known 93 95 84 96 110 113 64 19 46 6 726Invalid 236 492 58 293 155 143 162 78 763 37 2417Total 2331 3075 1357 4625 6185 3948 3932 1128 6962 713 34256
MatabelelandSouthProvince Chapter 3 Household Characteristics
30
Chapter 3:
Household Characteristics
Introduction
This chapter presents household characteristics of the population in MatabelelandSouthProvince. Distinction was made between private households and collective/institutional ones. The latter included persons who were staying in hotels, hostels, holiday camps, hospitals and prisons. For census purposes, a private household was defined as a group of persons who stayed the census night together, i.e. Friday night of August 17/18, in a dwelling unit, whether or not they were related by blood or marriage. For example, visitors who were not usual members of the household, but were present during the census night, were included. On the other hand, usual members of the household who normally live there, but had spent the census night elsewhere were excluded since they would have been counted at the place where they stayed that particular night. However, those who were temporarily absent on the census night but would be returning to the household in the morning of 18 August 2012were counted in their usual households.
It should be realised that in a census situation a household was not the same as a family. The type of households which were covered included:
(a) one-person household;
(b) nuclear households whose composition was entirely single-family nucleus;
(c) extended household which consisted of single-family nucleus and other persons related to the nucleus, and
(d) composite household made up of at least single-family nucleus plus other persons who may or may not be related to the nucleus
The head of the household was defined as that member of the household who was
regarded as such by those who stayed the census night with the household and was either male or female. She/he must have stayed the census night in the household or had returned on the morning of the 18th August 2012, and had not been counted elsewhere.
Private Households
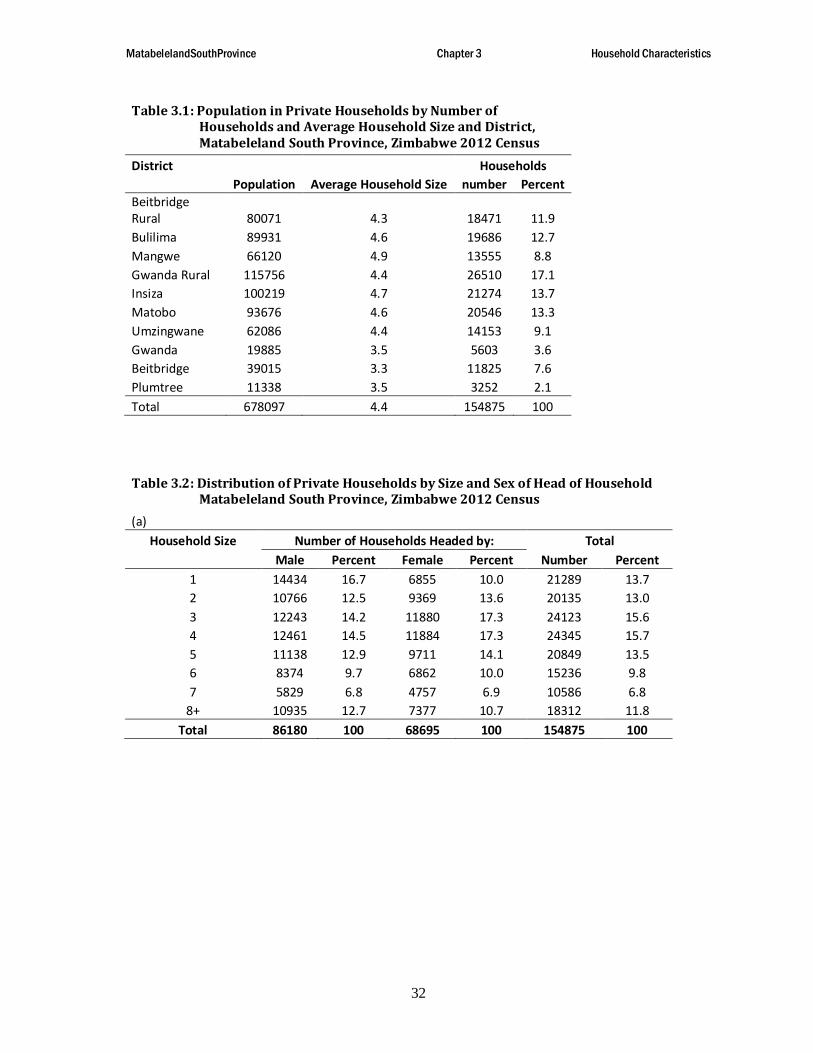
The demographic characteristics of the population in private households did not deviate from those of the total population as given in Chapter I and are, therefore, not presented here. Table 3.1shows the total population in private households by number of private households, average household size and by district. There were 154 875private households in the province. These households constituted a population of 678 097 persons, resulting in an average household size of about 4 persons. The remainder of the population (5 796 persons) was in collective households.
Table 3.1also shows that private households in Gwanda Rural constituted about 17 percent of the total number of households, while those in Beitbridge Rural, Matobo, Bulilima, Insiza, Mangwe, Umzingwane,Beitbridge Urban, Plumtreeand Gwanda Urban constituted between 2 and 14 percent.
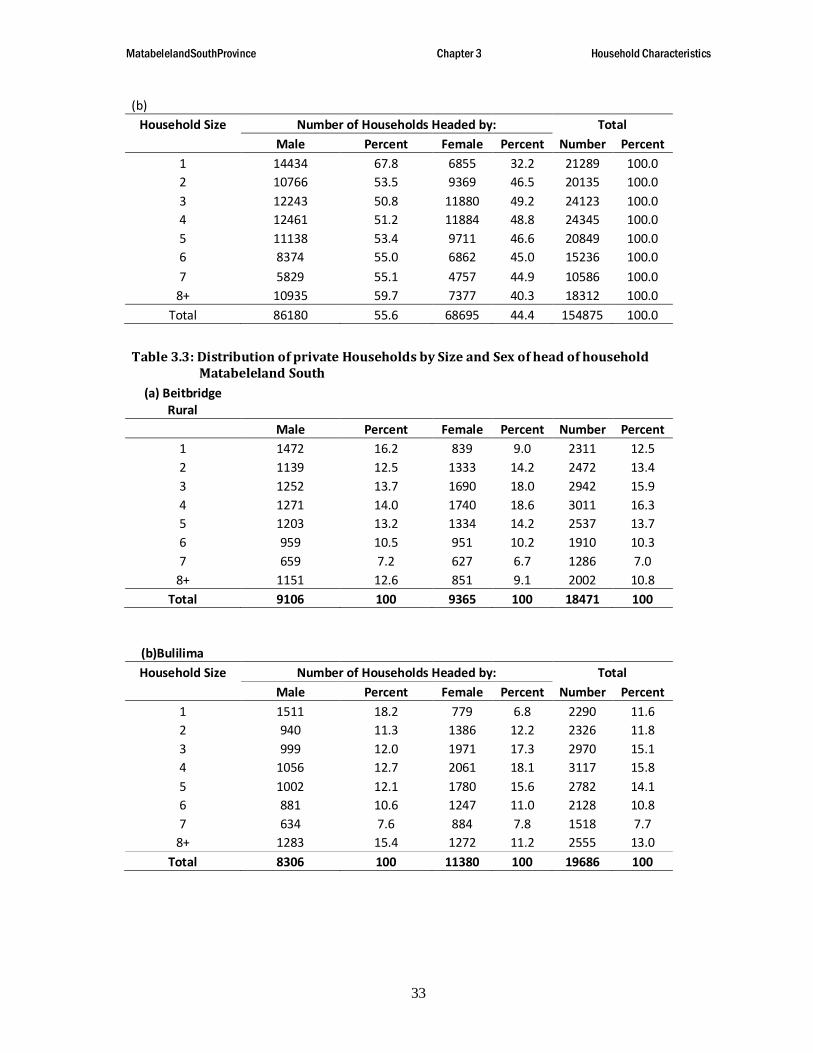
Tables 3.2a and bpresent the distribution of private households in the province by size of household and sex of the head of the household. The largest proportion of the households (16 percent) was in the three and four-person household size category while the smallest proportion (about 7 percent) was in the 7-person household size category. About 72 percent of the total households in the province had 5 persons at most as shown in Table 3.2a.There were more male-headed households than female-headed ones in the province as shown in Table 3.2b.Fifty-six percent of the private households were headed by males. The proportions of male-headed households ranged from 51 to 68 percent, while those for females ranged from 32 to 49 percent considering each household size category.

MatabelelandSouthProvince Chapter 3 Household Characteristics
31
Table 3.3a-j shows the numberand sizeof private households by sex of the head of the household for the districts. The proportion of one- person households ranged between 10 and 21 percent of the households in the districts.
The proportion in each household size category in all districts varied up to households with4 persons and then declined thereafter. Sixty-four to 87 percent of the total households in the districts had 5 persons at most.
Table 3.4presents the distribution of heads of private households by age group and sex. About 52 percent of the households were headed by persons below 45 years of age. The proportions of male-headed households were higher than those of female-headed households for each age group except the 75years and above age range. There were marked differences in the proportions between male and female-headed households from age 15 years onwards. The proportions of male-headed households ranged from 50 to 63 percent, while those of female headed households ranged from 37 to 51 percent.
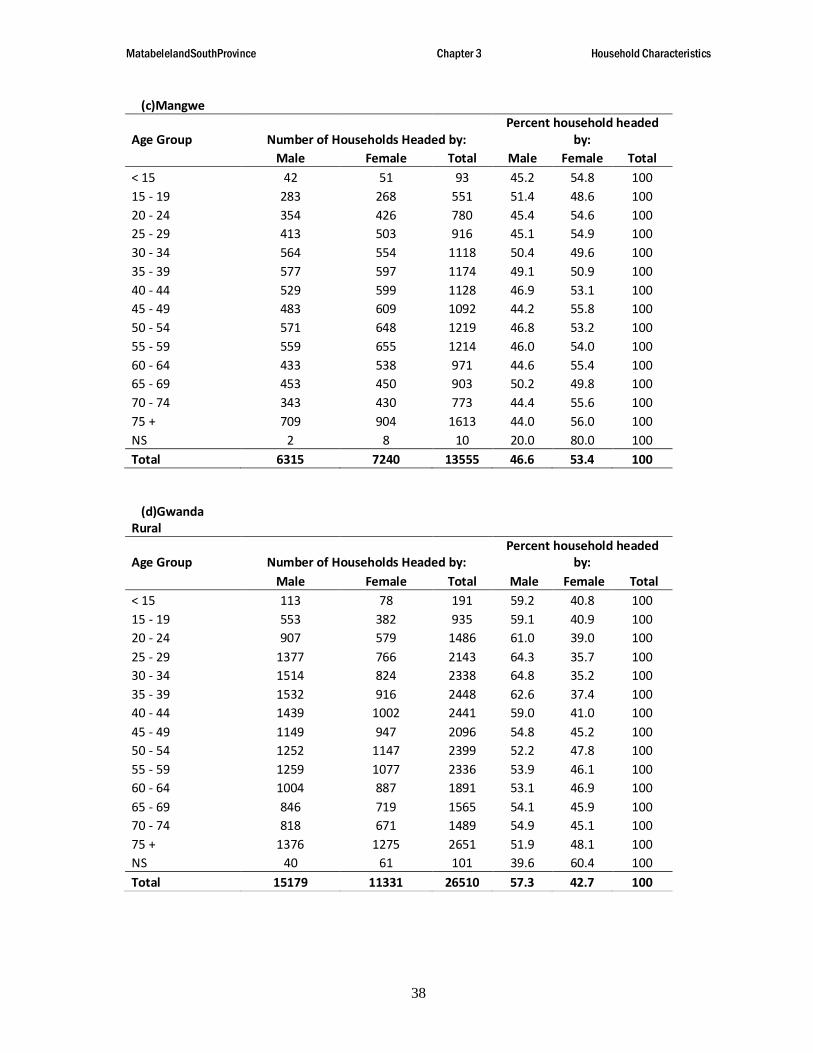
Tables 3.5a to jshow the distribution of the heads of private households by age and sex in all districts in Matabeleland South.In Bulilima male-headed households accounted for 42 percent while in the rest of the districts male headed households accounted for 47 to 69 percent of the total households. Tables 3.5a, b and c show that female headed households outnumbered male headed households in Bulilima, Beitbridge Rural and Mangwe.
Collective households
The total population of 5 796 persons in collective households constituted less thanone percent of the total population in the province. The distribution of the collective household population by broad age groups and sex for the province is shown in Table 3.7. About 91 percent of the collective household population was age 15-49 years,about 8 percent were under 15years, and 5 percentfor those age 65 years and above.
Males constituted 51 percent of the total population in collective households. The excess of females over males was more pronounced in the 65+ year age group.
Table 3.7 shows that about 55 percent of the population in collective households in the province were married, while 29 percent were never married.About 5 percent were divorced or separated and another4 percent were widowed.
Living Arrangements
Most household members in Matabeleland South are related to the head of household (Table 3.8). Of the 678 097 persons living in private households 4 percent were not related to the head. Of the parents living with the head of households, 89 percent were females. The number of female parents relative to male parents may be reflective of the older age of widows compared with widowers.
Conclusion
Matabeleland South Province had an average household size of about 4 persons. There were more male headed private households than female-headed ones. In collective household, there were more females than males.
MatabelelandSouthProvince Chapter 3 Household Characteristics
32
Table 3.1: Population in Private Households by Number of Households and Average Household Size and District, Matabeleland South Province, Zimbabwe 2012 Census
District HouseholdsPopulation Average Household Size number Percent
Beitbridge Rural 80071 4.3 18471 11.9Bulilima 89931 4.6 19686 12.7Mangwe 66120 4.9 13555 8.8Gwanda Rural 115756 4.4 26510 17.1Insiza 100219 4.7 21274 13.7Matobo 93676 4.6 20546 13.3Umzingwane 62086 4.4 14153 9.1Gwanda 19885 3.5 5603 3.6Beitbridge 39015 3.3 11825 7.6Plumtree 11338 3.5 3252 2.1Total 678097 4.4 154875 100
Table 3.2: Distribution of Private Households by Size and Sex of Head of Household Matabeleland South Province, Zimbabwe 2012 Census
(a)Household Size Number of Households Headed by: Total
Male Percent Female Percent Number Percent1 14434 16.7 6855 10.0 21289 13.72 10766 12.5 9369 13.6 20135 13.03 12243 14.2 11880 17.3 24123 15.64 12461 14.5 11884 17.3 24345 15.75 11138 12.9 9711 14.1 20849 13.56 8374 9.7 6862 10.0 15236 9.87 5829 6.8 4757 6.9 10586 6.8
8+ 10935 12.7 7377 10.7 18312 11.8Total 86180 100 68695 100 154875 100
MatabelelandSouthProvince Chapter 3 Household Characteristics
33
(b)Household Size Number of Households Headed by: Total
Male Percent Female Percent Number Percent1 14434 67.8 6855 32.2 21289 100.02 10766 53.5 9369 46.5 20135 100.03 12243 50.8 11880 49.2 24123 100.04 12461 51.2 11884 48.8 24345 100.05 11138 53.4 9711 46.6 20849 100.06 8374 55.0 6862 45.0 15236 100.07 5829 55.1 4757 44.9 10586 100.0
8+ 10935 59.7 7377 40.3 18312 100.0Total 86180 55.6 68695 44.4 154875 100.0
Table 3.3: Distribution of private Households by Size and Sex of head of household Matabeleland South
(a) Beitbridge Rural
Male Percent Female Percent Number Percent1 1472 16.2 839 9.0 2311 12.52 1139 12.5 1333 14.2 2472 13.43 1252 13.7 1690 18.0 2942 15.94 1271 14.0 1740 18.6 3011 16.35 1203 13.2 1334 14.2 2537 13.76 959 10.5 951 10.2 1910 10.37 659 7.2 627 6.7 1286 7.0
8+ 1151 12.6 851 9.1 2002 10.8Total 9106 100 9365 100 18471 100
(b)BulilimaHousehold Size Number of Households Headed by: Total
Male Percent Female Percent Number Percent1 1511 18.2 779 6.8 2290 11.62 940 11.3 1386 12.2 2326 11.83 999 12.0 1971 17.3 2970 15.14 1056 12.7 2061 18.1 3117 15.85 1002 12.1 1780 15.6 2782 14.16 881 10.6 1247 11.0 2128 10.87 634 7.6 884 7.8 1518 7.7
8+ 1283 15.4 1272 11.2 2555 13.0Total 8306 100 11380 100 19686 100

MatabelelandSouthProvince Chapter 3 Household Characteristics
34
(c)MangweHousehold Size Number of Households Headed by: Total
Male Percent Female Percent Number Percent1 946 15.0 430 5.9 1376 10.22 621 9.8 795 11.0 1416 10.43 691 10.9 1179 16.3 1870 13.84 817 12.9 1250 17.3 2067 15.25 806 12.8 1148 15.9 1954 14.46 739 11.7 858 11.9 1597 11.87 510 8.1 611 8.4 1121 8.3
8+ 1185 18.8 969 13.4 2154 15.9Total 6315 100 7240 100 13555 100
(d)GwandaRural
Household Size Number of Households Headed by: TotalMale Percent Female Percent Number Percent
1 2609 17.2 1171 10.3 3780 14.32 1821 12.0 1629 14.4 3450 13.03 2074 13.7 1947 17.2 4021 15.24 2132 14.0 1951 17.2 4083 15.45 2007 13.2 1633 14.4 3640 13.76 1528 10.1 1130 10.0 2658 10.07 1084 7.1 721 6.4 1805 6.8
8+ 1924 12.7 1149 10.1 3073 11.6Total 15179 100 11331 100 26510 100
(e)InsizaHousehold Size Number of Households Headed by: Total
Male Percent Female Percent Number Percent1 1878 14.3 734 9.0 2612 12.32 1466 11.2 1018 12.5 2484 11.73 1674 12.8 1329 16.3 3003 14.14 1919 14.6 1347 16.5 3266 15.45 1761 13.4 1139 14.0 2900 13.66 1379 10.5 797 9.8 2176 10.27 999 7.6 630 7.7 1629 7.7
8+ 2047 15.6 1157 14.2 3204 15.1Total 13123 100 8151 100 21274 100

MatabelelandSouthProvince Chapter 3 Household Characteristics
35
(f)MatoboHousehold Size Number of Households Headed by: Total
Male Percent Female Percent Number Percent1 1884 17.1 800 8.4 2684 13.12 1308 11.8 1175 12.4 2483 12.13 1397 12.6 1618 17.0 3015 14.74 1490 13.5 1721 18.1 3211 15.65 1433 13.0 1359 14.3 2792 13.66 1066 9.6 976 10.3 2042 9.97 804 7.3 700 7.4 1504 7.3
8+ 1667 15.1 1148 12.1 2815 13.7Total 11049 100 9497 100 20546 100
(g)UmzingwaneHousehold Size Number of Households Headed by: Total
Male Percent Female Percent Number Percent1 1474 16.1 546 10.9 2020 14.32 1120 12.3 709 14.1 1829 12.93 1326 14.5 816 16.3 2142 15.14 1410 15.4 815 16.2 2225 15.75 1254 13.7 667 13.3 1921 13.66 874 9.6 529 10.5 1403 9.97 605 6.6 343 6.8 948 6.7
8+ 1071 11.7 594 11.8 1665 11.8Total 9134 100 5019 100 14153 100
(h)GwandaHousehold Size Number of Households Headed by: Total
Male Percent Female Percent Number Percent1 663 18 420 22.0 1083 19.32 599 16.2 348 18.2 947 16.93 686 18.6 347 18.2 1033 18.44 625 16.9 305 16 930 16.65 497 13.5 184 9.6 681 12.26 267 7.2 124 6.5 391 7.07 168 4.5 89 4.7 257 4.6
8+ 188 5.1 93 4.9 281 5.0Total 3693 100 1910 100 5603 100

MatabelelandSouthProvince Chapter 3 Household Characteristics
36
(i)BeitbridgeHousehold Size Number of Households Headed by: Total
Male Percent Female Percent Number Percent1 1574 19.1 895 24.8 2469 20.92 1471 17.9 763 21.2 2234 18.93 1727 21.0 747 20.7 2474 20.94 1376 16.7 531 14.7 1907 16.15 909 11.1 317 8.8 1226 10.46 545 6.6 150 4.2 695 5.97 281 3.4 107 3.0 388 3.3
8+ 340 4.1 92 2.6 432 3.7Total 8223 100 3602 100 11825 100
(j)PlumtreeHousehold Size Number of Households Headed by: Total
Male Percent Female Percent Number Percent1 423 20.6 241 20.1 664 20.42 281 13.7 213 17.8 494 15.23 417 20.3 236 19.7 653 20.14 365 17.8 163 13.6 528 16.25 266 13.0 150 12.5 416 12.86 136 6.6 100 8.3 236 7.37 85 4.1 45 3.8 130 4.0
8+ 79 3.8 52 4.3 131 4.0Total 2052 100 1200 100 3252 100
Table 3.4 Distribution of Heads of Private Households by Age Group and Sex, Matabeleland South Province, Zimbabwe 2012 Census
Age Group Number of Households Headed by: Percent household headed by:Male Female Total Male Female Total % Total
< 15 464 460 924 50.2 49.8 100 0.615 - 19 3035 2601 5636 53.9 46.1 100 3.620 - 24 6029 4772 10801 55.8 44.2 100 7.025 - 29 9897 6142 16039 61.7 38.3 100 10.430 - 34 10774 6220 16994 63.4 36.6 100 1135 - 39 9575 6243 15818 60.5 39.5 100 10.240 - 44 8017 5697 13714 58.5 41.5 100 8.945 - 49 6181 5245 11426 54.1 45.9 100 7.450 - 54 6592 6429 13021 50.6 49.4 100 8.455 - 59 6152 5700 11852 51.9 48.1 100 7.760 - 64 4950 4731 9681 51.1 48.9 100 6.365 - 69 4233 4036 8269 51.2 48.8 100 5.370 - 74 3750 3516 7266 51.6 48.4 100 4.775 + 6460 6790 13250 48.8 51.2 100 8.6NS 71 113 184 38.6 61.4 100 0.1

MatabelelandSouthProvince Chapter 3 Household Characteristics
37
Total 86180 68695 154875 55.6 44.4 100 100
Table 3.5 Distribution of Heads of Private Households by District, Age Group and Sex Matabeleland South Province, Zimbabwe 2012 Census
(a)Beitbridge RuralAge Group Number of Households Headed by: Percent household headed by:
Male Female Total Male Female Total< 15 96 128 224 42.9 57.1 10015 - 19 463 492 955 48.5 51.5 10020 - 24 696 776 1472 47.3 52.7 10025 - 29 1084 1011 2095 51.7 48.3 10030 - 34 992 906 1898 52.3 47.7 10035 - 39 928 960 1888 49.2 50.8 10040 - 44 789 745 1534 51.4 48.6 10045 - 49 575 616 1191 48.3 51.7 10050 - 54 707 860 1567 45.1 54.9 10055 - 59 669 700 1369 48.9 51.1 10060 - 64 573 588 1161 49.4 50.6 10065 - 69 503 469 972 51.7 48.3 10070 - 74 383 428 811 47.2 52.8 10075 + 638 677 1315 48.5 51.5 100NS 10 9 19 52.6 47.4 100Total 9106 9365 18471 49.3 50.7 100
(b)Bulilima
Age Group Number of Households Headed by:Percent household headed
by:Male Female Total Male Female Total
< 15 59 85 144 41.0 59.0 10015 - 19 498 520 1018 48.9 51.1 10020 - 24 536 816 1352 39.6 60.4 10025 - 29 557 842 1399 39.8 60.2 10030 - 34 700 817 1517 46.1 53.9 10035 - 39 680 899 1579 43.1 56.9 10040 - 44 609 889 1498 40.7 59.3 10045 - 49 598 854 1452 41.2 58.8 10050 - 54 738 1081 1819 40.6 59.4 10055 - 59 705 991 1696 41.6 58.4 10060 - 64 605 803 1408 43.0 57.0 10065 - 69 534 761 1295 41.2 58.8 10070 - 74 490 634 1124 43.6 56.4 10075 + 991 1365 2356 42.1 57.9 100NS 6 23 29 20.7 79.3 100Total 8306 11380 19686 42.2 57.8 100
MatabelelandSouthProvince Chapter 3 Household Characteristics
38
(c)Mangwe
Age Group Number of Households Headed by:Percent household headed
by:Male Female Total Male Female Total
< 15 42 51 93 45.2 54.8 10015 - 19 283 268 551 51.4 48.6 10020 - 24 354 426 780 45.4 54.6 10025 - 29 413 503 916 45.1 54.9 10030 - 34 564 554 1118 50.4 49.6 10035 - 39 577 597 1174 49.1 50.9 10040 - 44 529 599 1128 46.9 53.1 10045 - 49 483 609 1092 44.2 55.8 10050 - 54 571 648 1219 46.8 53.2 10055 - 59 559 655 1214 46.0 54.0 10060 - 64 433 538 971 44.6 55.4 10065 - 69 453 450 903 50.2 49.8 10070 - 74 343 430 773 44.4 55.6 10075 + 709 904 1613 44.0 56.0 100NS 2 8 10 20.0 80.0 100Total 6315 7240 13555 46.6 53.4 100
(d)Gwanda Rural
Age Group Number of Households Headed by:Percent household headed
by:Male Female Total Male Female Total
< 15 113 78 191 59.2 40.8 10015 - 19 553 382 935 59.1 40.9 10020 - 24 907 579 1486 61.0 39.0 10025 - 29 1377 766 2143 64.3 35.7 10030 - 34 1514 824 2338 64.8 35.2 10035 - 39 1532 916 2448 62.6 37.4 10040 - 44 1439 1002 2441 59.0 41.0 10045 - 49 1149 947 2096 54.8 45.2 10050 - 54 1252 1147 2399 52.2 47.8 10055 - 59 1259 1077 2336 53.9 46.1 10060 - 64 1004 887 1891 53.1 46.9 10065 - 69 846 719 1565 54.1 45.9 10070 - 74 818 671 1489 54.9 45.1 10075 + 1376 1275 2651 51.9 48.1 100NS 40 61 101 39.6 60.4 100Total 15179 11331 26510 57.3 42.7 100

MatabelelandSouthProvince Chapter 3 Household Characteristics
39
(e)Insiza
Age Group Number of Households Headed by:Percent household headed
by:Male Female Total Male Female Total
< 15 58 46 104 55.8 44.2 10015 - 19 399 263 662 60.3 39.7 10020 - 24 851 479 1330 64.0 36.0 10025 - 29 1527 687 2214 69.0 31.0 10030 - 34 1801 781 2582 69.8 30.2 10035 - 39 1596 779 2375 67.2 32.8 10040 - 44 1285 673 1958 65.6 34.4 10045 - 49 943 628 1571 60.0 40.0 10050 - 54 1011 816 1827 55.3 44.7 10055 - 59 913 699 1612 56.6 43.4 10060 - 64 751 596 1347 55.8 44.2 10065 - 69 616 522 1138 54.1 45.9 10070 - 74 539 443 982 54.9 45.1 10075 + 828 731 1559 53.1 46.9 100NS 5 8 13 38.5 61.5 100Total 13123 8151 21274 61.7 38.3 100
(F)Matobo
Age Group Number of Households Headed by:Percent household headed
by:Male Female Total Male Female Total
< 15 64 44 108 59.3 40.7 10015 - 19 430 285 715 60.1 39.9 10020 - 24 679 505 1184 57.3 42.7 10025 - 29 869 662 1531 56.8 43.2 10030 - 34 963 726 1689 57.0 43.0 10035 - 39 969 771 1740 55.7 44.3 10040 - 44 967 726 1693 57.1 42.9 10045 - 49 858 719 1577 54.4 45.6 10050 - 54 976 965 1941 50.3 49.7 10055 - 59 943 886 1829 51.6 48.4 10060 - 64 812 759 1571 51.7 48.3 10065 - 69 681 699 1380 49.3 50.7 10070 - 74 673 567 1240 54.3 45.7 10075 + 1160 1181 2341 49.6 50.4 100NS 5 2 7 71.4 28.6 100Total 11049 9497 20546 53.8 46.2 100

MatabelelandSouthProvince Chapter 3 Household Characteristics
40
(g)Umzingwane
Age Group Number of Households Headed by:Percent household headed
by:Male Female Total Male Female Total
< 15 25 16 41 61.0 39.0 10015 - 19 204 122 326 62.6 37.4 10020 - 24 579 232 811 71.4 28.6 10025 - 29 988 333 1321 74.8 25.2 10030 - 34 1160 416 1576 73.6 26.4 10035 - 39 957 445 1402 68.3 31.7 10040 - 44 864 414 1278 67.6 32.4 10045 - 49 724 407 1131 64.0 36.0 10050 - 54 763 560 1323 57.7 42.3 10055 - 59 702 454 1156 60.7 39.3 10060 - 64 563 415 978 57.6 42.4 10065 - 69 487 338 825 59.0 41.0 10070 - 74 434 286 720 60.3 39.7 10075 + 684 581 1265 54.1 45.9 100NS 0 0 0 0 0 0Total 9134 5019 14153 64.5 35.5 100
(h)Gwanda
Age Group Number of Households Headed by:Percent household headed
by:Male Female Total Male Female Total
< 15 2 2 4 50.0 50.0 10015 - 19 51 60 111 45.9 54.1 10020 - 24 343 225 568 60.4 39.6 10025 - 29 738 308 1046 70.6 29.4 10030 - 34 748 316 1064 70.3 29.7 10035 - 39 595 252 847 70.2 29.8 10040 - 44 438 208 646 67.8 32.2 10045 - 49 261 179 440 59.3 40.7 10050 - 54 203 134 337 60.2 39.8 10055 - 59 138 90 228 60.5 39.5 10060 - 64 80 52 132 60.6 39.4 10065 - 69 36 27 63 57.1 42.9 10070 - 74 25 28 53 47.2 52.8 10075 + 32 27 59 54.2 45.8 100NS 3 2 5 60 40 100Total 3693 1910 5603 65.9 34.1 100

MatabelelandSouthProvince Chapter 3 Household Characteristics
41
(i)Beitbridge
Age Group Number of Households Headed by:Percent household headed
by:Male Female Total Male Female Total
< 15 4 8 12 33.3 66.7 10015 - 19 114 145 259 44.0 56.0 10020 - 24 891 581 1472 60.5 39.5 10025 - 29 1955 812 2767 70.7 29.3 10030 - 34 1925 709 2634 73.1 26.9 10035 - 39 1432 487 1919 74.6 25.4 10040 - 44 862 345 1207 71.4 28.6 10045 - 49 434 179 613 70.8 29.2 10050 - 54 256 137 393 65.1 34.9 10055 - 59 167 83 250 66.8 33.2 10060 - 64 88 53 141 62.4 37.6 10065 - 69 47 30 77 61.0 39.0 10070 - 74 29 13 42 69.0 31.0 10075 + 19 20 39 48.7 51.3 100NS 0 0 0 0 0 0Total 8223 3602 11825 69.5 30.5 100
(j)Plumtree
Age Group Number of Households Headed by:Percent household headed
by:Male Female Total Male Female Total
< 15 1 2 3 33.3 66.7 10015 - 19 40 64 104 38.5 61.5 10020 - 24 193 153 346 55.8 44.2 10025 - 29 389 218 607 64.1 35.9 10030 - 34 407 171 578 70.4 29.6 10035 - 39 309 137 446 69.3 30.7 10040 - 44 235 96 331 71.0 29.0 10045 - 49 156 107 263 59.3 40.7 10050 - 54 115 81 196 58.7 41.3 10055 - 59 97 65 162 59.9 40.1 10060 - 64 41 40 81 50.6 49.4 10065 - 69 30 21 51 58.8 41.2 10070 - 74 16 16 32 50.0 50.0 10075 + 23 29 52 44.2 55.8 100NS - - - - - -Total 2052 1200 3252 63.1 36.9 100

MatabelelandSouthProvince Chapter 3 Household Characteristics
42
Table 3.6: Percent Distribution of Population in Collective Households by Age Group and Sex, Matabeleland South Province, Zimbabwe 2012 Census
Age Group Male Female Total Total Total0 - 14 48.7 51.3 100.0 452 7.815 - 49 48.9 51.1 100.0 5252 90.650-64 48.9 51.1 100.0 282 4.965+ 44.2 55.8 100.0 86 1.5Not Stated 66.7 33.3 100.0 6 0.1Total 48.8 51.2 100.0 100.0Persons 2831 2965 5796
Table 3.7: Distribution of Population in Collective Households by Age Group and Marital Status, Matabeleland South Province, Zimbabwe 2012 Census
Age Group Never Married Married Divorced/separated Widowed
Not Stated Total
0 - 4 - - - - 221 2215 - 9 - - - - 120 12010 - 14 - - - - 111 11115 - 19 261 53 4 - - 31820 - 24 529 231 17 - 5 78225 - 29 458 696 48 8 11 122130 - 34 214 742 73 27 11 106735 - 39 117 587 60 30 3 79740 - 44 47 391 35 50 2 52545 - 49 20 208 13 17 2 26050 - 54 11 120 6 9 2 14855 - 59 5 59 3 15 - 8260 - 64 2 29 5 15 1 5265 - 69 4 16 2 11 - 3370 - 74 1 11 1 5 - 1875 + 2 19 2 12 - 35NS 1 1 - 1 3 6Total 1672 3163 269 200 492 5796Percent 28.8 54.6 4.6 3.5 8.5 100.0

MatabelelandSouthProvince Chapter 3 Household Characteristics
43
Table 3.8: Population in Private Households by Urban/Rural, Relationship to Head of Household and Sex, Matabeleland South Province, Zimbabwe 2012 Census
(a) RuralRelationship to Head of Household Male Percent Female Percent Total PercentHead 70788 24.6 61783 19.6 132571 22.0Spouse 2301 0.8 46339 14.7 48640 8.1Son/daughter 90000 31.3 84516 26.9 174516 29.0Parent 341 0.1 2870 0.9 3211 0.5Grandson/daughter 65237 22.7 62062 19.7 127299 21.2Brother/sister 8630 3.0 7648 2.4 16278 2.7Other relative 34830 12.1 40050 12.7 74880 12.4Not relative 14872 5.2 8803 2.8 23675 3.9Not Stated 391 0.1 376 0.1 767 0.1Total 287390 100.0 314447 100.0 601837 100.0
(b) UrbanRelationship to Head of Household Male Percent Female Percent Total PercentHead 15392 41.9 6912 17.5 22304 29.2Spouse 656 1.8 10309 26.1 10965 14.4Son/daughter 11324 30.8 11301 28.6 22625 29.7Parent 35 0.1 217 0.5 252 0.3Grandson/daughter 1306 3.6 1411 3.6 2717 3.6Brother/sister 1634 4.4 1520 3.8 3154 4.1Other relative 4757 12.9 5861 14.8 10618 13.9Not relative 1619 4.4 1955 4.9 3574 4.7Not Stated 23 0.1 28 0.1 51 0.1Total 36746 100 39514 100 76260 100
(c )TotalRelationship to Head of Household Male Percent Female Percent Total PercentHead 86180 26.6 68695 19.4 154875 22.8Spouse 2957 0.9 56648 16.0 59605 8.8Son/daughter 101324 31.3 95817 27.1 197141 29.1Parent 376 0.1 3087 0.9 3463 0.5Grandson/daughter 66543 20.5 63473 17.9 130016 19.2Brother/sister 10264 3.2 9168 2.6 19432 2.9Other relative 39587 12.2 45911 13.0 85498 12.6Not relative 16491 5.1 10758 3.0 27249 4.0Not Stated 414 0.1 404 0.1 818 0.1Total 324136 100.0 353961 100.0 678097 100.0

MatabelelandSouthProvince Chapter 3 Household Characteristics
44
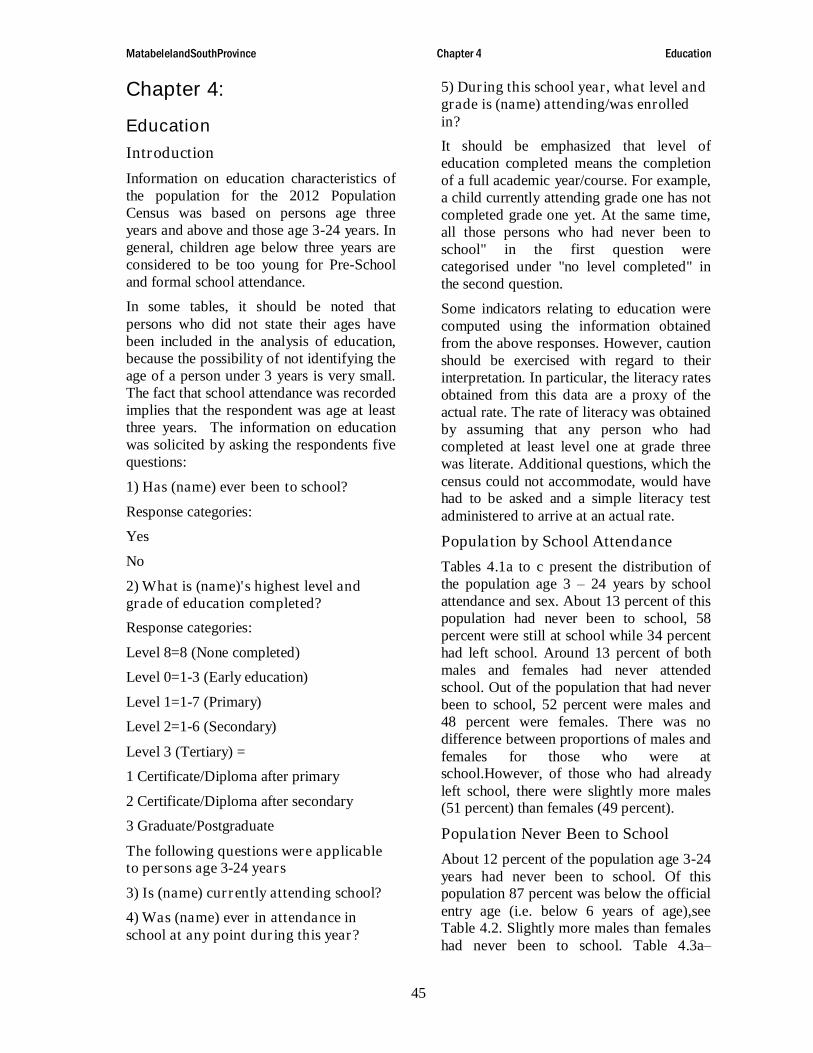
MatabelelandSouthProvince Chapter 4 Education
45
Chapter 4:
Education
Introduction
Information on education characteristics of the population for the 2012 Population Census was based on persons age three years and above and those age 3-24 years. In general, children age below three years are considered to be too young for Pre-Schooland formal school attendance.
In some tables, it should be noted that persons who did not state their ages have been included in the analysis of education, because the possibility of not identifying the age of a person under 3 years is very small. The fact that school attendance was recorded implies that the respondent was age at least three years. The information on education was solicited by asking the respondents five questions:
1) Has (name) ever been to school?
Response categories:
Yes
No
2) What is (name)'s highest level and grade of education completed?
Response categories:
Level 8=8 (None completed)
Level 0=1-3 (Early education)
Level 1=1-7 (Primary)
Level 2=1-6 (Secondary)
Level 3 (Tertiary) =
1 Certificate/Diploma after primary
2 Certificate/Diploma after secondary
3 Graduate/Postgraduate
The following questions were applicable to persons age 3-24 years
3) Is (name) currently attending school?
4) Was (name) ever in attendance in school at any point during this year?
5) During this school year, what level and grade is (name) attending/was enrolled in?
It should be emphasized that level of education completed means the completion of a full academic year/course. For example, a child currently attending grade one has not completed grade one yet. At the same time, all those persons who had never been to school" in the first question were categorised under "no level completed" in the second question.
Some indicators relating to education were computed using the information obtained from the above responses. However, caution should be exercised with regard to their interpretation. In particular, the literacy rates obtained from this data are a proxy of the actual rate. The rate of literacy was obtained by assuming that any person who had completed at least level one at grade three was literate. Additional questions, which the census could not accommodate, would have had to be asked and a simple literacy test administered to arrive at an actual rate.
Population by School Attendance
Tables 4.1a to c present the distribution of the population age 3 –24 years by school attendance and sex. About 13 percent of this population had never been to school, 58 percent were still at school while 34 percent had left school. Around 13 percent of both males and females had never attended school. Out of the population that had never been to school, 52 percent were males and 48 percent were females. There was no difference between proportions of males and females for those who were at school.However, of those who had already left school, there were slightly more males (51 percent) than females (49 percent).
Population Never Been to School
About 12 percent of the population age 3-24 years had never been to school. Of this population 87 percent was below the official entry age (i.e. below 6 years of age),see Table 4.2. Slightly more males than females had never been to school. Table 4.3a–

MatabelelandSouthProvince Chapter 4 Education
46
h,show that this was the pattern in most districts.
A district comparison shows that of the population which had never been to school the highest proportion was in Bulilima (16 percent). This was followed by Gwanda Rural (15 percent), Matobo, Beitbridge Rural andInsiza had 14 percent each., Mangwe, UmzingwaneBeitbridge Urban Gwanda Urban and Plumtreeeach with 11, 8, 4, 2 and 1 percent respectively,see Table 4.4.
Population Ever Been to School
A total of 548847 persons had ever been to school. These persons constituted 88 percent of the population age 3 years and above. Table 4.5 shows that more females than males had ever been to school.
Population Currently at School
Table 4.6 shows that more than half of the population at school was in primary school. Around 12 percent of the population currently at school was in early childhood education. Among those currently attending tertiary education, Gwanda Urban had the largest proportion (5 percent) compared with the situation in the other districts. The proportion in primary school ranged from 49 percent in Gwanda Urban to 70 percent in Beitbridge Rural, see Tables 4.7 a-h.
Population age 3-24 years which left school.
Of the total population age 3 –24 years 32 percent had left school. Of the population that had left school 51 percent were female and 49 percent male. Of the total female population age 3 –24 years 32percent had left school while the proportion for males was 33 percent. Table 4.8 shows that the majority of school leavers (69 percent) were age 17-24 years.
School Enrolment for population age 3 –24 years.
Table 4.9 shows that the gross enrolment ratio for primary education indicates that there were more pupils enrolled than should
officially be in this level (102). The gross enrolment ratio for males and females shows a similar pattern (103 and 102 respectively). The gross enrolment ratio for secondary education shows that there were fewer pupils than those who should officially be at this level. The gross enrolment ratio is the total enrolment in a given level of education irrespective of age expressed in ratio to the population of the age group which officially corresponds to the same level of education.
The net enrolment ratios indicate that thereis high participation for both sexes in the primary education, 86 for males and 88 for females. Slightly fewer males (41) participate at secondary level than females (51). The net enrolment ratio measures part of the pupils enrolled at the right age. Thusit measures the extent of participation of school going age population.
Highest Level of Education Completed
In Matabeleland South Province 32 percent of the population age 3 years and above had completed secondary and above level of education,see Table 4.10. More females have completed primary education than males (51 percent compared with 49 percent) while more females (53 percent compared with 47) have completed secondary education and above.
Literacy
For the 2012 Population Census, the population age at least 15 years who had completed at least grade 3 was classified as literate. The literacy rate is thus the number of persons, who had completed at least grade 3 per 100 persons in a particular age category. From this definition, 95percent of those age 15 years and above in the province were literate, as indicated in Table 4.11.Males had 96 percent while females had 94 percent literacy rate. The 20-34 years age group had the highest literacy rate of 99percent. As expected the literacy rate declined with increasing age, confirming that the older generation were relatively disadvantaged with regard to education.

MatabelelandSouthProvince Chapter 4 Education
47
The three Urban Districts, that is Gwanda Urban,Beitbridge Urban and Plumtree hadthe highestliteracy rate of 99 while the rates for the rest of the districts ranged from 92 to 97 percent,see Table 4.12.
Conclusion
In Matabeleland South province, there were slightly more females than males who had never been to school and there were slightly more females than males at school. Among those who had left school, there were more males than females and the same was observed towards higher levels of education. Matabeleland South had a literacy rate of 95percent.

MatabelelandSouthProvince Chapter 4 Education
48
Table 4.1: Distribution of the Population Age 3-24 by School Attendance and by Sex, Matabeleland South Province, Zimbabwe 2012 Census
(a)School Attendance Male Female TotalAttended School 163152 162119 325271Never Attended 24834 23373 48207Missing 327 300 627Total 188313 185792 374105
(b)School Attendance Male Female TotalCurrently Attending 108034 109346 217380Left School 64926 61553 126479Missing 15353 14893 30246Total 188313 185792 374105
(c)School Attendance Male Female TotalAttended School 50.2 49.8 100Never Attended 51.5 48.5 100Missing 52.2 47.8 100Total 50.3 49.7 100
(d)School Attendance Male Female TotalCurrently Attending 49.7 50.3 100Left School 51.3 48.7 100Missing 50.8 49.2 100Total 50.3 49.7 100
(e)School Attendance Male Female TotalAttended School 86.6 87.3 86.9Never Attended 13.2 12.6 12.9Missing 0.2 0.2 0.2Total 100 100 100Number 188313 185792 374105
(f)School Attendance Male Female TotalCurrently Attending 57.4 58.9 58.1Left School 34.5 33.1 33.8Missing 8.2 8.0 8.1Total 100 100 100Number 188313 185792 374105

MatabelelandSouthProvince Chapter 4 Education
49
Table 4.2: Percent Distribution of the Population Age 3-24 years who never attended school by Sex, Matabeleland South Province, Zimbabwe 2012 Census
Age Male Female Total3 36.9 39.0 37.94 32.3 32.5 32.45 15.2 15.4 15.36 4.6 4.4 4.57 1.8 1.5 1.78 1.0 0.8 0.99 0.7 0.6 0.6
10 0.6 0.4 0.511 0.5 0.4 0.412 0.5 0.4 0.513 0.5 0.4 0.414 0.6 0.4 0.515 0.6 0.4 0.516 0.7 0.4 0.517 0.6 0.5 0.518 0.6 0.4 0.519 0.4 0.3 0.420 0.6 0.4 0.521 0.4 0.3 0.422 0.4 0.4 0.423 0.3 0.3 0.324 0.3 0.3 0.3
Total 100 100 100Number 24834 23373 48207

MatabelelandSouthProvince Chapter 4 Education
50
Table 4.3: Percent Distribution of the Population Age 3-24 who never attended school by District and Sex, Matabeleland South Province, Zimbabwe 2012 Census
(a) Beitbridge RuralAge Male Female Total Number
3 34.8 36.5 35.6 24674 30.7 29.0 29.9 20665 16.0 15.7 15.8 10956 6.1 7.0 6.5 4517 2.7 2.1 2.4 1668 1.4 1.3 1.4 959 0.6 0.7 0.7 46
10 0.7 0.7 0.7 4911 0.7 0.5 0.6 4212 0.6 0.5 0.6 3913 0.5 0.5 0.5 3414 0.5 0.5 0.5 3315 0.5 0.5 0.5 3416 0.6 0.6 0.6 4017 0.4 0.4 0.4 2818 0.7 0.6 0.6 4419 0.4 0.6 0.5 3320 0.7 0.5 0.6 4321 0.5 0.5 0.5 3422 0.3 0.5 0.4 2823 0.3 0.4 0.4 2724 0.4 0.4 0.4 27
Total 100.0 100.0 100.0 6921

MatabelelandSouthProvince Chapter 4 Education
51
(b) BulilimaAge Male Female Total Number
3 31.8 33.5 32.6 25134 29.6 31.9 30.7 23665 15.2 16.6 15.9 12266 6.0 6.0 6.0 4637 2.7 2.2 2.5 1898 1.5 1.1 1.3 1019 1.4 0.9 1.2 91
10 1.1 0.7 0.9 7111 1.0 0.6 0.8 6412 0.8 0.7 0.8 5813 0.7 0.6 0.6 4914 0.9 0.4 0.7 5115 0.6 0.5 0.6 4616 1.0 0.4 0.7 5617 1.0 0.7 0.8 6418 0.9 0.5 0.7 5619 0.5 0.5 0.5 3820 1.1 0.5 0.8 6521 0.5 0.3 0.4 3122 0.7 0.6 0.6 5023 0.5 0.3 0.4 3224 0.3 0.3 0.3 24
Total 100.0 100.0 100.0 7704

MatabelelandSouthProvince Chapter 4 Education
52
(c)MangweAge Male Female Total Number
3 32.5 35.7 34.0 18284 33.5 33.0 33.3 17875 16.2 17.0 16.6 8916 5.5 5.2 5.3 2867 2.5 2.0 2.3 1228 1.2 1.0 1.1 589 0.6 0.8 0.7 39
10 0.6 0.6 0.6 3411 0.5 0.2 0.4 2012 0.5 0.4 0.5 2613 0.4 0.3 0.3 1814 0.7 0.5 0.6 3315 1.0 0.4 0.7 3816 0.6 0.5 0.5 2917 0.8 0.4 0.6 3418 0.5 0.4 0.5 2519 0.7 0.1 0.4 2220 0.4 0.4 0.4 2021 0.3 0.3 0.3 1622 0.3 0.2 0.3 1423 0.2 0.3 0.3 1424 0.3 0.4 0.3 17
Total 100.0 100.0 100.0 5371

MatabelelandSouthProvince Chapter 4 Education
53
(d)Gwanda RuralAge Male Female Total Number
3 39.8 42.6 41.2 30274 33.9 32.1 33.0 24265 13.2 13.6 13.4 9856 3.6 3.3 3.4 2527 1.3 1.2 1.2 908 0.8 0.8 0.8 599 0.4 0.3 0.4 29
10 0.4 0.5 0.4 3211 0.3 0.5 0.4 2912 0.5 0.5 0.5 3513 0.5 0.3 0.4 3114 0.4 0.3 0.3 2515 0.8 0.3 0.6 4116 0.7 0.5 0.6 4317 0.6 0.6 0.6 4218 0.5 0.4 0.5 3419 0.4 0.5 0.4 3120 0.6 0.5 0.5 4021 0.5 0.4 0.4 3222 0.4 0.4 0.4 3123 0.2 0.3 0.2 1824 0.2 0.3 0.3 20
Total 100.0 100.0 100.0 7352

MatabelelandSouthProvince Chapter 4 Education
54
(e) InsizaAge Male Female Total Number
3 39.5 40.7 40.1 27384 32.6 33.7 33.1 22625 15.3 15.2 15.3 10446 3.8 3.5 3.7 2507 1.1 1.0 1.1 748 0.9 0.3 0.6 419 0.6 0.5 0.5 37
10 0.5 0.3 0.4 2811 0.2 0.3 0.3 1812 0.4 0.4 0.4 2613 0.2 0.4 0.3 2214 0.5 0.5 0.5 3515 0.6 0.4 0.5 3416 0.5 0.2 0.4 2717 0.2 0.3 0.3 1918 0.5 0.4 0.5 3419 0.5 0.3 0.4 2520 0.5 0.3 0.4 2721 0.3 0.2 0.3 1922 0.5 0.3 0.4 2823 0.3 0.2 0.3 1824 0.3 0.4 0.3 22
Total 100.0 100.0 100.0 6828
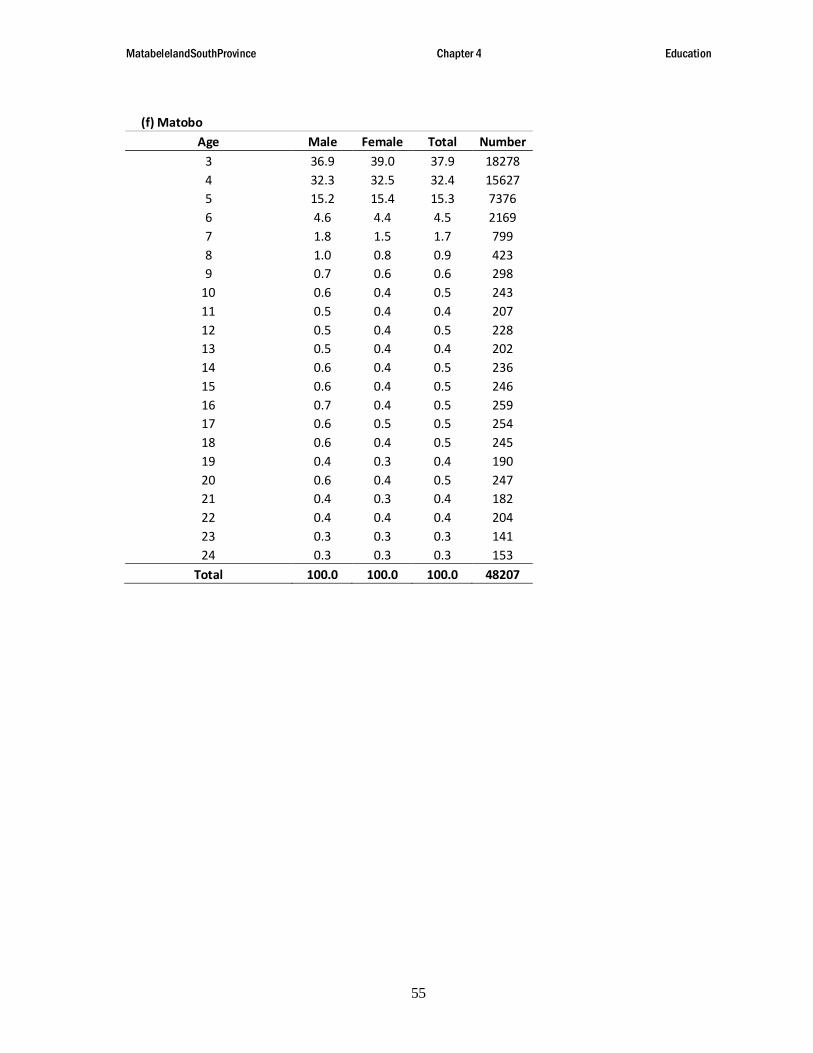
MatabelelandSouthProvince Chapter 4 Education
55
(f) MatoboAge Male Female Total Number
3 36.9 39.0 37.9 182784 32.3 32.5 32.4 156275 15.2 15.4 15.3 73766 4.6 4.4 4.5 21697 1.8 1.5 1.7 7998 1.0 0.8 0.9 4239 0.7 0.6 0.6 298
10 0.6 0.4 0.5 24311 0.5 0.4 0.4 20712 0.5 0.4 0.5 22813 0.5 0.4 0.4 20214 0.6 0.4 0.5 23615 0.6 0.4 0.5 24616 0.7 0.4 0.5 25917 0.6 0.5 0.5 25418 0.6 0.4 0.5 24519 0.4 0.3 0.4 19020 0.6 0.4 0.5 24721 0.4 0.3 0.4 18222 0.4 0.4 0.4 20423 0.3 0.3 0.3 14124 0.3 0.3 0.3 153
Total 100.0 100.0 100.0 48207
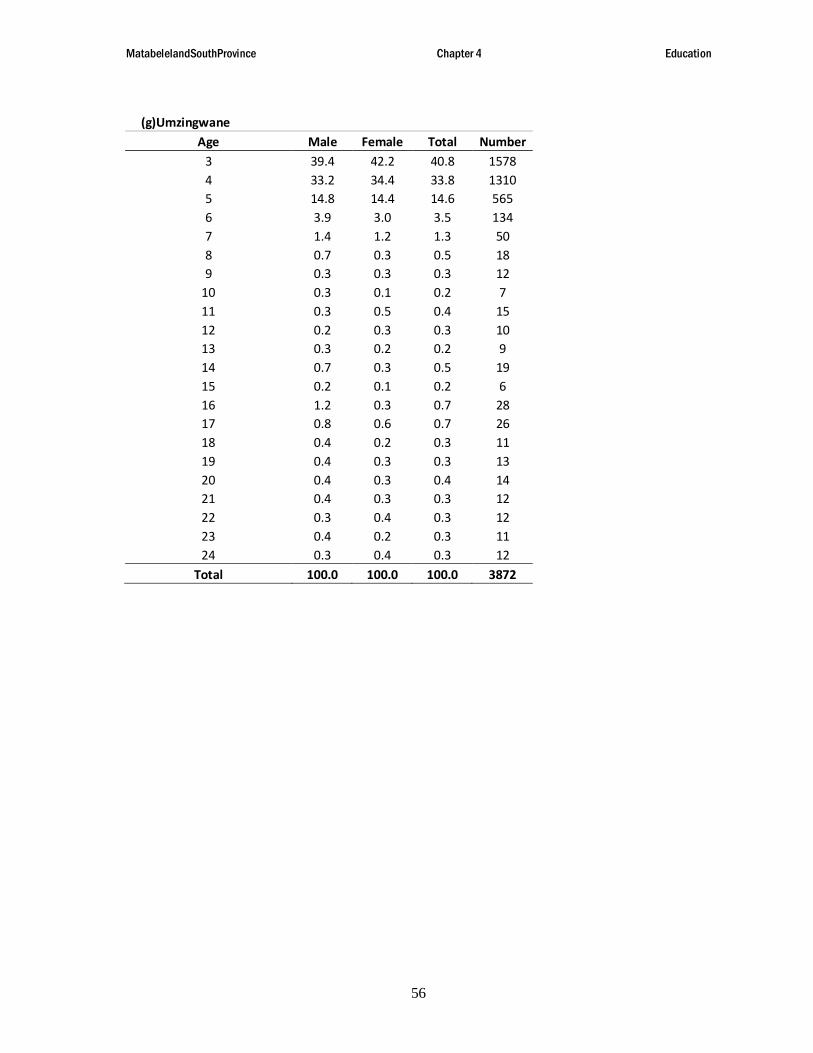
MatabelelandSouthProvince Chapter 4 Education
56
(g)UmzingwaneAge Male Female Total Number
3 39.4 42.2 40.8 15784 33.2 34.4 33.8 13105 14.8 14.4 14.6 5656 3.9 3.0 3.5 1347 1.4 1.2 1.3 508 0.7 0.3 0.5 189 0.3 0.3 0.3 12
10 0.3 0.1 0.2 711 0.3 0.5 0.4 1512 0.2 0.3 0.3 1013 0.3 0.2 0.2 914 0.7 0.3 0.5 1915 0.2 0.1 0.2 616 1.2 0.3 0.7 2817 0.8 0.6 0.7 2618 0.4 0.2 0.3 1119 0.4 0.3 0.3 1320 0.4 0.3 0.4 1421 0.4 0.3 0.3 1222 0.3 0.4 0.3 1223 0.4 0.2 0.3 1124 0.3 0.4 0.3 12
Total 100.0 100.0 100.0 3872

MatabelelandSouthProvince Chapter 4 Education
57
(h) GwandaAge Male Female Total Number
3 52.9 47.8 50.3 3754 30.0 31.9 31.0 2315 10.6 12.7 11.7 876 3.0 1.6 2.3 177 0.3 0.8 0.5 48 0.3 1.1 0.7 59 0.5 0.0 0.3 2
10 0.0 0.3 0.1 111 0.0 0.5 0.3 212 0.0 0.0 0.0 013 0.0 0.0 0.0 014 0.0 0.3 0.1 115 0.5 0.0 0.3 216 0.0 0.0 0.0 017 0.3 0.5 0.4 318 0.3 0.0 0.1 119 0.0 0.0 0.0 020 0.5 1.6 1.1 821 0.3 0.5 0.4 322 0.0 0.3 0.1 123 0.0 0.3 0.1 124 0.5 0.0 0.3 2
Total 100.0 100.0 100.0 746

MatabelelandSouthProvince Chapter 4 Education
58
(i)BeitbridgeAge Male Female Total Number
3 48.0 51.2 49.6 9704 36.9 29.1 33.0 6455 9.7 13.2 11.5 2246 1.2 1.8 1.5 307 1.1 1.0 1.1 218 0.1 0.4 0.3 59 0.1 0.1 0.1 2
10 0.0 0.0 0.0 011 0.2 0.0 0.1 212 0.1 0.0 0.1 113 0.2 0.1 0.2 314 0.2 0.2 0.2 415 0.1 0.1 0.1 216 0.1 0.1 0.1 217 0.2 0.5 0.4 718 0.1 0.5 0.3 619 0.1 0.1 0.1 220 0.1 0.2 0.2 321 0.4 0.4 0.4 822 0.1 0.6 0.4 723 0.3 0.1 0.2 424 0.6 0.2 0.4 8
Total 100.0 100.0 100.0 1956

MatabelelandSouthProvince Chapter 4 Education
59
(j) PlumtreeAge Male Female Total Number
3 46.0 51.1 48.7 3004 28.2 29.8 29.1 1795 15.5 8.9 12.0 746 3.8 2.8 3.2 207 1.4 2.2 1.8 118 0.0 0.3 0.2 19 0.3 0.3 0.3 2
10 0.0 0.0 0.0 011 0.3 0.0 0.2 112 0.0 1.2 0.6 413 0.7 0.3 0.5 314 0.0 0.9 0.5 315 0.3 0.6 0.5 316 0.0 0.0 0.0 017 0.7 0.0 0.3 218 0.7 0.3 0.5 319 0.0 0.0 0.0 020 0.7 0.6 0.6 421 0.0 0.3 0.2 122 0.7 0.0 0.3 223 0.3 0.0 0.2 124 0.3 0.3 0.3 2
Total 100.0 100.0 100.0 616
Table 4.4: Percent Distribution of the Population Age 3-24 who never attended school by Sex and District, Matabeleland South Province, Zimbabwe 2012 Census
District Number PercentageMale Female Total Male Female Total
Beitbridge Rural 3574 3347 6921 14.4 14.3 14.4Bulilima 4003 3701 7704 16.1 15.8 16.0Mangwe 2801 2570 5371 11.3 11.0 11.1Gwanda Rural 3787 3565 7352 15.2 15.3 15.3Insiza 3486 3342 6828 14.0 14.3 14.2Matobo 3567 3274 6841 14.4 14.0 14.2Umzingwane 1982 1890 3872 8.0 8.1 8.0Gwanda 367 379 746 1.5 1.6 1.5Beitbridge 976 980 1956 3.9 4.2 4.1Plumtree 291 325 616 1.2 1.4 1.3Total 24834 23373 48207 100.0 100.0 100.0

MatabelelandSouthProvince Chapter 4 Education
60
Table 4.5: Percent Distribution of Population ever been to school by Age Group and Sex, Matabeleland South Province, Zimbabwe 2012 Census
Age Group Male Female Total0-4 1.2 1.2 1.25-9 16.2 15.2 15.710-14 18.7 16.8 17.715 - 19 15.8 13.4 14.520 - 24 9.9 10.5 10.225 - 29 8.1 8.8 8.530 - 34 6.6 6.8 6.735 - 39 5.1 5.5 5.340 - 44 3.9 4.3 4.145 - 49 2.7 3.4 3.150 - 54 2.6 3.5 3.155 - 59 2.3 3.0 2.760 - 64 1.8 2.2 2.065 - 69 1.5 1.8 1.770 - 74 1.3 1.3 1.375 + 2.1 2.2 2.2NS 0.1 0.1 0.1Total 100.0 100.0 100.0Number 264354 284493 548847
Table 4.6: Population Age 3-24 Years Currently Attending School by Current Level of Education Being Attended and Sex, Matabeleland South Province, Zimbabwe 2012 Census
Current Level Male Female TotalPre-School 12.0 11.8 11.9Primary 66.7 63.9 65.3Secondary 20.5 23.4 22.0Tertiary 0.5 0.6 0.6Not known * * *Missing 0.3 0.3 0.3Total 100.0 100.0 100.0Number 108034 109346 217380

MatabelelandSouthProvince Chapter 4 Education
61
Table 4.7: Population Age 3-24 Years Currently Attending School by District and Current Level of Education Being Attended and Sex, Matabeleland South Province, Zimbabwe 2012 Census
(a) Beitbridge RuralCurrent Level Male Female TotalPre-School 12.1 11.8 12.0Primary 70.7 69.2 70.0Secondary 16.6 18.4 17.5Tertiary 0.2 0.2 0.2Not known * 0.1 *Missing 0.4 0.3 0.3Total 100.0 100.0 100.0
(b) BulilimaCurrent Level Male Female TotalPre-School 13.6 13.1 13.3Primary 69.2 66.8 68.0Secondary 16.6 19.4 18.0Tertiary 0.3 0.3 0.3Not known * 0.1 0.1Missing 0.3 0.3 0.3Total 100.0 100.0 100.0
(c) MangweCurrent Level Male Female TotalPre-School 13.3 13.1 13.2Primary 69.0 66.0 67.5Secondary 17.2 20.3 18.8Tertiary 0.3 0.3 0.3Not known 0.0 * *Missing 0.2 0.3 0.2Total 100.0 100.0 100.0
(d) Gwanda RuralCurrent Level Male Female TotalPre-School 12.0 11.8 11.9Primary 66.7 63.9 65.3Secondary 20.5 23.4 22.0Tertiary 0.5 0.6 0.6Not known * * *Missing 0.3 0.3 0.3Total 100.0 100.0 100.0
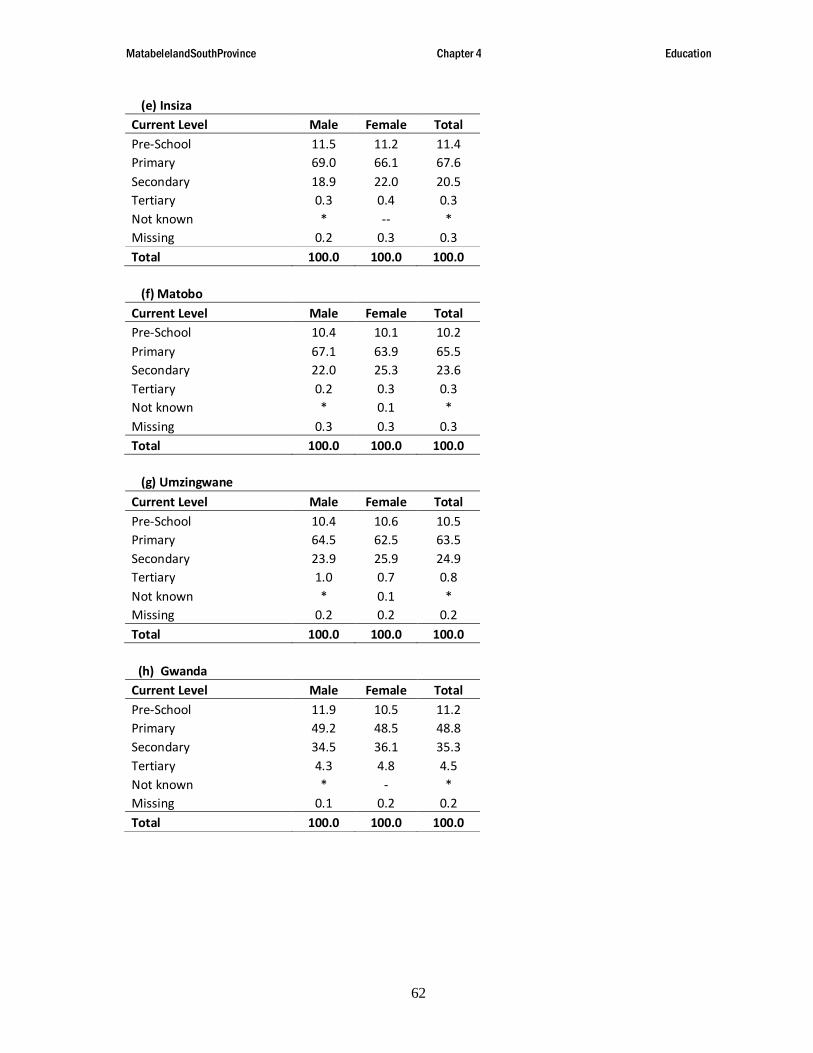
MatabelelandSouthProvince Chapter 4 Education
62
(e) InsizaCurrent Level Male Female TotalPre-School 11.5 11.2 11.4Primary 69.0 66.1 67.6Secondary 18.9 22.0 20.5Tertiary 0.3 0.4 0.3Not known * -- *Missing 0.2 0.3 0.3Total 100.0 100.0 100.0
(f) MatoboCurrent Level Male Female TotalPre-School 10.4 10.1 10.2Primary 67.1 63.9 65.5Secondary 22.0 25.3 23.6Tertiary 0.2 0.3 0.3Not known * 0.1 *Missing 0.3 0.3 0.3Total 100.0 100.0 100.0
(g) UmzingwaneCurrent Level Male Female TotalPre-School 10.4 10.6 10.5Primary 64.5 62.5 63.5Secondary 23.9 25.9 24.9Tertiary 1.0 0.7 0.8Not known * 0.1 *Missing 0.2 0.2 0.2Total 100.0 100.0 100.0
(h) GwandaCurrent Level Male Female TotalPre-School 11.9 10.5 11.2Primary 49.2 48.5 48.8Secondary 34.5 36.1 35.3Tertiary 4.3 4.8 4.5Not known * - *Missing 0.1 0.2 0.2Total 100.0 100.0 100.0

MatabelelandSouthProvince Chapter 4 Education
63
(i) BeitbridgeCurrent Level Male Female TotalPre-School 15.3 13.6 14.4Primary 53.8 51.7 52.7Secondary 28.7 32.2 30.6Tertiary 2.0 2.1 2.0Not known * * *Missing 0.2 0.3 0.3Total 100.0 100.0 100.0
(j) PlumtreeCurrent Level Male Female TotalPre-School 12.8 11.9 12.3Primary 53.7 48.3 50.8Secondary 31.0 36.2 33.7Tertiary 2.3 3.2 2.8Not known 0.1 - 0.1Missing 0.1 0.4 0.2Total 100.0 100.0 100.0
Table 4.8: Population Age 3 - 24 years Who Left School by Sex and Age Matabeleland South Province, Zimbabwe 2012 Census
School Age Percent Male Percent Female Percent Total3 5.6 3604 5.6 3427 5.6 70314 5.0 3248 4.7 2904 4.9 61525 2.5 1607 2.5 1536 2.5 31436 1.0 623 0.9 547 0.9 11707 0.5 321 0.5 278 0.5 5998 0.4 255 0.4 230 0.4 4859 0.4 251 0.3 198 0.4 449
10 0.5 319 0.3 203 0.4 52211 0.6 414 0.4 234 0.5 64812 1.2 749 0.7 419 0.9 116813 1.7 1112 1.2 755 1.5 186714 3.4 2207 2.4 1466 2.9 367315 4.9 3193 3.4 2080 4.2 527316 6.7 4374 5.0 3075 5.9 744917 8.4 5424 7.4 4537 7.9 996118 10.3 6664 9.6 5906 9.9 1257019 8.8 5731 8.9 5453 8.8 1118420 9.5 6157 10.6 6534 10.0 1269121 7.7 4979 8.7 5370 8.2 1034922 7.7 4979 9.5 5870 8.6 1084923 7.0 4571 8.8 5446 7.9 1001724 6.4 4144 8.3 5085 7.3 9229

MatabelelandSouthProvince Chapter 4 Education
64
Total 100.0 64926 100.0 61553 100.0 126479
Table 4.9: Primary and Secondary School Enrolment for Population Age 3-24 Years Matabeleland South Province, Zimbabwe 2012 Census
Enrolment Primary SecondaryMale Female Total Male Female Total
Gross Enrolment 103 102 102 41 51 46Net Enrolment 86 88 87 37 47 42Enrolled Population 72099 69898 141997 22108 25608 47716

MatabelelandSouthProvince Chapter 4 Education
65

MatabelelandSouthProvince Chapter 4 Education
66
Table 4.10: Population Age 3+ by Age Group, Sex and Highest Level of Academic Education Completed, Matabeleland South Province, Zimbabwe 2012 Census
Age Group No Education Primary Secondary & Above Not Known Total TotalMale Female Male Female Male Female Male Female Male Female
0-4 12.0 14.0 * * * * 9.0 6.0 1.0 1.0 1.29-10 84.0 82.0 16.0 16.0 * * 13.0 11.0 16.0 15.0 15.710-14 2.0 1.0 32.0 29.0 3.0 3.0 14.0 9.0 19.0 17.0 17.715 - 19 * * 13.0 7.0 25.0 25.0 16.0 9.0 16.0 13.0 14.520 - 24 * * 7.0 5.0 17.0 20.0 5.0 8.0 10.0 10.0 10.225 - 29 * * 5.0 5.0 15.0 16.0 5.0 7.0 8.0 9.0 8.530 - 34 * * 4.0 4.0 12.0 12.0 6.0 7.0 7.0 7.0 6.735 - 39 * * 3.0 4.0 9.0 9.0 2.0 5.0 5.0 6.0 5.340 - 44 * * 2.0 3.0 8.0 7.0 5.0 4.0 4.0 4.0 4.145 - 49 * * 2.0 4.0 5.0 4.0 3.0 4.0 3.0 3.0 3.150 - 54 * * 3.0 5.0 3.0 2.0 7.0 5.0 3.0 3.0 3.155 - 59 * * 3.0 5.0 2.0 1.0 4.0 6.0 2.0 3.0 2.760 - 64 * * 3.0 4.0 1.0 1.0 2.0 6.0 2.0 2.0 2.065 - 69 * * 2.0 3.0 1.0 * 3.0 3.0 2.0 2.0 1.770 - 74 * * 2.0 2.0 1.0 * 1.0 3.0 1.0 1.0 1.375 + * * 3.0 4.0 1.0 * 7.0 8.0 2.0 2.0 2.2NS * * * * * * 1.0 * * * 0.1Total 100.0 100.0 100.0 100.0 100.0 100.0 100.0 100.0 100.0 100.0 100.0

MatabelelandSouthProvince Chapter 4 Education
67
Table 4.11 Literacy Rates for the population Aged 15+ by Age Group and Sex, Matabeleland South Province, Zimbabwe 2002 Census
Matabeleland South Males Females Total15 - 19 98 99 9820 - 24 99 99 9925 - 29 98 99 9930 - 34 98 99 9935 - 39 98 98 9840 - 44 98 98 9845 - 49 96 94 9550 - 54 92 88 9055 - 59 92 88 9060 - 64 91 86 8865 - 69 91 85 8770 - 74 88 81 8475 + 83 77 80NS 34 23 28Total 96 94 95
Table 4.12: Literacy Rates for the Population Aged 15+ by District and by Sex, Matabeleland South Province, 2012 Census
DistrictLiteracy Rates
Male Female TotalBeitbridge Rural 94 91 92Bulilima 94 92 93Mangwe 96 94 95Gwanda Rural 96 94 95Insiza 97 95 96Matobo 96 95 95Umzingwane 97 96 97Gwanda 99 99 99Beitbridge 99 99 99Plumtree 99 99 99Total 96 94 95
Matabeleland South Province Chapter 5 Activity and Labour Force
68
Chapter 5:
Activity and Labour ForceIntroduction
The analysis of activity and labour force of a population gives a picture of the manpower of a nation and provides a breakdown of the activities of the nation's labour force. The information is used to classify people according to whether they are in the labour force or not and all this information is important for development planning.
The 2012 Population Census collected labour force information from persons age 10 years and above. The main reason why persons age 10- 14 years were asked questions on activity was to obtain information on children working The present analysis is, however, based mainly on population age 15 years and above although information on the 10- 14 years age group has been tabulated.
Three questions on activity were asked. The first question solicited information on respondent's main activity in the last twelve months. This question had nine response categories which were:
Paid employee
Employer
Own account worker
Unpaid family worker
Looking for work/unemployed
Student
Homemaker
Retired /sick/too old
Others
Persons who responded that their main activity was any of the firstfour categories above were then asked their main occupation during the last twelve months as the second question.
An additional question on field of specialisation was asked to a person whose main activity was any of the first four categories and who had some recognised post primary/secondary education/training.
The economically active population refers to the total number of persons available for the production of goods and services as realised in national income statistics. The economically active population includes paid employees and employers, unpaid family workers, own account workers and those unemployed. On the other hand, homemaking, studying and being sick or too old are examples of activities of the economically inactive population. It is important to note that most women tend to report that they are homemakers even though they combine housework with other economically productive activities.
The term labour force in the context of the 2012 Population Census refers to the economically active persons. The definition is in line with that stipulated by the United Nations System of National Accounts and Balances.
Economically Active PopulationAccording to the 2012 Population Census, the population age 15 years and above for Matabeleland South Province was 386461and 72 percent of this population was economically active. Figure 5.1shows that out of the economically active population, 11percent were unemployed whilst 89 percent were employed.
Tables 5.1a and 5.1bdescribe the economically active population by sex and activity. Table 5.1ashows that there were more females than males in the categories of unpaid family worker and own account worker. However, more males than females were in categories of paid employee, employer and unemployed. Among the economically active, males and females had almost equal proportions Table 5.1b shows that the highest proportion of economically active males and females were own account workers.

Matabeleland South Province Chapter 5 Activity and Labour Force
69
Relatively, the percentage of unemployed was higher for males (13 percent) than for females (10 percent). The activity status of persons with a disability is similar to that described above, see Table 5.1c.
Table 5.2 shows the economically active population by sex and district in the province. Most districts in the province had more economically active males than females. In Beitbridge Rural and Bulilimathere were more females than males who were economically active.
Age-Sex Composition of the Economically Active Population
The proportion of persons who were economically active varied with different age and sex categories of the population. Figure 5.2 show, that there were more economically active males than females.Tables 5.3a to 5.3cshow detailed information on the economically active population by age, sex and activity. These Tables show that for both sexes, the largest proportions of economically active persons were in the age range 15-34 years for both males and females. Thereafter the proportions declined as age increased.
The extent of participation of a population in the labour force can be measured by
activity rates. An activity rate is defined as the number of economically active persons in a population per hundred persons in that particular population. The rate is calculated by dividing population age 15 years and above who are economically
active by the total population in that age group and then multiplying the result by hundred. The activity rate for Matabeleland South Province was 72. The activity rates can be specific for age and sex categories of a population, as shown in Tables 5.4a to 5.4cand in Figure 5.3.
Activity rates for Matabeleland South Province were higher for males than for females in all age groups. The activity rates for males ranged from 53 to 95 and those for females from 43 to 81 in the broad age range 15-64 years. The activity rate for persons age 65 years+ was 53 and 37 for males and females respectively.
Figure 5.1: Labour Force Framework
Total Population683893
Children Under 1529674543.4%
Age Not Stated687
0.1%
Adults 15 Years and Above38646156.5%
Economically Inactive10569327.3%
Activity Not Stated15990.4%
Economically Active27916972.2%
Students3812436.1%
Homemakers3732835.3%
Retired, Sick/Too Old, Other3024128.6%
Unemployed3157111.3%
Employed24759888.7%

Matabeleland South Province Chapter 5 Activity and Labour Force
70
District Distribution of the Economically Active Population
Of the total number of economically active persons, the largest proportion were in Gwanda Rural with 16 percent followed by insiza with 15 percent, Beitbridge Rural and Matobo had 15 percent each, Bulilima(12 percent), Umzingwane (10 percent), Beitbridge Urban (9 percent), Mangwe (8 percent), Gwanda Urban (4percent) and Plumtree(2 percent), see Table 5.6a. These proportions seem to only reflect the population distribution in the province.
Table 5.6bshows that the category own account worker had the highest proportion of the economically active persons for all the districts except in Gwanda Urban and Plumtreewhere it was the paid employee category. The employer category had the least proportion of economically active persons for all districts.
Gwanda Rural had the highest proportion of economically active males while Plumtreehad the least, see Table 5.7a. For females Beitbridge Rural had the highest proportion while Plumtree had the least, see Table5.7b.
Inall the districts except Beitbridge, Plumtreeand Gwanda Urban, the highest proportion of economically active males were in the own account worker category.
The largest proportion of economically active persons in all age groups wasfoundin Gwanda Rural. Table 5.8shows that there were more economically active persons in Beitbridge Urban, Gwanda Urban and Plumtree in the 20-34 year age group while Gwanda Rural had the highest proportion of economically active persons in the 35-64 year age group. Twenty-two percent of the economically active persons in the 65 years and above age group were in Gwanda Rural district.

Matabeleland South Province Chapter 5 Activity and Labour Force
71
Table 5.9 a-h show activity rates by age group for the ten districts separately. The highest activity rate for all districts was in the 35-49 years age group. There was a steady decline of the activity rates in the age groups that followed. The least activity rate was in the 65+ years in five districts while Insiza, Gwanda Rural, Beitbridge Urban,Umzingwane and Matobo had the least in 15-19 age group.
Employment and Unemployment
A situation where the supply of labour exceeds demand gives rise to unemployment. The unemployed were those who had done no work and were looking for work and were available for work.
The reference period used to determine current unemployment rate is usually one week. Information on the employment situation was obtained using a time reference period of twelve months. Persons who stated paid employee, employer, own account worker and unpaid family worker as their main activity during the reference period were regarded as employed and census data thus provide a general picture of employment for the 12 months.
For persons age 15 years and above, Matabeleland South Province had a total of 279169 employed persons and 31571persons who reported that they were unemployed.
Within the unemployed category there were more males (56 percent) than females (44 percent). Females and males had almost the same proportion in the employed category see Table 5.10a. Table 5.10b indicates that of all the economically active persons 89 percent were employed while 11 percent were unemployed. About 7 percent of persons with a disability were unemployed,see Table 5.11).
Table 5.12shows unemployment rate by district. This table shows that GwandaRural had an unemployment rate
of 10 percent, Umzingwane had a rate of 12 percent, Mangwe (23 percent), Insiza (6 percent), Beitbridge Urban (4 percent), Gwanda Urban (14 percent), Matobo (16percent),Plumtree(19percent), Beitbridge Rural(3 percent) and Bulilima (18percent).
Children Working
The analysis of children working in this chapter is based only on children age 10-14 years because the 2012 Population Census did not collect data on activity for children under ten years of age. According to the International Labour Organisation (ILO) children under fifteen years of age are not normally supposed to be economically active.
Matabeleland South Province had a total of 98387 children age 10-14 years. About five percent of these children, (5307 children) were economically active The largest proportion of working children (46 percent) were unpaid family worker, followed by those looking for work (27 percent) and by own account workers(14 percent). About 12 percent of children age 10-14 years stated that they were paid employee, see Tables 5.13a and b.
Economically Inactive Population
The economically inactive population can be put in the following categories,
o Homemakers
o Students
o retired persons/sick/too old
o others.
A homemaker was defined as a person of either sex who was engaged in household chores in their own household, e.g. cooking and fetching water. Homemakers were not paid for doing these duties and they did not work for profit. Domestic workers were not placed in this category because they were paid for their duties.

Matabeleland South Province Chapter 5 Activity and Labour Force
72
Those who worked on household businesses were categorised either as own account workers or unpaid family workers.
For the 2012 Population Census, students were those who attended any regular formal public or private educational institution.
Retired/sick/too old were those persons who reported that they were not engaged in any activity for most of the last twelve months because they had retired, were sick or too old.
The "other" category was for those persons who were not working and did not fit in any of the categories mentioned above. Prisoners were included in this category.Table 5.14a and b and Figure 5.4give a picture of inactive population by various activities in the province. Proportionately, more females were economically inactive than males in the province (66 percent females and 34 percent males). About 87 percent of all homemakers were females, see Table 5.14a.
Table 5.14bshows that the highest percentage of inactive females (47 percent) reported homemaking as their main activity while the highest percentage of
inactive males (52 percent) reported studying as their main activity,see Figure 5.4. Table 5.14balso shows that persons who mentioned homemaking as their main activity made up 35 percent of the
economically inactive population while those who were studying made up 36 percent. The other economically inactive persons were sick, too old or retired. Among the economically inactive persons with a disability, the largest proportion was in the retired, sick, too old category as shown in Table 5.14c.
Details on the economically inactive population by age, sex and activity are shown in Tables 5.15a to c. As expected, the majority (39 percent) of those who reported studying as their main activity were young persons age 15-19 years. This was the case for both males and females. The Tables also show that the number of inactive persons declined as age increased. The majority (73 percent) of retired persons were in the age group 65 years and above, see Table 5.15c.
Distribution Of the Economically Inactive Population by District.
In the rural areas homemakers constituted the largest proportion of inactive persons (35 percent), while in the urban districts the student category(51) percent constituted the largest percent of inactivepersons. Both in urban and rural districts
the other category constituted the least proportion of the inactive persons,see Table 5.16 a and b. Tables 5.17a to c show that the majority of the economically inactive persons were in Gwanda Rural
Matabeleland South Province Chapter 5 Activity and Labour Force
73
(18 percent) followed by Matobo (16 percent),Bulilima and Mangwe each with (14 percent), Insiza (13 percent)Umzingwane (10 percent), Bulilima (12 percent), Beitbridge Rural ( 7 percent),Beitbridge Urban (4 percent),Gwanda Urban(3 percent) and Plumtreewith 2 percent.
Age Dependency Ratios
There are three types of dependency ratios, i) the old age, ii) child and iii) the age dependency ratio (child plus old age dependency).
The old age dependency ratio is the number of persons age 65 years and above per hundred persons age 15-64 years. The old age dependency ratio for the province was 12 dependents per 100 persons in the age group 15-64 years. The child dependency ratio is the number of children under 15 years of age per hundred adults in the ages 15-64 years. This dependency ratio was 86 dependents per 100 persons in the age group 15-64 years.
The age dependency ratio refers to the number of persons who are under 15 years of age plus persons 65 years and above, per hundred persons in the 15-64 years age group. This is used to measure the ratio of theyoung children and the aged to the potential working population. When this dependency ratio is high, it shows that there is a high dependency burden for that particular population. The age dependency ratio for Matabeleland South Province in 2012 was 97 dependents per 100 persons in the age group 15-64 years.
Occupation
Table 5.18shows occupational classification by sex for the population in MatabelelandSouthProvince. The highest proportion of employed persons had their occupations in agriculture (46 percent).Sixty-two percent of persons with a disability were employed in the agricultural occupations (seeTable 5.21).Beitbridge Rural had 59 percent of
employed persons in the agricultural occupations, followed by those in the services occupations with 24 percent, mining and construction3.3 percent and manufacturing 2.9 percent. In Bulilima58 percent were in agriculture occupations, 20 percent were in services occupations, 6 percent in mining and construction and 3 percent in education. In Mangwe48 percent were in agriculture occupations, 23 percent in the services occupations, 10 percent in mining and construction and about 2 percent in the manufacturing and education occupations. In Gwanda Rural 48 percent of employed persons were in the agricultural occupations followed by those in the services occupations 19 percent. Mining and construction had 15 percent and Education had 2 percent. Insiza district had 51 percent in agriculture, 20 percent in mining and construction, 19 percent in services occupations and 2 percent in education and law and security. In Matobo district 62 percent were in agricultural occupations while 12 percent were in services occupations, 8 percent in mining and construction and 2 percent in the law and security occupations. InGwanda Urban the services occupation had the largest proportion,(32 percent) followed by mining and construction with 17 percent, law and security9 percent and education about 7 percent and business and financeabout 7 percent. Umzingwane district had 48 percent in agriculture, 17 percent in services occupations, 17 percent in mining and construction and 2 percent in education occupation. In Beitbridge Urban had about 50 percent in services occupations, business and finance and transport each had 10 percent, mining and construction had 5 percent. Plumtree district had 33 percent in the services occupations, 11 percent in law and security, 10 percent in mining and construction and 8 percent in Business and finance
Table 5.20 shows that of the employed persons enumerated in Matabeleland South

Matabeleland South Province Chapter 5 Activity and Labour Force
74
province about 20 percent were communal farmers/communal farm workers while the other employed persons were 80 percent.
Conclusion
Data on activity for Matabeleland South province from the 2012 Population Census show that about 41 percent of the total population for the province was in the economically active category. The economically active population constituted 72 percent of persons age 15 years and above. Of theeconomically active population, 11 percent were unemployed and 89 percent employed.
Thedata also show that more males than females were economically active in Matabeleland South province and that most of the employed persons had occupations in the agricultural sector.

Matabeleland South Province Chapter 5 Activity and Labour Force
75
Table 5.1a: Percent Distribution of Economically Active Persons by Sex and Activity, Matabeleland South Province, Zimbabwe 2012 Census
Activity Male Female Total Total PopulationPaid employee 66.5 33.5 100.0 71,719Employer 64.5 35.5 100.0 782Own account worker 41.9 58.1 100.0 148,771Unpaid family worker 46.4 53.6 100.0 26,326Looking for work/unemployed 56.5 43.5 100.0 31,571Total 50.3 49.7 100.0 279,169
(b)Activity Male Female TotalPaid employee 33.9 17.3 25.7Employer 0.4 0.2 0.3Own account worker 44.3 62.4 53.3Unpaid family worker 8.7 10.2 9.4Looking for work/unemployed 12.7 9.9 11.3Total 100.0 100.0 100.0Number 140,526 138,643 279,169
(c)Activity Male Female Total % TotalPaid employee 2,141 1,039 3,180 16.3Employer 37 19 56 0.3Own account worker 5,449 7,745 13,194 67.5Unpaid family worker 820 862 1,682 8.6Looking for work/unemployed 881 542 1,423 7.3Total 9,328 10,207 19,535 100.0
Table 5.2: Percent Distribution of Economically Active Population by Sex and District, Matabeleland South Province, Zimbabwe 2012 Census
District Male Female Total NumberBeitbridge Rural 43.0 57.0 100.0 34,995Bulilima 46.6 53.4 100.0 33,749Mangwe 52.7 47.3 100.0 20,885Gwanda Rural 50.4 49.6 100.0 45,142Insiza 53.3 46.7 100.0 41,766Matobo 51.1 48.9 100.0 35,482Umzingwane 55.9 44.1 100.0 26,857Gwanda 50.8 49.2 100.0 10,175Beitbridge 50.2 49.8 100.0 25,204Plumtree 56.1 43.9 100.0 4,914Total 50.3 49.7 100.0 279,169

Matabeleland South Province Chapter 5 Activity and Labour Force
76
Table 5.3: Percent Distribution of Economically Active Population by Age Group, Sex and Activity, Matabeleland South Province, Zimbabwe 2012 Census
(a) MalesAge Group
Paid employee Employer
Own account worker
Unpaid family worker
Looking for work/unemployed Total
15 - 19 10.4 4.0 8.1 48.4 37.8 16.120 - 24 18.2 4.4 11.7 23.9 27.0 16.925 - 29 18.0 10.1 13.4 9.8 13.8 14.730 - 34 14.3 11.1 12.8 5.4 8.0 12.135 - 39 10.8 13.9 10.6 3.0 5.0 9.340 - 44 8.6 15.3 8.2 2.1 3.0 7.245 - 49 6.2 7.1 5.9 1.5 1.8 5.150 - 54 5.1 9.7 6.6 1.3 1.4 5.055 - 59 3.7 8.3 6.3 1.2 1.1 4.360 - 64 2.1 6.0 5.1 1.1 0.4 3.265+ 2.6 10.1 11.2 2.3 0.5 6.1Total 100.0 100.0 100.0 100.0 100.0 100.0Number 47,667 504 62,312 12,218 17,825 140,526
(b) FemalesAge Group
Paid employee Employer
Own account worker
Unpaid family worker
Looking for work/unemployed Total
15 - 19 11.7 2.5 5.3 29.8 35.9 11.920 - 24 19.6 7.9 11.3 23.2 32.3 16.025 - 29 20.0 12.2 12.9 13.0 14.4 14.330 - 34 15.4 16.9 11.2 8.3 7.6 11.335 - 39 11.2 12.6 10.5 5.5 3.9 9.440 - 44 8.2 14.4 8.7 3.8 2.0 7.545 - 49 5.3 8.3 7.8 3.2 1.3 6.350 - 54 3.8 7.2 9.3 4.1 0.9 7.055 - 59 2.1 6.8 8.0 3.3 0.6 5.860 - 64 1.3 4.7 5.7 2.4 0.3 4.165+ 1.4 6.5 9.3 3.5 0.8 6.5Total 100.0 100.0 100.0 100.0 100.0 100.0Number 24,052 278 86,459 14,108 13,746 138,643
(c) TotalAge Group
Paid employee Employer
Own account worker
Unpaid family worker
Looking for work/unemployed Total
15 - 19 10.8 3.5 6.5 38.4 37.0 14.020 - 24 18.7 5.6 11.5 23.5 29.3 16.525 - 29 18.6 10.9 13.1 11.5 14.1 14.530 - 34 14.7 13.2 11.9 6.9 7.8 11.735 - 39 11.0 13.4 10.5 4.3 4.5 9.440 - 44 8.4 15.0 8.5 3.0 2.6 7.345 - 49 5.9 7.5 7.0 2.4 1.6 5.750 - 54 4.7 8.8 8.1 2.8 1.2 6.055 - 59 3.1 7.8 7.3 2.3 0.9 5.060 - 64 1.9 5.5 5.5 1.8 0.4 3.665+ 2.2 8.8 10.1 3.0 0.6 6.3

Matabeleland South Province Chapter 5 Activity and Labour Force
77
Total 100.0 100.0 100.0 100.0 100.0 100.0Number 71,719 782 148,771 26,326 31,571 279,169
Table 5.4: Age-Sex-Specific Activity Rates for Age 15+ Years Matabeleland South Province, Zimbabwe 2012 Census
Age Group Total Population Economically Active Activity Rate(a)Male15 - 19 42,508 22,663 53.320 - 24 26,640 23,762 89.225 - 29 21,826 20,658 94.630 - 34 17,784 16,941 95.335 - 39 13,748 13,105 95.340 - 44 10,625 10,080 94.945 - 49 7,661 7,163 93.550 - 54 7,768 7,003 90.255 - 59 6,983 6,072 87.060 - 64 5,561 4,441 79.965+ 16,303 8,638 53.0Total 177,407 140,526 79.2
(b)FemaleAge Group Total Population Economically Active Activity Rate15 - 19 38,585 16,546 42.920 - 24 30,181 22,186 73.525 - 29 25,554 19,812 77.530 - 34 19,802 15,645 79.035 - 39 16,127 13,083 81.140 - 44 12,793 10,329 80.745 - 49 10,800 8,716 80.750 - 54 12,405 9,665 77.955 - 59 10,505 8,000 76.260 - 64 8,179 5,666 69.365+ 24,123 8,995 37.3
Total 209,054 138,643 66.3(c)TotalAge Group Total Population Economically Active Activity Rate15 - 19 81,093 39,209 48.420 - 24 56,821 45,948 80.925 - 29 47,380 40,470 85.430 - 34 37,586 32,586 86.735 - 39 29,875 26,188 87.740 - 44 23,418 20,409 87.245 - 49 18,461 15,879 86.050 - 54 20,173 16,668 82.655 - 59 17,488 14,072 80.560 - 64 13,740 10,107 73.665+ 40,426 17,633 43.6Total 386,461 279,169 72.2

Matabeleland South Province Chapter 5 Activity and Labour Force
78
Table 5.5: Activity Rate by District for Age 15+ Years Matabeleland South Province, Zimbabwe 2012 Census
Age Group Total Population Economically Active Activity RateBeitbridge Rural 42,224 34,995 82.88Bulilima 49,125 33,749 68.70Mangwe 35,663 20,885 58.56Gwanda Rural 63,957 45,142 70.58Insiza 55,366 41,766 75.44Matobo 52,537 35,482 67.54Umzingwane 37,235 26,857 72.13Gwanda 13,756 10,175 73.97Beitbridge 29,087 25,204 86.65Plumtree 7,511 4,914 65.42Total 386,461 279,169 72.24
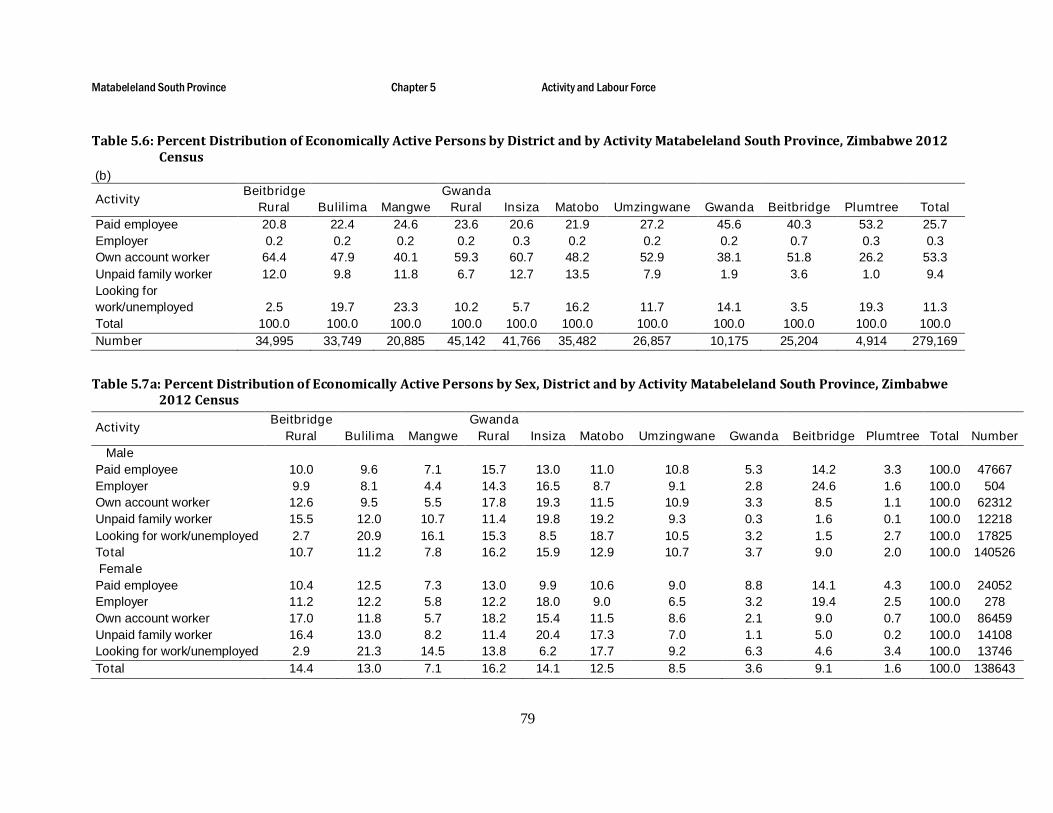
Matabeleland South Province Chapter 5 Activity and Labour Force
79
Table 5.6: Percent Distribution of Economically Active Persons by District and by Activity Matabeleland South Province, Zimbabwe 2012 Census
(b)
ActivityBeitbridge
Rural Bulilima MangweGwanda
Rural Insiza Matobo Umzingwane Gwanda Beitbridge Plumtree TotalPaid employee 20.8 22.4 24.6 23.6 20.6 21.9 27.2 45.6 40.3 53.2 25.7Employer 0.2 0.2 0.2 0.2 0.3 0.2 0.2 0.2 0.7 0.3 0.3Own account worker 64.4 47.9 40.1 59.3 60.7 48.2 52.9 38.1 51.8 26.2 53.3Unpaid family worker 12.0 9.8 11.8 6.7 12.7 13.5 7.9 1.9 3.6 1.0 9.4Looking for work/unemployed 2.5 19.7 23.3 10.2 5.7 16.2 11.7 14.1 3.5 19.3 11.3Total 100.0 100.0 100.0 100.0 100.0 100.0 100.0 100.0 100.0 100.0 100.0Number 34,995 33,749 20,885 45,142 41,766 35,482 26,857 10,175 25,204 4,914 279,169
Table 5.7a: Percent Distribution of Economically Active Persons by Sex, District and by Activity Matabeleland South Province, Zimbabwe 2012 Census
ActivityBeitbridge
Rural Bulilima MangweGwanda
Rural Insiza Matobo Umzingwane Gwanda Beitbridge Plumtree Total NumberMale
Paid employee 10.0 9.6 7.1 15.7 13.0 11.0 10.8 5.3 14.2 3.3 100.0 47667Employer 9.9 8.1 4.4 14.3 16.5 8.7 9.1 2.8 24.6 1.6 100.0 504Own account worker 12.6 9.5 5.5 17.8 19.3 11.5 10.9 3.3 8.5 1.1 100.0 62312Unpaid family worker 15.5 12.0 10.7 11.4 19.8 19.2 9.3 0.3 1.6 0.1 100.0 12218Looking for work/unemployed 2.7 20.9 16.1 15.3 8.5 18.7 10.5 3.2 1.5 2.7 100.0 17825Total 10.7 11.2 7.8 16.2 15.9 12.9 10.7 3.7 9.0 2.0 100.0 140526Female
Paid employee 10.4 12.5 7.3 13.0 9.9 10.6 9.0 8.8 14.1 4.3 100.0 24052Employer 11.2 12.2 5.8 12.2 18.0 9.0 6.5 3.2 19.4 2.5 100.0 278Own account worker 17.0 11.8 5.7 18.2 15.4 11.5 8.6 2.1 9.0 0.7 100.0 86459Unpaid family worker 16.4 13.0 8.2 11.4 20.4 17.3 7.0 1.1 5.0 0.2 100.0 14108Looking for work/unemployed 2.9 21.3 14.5 13.8 6.2 17.7 9.2 6.3 4.6 3.4 100.0 13746Total 14.4 13.0 7.1 16.2 14.1 12.5 8.5 3.6 9.1 1.6 100.0 138643

Matabeleland South Province Chapter 5 Activity and Labour Force
80
(b)Males
ActivityBeitbridge
Rural Bulilima MangweGwanda
Rural Insiza Matobo Umzingwane Gwanda Beitbridge Plumtree TotalPaid employee 31.63 28.97 30.86 32.96 27.90 28.89 34.32 48.55 53.49 57.17 33.92Employer 0.33 0.26 0.20 0.32 0.37 0.24 0.31 0.27 0.98 0.29 0.36Own account worker 52.28 37.79 31.12 48.63 54.06 39.53 45.33 39.28 41.87 24.43 44.34Unpaid family worker 12.59 9.32 11.82 6.14 10.86 12.93 7.56 0.79 1.59 0.62 8.69Looking for work/unemployed 3.17 23.65 26.00 11.95 6.81 18.40 12.48 11.10 2.07 17.50 12.68Total 100.00 100.00 100.00 100.00 100.00 100.00 100.00 100.00 100.00 100.00 100.00Number 15,058 15,735 11,013 22,749 22,278 18,122 15,004 5,170 12,642 2,755 140,526
(Females)
ActivityBeitbridge
Rural Bulilima MangweGwanda
Rural Insiza Matobo Umzingwane Gwanda Beitbridge Plumtree TotalPaid employee 12.6 16.6 17.7 14.0 12.2 14.6 18.3 42.5 27.1 48.1 17.3Employer 0.2 0.2 0.2 0.2 0.3 0.1 0.2 0.2 0.4 0.3 0.2Own account worker 73.6 56.7 50.2 70.2 68.3 57.2 62.5 36.9 61.8 28.5 62.4Unpaid family worker 11.6 10.2 11.7 7.2 14.8 14.0 8.4 3.1 5.6 1.4 10.2Looking for work/unemployed 2.0 16.3 20.3 8.5 4.4 14.0 10.7 17.2 5.0 21.6 9.9Total 100.0 100.0 100.0 100.0 100.0 100.0 100.0 100.0 100.0 100.0 100.0Number 19,937 18,014 9,872 22,393 19,488 17,360 11,853 5,005 12,562 2,159 138,643

Matabeleland South Province Chapter 5 Activity and Labour Force
81
Table 5.8: Percent Distribution of Economically Active Persons by District and by Age group, Matabeleland South Province, Zimbabwe 2012 Census
ActivityBeitbridge
Rural Bulilima MangweGwanda
Rural Insiza Matobo Umzingwane Gwanda Beitbridge Plumtree Total Number15 - 19 14.6 17.1 10.9 14.3 14.0 13.7 8.0 2.1 4.3 1.0 100.0 39,20920 - 24 12.5 12.0 8.0 14.6 14.4 12.5 9.0 4.0 10.9 2.1 100.0 45,94825 - 29 12.4 9.5 6.2 14.1 15.0 10.4 9.2 5.3 15.4 2.5 100.0 40,47030 - 34 11.2 9.4 6.2 14.3 15.9 10.6 9.5 5.4 14.9 2.5 100.0 32,58635 - 39 11.9 9.8 6.2 16.1 15.7 11.4 9.3 4.8 12.5 2.2 100.0 26,18840 - 44 11.5 10.6 6.6 17.8 15.0 12.5 9.7 4.5 9.6 2.2 100.0 20,40945 - 49 11.3 12.4 7.8 18.4 14.9 13.5 10.5 3.7 5.8 1.8 100.0 15,87950 - 54 13.4 13.4 7.3 18.4 15.1 14.5 11.0 2.3 3.3 1.2 100.0 16,66855 - 59 12.7 13.3 7.9 19.9 15.2 15.2 10.6 1.8 2.4 1.0 100.0 14,07260 - 64 13.7 13.3 7.1 20.1 15.4 15.6 11.2 1.3 1.7 0.5 100.0 10,10765+ 12.5 14.1 6.5 21.5 15.1 16.4 12.4 0.6 0.9 0.2 100.0 17,633Total 12.5 12.1 7.5 16.2 15.0 12.7 9.6 3.6 9.0 1.8 100.0 279,169

Matabeleland South Province Chapter 5 Activity and Labour Force
82
Table 5.9: Activity Rate by Age Group and District Matabeleland South Province, Zimbabwe 2012 Census
(a) Beitbridge RuralAge Group Total Population Economically Active Activity Rate15 - 19 9300 5711 61.4120 - 24 6146 5752 93.5925 - 29 5201 5022 96.5630 - 34 3759 3649 97.0735 - 39 3208 3117 97.1640 - 44 2437 2352 96.5145 - 49 1842 1787 97.0150 - 54 2374 2241 94.455 - 59 1905 1783 93.660 - 64 1638 1385 84.5565+ 4414 2196 49.75Total 42224 34995 82.88(b) BulilimaAge Group Total Population Economically Active Activity Rate15 - 19 12004 6687 55.7120 - 24 6758 5505 81.4625 - 29 4642 3856 83.0730 - 34 3622 3053 84.2935 - 39 3083 2576 83.5540 - 44 2643 2156 81.5745 - 49 2413 1975 81.8550 - 54 2801 2241 80.0155 - 59 2437 1872 76.8260 - 64 1974 1348 68.2965+ 6748 2480 36.75Total 49125 33749 68.7(c) MangweAge Group Total Population Economically Active Activity Rate15 - 19 8843 4273 48.3220 - 24 5071 3676 72.4925 - 29 3449 2499 72.4630 - 34 2840 2031 71.5135 - 39 2289 1636 71.4740 - 44 1931 1342 69.545 - 49 1724 1240 71.9350 - 54 1907 1221 64.0355 - 59 1796 1106 61.5860 - 64 1377 720 52.2965+ 4436 1141 25.72Total 35663 20885 58.56

Matabeleland South Province Chapter 5 Activity and Labour Force
83
(d) Gwanda RuralAge Group Total Population Economically Active Activity Rate15 - 19 13219 5614 42.4720 - 24 8508 6701 78.7625 - 29 6764 5695 84.230 - 34 5455 4663 85.4835 - 39 4826 4224 87.5340 - 44 4123 3638 88.2445 - 49 3350 2918 87.150 - 54 3675 3072 83.5955 - 59 3438 2795 81.360 - 64 2642 2036 77.0665+ 7957 3786 47.58Total 63957 45142 70.58
(e) InsizaAge Group Total Population Economically Active Activity Rate15 - 19 11308 5472 48.3920 - 24 8097 6639 81.9925 - 29 7069 6078 85.9830 - 34 5902 5174 87.6735 - 39 4581 4099 89.4840 - 44 3409 3068 90.0045 - 49 2617 2361 90.2250 - 54 2850 2515 88.2555 - 59 2444 2141 87.6060 - 64 1924 1558 80.9865+ 5165 2661 51.52Total 55366 41766 75.44
(f) MatoboAge Group Total Population Economically Active Activity Rate15 - 19 9300 5380 57.8520 - 24 6146 5734 93.3025 - 29 5201 4200 80.7530 - 34 3759 3470 92.3135 - 39 3208 2981 92.9240 - 44 2437 2553 104.7645 - 49 1842 2136 115.9650 - 54 2374 2418 101.8555 - 59 1905 2141 112.3960 - 64 1638 1579 96.4065+ 4414 2890 65.47Total 42224 35482 84.03

Matabeleland South Province Chapter 5 Activity and Labour Force
84
(g) UmzingwaneAge Group Total Population Economically Active Activity Rate15 - 19 7362 3150 42.7920 - 24 5370 4131 76.9325 - 29 4584 3740 81.5930 - 34 3713 3109 83.7335 - 39 2821 2442 86.5740 - 44 2270 1980 87.2245 - 49 1911 1672 87.4950 - 54 2119 1829 86.3155 - 59 1731 1489 86.0260 - 64 1417 1130 79.7565+ 3937 2185 55.5Total 37235 26857 72.13(h) GwandaAge Group Total Population Economically Active Activity Rate15 - 19 2411 814 33.7620 - 24 2565 1846 71.9725 - 29 2505 2129 84.9930 - 34 1982 1751 88.3535 - 39 1393 1269 91.140 - 44 996 911 91.4745 - 49 647 593 91.6550 - 54 444 377 84.9155 - 59 324 257 79.3260 - 64 187 128 68.4565+ 302 100 33.11Total 13756 10175 73.97
(i) BeitbridgeAge Group Total Population Economically Active Activity Rate15 - 19 3724 1697 45.5720 - 24 5798 5017 86.5325 - 29 6627 6251 94.3330 - 34 5059 4858 96.0335 - 39 3363 3273 97.3240 - 44 2019 1962 97.1845 - 49 939 915 97.4450 - 54 606 557 91.9155 - 59 409 344 84.1160 - 64 230 173 75.2265+ 313 157 50.16Total 29087 25204 86.65

Matabeleland South Province Chapter 5 Activity and Labour Force
85
Table 5.10: Percent Distribution of Persons by Employment Status and Sex Matabeleland South Province, Zimbabwe 2012 Census
(a)Employment Status Male Female Total NumberEmployed 49.56 50.44 100.00 247,598Unemployed 56.46 43.54 100.00 31,571Total 50.34 49.66 100.00 279,169
(b)Employment Status Male Female TotalEmployed 87.32 90.09 88.69Unemployed 12.68 9.91 11.31Total 100.00 100.00 100.00Number 140,526 138,643 279,169
Table 5.11: Percent Distribution of Persons with a Disability by Employment Status and Sex, Matabeleland South Province, Zimbabwe 2012 Census
(a)Employment Status Male Female Total NumberEmployed 46.64 53.36 100.00 18,112Unemployed 61.91 38.09 100.00 1,423Total 47.75 52.25 100.00 19,535
(b)
Employment Status Male Female TotalEmployed 90.56 94.69 92.72Unemployed 9.44 5.31 7.28Total 100.00 100.00 100.00Number 9,328 10,207 19,535
(j)PlumtreeAge Group Total Population Economically Active Activity Rate15 - 19 1352 411 30.420 - 24 1409 947 67.225 - 29 1319 1000 75.830 - 34 1027 828 80.635 - 39 701 571 81.540 - 44 527 447 84.845 - 49 349 282 80.850 - 54 285 197 69.155 - 59 231 144 62.360 - 64 102 50 49.065+ 209 37 17.7Total 7511 4914 65.4

Matabeleland South Province Chapter 5 Activity and Labour Force
86
Table 5.12: Unemployment by District, Matabeleland South Province, Zimbabwe 2012 Census
District Unemployed Persons Unemployment RateBeitbridge Rural 34,995 232.40Bulilima 33,749 214.48Mangwe 20,885 189.64Gwanda Rural 45,142 198.44Insiza 41,766 187.48Matobo 35,482 195.80Umzingwane 26,857 179.00Gwanda 10,175 196.81Beitbridge 25,204 199.37Plumtree 4,914 178.37Total 279,169 198.66
Table 5.13: Percent Distribution of Children (10 - 14 years) by Employment Status and Sex, Matabeleland South Province, Zimbabwe 2012 Census
(a)Employment Status Male Female Total NumberPaid employee 59.2 40.8 100.0 627Employer 75.0 25.0 100.0 4Own account worker 63.1 36.9 100.0 765Unpaid family worker 62.8 37.2 100.0 2,458Looking for work/unemployed 60.8 39.2 100.0 1,453Total 61.9 38.1 100.0 5,307
(b)Employment Status Male Female TotalPaid employee 11.3 12.6 11.8Employer 0.1 * 0.1Own account worker 14.7 13.9 14.4Unpaid family worker 47.0 45.2 46.3Looking for work/unemployed 26.9 28.2 27.4Total 100.0 100.0 100.0Number 3,283 2,024 5,307
Table 5.14: Percent Distribution of Economically Inactive Population by Various Activities, Matabeleland South Province, Zimbabwe 2012 Census
(a)Activity Male Female Total NumberStudent 49.0 51.0 100.0 38,124Homemaker 13.4 86.6 100.0 37,328Retired/sick/too old 39.5 60.5 100.0 27,298Other 58.8 41.2 100.0 2,943Total 34.2 65.8 100.0 105,693
(b)Activity Male Female TotalStudent 51.6 28.0 36.1Homemaker 13.8 46.5 35.3Retired/sick/too old 29.8 23.8 25.8Other 4.8 1.7 2.8

Matabeleland South Province Chapter 5 Activity and Labour Force
87
Total 100.0 100.0 100.0Number 36,191 69,502 105,693
(c)Activity Male Female Total NumberStudent 53.4 46.6 100.0 969Homemaker 17.0 83.0 100.0 3,268Retired/sick/too old 39.5 60.5 100.0 12,648Other 53.4 46.6 100.0 530Total 36.4 63.6 100.0 17,415
Table 5.15: Percent Distribution of Economically Inactive Population by Sex and Age, Matabeleland South Province, Zimbabwe 2012 Census
(a) Males Age Group Student Homemaker Retired/ sick/too old Other Total15 - 19 90.8 38.1 1.6 30.8 54.020 - 24 7.3 18.4 1.5 17.2 7.625 - 29 1.0 8.3 2.3 13.9 3.030 - 34 0.4 6.5 2.1 10.6 2.235 - 39 0.2 4.8 2.2 5.9 1.740 - 44 0.1 3.4 2.2 4.8 1.445 - 49 0.1 3.0 2.3 4.3 1.350 - 54 0.1 3.6 4.6 3.7 2.155 - 59 * 3.7 6.1 3.3 2.560 - 64 * 3.0 8.5 2.3 3.165 - 69 * 2.3 10.7 1.0 3.670 - 74 * 1.9 14.9 1.1 4.875 + * 2.9 41.1 1.1 12.7Total 100.0 100.0 100.0 100.0 100.0Number 18,667 5,006 10,788 1,730 36,191
(b) Females Age Group Student Homemaker Retired/ sick/ too old Other Total15 - 19 89.8 11.9 1.0 26.3 31.420 - 24 7.5 18.3 1.1 22.1 11.325 - 29 1.4 15.4 1.5 10.7 8.130 - 34 0.6 11.4 1.3 7.9 5.935 - 39 0.2 8.4 1.2 5.9 4.340 - 44 0.1 6.7 1.2 4.5 3.545 - 49 * 5.7 1.1 3.2 3.050 - 54 0.1 6.6 3.0 4.3 3.955 - 59 * 5.6 3.8 3.4 3.660 - 64 0.1 3.7 7.6 2.7 3.665 - 69 * 2.9 10.1 2.8 3.870 - 74 * 1.7 15.8 1.6 4.675 + 0.1 1.8 51.6 4.5 13.2Total 100.0 100.0 100.0 100.0 100.0Number 19,457 32,322 16,510 1,213 69,502

Matabeleland South Province Chapter 5 Activity and Labour Force
88
(c) TotalAge Group Student Homemaker Retired/ sick/too old Other Total15 - 19 90.3 15.4 1.2 28.9 39.120 - 24 7.4 18.3 1.2 19.2 10.025 - 29 1.2 14.5 1.8 12.6 6.430 - 34 0.5 10.7 1.6 9.5 4.635 - 39 0.2 7.9 1.6 5.9 3.440 - 44 0.1 6.3 1.6 4.7 2.845 - 49 * 5.3 1.6 3.9 2.450 - 54 0.1 6.2 3.7 3.9 3.355 - 59 * 5.3 4.7 3.3 3.260 - 64 * 3.6 7.9 2.5 3.465 - 69 * 2.8 10.3 1.8 3.770 - 74 * 1.7 15.4 1.3 4.675 + 0.1 2.0 47.4 2.5 13.0Total 100.0 100.0 100.0 100.0 100.0Number 38,124 37,328 27,298 2,943 105,693
Table 5.16: Percent Distribution of Economically Inactive Population by Urban/Rural and by Activity, Matabeleland South Province, Zimbabwe 2012 Census
(a) Activity Urban Rural Total NumberStudent 14.6 85.4 100.0 38,107Homemaker 10.7 89.3 100.0 37,328Retired/sick/too old 3.5 96.5 100.0 27,271Other 17.1 82.9 100.0 2,943Total 10.4 89.6 100.0 105,649
(b) Activity Urban Rural TotalStudent 50.6 34.4 36.1Homemaker 36.2 35.2 35.3Retired/sick/too old 8.7 27.8 25.8Other 4.6 2.6 2.8Total 100.0 100.0 100.0Number 11,016 94,633 105,649

Matabeleland South Province Chapter 5 Activity and Labour Force
89
Table 5.17: Percent Distribution of Economically Inactive Population by Sex, Age Group and District, Matabeleland South Province, Zimbabwe 2012 Census
Age Group Beitbridge Rural Bulilima Mangwe Gwanda Rural Insiza Matobo Umzingwane Gwanda Beitbridge Plumtree Total NumberMales
15 - 19 8.5 12.7 10.9 18.2 13.9 14.7 10.1 3.8 4.9 2.3 100.0 4136820 - 24 3.4 11.4 12.8 16.6 13.5 12.4 11.6 6.7 7.2 4.3 100.0 1057325 - 29 2.5 11.3 13.8 15.6 14.3 14.7 12.4 5.5 5.4 4.7 100.0 672630 - 34 2.2 11.5 16.3 15.8 14.5 15.0 12.1 4.7 3.9 4.0 100.0 488435 - 39 2.4 13.8 17.7 16.3 13.1 17.0 10.3 3.3 2.4 3.6 100.0 362940 - 44 2.6 16.3 19.8 16.3 11.1 17.1 9.7 2.8 1.7 2.7 100.0 295345 - 49 2.1 17.1 18.9 16.8 9.7 20.5 9.3 2.1 0.9 2.6 100.0 255150 - 54 3.7 16.2 19.6 17.3 9.4 19.9 8.2 1.9 1.3 2.5 100.0 344855 - 59 3.5 16.6 20.3 18.7 8.8 18.6 7.0 2.0 1.8 2.6 100.0 337060 - 64 6.9 17.3 18.1 16.7 10.2 18.3 7.9 1.6 1.5 1.4 100.0 359365+ 9.8 18.7 14.5 18.3 11.0 17.8 7.7 0.9 0.7 0.8 100.0 22598Total 6.7 14.3 13.8 17.6 12.7 15.8 9.7 3.3 3.6 2.4 100.0 105693
Females15 - 19 8.5 12.7 10.9 18.2 13.9 14.7 10.1 3.8 4.9 2.3 100.0 4136820 - 24 3.4 11.4 12.8 16.6 13.5 12.4 11.6 6.7 7.2 4.3 100.0 1057325 - 29 2.5 11.3 13.8 15.6 14.3 14.7 12.4 5.5 5.4 4.7 100.0 672630 - 34 2.2 11.5 16.3 15.8 14.5 15.0 12.1 4.7 3.9 4.0 100.0 488435 - 39 2.4 13.8 17.7 16.3 13.1 17.0 10.3 3.3 2.4 3.6 100.0 362940 - 44 2.6 16.3 19.8 16.3 11.1 17.1 9.7 2.8 1.7 2.7 100.0 295345 - 49 2.1 17.1 18.9 16.8 9.7 20.5 9.3 2.1 0.9 2.6 100.0 255150 - 54 3.7 16.2 19.6 17.3 9.4 19.9 8.2 1.9 1.3 2.5 100.0 344855 - 59 3.5 16.6 20.3 18.7 8.8 18.6 7.0 2.0 1.8 2.6 100.0 337060 - 64 6.9 17.3 18.1 16.7 10.2 18.3 7.9 1.6 1.5 1.4 100.0 359365+ 9.8 18.7 14.5 18.3 11.0 17.8 7.7 0.9 0.7 0.8 100.0 22598Total 6.7 14.3 13.8 17.6 12.7 15.8 9.7 3.3 3.6 2.4 100.0 105693

Matabeleland South Province Chapter 5 Activity and Labour Force
90
TotalAge Group Beitbridge Rural Bulilima Mangwe Gwanda Rural Insiza Matobo Umzingwane Gwanda Beitbridge Plumtree Total Number15 - 19 8.5 12.7 10.9 18.2 13.9 14.7 10.1 3.8 4.9 2.3 100.0 4136820 - 24 3.4 11.4 12.8 16.6 13.5 12.4 11.6 6.7 7.2 4.3 100.0 1057325 - 29 2.5 11.3 13.8 15.6 14.3 14.7 12.4 5.5 5.4 4.7 100.0 672630 - 34 2.2 11.5 16.3 15.8 14.5 15.0 12.1 4.7 3.9 4.0 100.0 488435 - 39 2.4 13.8 17.7 16.3 13.1 17.0 10.3 3.3 2.4 3.6 100.0 362940 - 44 2.6 16.3 19.8 16.3 11.1 17.1 9.7 2.8 1.7 2.7 100.0 295345 - 49 2.1 17.1 18.9 16.8 9.7 20.5 9.3 2.1 0.9 2.6 100.0 255150 - 54 3.7 16.2 19.6 17.3 9.4 19.9 8.2 1.9 1.3 2.5 100.0 344855 - 59 3.5 16.6 20.3 18.7 8.8 18.6 7.0 2.0 1.8 2.6 100.0 337060 - 64 6.9 17.3 18.1 16.7 10.2 18.3 7.9 1.6 1.5 1.4 100.0 359365+ 9.8 18.7 14.5 18.3 11.0 17.8 7.7 0.9 0.7 0.8 100.0 22598Total 6.7 14.3 13.8 17.6 12.7 15.8 9.7 3.3 3.6 2.4 100.0 105693
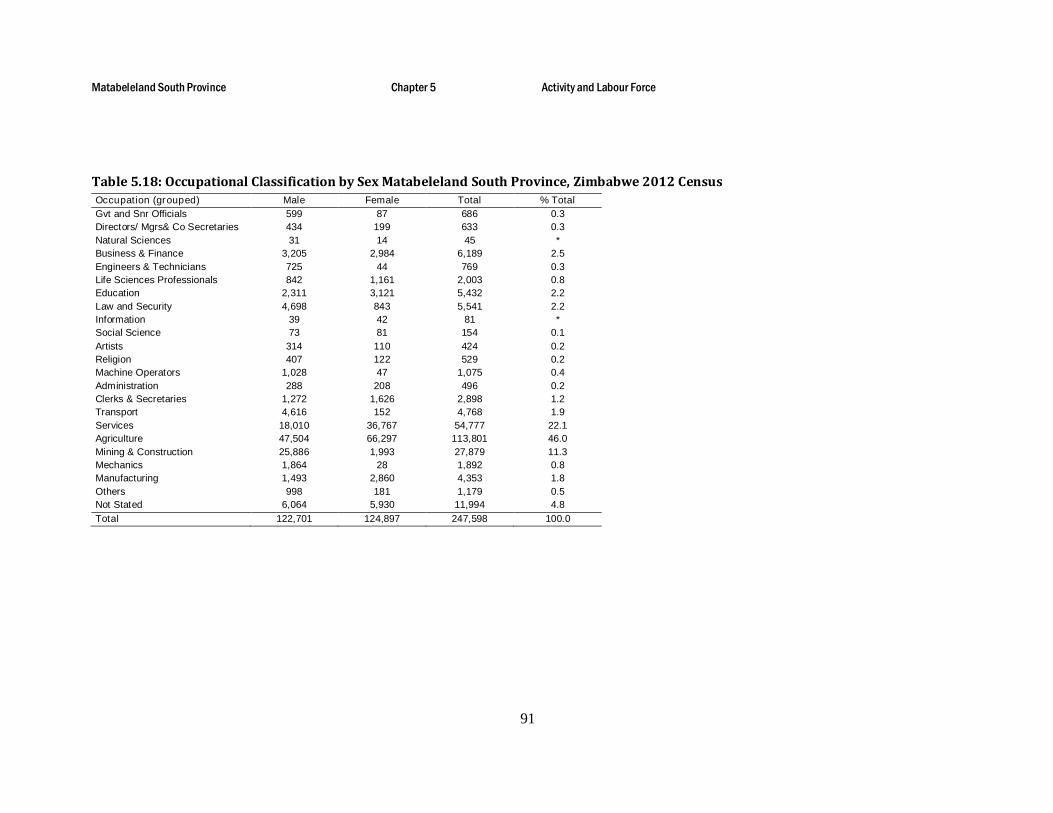
Matabeleland South Province Chapter 5 Activity and Labour Force
91
Table 5.18: Occupational Classification by Sex Matabeleland South Province, Zimbabwe 2012 CensusOccupation (grouped) Male Female Total % TotalGvt and Snr Officials 599 87 686 0.3Directors/ Mgrs& Co Secretaries 434 199 633 0.3Natural Sciences 31 14 45 *Business & Finance 3,205 2,984 6,189 2.5Engineers & Technicians 725 44 769 0.3Life Sciences Professionals 842 1,161 2,003 0.8Education 2,311 3,121 5,432 2.2Law and Security 4,698 843 5,541 2.2Information 39 42 81 *Social Science 73 81 154 0.1Artists 314 110 424 0.2Religion 407 122 529 0.2Machine Operators 1,028 47 1,075 0.4Administration 288 208 496 0.2Clerks & Secretaries 1,272 1,626 2,898 1.2Transport 4,616 152 4,768 1.9Services 18,010 36,767 54,777 22.1Agriculture 47,504 66,297 113,801 46.0Mining & Construction 25,886 1,993 27,879 11.3Mechanics 1,864 28 1,892 0.8Manufacturing 1,493 2,860 4,353 1.8Others 998 181 1,179 0.5Not Stated 6,064 5,930 11,994 4.8Total 122,701 124,897 247,598 100.0

Matabeleland South Province Chapter 5 Activity and Labour Force
92
Table 5.19: Occupational Classification by District Matabeleland South Province, Zimbabwe 2012 CensusOccupation Beitbridge Rural Bulilima Mangwe Gwanda Rural Insiza Matobo Umzingwane Gwanda Beitbridge Plumtree TotalGvt and Snr Officials 0.5 0.3 0.3 0.2 0.3 0.3 0.2 0.2 0.1 0.3 0.3Directors/ Mgrs& Co Secretaries 0.1 0.1 0.1 0.1 0.2 0.2 0.2 1.1 0.8 0.8 0.3Natural Sciences * - * * * * * 0.1 * * *Business & Finance 0.8 1.4 1.6 1.7 1.4 1.4 1.4 6.8 9.9 7.7 2.5Engineers & Technicians 0.1 0.1 0.1 0.4 0.1 0.3 0.4 1.1 0.7 1.1 0.3Life Sciences Professionals 0.6 0.7 0.7 0.7 0.7 0.8 0.7 2.7 0.9 3.2 0.8Education 1.2 3.1 1.9 2.4 1.5 1.7 2.1 6.6 2.2 5.1 2.2Law and Security 1.1 0.7 1.2 1.5 1.5 2.2 1.9 8.7 5.4 10.7 2.2Information * 0.1 * * * * * 0.3 * 0.1 *Social Science * * * * * * 0.1 0.5 0.2 0.4 0.1Artists * 0.1 0.1 0.2 0.1 0.1 0.2 0.4 0.6 0.4 0.2Religion 0.2 0.2 0.1 0.2 0.1 0.2 0.2 0.6 0.4 0.6 0.2Machine Operators 0.3 0.1 0.1 1.0 0.4 0.2 0.7 0.6 0.4 0.4 0.4Administration 0.1 0.1 0.1 0.2 0.1 0.1 0.2 1.0 0.4 1.3 0.2Clerks & Secretaries 0.6 0.6 0.6 0.7 0.6 0.6 1.0 4.8 3.6 5.4 1.2Transport 1.2 0.5 0.9 1.1 0.7 0.8 1.3 3.0 9.5 5.9 1.9Services 24.4 19.9 22.5 19.4 14.7 12.4 16.8 31.4 49.7 32.5 22.1Agriculture 59.4 58.0 47.5 47.6 51.3 61.6 48.3 2.5 2.5 2.8 46.0Mining & Construction 3.3 6.4 10.4 15.2 20.0 8.1 16.5 17.0 4.6 9.7 11.3Mechanics 0.4 0.2 0.3 0.9 0.5 0.4 0.8 1.9 2.1 2.6 0.8Manufacturing 2.9 1.7 1.7 1.8 1.0 1.5 1.6 2.2 1.4 2.5 1.8Others 0.2 0.2 0.4 0.3 0.2 0.7 1.4 0.6 0.4 2.1 0.5Not Stated 2.6 5.5 9.2 4.5 4.6 6.3 4.0 5.8 4.2 4.5 4.8Total 100.0 100.0 100.0 100.0 100.0 100.0 100.0 100.0 100.0 100.0 100.0Number 34,113 27,094 16,022 40,528 39,395 29,718 23,713 8,738 24,312 3,965 247,598

Matabeleland South Province Chapter 5 Activity and Labour Force
93
Table 5.20: Proportion of Communal Farmers among Employed Persons by District, Matabeleland South Province, Zimbabwe 2012 Census
District Employed Persons Communal FarmerBeitbridge Rural 71.1 28.9Bulilima 78.0 22.0Mangwe 84.8 15.2Gwanda Rural 79.3 20.7Insiza 76.2 23.8Matobo 75.8 24.2Umzingwane 78.4 21.6Gwanda 99.3 0.7Beitbridge 98.6 1.4Plumtree 99.5 0.5Total 79.6 20.4
Table 5.21: Persons with a Disability by Occupational Classification and Sex, MatabelelandSouth Province, Zimbabwe 2012 Census
Occupation Male Female Total % TotalGvt and Snr Officials 117 11 128 0.7Directors/ Mgrs& Co Secretaries 20 2 22 0.1Natural Sciences 1 - 1 *Business & Finance 132 119 251 1.4Engineers & Technicians 27 - 27 0.1Life Sciences Professionals 75 66 141 0.8Education 119 140 259 1.4Law and Security 157 17 174 1.0Information 1 1 2 *Social Science 5 6 11 0.1Artists 13 7 20 0.1Religion 28 12 40 0.2Machine Operators 43 2 45 0.2Administration 19 8 27 0.1Clerks & Secretaries 58 46 104 0.6Transport 143 7 150 0.8Services 1,056 1,734 2,790 15.4Agriculture 4,720 6,459 11,179 61.7Mining & Construction 1,042 98 1,140 6.3Mechanics 57 1 58 0.3Manufacturing 169 495 664 3.7Others 40 21 61 0.3Not Stated 405 413 818 4.5Total 8,447 9,665 18,112 100.0

Matabeleland SouthProvince Chapter 6 Fertility
94
Chapter 6:
Fertility
Introduction
Fertility is one of the three components of population change, the others being mortality and migration. the measurement of fertility can be approached in two ways. The first is to view fertility as a period event, while the second would view it as a cohort event. There is a clear distinction between these two approaches, conceptually and in terms of data required to fulfil the measurements. This chapter is concerned with the measurement of period fertility as it is the most commonly used approach in studies of population. Period fertility measures the level of fertility during a specified period of time, usually, a year.
Indicators of fertility are based on either registered or reported births in a specified period of time and the population relating to the same time period. In Zimbabwe, the registration system is not complete, and therefore information on registered births is deficient. Similarly, births are usually under-reported in surveys and censuses, partly because respondents make mistakes about the reference period. The vague expression "during the last 12 months" might not be interpreted properly as exactly 12 months prior to the date of interview. However, estimates of fertility based on the births in the last 12 months provide the true pattern, but may underestimate the level of fertility. On the other hand, estimates based on the
average number of children ever born to women provide lifetime fertility levels without a time reference. Estimates on fertility have been made using direct methods.
Information on live births in the last 12 months was obtained from all women age 15 to 49 years, irrespective of their marital status. Based on this information on births in the last 12 months and the total population, the crude birth rate was calculated. The information on children ever born referred only to the woman's biological children. To avoid bias from misreporting, this information was collected in three parts: those children currently living with the mother, those living elsewhere, and those who had died. Four measures of fertility will be discussed in this chapter. These will be in order of their complexity, i.e. in terms of the data required to calculate them. The four measures are Crude Birth Rate (CBR); General Fertility Rate (GFR); Age-Specific Fertility Rate (ASFR) and Total Fertility Rate (TFR). The reference period for these estimates was September, 2011 to August, 2012.
Crude Birth Rates (CBR)
This refers to the number of births per 1000 population in a given period which is usually a year. It is obtained by dividing the number of births occurring in the year by the total population, multiplied by 1000. The CBR for Matabeleland South Province, estimated using the direct method, was 26.8births per one thousand population, see Table 6.1.

Matabeleland SouthProvince Chapter 6 Fertility
95
Fertility levels at provincial level mask some important spatial, and at times, temporal variations in fertility within the province itself or among districts. The level of fertility displayed at the provincial level is not uniform at lower levels as is indicated in
Table 6. 1. The CBRs ranged from 23.7for Bulilimato 37.2for Beitbridge urban.
The crude birth rate is affected by the sex and age structure of the population. For example, it isnot every member of the population who is at the risk of child bearing. As a result, direct comparisons between populations with different sex-age structures can lead to wrong conclusions. Therefore, to overcome this limitation of lack of comparability, it is necessary to look beyond the crude measures of fertility to more specific measures.
General Fertility Rate (GFR)
The General Fertility Rate (GFR) is the simplest fertility measure that tries to relate the births to the population which is at risk of giving birth. It is defined as the number of births in a year per 1 000 women in childbearing ages, usually 15 to 49 years. As shown in Table 6.1, the GFR for Matabeleland South Province was 119 births per 1000 women of reproductive ages. The GFR fell between 105 for Plumtreeand 138 for Beitbridge Rural
This measure also has its limitations because the control for the age structure is only partial as there may be substantial
differences in the age structure between populations within the reproductive age ranges.
Age-Specific Fertility Rate (ASFR)
Age-Specific Fertility Rate (ASFR) is the
average number of live births in the last 12 months per woman in the 5 year age groups in the reproductive age range 15 to 49 years. It is obtained by dividing the number of births to women in a particular age group by the total number of women in the same age group. It provides the age pattern of fertility for the women in their child bearing ages. As shown in Figure 6.1 and Appendix Table A6.1, childbearing peaks in the age groups20-24 and 25-29 years. The last reproductive age group (45-49 years) exhibited the least contribution as expected because there were relatively fewer births at the extreme ends of the reproductive age ranges.
Appendix Tables A6.2 to A6.5show the ASFRs by age-group for each of the 10 districts in the province. The ASFRs peak at the 20-24 years age groups in the four districts. This is an indication that women were having their children at relatively young ages. Although the ASFRs provide the best indicators of fertility, they are difficult to comprehend as they have to be presented in a set of seven, i.e. one for each age group, from 15-19 to 45-49 years. Comparisons of ASFRs between or among population groups are even more difficult to make. Therefore, a single indicator summarising the fertility experience for a

Matabeleland SouthProvince Chapter 6 Fertility
96
particular population is necessary. The total fertility rate is the most appropriate indicator.
Total Fertility Rate (TFR)
The Total Fertility Rate (TFR) represents the
average number of children a group of women would have by the end of their reproductive years if they had children according to a set of age specific fertility rates pertaining to a particular period. The rate is totally free of age and sex biases and therefore of great use in comparative analysis. The rate has a major limitation in that it assumes that women of different age groups undergo similar fertility experiences throughout their reproductive periods. The TFR for the province was about 3.6. From Table 6. 1, it can be observed that BeitbridgeUrban had a TFR of 2.9 while Insizahad a TFR of 4.0. Among the districts these TFRs were the lowest and highest respectively.
Fertility Differentials
Estimates of fertility by the level of education of mothers and by marital status are shown in Tables 6.2 and 6.3.
Figure 6.2shows that there seemed to be a negative relationship between fertility and education level of mothers. The level of fertility declined with increasing level of education. The TFR ranged from 4.0 to 3.5 children per woman for women with primary education and those with at least
secondary education respectively. The number of women with no education is so small that it does not allow for meaningful interpretation. It has been shown in many studies that education in women gives them,
among other things, a new vision and normative orientation which will result in better health care, better employment opportunities outside the home and better knowledge of and access to familyplanning methods. These, in turn, may produce a depressing effect on fertility.With regard to marital status, the married women category had the highest TFR of 5.3children per woman. It should be noted that the TFR for the married category is high and needs further analysis. The never married group experienced the lowest total fertility of 2.7 children per woman. Figure 6.3illustrates the different TFRs diagrammatically. The higher TFR among the married women may be attributed to them being at a higher risk of giving birth than women in the other categories.
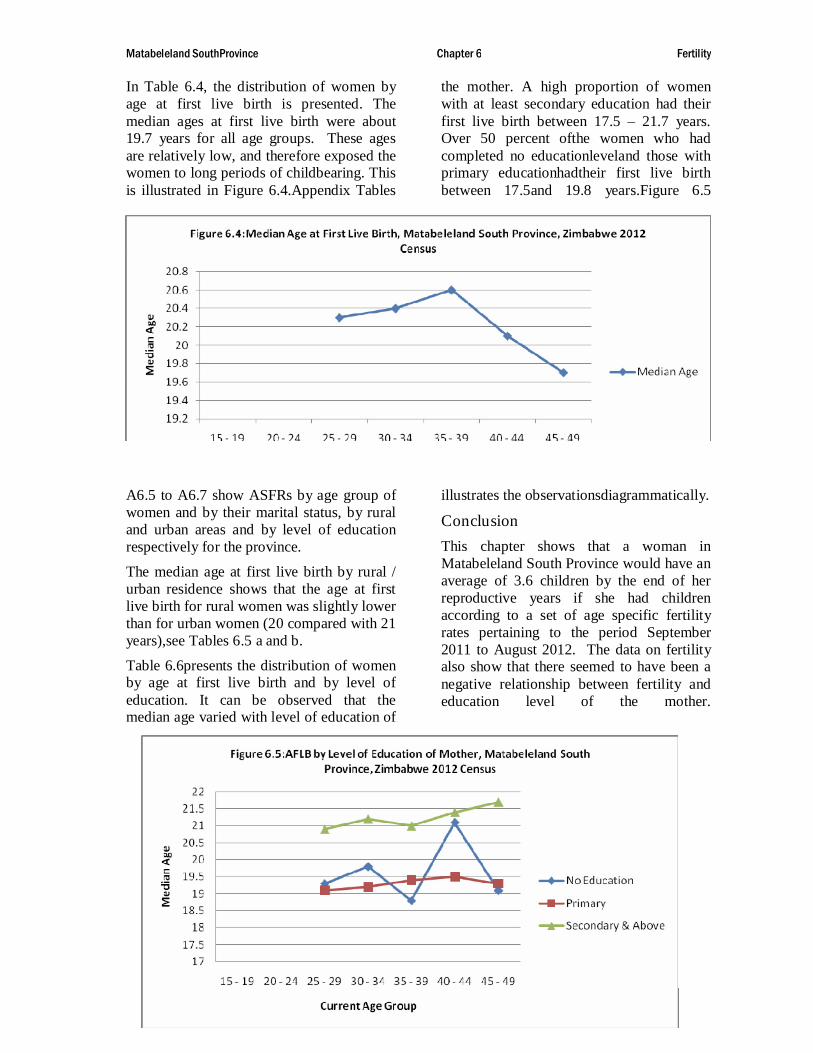
Matabeleland SouthProvince Chapter 6 Fertility
97
In Table 6.4, the distribution of women by age at first live birth is presented. The median ages at first live birth were about 19.7 years for all age groups. These ages are relatively low, and therefore exposed the women to long periods of childbearing. This is illustrated in Figure 6.4.Appendix Tables
A6.5 to A6.7 show ASFRs by age group of women and by their marital status, by rural and urban areas and by level of education respectively for the province.
The median age at first live birth by rural / urban residence shows that the age at first live birth for rural women was slightly lower than for urban women (20 compared with 21 years),see Tables 6.5 a and b.
Table 6.6presents the distribution of women by age at first live birth and by level of education. It can be observed that the median age varied with level of education of
the mother. A high proportion of women with at least secondary education had their first live birth between 17.5 –21.7 years. Over 50 percent ofthe women who had completed no educationleveland those with primary educationhadtheir first live birth between 17.5and 19.8 years.Figure 6.5
illustrates the observationsdiagrammatically.
Conclusion
This chapter shows that a woman in Matabeleland South Province would have an average of 3.6 children by the end of her reproductive years if she had children according to a set of age specific fertility rates pertaining to the period September 2011 to August 2012. The data on fertility also show that there seemed to have been a negative relationship between fertility and education level of the mother.
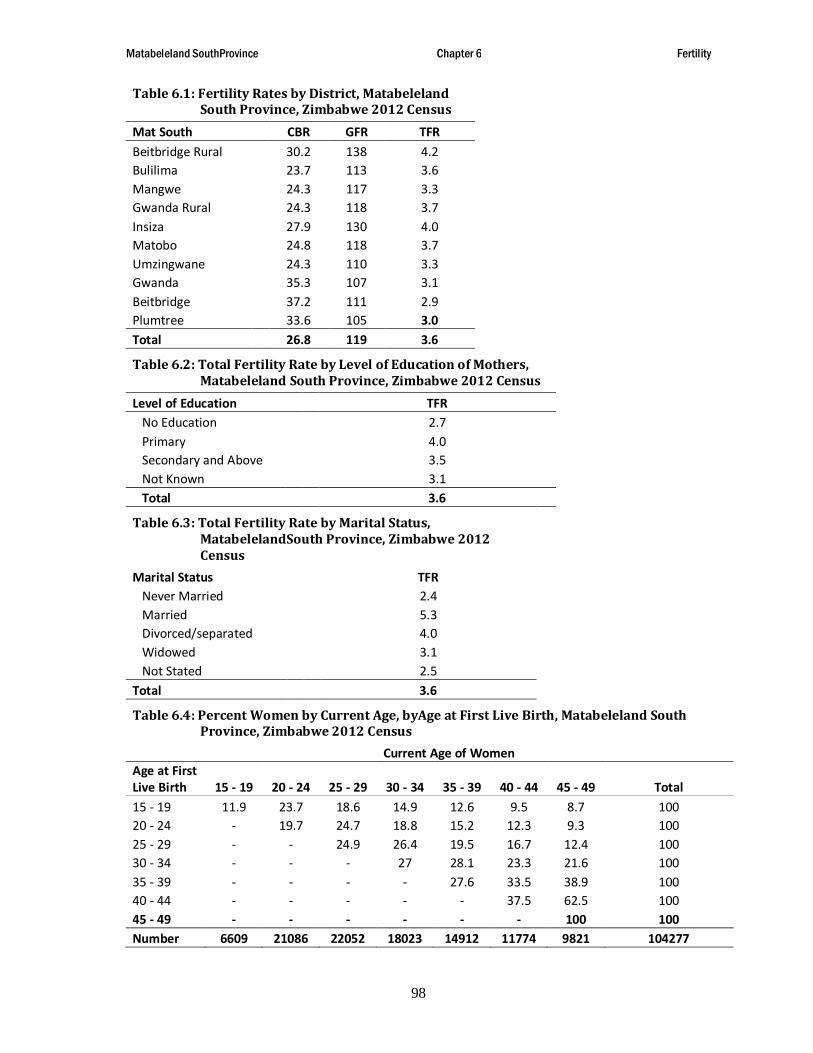
Matabeleland SouthProvince Chapter 6 Fertility
98
Table 6.1: Fertility Rates by District, MatabelelandSouth Province, Zimbabwe 2012 Census
Mat South CBR GFR TFRBeitbridge Rural 30.2 138 4.2Bulilima 23.7 113 3.6Mangwe 24.3 117 3.3Gwanda Rural 24.3 118 3.7Insiza 27.9 130 4.0Matobo 24.8 118 3.7Umzingwane 24.3 110 3.3Gwanda 35.3 107 3.1Beitbridge 37.2 111 2.9Plumtree 33.6 105 3.0Total 26.8 119 3.6
Table 6.2: Total Fertility Rate by Level of Education of Mothers, Matabeleland South Province, Zimbabwe 2012 Census
Level of Education TFRNo Education 2.7Primary 4.0Secondary and Above 3.5Not Known 3.1Total 3.6
Table 6.3: Total Fertility Rate by Marital Status, MatabelelandSouth Province, Zimbabwe 2012 Census
Marital Status TFRNever Married 2.4Married 5.3Divorced/separated 4.0Widowed 3.1Not Stated 2.5
Total 3.6
Table 6.4: Percent Women by Current Age, byAge at First Live Birth, Matabeleland South Province, Zimbabwe 2012 Census
Current Age of WomenAge at First Live Birth 15 - 19 20 - 24 25 - 29 30 - 34 35 - 39 40 - 44 45 - 49 Total15 - 19 11.9 23.7 18.6 14.9 12.6 9.5 8.7 10020 - 24 - 19.7 24.7 18.8 15.2 12.3 9.3 10025 - 29 - - 24.9 26.4 19.5 16.7 12.4 10030 - 34 - - - 27 28.1 23.3 21.6 10035 - 39 - - - - 27.6 33.5 38.9 10040 - 44 - - - - - 37.5 62.5 10045 - 49 - - - - - - 100 100Number 6609 21086 22052 18023 14912 11774 9821 104277

Matabeleland SouthProvince Chapter 6 Fertility
99
Median 17.5 19 20.3 20.5 20.4 20.6 20.1 19.7
Table 6.5: Percent of Women by Current Age, by Age at First Live Birth for Urban and Rural, Matabeleland South Province, Zimbabwe 2012 Census
(a) RuralCurrent Age of Women
Age at First Live Birth 15 - 19 20 - 24 25 - 29 30 - 34 35 - 39 40 - 44 45 - 49 Total15 - 19 12.4 23.3 17.8 14.6 12.8 9.9 9.3 10020 - 24 - 19.5 23.1 18.1 15.6 13.1 10.6 10025 - 29 - - 22.5 24.9 20.4 17.8 14.4 10030 - 34 - - - 24.1 26.5 24.2 25.2 10035 - 39 - - - - 25.7 31.7 42.6 10040 - 44 - - - - - 33.3 66.7 10045 - 49 - - - - - - 100 100Number 5961 17426 17137 14311 12473 10179 8906 86393Median 17.5 18.9 20 20.1 20.1 20.4 20 19.5
(b) UrbanCurrent Age of Women
Age at First Live Birth 15 - 19 20 - 24 25 - 29 30 - 34 35 - 39 40 - 44 45 - 49 Total15 - 19 8.7 26.4 23.9 17.2 11.7 7.1 5 10020 - 24 - 20.7 30.9 21.2 13.9 8.9 4.5 10025 - 29 - - 31.4 30.6 17.2 13.6 7.3 10030 - 34 - - - 36.7 33.2 20.3 9.8 10035 - 39 - - - - 36.8 42.1 21.1 10040 - 44 - - - - - 60 40 10045 - 49 - - - - - - - -Number 647 3650 4907 3703 2432 1592 912 17843Median 17.5 19.6 21.3 21.6 21.5 21.8 21.2 20.9
Table 6.6: Percent of Women by Current Age, by Age at First Live Birth by Level of Education, Matabeleland South Province, Zimbabwe 2012 Census
(a) No EducationCurrent Age of Women
Age at First Live Birth 15 - 19 20 - 24 25 - 29 30 - 34 35 - 39 40 - 44 45 - 49 Total15 - 19 4.8 12 16.2 9 12 10.2 35.9 10020 - 24 - 10 16.3 8.8 8.8 20 36.3 10025 - 29 - - 20 23.3 10 16.7 30 10030 - 34 - - - - - 75 25 10035 - 39 - - - - - - - -40 - 44 - - - - - - - -45 - 49 - - - - - - - -Number 8 28 46 29 30 41 99 281Median 17.5 18.5 19.3 19.8 18.8 21.1 19.1 19.2

Matabeleland SouthProvince Chapter 6 Fertility
100
(b) PrimaryCurrent Age of Women
Age at First Live Birth 15 - 19 20 - 24 25 - 29 30 - 34 35 - 39 40 - 44 45 - 49 Total15 - 19 11.1 19.1 17.4 15.1 13.6 11.2 12.6 10020 - 24 - 16 20.4 17.5 16.8 14.4 14.9 10025 - 29 - - 19.4 22.2 22.4 19.1 16.8 10030 - 34 - - - 22.8 22.8 23.5 30.9 10035 - 39 - - - - 23.9 29.9 46.3 10040 - 44 - - - - - 16.7 83.3 10045 - 49 - - - - - - 100 100Number 2607 6306 6721 5969 5558 4674 5063 36898Median 17.5 18.5 19.1 19.2 19.4 19.5 19.3 18.9
(c) Secondary and aboveCurrent Age of Women
Age at First Live Birth 15 - 19 20 - 24 25 - 29 30 - 34 35 - 39 40 - 44 45 - 49 Total15 - 19 12.8 27.9 20 15 12 8.1 4.2 10020 - 24 - 21.6 26.9 19.5 14.7 11.2 6.1 10025 - 29 - - 27.1 28.1 18.7 15.9 10.2 10030 - 34 - - - 30.3 31.8 22.8 15.1 10035 - 39 - - - - 31 35.2 33.8 10040 - 44 - - - - - 52.6 47.4 10045 - 49 - - - - - - - -Number 3921 14549 15051 11768 9055 6659 3701 64704Median 17.5 19.2 20.9 21.2 21 21.4 21.7 20.3

MatabelelandSouthProvince Chapter 7 Mortality and Orphanhood
101
Chapter 7:
Mortality and Orphanhood
Introduction
Mortality plays an important role in changing the rate of population growth in developing countries although the level of fertility is expected to be a more decisive factor in the growth of a population. Mortality level is one of the main health indicators which also contribute to the assessment of the quality of life.
Ideally, indicators on mortality are computed directly from data on reported or registered deaths relating to a particular period and the total population exposed to the risk of dying during that same period. However, in the case of Zimbabwe, data on deaths based on registration are not complete. At the same time, data on deaths reported by respondents during surveys or censuses are also incomplete, partly because some respondents are reluctant to discuss details of their deceased relatives.
In the absence of such information on deaths, methods have been developed for the estimation of mortality using an indirect approach. These methods utilise information on children ever born and those surviving for mothers in their child bearing ages and the survival of parents. The latter provides the basis for estimating levels of adult mortality, while the former leads to the estimation of levels of infant and child mortality.
In this chapter, indicators of infant and maternal mortality are presented. These have been estimated using the direct approach. Direct methods were used to calculate Crude Death and Maternal Mortality Ratios. Indicators showing differentials by level of education of mothers and by urban and rural areas are also included.
Infant Mortality
In every population, there are pronounced age differentials in the level of mortality. The typical pattern is high infant mortality, i.e. deaths in the first year of life, declining to the lowest level in age group 5-9 years or 10-14 years and then increasing with age. Deaths during the first year of life constitute the largest proportion of the total deaths. The level of mortality for this age group is measured by infant mortality rate (IMR) which is the number of children dying before they celebrate their first birthday out of 1 000 born alive.
The estimated infant mortality rates for the province are presented in Table 7.1a and b.Males experienced higher mortality than females. The infant mortality rate derived from the question on infant deaths in the last 12 months was 50.
Further analysis of levels of mortality will be done after thorough analysis of quality of data.
Estimates of life expectancy will be done during in–depth analysis of mortality data.
Mortality Differences among Districts
Table 7.1 shows that Mangwe and Insizadistricts had the highest infant mortality rateseach with 57 deaths per 1 000 live births while Gwanda Urban had the lowest of 35 deaths per 1 000 live births. In Mangwe and Umzingwanedistricts, female mortality was higher than male mortality whilst in the rest of the districts male mortality was higher than female mortality.
Differentials by Education of Mother
It has been observed that the level of education of mothers in a population has an impact on the level of infant mortality of that particular population. It is generally agreed that as the education of the mother increases, there is also an increased awareness in terms of hygiene, improved diet, prevention of disease through immunisation, etc, which contributes to the reduction of deaths. In Table 7.2,the

MatabelelandSouthProvince Chapter 7 Mortality and Orphanhood
102
estimates were derived from information on the survival status of the last live birth. It can be observed that the levels of mortality do not allow for any meaningful interpretation, since the rates are almost equal for those with primary education and those with secondary education and above.
Crude Death Rates
The Crude Death Rate (CDR) is the number of deaths per 1 000 population in a given period, usually a year. Although it is one of the most commonly used indices of mortality, it is affected by the age-sex structure of the population and is therefore not useful for comparative purposes. The Crude Death Rates presented below were obtained using the direct method of dividing the number of deaths in the last twelve months (as reported) by the total population. Usually, reported deaths will underestimate the true levels. Indirect methods could have been used but the population showed that it was not stable which made it impossible to use the method. The estimates of the CDRs for the province and its districts are presented in Table 7.3. The overall CDR for the province was about 13 deaths per 1 000 population. The CDRs were between 7 for Gwanda Urban and 15 for Bulilima.
Maternal Mortality
Maternal mortality relates to deaths which occur to females in child-bearing ages and are caused by complications during the time of pregnancy and childbirth, as well as deaths occurring within 42 days of a pregnancy termination, if such deaths were birth related. In Zimbabwe, data on maternal deaths are based on hospital records and vital registration which are incomplete. At the same time, because of the rareness of these events in the general population, they are not adequately captured in sample surveys. The population census provided a good opportunity of collecting data on these events. The nature of census taking was such that it was not possible to collect detailed data relating to the events. The question in the census had to be made as simple and clear as possible. If a death to
a female age 15-49 years had occurred in the household within the last 12 months, the respondent was asked whether, other than dying from an accident, the deceased had died while pregnant, during childbirth or within one month after childbirth. The data collected in this manner would not strictly reflect the true maternal deaths, but they will be quite close to the actual figure and can therefore be used to estimate the levels of maternal mortality in the country.
In Table7.4, the estimates of maternal mortality ratios for the province by district are presented. A maternal mortality ratio is the number of deaths from maternal causes per 100 000 live births, i.e. the risk of dying from pregnancy related causes. It should be noted that maternal deaths were reported by households and not by place of occurrence. The overall maternal mortality ratio for the province was 677. This ratio was lowest in Beitbridge Urban and Plumtree (255) and highest in Insiza(996). It should be recalled that both the numerator (reported maternal deaths) and the denominator (reported births) can be subject to response errors. However, the figure observed should provide a reasonable proxy for the level of maternal mortality in the province.
Orphanhood
Table 7.5 shows the percent distribution of Orphans by type of Orphanhood. Orphans were those children aged 17 and below whose mothers were dead but fathers were alive or whose fathers were dead and mothers were alive or both parents were dead.Fity-nine percent of the Orphans had their father dead, 17 percent had their mother dead while 24 percent had both parentsdead. The proportion in each Orphanhood category was the same for both sexes

MatabelelandSouthProvince Chapter 7 Mortality and Orphanhood
103
Conclusion
Although the 2012 Population Census asked direct questions on deaths inan attempt to estimate levels of mortality directly, indirect methods should be used to come up with some of the mortality indicators for reasons put forward in the introduction. However, responses to direct questions are vital in the assessment of data quality and have been used to calculate crude death rate infant mortality rate and maternal mortality ratio. Indicators of mortality showed that there has been andecrease ininfant and maternal mortality between 2002 and 2012.

MatabelelandSouthProvince Chapter 7 Mortality and Orphanhood
104
Table 7.1(a) Infant Mortality Rates by Sex and DistrictMatabeleland South Province, Zimbabwe 2012 Census
District Males Females TotalBeitbridge Rural 57 39 48Bulilima 55 43 49Mangwe 47 67 57Gwanda 60 41 51Insiza 61 53 57Matobo 51 35 43Umzingwane 40 50 45Gwanda Urban 36 34 35Beitbridge Urban 52 47 50Plumtree 54 32 43Total 54 45 50
Table 7.1(b) Infant Mortality Rates by Sex and urban/rural, Matabeleland South Province, Zimbabwe 2012 Census
Sector Males Females Total Rural 55 46 50Urban 48 41 45Total 54 45 50
Table 7.2: Infant Mortality Rates by Level of Education of Mother, Matabeleland South Province, Zimbabwe 2012 Census
Level of Education IMRNo Education 7.2Primary 25.0Secondary and above 25.3Total 24.9
Table 7.3: Crude Death Rates by District, Matabeleland South Province, Zimbabwe 2012 Census
District CDRBeitbridge Rural 10.1Bulilima 15.4Mangwe 15.2Gwanda 12.9Insiza 11.6Matobo 14.1Umzingwane 12.5Gwanda Urban 6.6Beitbridge Urban 6.8Plumtree 8.3Total 12.5

MatabelelandSouthProvince Chapter 7 Mortality and Orphanhood
105
Table 7.4: Maternal Mortality Ratio (MMR) by District, Matabeleland SouthProvince, Zimbabwe 2012 Census
District MMRBeitbridge Rural 657Bulilima 741Mangwe 990Gwanda 672Insiza 996Matobo 729Umzingwane 325Gwanda Urban 279Beitbridge Urban 255Plumtree 255Total 677
Table 7.5: Percent Distribution of Orphans by Type of Orphanhood, Matabeleland South Province, Zimbabwe 2012 Census
Type of Orphan Males Females TotalFather Dead Mother Alive 59.2 59.3 59.3Father Alive Mother Dead 16.5 16.6 16.5Both Parents Dead 24.3 24.1 24.2Total 100.0 100.0 100.0
Table 7.6: Percent Distribution of Orphans by Type of Orphanhood, Matabeleland South Province, Zimbabwe 2012 Census
Type of Orphan NumberFather Dead Mother Alive 199549Father Alive Mother Dead 62518Both Parents Dead 85895Total 347962

MatabelelandSouthProvince Chapter 7 Mortality and Orphanhood
106

MatabelelandSouthProvince Chapter 8 Housing Characteristics
107
Chapter 8:
Housing Characteristics
Introduction
This chapter describes the housing characteristics in Matabeleland South province. Information on housing characteristics collected from private households was on tenure status, type of dwelling unit, access to electricity, main source of water for drinking and cooking and distance to source, toilet facilities and main source of energy for cooking. Such housing characteristics provide indicators toassess the living conditions of the population.
Tenure Status
Tenure status refers to the arrangement under which the household occupies its living quarters and the nature of its right to be there.
The distribution of private households by tenure status can be observed in Table 8.1.Owners/Purchasers accounted for about 66 percent of the households while households in tied accommodation were 13 percent.Ten percent were lodgers and 2 percent tenants.
In all districts in the province owners/purchasers constituted the largest proportion except in Gwanda Urban, Beitbridge Urban and Plumtree where lodgers accounted for Lodgers 49, 70 and 49 percent respectively. Households in tied accommodation constituted the second largest proportion in all districts except Gwanda UrbanBeitbridge Urban and Plumtree. In these three districts the second largest proportion was in the owner/ purchaser category followed by the tied accommodation category.
Type of Dwelling Unit
Type of dwelling unit refers to the kind of housing occupied by the household.
Traditional dwelling units are found in the old style family settlement in which a number of buildings are made of pole and dagga/bricks with thatched roofs. A mixed dwelling unit is found in old style family settlement where one or more of the buildings in a cluster are built of materials more modern than pole and dagga/bricks and thatch. A detached dwelling unit is a structurally separate dwelling unit which is built of materials other than pole and dagga. Access to the street is by means of a path, or steps, directly on to the pavement, not shared by other dwelling units. Semi-detached dwelling units consist of one of two dwelling units with a common wall between them. Flat/town-house is one of three or more dwelling units in a row divided by common walls, with their gardens separated by fences, hedges or walls and whose separate accesses to the street meet the conditions as given for the detached house. Residential buildings with several floors are also included in this category.
The distribution of households by type of dwelling unit in Table 8.2indicates that about 26 percent of the households in the province lived in modern type of dwelling units. A high percentage (67 percent) occupied dwelling units which were either traditional or mixed.
Dwelling Units with Electricity
Table 8.3shows that 69 percent of the households in the province had dwelling units without electricity. The proportion of households occupying dwelling units with electricity were 8 percent in Beitbridge, 5 percent in Bulilima, 3 percent in Mangwe, 26 percent in Gwanda Rural, 26 percent in Insiza, 23 percent in Matobo, 38 percent in Umzingwane, 68percentGwandaRural,andBeitbridge Urbanand 74 percent in Plumtree.

MatabelelandSouthProvince Chapter 8 Housing Characteristics
108
Main Source of Water for Drinking and Cooking
Table 8.4shows that 10percent of all the households had piped water inside their dwelling units. A similar proportion had piped water outside their dwelling units. About45 percent of the households fetched their water from boreholes and protected wells, 3 percent from communal taps, and about 18 percent from unprotected wells and rivers/streams and Dams.
Table 8.5ashows that 17 percent of the households had their main source of water on their premises, while 25 and 30 percent respectively had their main source of water within 500 and between 500 and 1000 metres of the facility and 23 percent had their main source of water from a distance of more than 1000 metres.
For those using piped water outside their dwelling units, 60 percent had this on their premises while 36 percent had to cover a distance of less than 500 metres to fetch the water. In the case of communal tap users, about 10 percent had this facility on their premises, 67 percent within 500 metres, 14 percent between 500 and 1000 metres and 8 percent covered a distance of more than 1000 metres.
A proxy of the proportion of households using what could be termed safe water can be obtained. Without applying any rigorous health or hygienic standards one could say that households using piped water, communal taps, protected boreholes and wells have access to safe water.
Ninety-six percent of the households in Gwanda Urban had access to safe water while 74 percent of the households in Beitbridge Rural district had access to safe water. Umzingwane district had 71 percent, Gwanda Rural 51 percent, Bulilima57 percent, Insiza53 percent, Mangwe55 percent,Beitbridge Urban, Plumtree 93 and Matobo district 59 percent see Tables 8b-h.
Table 8.5bpresents the distribution of households by main source of water for
drinking and cooking as well as the distance from the dwelling unit to the source for Beitbridge Rural district. Four percent of the households had their main source of water on premises, 40 percent fetched their water from within a distance of 500 metres and 39 percent had to cover a distance of between 500 and 1000 metres and 14 percent covered a distance of more than 1000 metres.Information on main source of water for drinking and cooking in Bulilima district can be observed in Table 8.5c.fourpercent of the households in this district had water on premises, 20 percent had their water source located within 500 metres and 33 percent had to cover a distance of 500 metres or more and 37 percent from more than 1 km.
The situation for Mangwe with regard to accessibility of water can be observed in Table 8.5d.four percent of the households had water on premises and about 20 percent fetched their water from within a distance of less than 500 metres while a very large proportion (69 percent) had this facility more than 500 metres from the dwelling unit.
In Gwanda Rural 11 percent of households had their main source of water on premises. Close to 59 percent of households covered a distance of 500 metres or more, see Table 8.5e.Nine percent of households in Insiza had their main source of water on premises and 26 percent fetched their water from within a distance of less than 500 metres, 32percent covered a distance of 500 metres or more while 24 percent had their water source located 1000 metres or more, see Table 8.5f. It can be observed from Table 8.5g that in Matobo district 9 percent of the household had water on premises, 19 percent had their water source located within 500 metres, 33 percent had to cover a distance of 500 metres or more and 32 percent had their water source located 1000 metres or more. In Umzingwane 19 percent had their main source of water on premises close to 28 percent covered a distance of 500 metres or more,see Table 8.5h. The situation

MatabelelandSouthProvince Chapter 8 Housing Characteristics
109
for Gwanda Urban with regard to accessibility of water can be observed in Table 8.5i. Eighty-six percent of the households had water on premises and about 9 percent fetched water from within a distance of less than 500 metres.
Toilet Facilities
Information on toilet facilities is presented in Table 8.6.sixteeenpercent of the households in the province mostly used flush toilets. The proportion of households which mostly used blair toilets was 35 percent while that which mostly used pit latrines was 4 percent. There was a large proportion (37 percent) of households which was not using any type of toilet facility at all.
The proportion of households which mostly used flush toilets was in Beitbridge Urban, Plumtree and Gwanda Urban, 76, 79 and 82 percent respectively. The proportion of households without any toilet facility ranged from one percent in BeitbridgeUrban to 60 percent in Beitbridge Rural.
Source of Energy Mostly Used for Cooking
Table 8.7shows that 79 percent of the households in the province used wood as the main source of fuel for cooking. The proportion of households which used electricity was 15 percent. A very small proportion of households, less than one percent, used either gas, paraffin,coal or some other form of fuel for cooking.
Generally, all districts had high proportions of households using wood for cooking with the exception of Gwanda Urban, Beitbrigde Urban and Plumtreewere electricity is the many source. Sixty-three, 64, and 72 percent of households in Gwanda Urban,Beitbridge Urban and Plumtree respectively used electricity for cooking.
Conclusion
This chapter shows that most households in the province lived in traditional type of
accommodation, had access to clean water, used wood as their main source of energy for cooking and had access to blair toilets.

MatabelelandSouthProvince Chapter 8 Housing Characteristics
110
Table 8.1: Percent Distribution of Households by Tenure Status and District: Matabeleland South Province, Zimbabwe 2002 Census
Mat South Owner/Purchaser Tenant LodgerTied
accommodation Other Missing Total NumberBeitbridge Rural 81.1 0.7 1.2 12.0 2.2 2.8 100 18471Bulilima 78.9 0.7 0.2 8.4 6.3 5.6 100 19686Mangwe 79.9 0.7 0.8 7.2 4.2 7.3 100 13555Gwanda Rural 70.3 1.5 1.9 16.0 4.4 5.9 100 26510Insiza 68.6 2.5 3.6 13.9 3.4 8.0 100 21274Matobo 76.2 1.5 1.5 10.5 3.7 6.6 100 20546Umzingwane 62.0 2.3 6.4 16.7 6.9 5.6 100 14153Gwanda 23.8 5.8 48.8 17.8 2.1 1.6 100 5603Beitbridge 14.4 2.3 69.6 10.7 2.1 0.9 100 11825Plumtree 26.1 2.2 48.9 15.8 5.4 1.7 100 3252Total 66.4 1.7 10.0 12.5 4.1 5.3 100 154875
Table 8.2: Percent Distribution of Households by District and Type of Dwelling Unit: Matabeleland South Province, Zimbabwe 2012 Census
District Traditional Mixed DetachedSemi-
detached Flat/townhouse Shack Other Missing Total NumberBeitbridge Rural 29.1 50.0 12.7 3.3 0.2 0.7 1.1 2.8 100 18471Bulilima 48.5 40.0 2.8 1.5 0.4 1.0 0.3 5.5 100 19686Mangwe 25.8 56.8 5.6 1.7 1.1 1.4 0.2 7.4 100 13555Gwanda Rural 21.2 50.7 10.6 8.5 1.1 1.7 0.4 5.9 100 26510Insiza 40.8 31.9 10.1 5.1 1.5 1.5 1.1 8.0 100 21274Matobo 27.1 51.6 8.1 4.0 1.2 1.1 0.4 6.5 100 20546Umzingwane 31.0 35.5 16.0 8.4 1.9 0.9 0.7 5.6 100 14153Gwanda 0.3 0.1 59.7 29.4 8.3 0.1 0.3 1.7 100 5603Beitbridge 0.2 0.2 71.5 19.7 3.0 3.0 1.6 0.9 100 11825Plumtree 0.2 0.4 72.1 14.1 10.9 0.2 0.3 1.8 100 3252Total 27.6 39.2 17.2 7.1 1.6 1.3 0.7 5.3 100 154875

Matabeleland SouthProvince Chapter 8 Housing Characteristics
111
Table 8.3: Percent Distribution of Households in Dwelling Units with Electricity by District, Matabeleland South Province, Zimbabwe 2012 Census
District Yes No Missing Total Number
Beitbridge Rural 7.9 89.3 2.8 100.00 18471Bulilima 5.0 89.3 5.7 100.00 19686Mangwe 3.3 89.2 7.5 100.00 13555Gwanda Rural 25.8 68.3 6.0 100.00 26510Insiza 25.5 66.5 8.1 100.00 21274Matobo 22.6 70.8 6.6 100.00 20546Umzingwane 37.5 56.9 5.6 100.00 14153Gwanda 68.1 30.2 1.7 100.00 5603Beitbridge 67.5 31.6 0.9 100.00 11825Plumtree 74.1 24.2 1.7 100.00 3252Total 25.4 69.2 5.4 100.00 154875
Table 8.4: Percent Distribution of Households by Main Source of Water for Drinking and cooking and by Distance (meters) to the source, Matabeleland South Province, Zimbabwe 2012 Census
Source of WaterOn
premisesLess than
500m500m to
1kmMore than
1km Missing Total Number TotalPiped water inside house 100.0 0.0 0.0 0.0 0.0 100 15471 9.99Piped water outside house 59.7 36.4 2.8 0.8 0.3 100 13628 8.80Communal tape 10.4 66.6 14.2 8.3 0.5 100 5006 3.23Well/borehole protected 2.1 28.9 42.2 25.9 0.8 100 69288 44.74Well - unprotected 1.7 32.3 39.6 25.5 0.8 100 12843 8.29River/stream/dam 0.1 17.2 32.8 48.8 1.1 100 28537 18.43Other specify 4.7 40.5 36.2 14.8 3.8 100 1407 0.91Missing 0.8 1.8 3.1 2.7 91.6 100 8695 5.61Total 16.8 24.6 29.4 23.3 5.9 100 154875 100.00
Table 8.5: Percent Distribution of Households by Main Source of Water for Drinking and Cooking and by Distance (meters) to the Source, Zimbabwe 2012 Census
(a)Beitbridge Rural
Water SourceOn premises
Less than 500m
500m to 1km
More than 1km Missing Total Number
Piped water inside house 100.0 0.0 0.0 0.0 0.0 100 199Piped water outside house 37.3 57.7 3.9 0.8 0.4 100 856Communal tape 3.3 88.8 4.3 3.4 0.2 100 940Well/borehole protected 1.0 37.0 46.0 15.3 0.7 100 11686Well - unprotected 2.0 49.4 35.8 12.1 0.8 100 2555River/stream/dam 0.1 27.0 44.0 28.1 0.8 100 1571Other specify 15.0 59.2 21.7 4.2 0.0 100 120Missing 0.4 3.9 5.7 1.5 88.6 100 544Total 4.0 40.2 38.5 14.0 3.2 100 18471
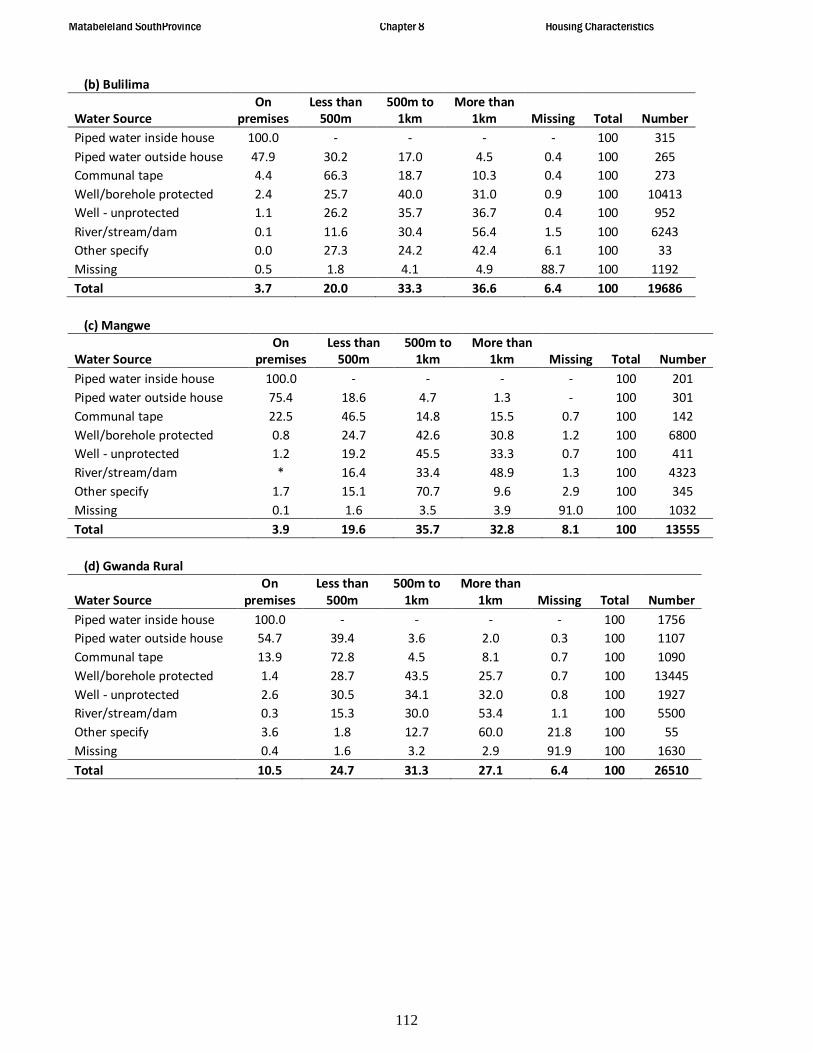
Matabeleland SouthProvince Chapter 8 Housing Characteristics
112
(b) Bulilima
Water SourceOn
premisesLess than
500m500m to
1kmMore than
1km Missing Total NumberPiped water inside house 100.0 - - - - 100 315Piped water outside house 47.9 30.2 17.0 4.5 0.4 100 265Communal tape 4.4 66.3 18.7 10.3 0.4 100 273Well/borehole protected 2.4 25.7 40.0 31.0 0.9 100 10413Well - unprotected 1.1 26.2 35.7 36.7 0.4 100 952River/stream/dam 0.1 11.6 30.4 56.4 1.5 100 6243Other specify 0.0 27.3 24.2 42.4 6.1 100 33Missing 0.5 1.8 4.1 4.9 88.7 100 1192Total 3.7 20.0 33.3 36.6 6.4 100 19686
(c) Mangwe
Water SourceOn
premisesLess than
500m500m to
1kmMore than
1km Missing Total NumberPiped water inside house 100.0 - - - - 100 201Piped water outside house 75.4 18.6 4.7 1.3 - 100 301Communal tape 22.5 46.5 14.8 15.5 0.7 100 142Well/borehole protected 0.8 24.7 42.6 30.8 1.2 100 6800Well - unprotected 1.2 19.2 45.5 33.3 0.7 100 411River/stream/dam * 16.4 33.4 48.9 1.3 100 4323Other specify 1.7 15.1 70.7 9.6 2.9 100 345Missing 0.1 1.6 3.5 3.9 91.0 100 1032Total 3.9 19.6 35.7 32.8 8.1 100 13555
(d) Gwanda Rural
Water SourceOn
premisesLess than
500m500m to
1kmMore than
1km Missing Total NumberPiped water inside house 100.0 - - - - 100 1756Piped water outside house 54.7 39.4 3.6 2.0 0.3 100 1107Communal tape 13.9 72.8 4.5 8.1 0.7 100 1090Well/borehole protected 1.4 28.7 43.5 25.7 0.7 100 13445Well - unprotected 2.6 30.5 34.1 32.0 0.8 100 1927River/stream/dam 0.3 15.3 30.0 53.4 1.1 100 5500Other specify 3.6 1.8 12.7 60.0 21.8 100 55Missing 0.4 1.6 3.2 2.9 91.9 100 1630Total 10.5 24.7 31.3 27.1 6.4 100 26510

Matabeleland SouthProvince Chapter 8 Housing Characteristics
113
(e) Insiza
Water SourceOn
premisesLess than
500m500m to
1kmMore than
1km Missing Total NumberPiped water inside house 100.0 - - - - 100 1087Piped water outside house 38.4 57.9 2.4 0.9 0.4 100 1388Communal tape 9.0 47.3 29.5 13.2 0.9 100 545Well/borehole protected 3.0 29.3 40.9 26.1 0.7 100 8342Well - unprotected 2.0 26.7 44.7 25.7 0.8 100 2942River/stream/dam 0.1 23.8 33.9 41.3 0.9 100 4919Other specify 0.7 31.0 37.5 26.4 4.3 100 277Missing 0.3 1.7 2.3 1.4 94.3 100 1774Total 9.4 26.2 31.7 24.2 8.6 100 21274
(f) Matobo
Water SourceOn
premisesLess than
500m500m to
1kmMore than
1km Missing Total NumberPiped water inside house 100.0 - - - - 100 888Piped water outside house 46.0 42.6 8.6 2.1 0.8 100 914Communal tape 26.5 42.2 17.3 13.7 0.3 100 652Well/borehole protected 2.8 19.2 40.4 36.7 0.9 100 9630Well - unprotected 1.2 27.6 41.0 29.1 1.2 100 2436River/stream/dam * 14.4 34.0 50.4 1.1 100 4430Other specify 2.5 53.3 27.9 11.2 5.1 100 197Missing 0.2 1.2 3.1 2.9 92.5 100 1399Total 8.7 19.2 32.5 32.4 7.2 100 20546
(g) Umzingwane
Water SourceOn
premisesLess than
500m500m to
1kmMore than
1km Missing Total NumberPiped water inside house 100.0 - - - - 100 1536Piped water outside house 57.4 38.7 2.9 0.8 0.2 100 1330Communal tape 3.1 71.1 16.2 8.9 0.7 100 764Well/borehole protected 4.7 29.8 40.2 24.6 0.6 100 6418Well - unprotected 0.5 32.1 41.8 24.9 0.7 100 1613River/stream/dam 0.1 25.5 31.2 42.5 0.8 100 1531Other specify 16.5 27.3 38.1 15.8 2.2 100 139Missing 1.2 1.5 1.9 2.1 93.3 100 822Total 18.9 27.7 28.0 19.4 5.9 100 14153
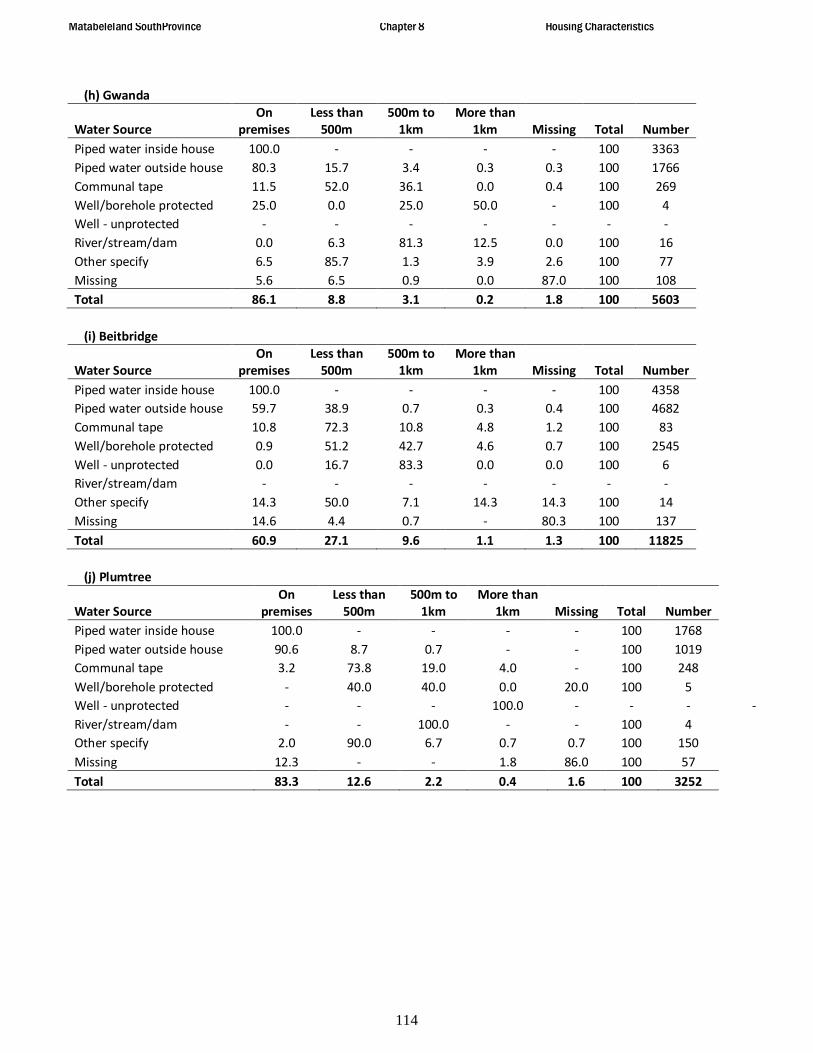
Matabeleland SouthProvince Chapter 8 Housing Characteristics
114
(h) Gwanda
Water SourceOn
premisesLess than
500m500m to
1kmMore than
1km Missing Total NumberPiped water inside house 100.0 - - - - 100 3363Piped water outside house 80.3 15.7 3.4 0.3 0.3 100 1766Communal tape 11.5 52.0 36.1 0.0 0.4 100 269Well/borehole protected 25.0 0.0 25.0 50.0 - 100 4Well - unprotected - - - - - - -River/stream/dam 0.0 6.3 81.3 12.5 0.0 100 16Other specify 6.5 85.7 1.3 3.9 2.6 100 77Missing 5.6 6.5 0.9 0.0 87.0 100 108Total 86.1 8.8 3.1 0.2 1.8 100 5603
(i) Beitbridge
Water SourceOn
premisesLess than
500m500m to
1kmMore than
1km Missing Total NumberPiped water inside house 100.0 - - - - 100 4358Piped water outside house 59.7 38.9 0.7 0.3 0.4 100 4682Communal tape 10.8 72.3 10.8 4.8 1.2 100 83Well/borehole protected 0.9 51.2 42.7 4.6 0.7 100 2545Well - unprotected 0.0 16.7 83.3 0.0 0.0 100 6River/stream/dam - - - - - - -Other specify 14.3 50.0 7.1 14.3 14.3 100 14Missing 14.6 4.4 0.7 - 80.3 100 137Total 60.9 27.1 9.6 1.1 1.3 100 11825
(j) Plumtree
Water SourceOn
premisesLess than
500m500m to
1kmMore than
1km Missing Total NumberPiped water inside house 100.0 - - - - 100 1768Piped water outside house 90.6 8.7 0.7 - - 100 1019Communal tape 3.2 73.8 19.0 4.0 - 100 248Well/borehole protected - 40.0 40.0 0.0 20.0 100 5Well - unprotected - - - 100.0 - - - -River/stream/dam - - 100.0 - - 100 4Other specify 2.0 90.0 6.7 0.7 0.7 100 150Missing 12.3 - - 1.8 86.0 100 57Total 83.3 12.6 2.2 0.4 1.6 100 3252
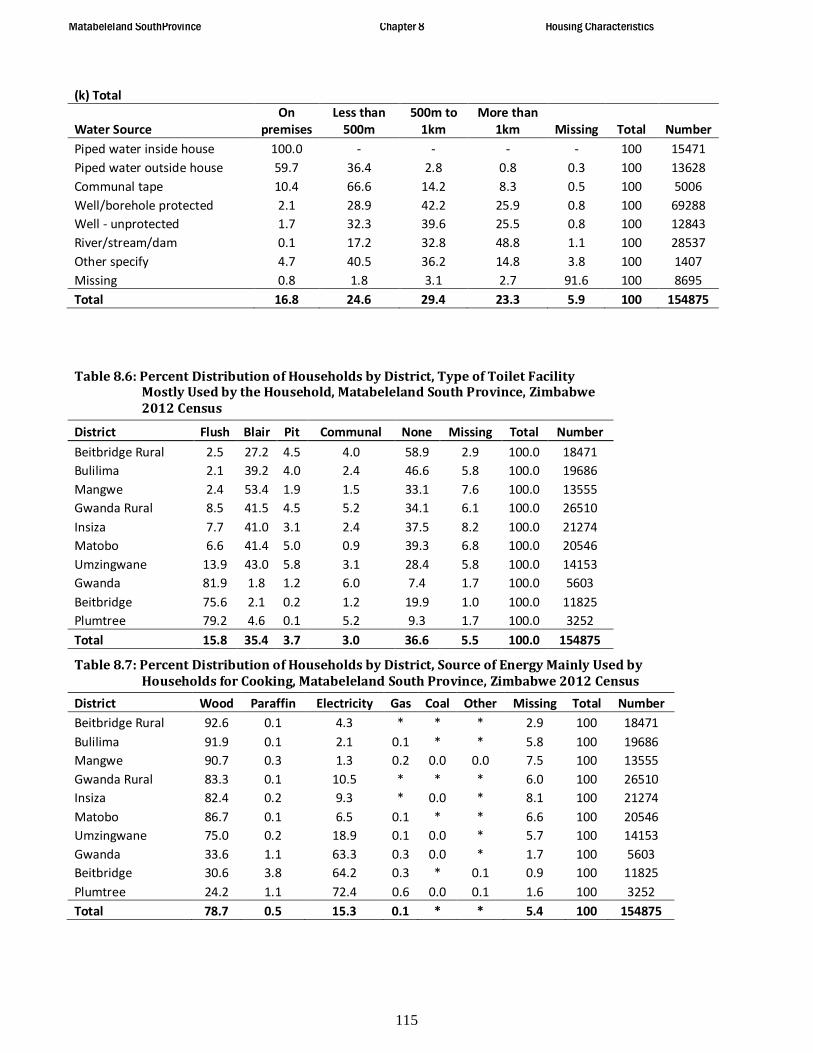
Matabeleland SouthProvince Chapter 8 Housing Characteristics
115
(k) Total
Water SourceOn
premisesLess than
500m500m to
1kmMore than
1km Missing Total NumberPiped water inside house 100.0 - - - - 100 15471Piped water outside house 59.7 36.4 2.8 0.8 0.3 100 13628Communal tape 10.4 66.6 14.2 8.3 0.5 100 5006Well/borehole protected 2.1 28.9 42.2 25.9 0.8 100 69288Well - unprotected 1.7 32.3 39.6 25.5 0.8 100 12843River/stream/dam 0.1 17.2 32.8 48.8 1.1 100 28537Other specify 4.7 40.5 36.2 14.8 3.8 100 1407Missing 0.8 1.8 3.1 2.7 91.6 100 8695Total 16.8 24.6 29.4 23.3 5.9 100 154875
Table 8.6: Percent Distribution of Households by District, Type of Toilet Facility Mostly Used by the Household, Matabeleland South Province, Zimbabwe 2012 Census
District Flush Blair Pit Communal None Missing Total NumberBeitbridge Rural 2.5 27.2 4.5 4.0 58.9 2.9 100.0 18471Bulilima 2.1 39.2 4.0 2.4 46.6 5.8 100.0 19686Mangwe 2.4 53.4 1.9 1.5 33.1 7.6 100.0 13555Gwanda Rural 8.5 41.5 4.5 5.2 34.1 6.1 100.0 26510Insiza 7.7 41.0 3.1 2.4 37.5 8.2 100.0 21274Matobo 6.6 41.4 5.0 0.9 39.3 6.8 100.0 20546Umzingwane 13.9 43.0 5.8 3.1 28.4 5.8 100.0 14153Gwanda 81.9 1.8 1.2 6.0 7.4 1.7 100.0 5603Beitbridge 75.6 2.1 0.2 1.2 19.9 1.0 100.0 11825Plumtree 79.2 4.6 0.1 5.2 9.3 1.7 100.0 3252Total 15.8 35.4 3.7 3.0 36.6 5.5 100.0 154875
Table 8.7: Percent Distribution of Households by District, Source of Energy Mainly Used by Households for Cooking, Matabeleland South Province, Zimbabwe 2012 Census
District Wood Paraffin Electricity Gas Coal Other Missing Total NumberBeitbridge Rural 92.6 0.1 4.3 * * * 2.9 100 18471Bulilima 91.9 0.1 2.1 0.1 * * 5.8 100 19686Mangwe 90.7 0.3 1.3 0.2 0.0 0.0 7.5 100 13555Gwanda Rural 83.3 0.1 10.5 * * * 6.0 100 26510Insiza 82.4 0.2 9.3 * 0.0 * 8.1 100 21274Matobo 86.7 0.1 6.5 0.1 * * 6.6 100 20546Umzingwane 75.0 0.2 18.9 0.1 0.0 * 5.7 100 14153Gwanda 33.6 1.1 63.3 0.3 0.0 * 1.7 100 5603Beitbridge 30.6 3.8 64.2 0.3 * 0.1 0.9 100 11825Plumtree 24.2 1.1 72.4 0.6 0.0 0.1 1.6 100 3252Total 78.7 0.5 15.3 0.1 * * 5.4 100 154875
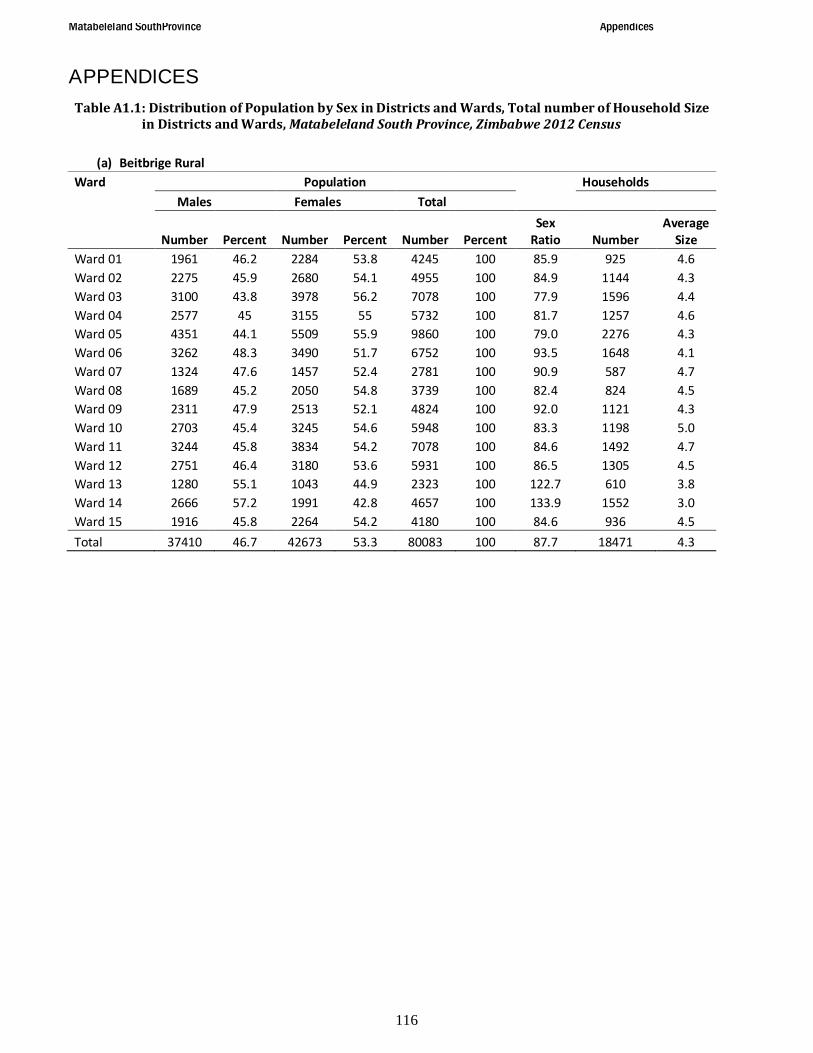
Matabeleland SouthProvince Appendices
116
APPENDICESTable A1.1: Distribution of Population by Sex in Districts and Wards, Total number of Household Size
in Districts and Wards, Matabeleland South Province, Zimbabwe 2012 Census
(a) Beitbrige RuralWard Population Households
Males Females Total
Number Percent Number Percent Number PercentSex
Ratio NumberAverage
SizeWard 01 1961 46.2 2284 53.8 4245 100 85.9 925 4.6Ward 02 2275 45.9 2680 54.1 4955 100 84.9 1144 4.3Ward 03 3100 43.8 3978 56.2 7078 100 77.9 1596 4.4Ward 04 2577 45 3155 55 5732 100 81.7 1257 4.6Ward 05 4351 44.1 5509 55.9 9860 100 79.0 2276 4.3Ward 06 3262 48.3 3490 51.7 6752 100 93.5 1648 4.1Ward 07 1324 47.6 1457 52.4 2781 100 90.9 587 4.7Ward 08 1689 45.2 2050 54.8 3739 100 82.4 824 4.5Ward 09 2311 47.9 2513 52.1 4824 100 92.0 1121 4.3Ward 10 2703 45.4 3245 54.6 5948 100 83.3 1198 5.0Ward 11 3244 45.8 3834 54.2 7078 100 84.6 1492 4.7Ward 12 2751 46.4 3180 53.6 5931 100 86.5 1305 4.5Ward 13 1280 55.1 1043 44.9 2323 100 122.7 610 3.8Ward 14 2666 57.2 1991 42.8 4657 100 133.9 1552 3.0Ward 15 1916 45.8 2264 54.2 4180 100 84.6 936 4.5Total 37410 46.7 42673 53.3 80083 100 87.7 18471 4.3

Matabeleland SouthProvince Appendices
117
(b)BulilimaWard Population Households
Males Females Total
Number Percent Number Percent Number Percent Sex Ratio NumberAverage
SizeWard 01 2378 46.4 2745 53.6 5123 100 86.6 1134 4.5Ward 02 1192 45.8 1408 54.2 2600 100 84.7 581 4.5Ward 03 2797 45.5 3348 54.5 6145 100 83.5 1283 4.8Ward 04 2400 48.5 2545 51.5 4945 100 94.3 1134 4.4Ward 05 2788 45.8 3298 54.2 6086 100 84.5 1426 4.3Ward 06 2261 44.4 2834 55.6 5095 100 79.8 1160 4.4Ward 07 3756 45.1 4574 54.9 8330 100 82.1 1820 4.6Ward 08 1788 43.3 2343 56.7 4131 100 76.3 874 4.7Ward 09 2496 46.1 2917 53.9 5413 100 85.6 1251 4.3Ward 10 1829 46.6 2092 53.4 3921 100 87.4 879 4.5Ward 11 2167 45.4 2611 54.6 4778 100 83.0 1012 4.7Ward 12 2725 45.6 3248 54.4 5973 100 83.9 1229 4.9Ward 13 1404 44.5 1750 55.5 3154 100 80.2 643 4.9Ward 14 2670 46.2 3115 53.8 5785 100 85.7 1280 4.5Ward 15 908 49.8 914 50.2 1822 100 99.3 364 5.0Ward 16 930 49.3 957 50.7 1887 100 97.2 351 5.4Ward 17 191 51.2 182 48.8 373 100 104.9 80 4.7Ward 18 469 48.7 495 51.3 964 100 94.7 182 5.3Ward 19 2961 49.8 2987 50.2 5948 100 99.1 1252 4.8Ward 20 994 47.6 1096 52.4 2090 100 90.7 461 4.5Ward 21 968 46.7 1105 53.3 2073 100 87.6 466 4.4Ward 22 1736 44.2 2189 55.8 3925 100 79.3 824 4.8Total 41808 46.2 48753 53.8 90561 100 85.8 19686 4.6

Matabeleland SouthProvince Appendices
118
(c)MangweWard Population Households
Males Females TotalNumber Percent Number Percent Number Percent Sex Ratio Number Average Size
Ward 01 1847 46 2164 54 4011 100 85.4 743 5.4Ward 02 1401 45.9 1649 54.1 3050 100 85.0 610 5.0Ward 03 2106 46 2469 54 4575 100 85.3 909 5.0Ward 04 2436 45.4 2931 54.6 5367 100 83.1 1111 4.8Ward 05 1615 47.2 1808 52.8 3423 100 89.3 774 4.4Ward 06 2624 46.1 3068 53.9 5692 100 85.5 1173 4.9Ward 07 1370 46 1606 54 2976 100 85.3 614 4.8Ward 08 993 47.1 1117 52.9 2110 100 88.9 399 5.3Ward 09 1034 43.5 1345 56.5 2379 100 76.9 498 4.8Ward 10 2317 45.5 2772 54.5 5089 100 83.6 1034 4.9Ward 11 2124 59.5 1448 40.5 3572 100 146.7 857 4.2Ward 12 1308 48.2 1403 51.8 2711 100 93.2 558 4.9Ward 13 1588 47.6 1749 52.4 3337 100 90.8 645 5.2Ward 14 788 47.4 874 52.6 1662 100 90.2 324 5.1Ward 15 2878 49.5 2939 50.5 5817 100 97.9 1230 4.7Ward 16 2694 44.8 3322 55.2 6016 100 81.1 1210 5.0Ward 17 2036 45.9 2395 54.1 4431 100 85.0 866 5.1Total 31159 47.1 35059 52.9 66218 100 88.9 13555 4.9
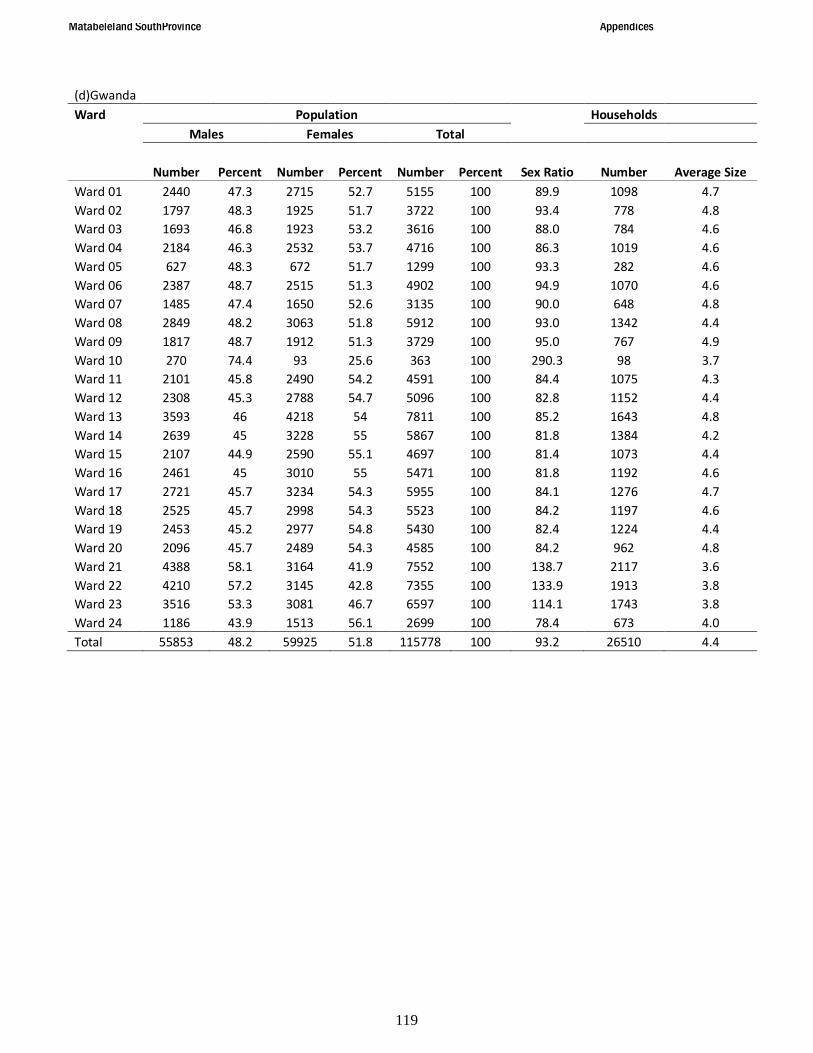
Matabeleland SouthProvince Appendices
119
(d)GwandaWard Population Households
Males Females Total
Number Percent Number Percent Number Percent Sex Ratio Number Average SizeWard 01 2440 47.3 2715 52.7 5155 100 89.9 1098 4.7Ward 02 1797 48.3 1925 51.7 3722 100 93.4 778 4.8Ward 03 1693 46.8 1923 53.2 3616 100 88.0 784 4.6Ward 04 2184 46.3 2532 53.7 4716 100 86.3 1019 4.6Ward 05 627 48.3 672 51.7 1299 100 93.3 282 4.6Ward 06 2387 48.7 2515 51.3 4902 100 94.9 1070 4.6Ward 07 1485 47.4 1650 52.6 3135 100 90.0 648 4.8Ward 08 2849 48.2 3063 51.8 5912 100 93.0 1342 4.4Ward 09 1817 48.7 1912 51.3 3729 100 95.0 767 4.9Ward 10 270 74.4 93 25.6 363 100 290.3 98 3.7Ward 11 2101 45.8 2490 54.2 4591 100 84.4 1075 4.3Ward 12 2308 45.3 2788 54.7 5096 100 82.8 1152 4.4Ward 13 3593 46 4218 54 7811 100 85.2 1643 4.8Ward 14 2639 45 3228 55 5867 100 81.8 1384 4.2Ward 15 2107 44.9 2590 55.1 4697 100 81.4 1073 4.4Ward 16 2461 45 3010 55 5471 100 81.8 1192 4.6Ward 17 2721 45.7 3234 54.3 5955 100 84.1 1276 4.7Ward 18 2525 45.7 2998 54.3 5523 100 84.2 1197 4.6Ward 19 2453 45.2 2977 54.8 5430 100 82.4 1224 4.4Ward 20 2096 45.7 2489 54.3 4585 100 84.2 962 4.8Ward 21 4388 58.1 3164 41.9 7552 100 138.7 2117 3.6Ward 22 4210 57.2 3145 42.8 7355 100 133.9 1913 3.8Ward 23 3516 53.3 3081 46.7 6597 100 114.1 1743 3.8Ward 24 1186 43.9 1513 56.1 2699 100 78.4 673 4.0Total 55853 48.2 59925 51.8 115778 100 93.2 26510 4.4

Matabeleland SouthProvince Appendices
120
(e)InsizaWard Population Households
Males Females Total
Number Percent Number Percent Number Percent Sex Ratio Number Average Size
Ward 01 1753 49.7 1773 50.3 3526 100 98.9 738 4.8Ward 02 2350 48.7 2473 51.3 4823 100 95.0 1021 4.7Ward 03 2426 46.5 2794 53.5 5220 100 86.8 1084 4.8Ward 04 2605 47.6 2866 52.4 5471 100 90.9 1094 5.0Ward 05 2095 47.1 2353 52.9 4448 100 89.0 949 4.7Ward 06 1859 46.8 2113 53.2 3972 100 88.0 804 4.9Ward 07 1948 47.0 2201 53.0 4149 100 88.5 812 5.1Ward 08 446 51.7 416 48.3 862 100 107.2 151 5.7Ward 09 2104 47.4 2332 52.6 4436 100 90.2 941 4.7Ward 10 1131 49.2 1170 50.8 2301 100 96.7 431 5.3Ward 11 1217 45.5 1457 54.5 2674 100 83.5 526 5.1Ward 12 1045 46.8 1187 53.2 2232 100 88.0 451 4.9Ward 13 1955 50.8 1897 49.2 3852 100 103.1 778 5.0Ward 14 1490 58.7 1047 41.3 2537 100 142.3 793 3.2Ward 15 2617 49.9 2625 50.1 5242 100 99.7 1441 3.6Ward 16 1728 55.2 1401 44.8 3129 100 123.3 650 4.8Ward 17 2619 47.9 2853 52.1 5472 100 91.8 1106 4.9Ward 18 1609 48.2 1728 51.8 3337 100 93.1 647 5.2Ward 19 3735 48.8 3913 51.2 7648 100 95.5 1458 5.2Ward 20 3977 47.7 4368 52.3 8345 100 91.0 1625 5.1Ward 21 3351 49.6 3401 50.4 6752 100 98.5 1279 5.3Ward 22 2794 49.8 2822 50.2 5616 100 99.0 1221 4.6Ward 23 2484 57.9 1805 42.1 4289 100 137.6 1274 3.4
Total 49338 49.2 50995 50.8 100333 100 96.8 21274 4.7

Matabeleland SouthProvince Appendices
121
(f)MatoboWard Population Households
Males Females Total
Number Percent Number Percent Number Percent Sex Ratio Number Average SizeWard 01 1828 46.0 2149 54.0 3977 100 85.1 853 4.7Ward 02 2965 48.9 3099 51.1 6064 100 95.7 1345 4.5Ward 03 1697 47.4 1884 52.6 3581 100 90.1 826 4.3Ward 04 2348 47.3 2612 52.7 4960 100 89.9 999 5.0Ward 05 2127 46.0 2501 54.0 4628 100 85.0 916 5.1Ward 06 2392 44.9 2935 55.1 5327 100 81.5 1045 5.1Ward 07 2309 45.6 2753 54.4 5062 100 83.9 1041 4.9Ward 08 1996 46.1 2332 53.9 4328 100 85.6 895 4.8Ward 09 1440 46.3 1667 53.7 3107 100 86.4 664 4.7Ward 10 1565 44.7 1934 55.3 3499 100 80.9 712 4.9Ward 11 1498 46.1 1750 53.9 3248 100 85.6 706 4.6Ward 12 1989 48.2 2138 51.8 4127 100 93.0 844 4.9Ward 13 1688 45.9 1987 54.1 3675 100 85.0 868 4.2Ward 14 1957 45.2 2370 54.8 4327 100 82.6 967 4.5Ward 15 2485 48.2 2675 51.8 5160 100 92.9 1075 4.8Ward 16 2217 47.2 2481 52.8 4698 100 89.4 924 5.1Ward 17 2124 48.5 2259 51.5 4383 100 94.0 920 4.8Ward 18 1650 47.0 1857 53.0 3507 100 88.9 708 5.0Ward 19 2589 46.8 2938 53.2 5527 100 88.1 1312 4.2Ward 20 49 76.6 15 23.4 64 100 326.7 25 2.6Ward 21 677 60.8 436 39.2 1113 100 155.3 274 4.1Ward 22 448 69.5 197 30.5 645 100 227.4 214 3.0Ward 23 586 60.6 381 39.4 967 100 153.8 247 3.9Ward 24 1193 56.4 921 43.6 2114 100 129.5 537 3.9Ward 25 3101 53.0 2751 47.0 5852 100 112.7 1629 3.6
Total 44918 47.8 49022 52.2 93940 100 91.6 20546 4.6

Matabeleland SouthProvince Appendices
122
(g)UmzingwaneWard Population Households
Males Females Total
Number Percent Number Percent Number PercentSex
Ratio NumberAverage
SizeWard 01 1654 49.7 1671 50.3 3325 100 99.0 651 5.1Ward 02 1701 47.1 1909 52.9 3610 100 89.1 835 4.3Ward 03 2613 48.8 2743 51.2 5356 100 95.3 1142 4.7Ward 04 1960 49.2 2026 50.8 3986 100 96.7 878 4.5Ward 05 2007 46.2 2340 53.8 4347 100 85.8 909 4.8Ward 06 1978 47.5 2190 52.5 4168 100 90.3 942 4.4Ward 07 1394 47.4 1550 52.6 2944 100 89.9 639 4.6Ward 08 1361 48.9 1423 51.1 2784 100 95.6 573 4.9Ward 09 1090 47.7 1195 52.3 2285 100 91.2 494 4.6Ward 10 523 46.2 609 53.8 1132 100 85.9 244 4.6Ward 11 1043 46.8 1186 53.2 2229 100 87.9 475 4.7Ward 12 1879 49.1 1946 50.9 3825 100 96.6 801 4.8Ward 13 727 49.0 757 51.0 1484 100 96.0 305 4.9Ward 14 1762 53.4 1535 46.6 3297 100 114.8 790 4.2Ward 15 283 63.5 163 36.5 446 100 173.6 138 3.2Ward 16 1644 49.3 1691 50.7 3335 100 97.2 920 3.6Ward 17 1430 49.4 1465 50.6 2895 100 97.6 788 3.7Ward 18 2654 52.9 2359 47.1 5013 100 112.5 1128 4.4Ward 19 2400 54.2 2028 45.8 4428 100 118.3 1024 4.3Ward 20 1091 51.9 1010 48.1 2101 100 108.0 477 4.4
Total 31194 49.5 31796 50.5 62990 100 98.1 14153 4.5
(h)Gwanda UrbanWard Population Households
Males Females Total
Number Percent Number Percent Number PercentSex
Ratio NumberAverage
SizeWard 01 727 53.3 637 46.7 1364 100 114.1 364 3.7Ward 02 423 44.3 531 55.7 954 100 79.7 246 3.9Ward 03 368 50.8 357 49.2 725 100 103.1 194 3.7Ward 04 1095 46 1283 54 2378 100 85.3 636 3.7Ward 05 902 47.3 1004 52.7 1906 100 89.8 503 3.8Ward 06 1145 44.9 1406 55.1 2551 100 81.4 705 3.6Ward 07 1726 44.1 2185 55.9 3911 100 79.0 1093 3.6Ward 08 1435 48.8 1504 51.2 2939 100 95.4 887 3.3Ward 09 1186 46.7 1353 53.3 2539 100 87.7 695 3.7Ward 10 487 50.7 473 49.3 960 100 103.0 280 3.4
Total 9494 46.9 10733 53.1 20227 100 88.5 5603 3.6

Matabeleland SouthProvince Appendices
123
(i)Beitbridge UrbanWard Population Households
Males Females Total
Number Percent Number Percent Number Percent Sex Ratio Number Average SizeWard 01 2376 46.3 2754 53.7 5130 100 86.3 732 7.0Ward 02 1103 49.6 1123 50.4 2226 100 98.2 601 3.7Ward 03 2112 50.6 2063 49.4 4175 100 102.4 1174 3.6Ward 04 5204 48.6 5500 51.4 10704 100 94.6 3213 3.3Ward 05 3588 47.5 3967 52.5 7555 100 90.4 2181 3.5Ward 06 6049 49.0 6298 51.0 12347 100 96.0 3924 3.1Total 20432 48.5 21705 51.5 42137 100 94.1 11825 3.6
(j)PlumtreeWard Population Households
Males Females Total
Number Percent Number Percent Number Percent Sex Ratio Number Average SizeWard 01 1315 44.0 1675 56.0 2990 100 78.5 846 3.5Ward 02 741 45.4 892 54.6 1633 100 83.1 456 3.6Ward 03 1567 45.6 1866 54.4 3433 100 84.0 989 3.5Ward 04 505 46.3 585 53.7 1090 100 86.3 263 4.1Ward 05 329 53.8 283 46.2 612 100 116.3 165 3.7Ward 06 904 48.4 964 51.6 1868 100 93.8 533 3.5Total 5361 46.1 6265 53.9 11626 100 85.6 3252 3.6

Matabeleland SouthProvince Appendices
124
Table A1.2: Population Distribution by District Age Group and Sex, Matabeleland South Province, Zimbabwe 2012 Census(a)Beitbridge RuralAge Group Males Percent Females Percent Total PercentNS 32 41.0 46 59.0 78 100Under 1 1278 50.2 1269 49.8 2547 100'1 - 4 5310 50.0 5314 50.0 10624 100'5 - 9 6161 49.7 6236 50.3 12397 100'10 - 14 6297 51.6 5916 48.4 12213 10015 - 19 4854 52.2 4446 47.8 9300 10020 - 24 2699 43.9 3447 56.1 6146 10025 - 29 2214 42.6 2987 57.4 5201 10030 - 34 1633 43.4 2126 56.6 3759 10035 - 39 1275 39.7 1933 60.3 3208 10040 - 44 1009 41.4 1428 58.6 2437 10045 - 49 701 38.1 1141 61.9 1842 10050 - 54 813 34.2 1561 65.8 2374 10055 - 59 750 39.4 1155 60.6 1905 10060 - 64 646 39.4 992 60.6 1638 10065 - 69 555 42.3 757 57.7 1312 10070 - 74 436 39.2 676 60.8 1112 10075 + 747 37.5 1243 62.5 1990 100Total 37410 46.7 42673 53.3 80083 100
(b)BulilimaAge Group Males Percent Females Percent Total PercentNS 48 42.5 65 57.5 113 100Under 1 1146 49.2 1184 50.8 2330 100'1 - 4 5463 50.1 5439 49.9 10902 100'5 - 9 6959 50 6958 50 13917 100'10 - 14 7185 50.7 6989 49.3 14174 10015 - 19 6582 54.8 5422 45.2 12004 10020 - 24 3152 46.6 3606 53.4 6758 10025 - 29 1961 42.2 2681 57.8 4642 10030 - 34 1483 40.9 2139 59.1 3622 10035 - 39 1188 38.5 1895 61.5 3083 10040 - 44 974 36.9 1669 63.1 2643 10045 - 49 836 34.6 1577 65.4 2413 10050 - 54 918 32.8 1883 67.2 2801 10055 - 59 844 34.6 1593 65.4 2437 10060 - 64 705 35.7 1269 64.3 1974 10065 - 69 625 34.6 1179 65.4 1804 10070 - 74 556 36.7 957 63.3 1513 10075 + 1183 34.5 2248 65.5 3431 100Total 41808 46.2 48753 53.8 90561 100

Matabeleland SouthProvince Appendices
125
(c)MangweAge Group Males Percent Females Percent Total PercentNS 5 17.2 24 82.8 29 100Under 1 895 49.9 899 50.1 1794 100'1 - 4 4016 50.5 3937 49.5 7953 100'5 - 9 5101 50.2 5055 49.8 10156 100'10 - 14 5362 50.5 5261 49.5 10623 10015 - 19 4851 54.9 3992 45.1 8843 10020 - 24 2446 48.2 2625 51.8 5071 10025 - 29 1512 43.8 1937 56.2 3449 10030 - 34 1209 42.6 1631 57.4 2840 10035 - 39 933 40.8 1356 59.2 2289 10040 - 44 773 40 1158 60 1931 10045 - 49 617 35.8 1107 64.2 1724 10050 - 54 690 36.2 1217 63.8 1907 10055 - 59 635 35.4 1161 64.6 1796 10060 - 64 484 35.1 893 64.9 1377 10065 - 69 496 40.7 722 59.3 1218 10070 - 74 372 36.8 640 63.2 1012 10075 + 762 34.5 1444 65.5 2206 100Total 31159 47.1 35059 52.9 66218 100
(d) GwandaAge Group Males Percent Females Percent Total PercentNS 123 40.5 181 59.5 304 100Under 1 1466 48.9 1534 51.1 3000 100'1 - 4 7086 50.4 6964 49.6 14050 100'5 - 9 8425 49.7 8538 50.3 16963 100'10 - 14 9062 51.8 8442 48.2 17504 10015 - 19 7043 53.3 6176 46.7 13219 10020 - 24 4061 47.7 4447 52.3 8508 10025 - 29 3200 47.3 3564 52.7 6764 10030 - 34 2586 47.4 2869 52.6 5455 10035 - 39 2260 46.8 2566 53.2 4826 10040 - 44 1857 45.0 2266 55.0 4123 10045 - 49 1366 40.8 1984 59.2 3350 10050 - 54 1434 39.0 2241 61.0 3675 10055 - 59 1392 40.5 2046 59.5 3438 10060 - 64 1106 41.9 1536 58.1 2642 10065 - 69 942 42.8 1257 57.2 2199 10070 - 74 884 44.1 1121 55.9 2005 10075 + 1560 41.6 2193 58.4 3753 100Total 55853 48.2 59925 51.8 115778 100

Matabeleland SouthProvince Appendices
126
(e) Insiza
Age Group Males Percent Females Percent Total PercentNS 38 49.4 39 50.6 77 100Under 1 1422 48.2 1530 51.8 2952 100'1 - 4 6054 49.6 6140 50.4 12194 100'5 - 9 7516 50.3 7433 49.7 14949 100'10 - 14 7617 51.5 7178 48.5 14795 10015 - 19 6011 53.2 5297 46.8 11308 10020 - 24 4031 49.8 4066 50.2 8097 10025 - 29 3415 48.3 3654 51.7 7069 10030 - 34 2948 49.9 2954 50.1 5902 10035 - 39 2236 48.8 2345 51.2 4581 10040 - 44 1639 48.1 1770 51.9 3409 10045 - 49 1139 43.5 1478 56.5 2617 10050 - 54 1177 41.3 1673 58.7 2850 10055 - 59 1045 42.8 1399 57.2 2444 10060 - 64 838 43.6 1086 56.4 1924 10065 - 69 670 42.5 907 57.5 1577 10070 - 74 599 45.4 719 54.6 1318 10075 + 943 41.5 1327 58.5 2270 100Total 49338 49.2 50995 50.8 100333 100
(f) Matobo
Age Group Males Percent Females Percent Total PercentNS 21 63.6 12 36.4 33 100Under 1 1317 51.6 1235 48.4 2552 100'1 - 4 5307 50.0 5311 50.0 10618 100'5 - 9 6933 50.9 6691 49.1 13624 100'10 - 14 7504 51.5 7072 48.5 14576 10015 - 19 6249 54.0 5321 46.0 11570 10020 - 24 3406 48.0 3693 52.0 7099 10025 - 29 2312 44.3 2908 55.7 5220 10030 - 34 1831 43.3 2396 56.7 4227 10035 - 39 1544 42.8 2066 57.2 3610 10040 - 44 1340 43.7 1723 56.3 3063 10045 - 49 1094 41.0 1575 59.0 2669 10050 - 54 1165 37.4 1947 62.6 3112 10055 - 59 1097 39.6 1676 60.4 2773 10060 - 64 916 40.7 1333 59.3 2249 10065 - 69 778 40.0 1165 60.0 1943 10070 - 74 766 45.2 929 54.8 1695 10075 + 1338 40.5 1969 59.5 3307 100Total 44918 47.8 49022 52.2 93940 100
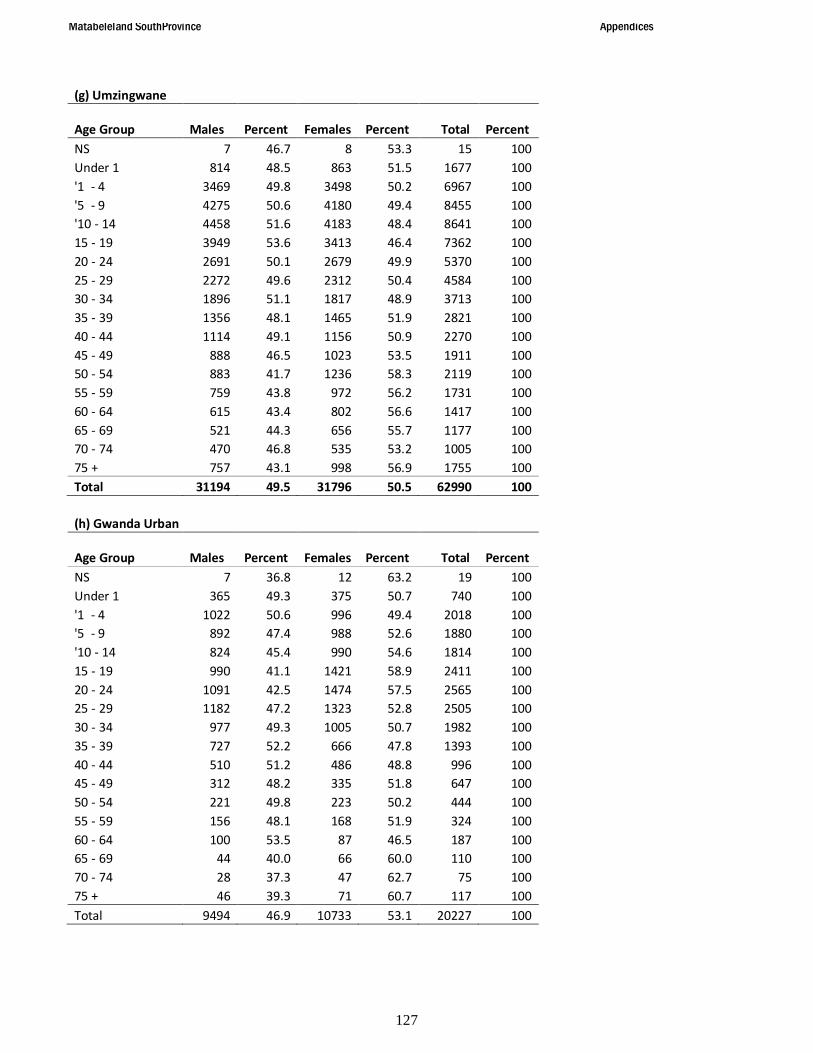
Matabeleland SouthProvince Appendices
127
(g) Umzingwane
Age Group Males Percent Females Percent Total PercentNS 7 46.7 8 53.3 15 100Under 1 814 48.5 863 51.5 1677 100'1 - 4 3469 49.8 3498 50.2 6967 100'5 - 9 4275 50.6 4180 49.4 8455 100'10 - 14 4458 51.6 4183 48.4 8641 10015 - 19 3949 53.6 3413 46.4 7362 10020 - 24 2691 50.1 2679 49.9 5370 10025 - 29 2272 49.6 2312 50.4 4584 10030 - 34 1896 51.1 1817 48.9 3713 10035 - 39 1356 48.1 1465 51.9 2821 10040 - 44 1114 49.1 1156 50.9 2270 10045 - 49 888 46.5 1023 53.5 1911 10050 - 54 883 41.7 1236 58.3 2119 10055 - 59 759 43.8 972 56.2 1731 10060 - 64 615 43.4 802 56.6 1417 10065 - 69 521 44.3 656 55.7 1177 10070 - 74 470 46.8 535 53.2 1005 10075 + 757 43.1 998 56.9 1755 100Total 31194 49.5 31796 50.5 62990 100
(h) Gwanda Urban
Age Group Males Percent Females Percent Total PercentNS 7 36.8 12 63.2 19 100Under 1 365 49.3 375 50.7 740 100'1 - 4 1022 50.6 996 49.4 2018 100'5 - 9 892 47.4 988 52.6 1880 100'10 - 14 824 45.4 990 54.6 1814 10015 - 19 990 41.1 1421 58.9 2411 10020 - 24 1091 42.5 1474 57.5 2565 10025 - 29 1182 47.2 1323 52.8 2505 10030 - 34 977 49.3 1005 50.7 1982 10035 - 39 727 52.2 666 47.8 1393 10040 - 44 510 51.2 486 48.8 996 10045 - 49 312 48.2 335 51.8 647 10050 - 54 221 49.8 223 50.2 444 10055 - 59 156 48.1 168 51.9 324 10060 - 64 100 53.5 87 46.5 187 10065 - 69 44 40.0 66 60.0 110 10070 - 74 28 37.3 47 62.7 75 10075 + 46 39.3 71 60.7 117 100Total 9494 46.9 10733 53.1 20227 100

Matabeleland SouthProvince Appendices
128
(i) Beitbridge Urban
Age Group Males Percent Females Percent Total PercentNS 6 33.3 12 66.7 18 100Under 1 803 49.5 819 50.5 1622 100'1 - 4 2359 49.7 2390 50.3 4749 100'5 - 9 1780 47.9 1936 52.1 3716 100'10 - 14 1322 44.9 1623 55.1 2945 10015 - 19 1485 39.9 2239 60.1 3724 10020 - 24 2488 42.9 3310 57.1 5798 10025 - 29 3187 48.1 3440 51.9 6627 10030 - 34 2700 53.4 2359 46.6 5059 10035 - 39 1869 55.6 1494 44.4 3363 10040 - 44 1127 55.8 892 44.2 2019 10045 - 49 539 57.4 400 42.6 939 10050 - 54 327 54.0 279 46.0 606 10055 - 59 195 47.7 214 52.3 409 10060 - 64 109 47.4 121 52.6 230 10065 - 69 59 44.7 73 55.3 132 10070 - 74 36 49.3 37 50.7 73 10075 + 41 38.0 67 62.0 108 100Total 20432 48.5 21705 51.5 42137 100
(j) Plumtree
Age Group Males Percent Females Percent Total PercentNS 1 100 - - 1 100Under 1 204 48.5 217 51.5 421 100'1 - 4 658 49.6 668 50.4 1326 100'5 - 9 615 48.6 650 51.4 1265 100'10 - 14 530 48.1 572 51.9 1102 10015 - 19 494 36.5 858 63.5 1352 10020 - 24 575 40.8 834 59.2 1409 10025 - 29 571 43.3 748 56.7 1319 10030 - 34 521 50.7 506 49.3 1027 10035 - 39 360 51.4 341 48.6 701 10040 - 44 282 53.5 245 46.5 527 10045 - 49 169 48.4 180 51.6 349 10050 - 54 140 49.1 145 50.9 285 10055 - 59 110 47.6 121 52.4 231 10060 - 64 42 41.2 60 58.8 102 10065 - 69 37 46.3 43 53.8 80 10070 - 74 19 45.2 23 54.8 42 10075 + 33 37.9 54 62.1 87 100Total 5361 46.1 6265 53.9 11626 100

Matabeleland SouthProvince Appendices
129
(K) Total
Age Group Males Percent Females Percent Total PercentNS 288 41.9 399 58.1 687 100Under 1 9710 49.5 9925 50.5 19635 100'1 - 4 40744 50.1 40657 49.9 81401 100'5 - 9 48657 50.0 48665 50.0 97322 100'10 - 14 50161 5.01 48226 49.0 98387 10015 - 19 42508 52.4 38585 47.6 81093 10020 - 24 26640 46.9 30181 53.1 56821 10025 - 29 21826 46.1 25554 53.9 47380 10030 - 34 17784 47.3 19802 52.7 37586 10035 - 39 13748 46.0 16127 54.0 29875 10040 - 44 10625 45.4 12793 54.6 23418 10045 - 49 7661 41.5 10800 58.5 18461 10050 - 54 7768 38.5 12405 61.5 20173 10055 - 59 6983 39.9 10505 60.1 17488 10060 - 64 5561 40.5 8179 59.5 13740 10065 - 69 4727 40.9 6825 59.1 11552 10070 - 74 4166 42.3 5684 57.7 9850 10075 + 7410 39.0 11614 61.0 19024 100Total 326967 47.8 356926 52.2 683893 100

Matabeleland SouthProvince Appendices
130
Table A4.1: Distribution of Population Age 3+ by School Attendance by Sex, Matabeleland South Province, Zimbabwe 2012 Census(a)Never been at SchoolDistrict Males Females TotalBeitbridge Rural 4255 7106 11361Bulilima 3468 5280 8748Mangwe 2392 3453 5845Gwanda 2621 4082 6703Insiza 2898 4077 6975Matobo 2788 3635 6423Umzingwane 1718 2268 3986Gwanda Urban 206 265 471Beitbridge Urban 774 930 1704Plumtree 229 312 541Total 21349 31408 52757
(b)At SchoolDistrict Males Females TotalBeitbridge Rural 12717 12551 25268Bulilima 14034 14397 28431Mangwe 10522 10885 21407Gwanda 19907 19961 39868Insiza 16431 16320 32751Matobo 15755 15643 31398Umzingwane 10192 9966 20158Gwanda Urban 2560 2939 5499Beitbridge Urban 4120 4732 8852Plumtree 1521 1692 3213Total 107759 109086 216845
(c)Left SchoolDistrict Males Females TotalBeitbridge Rural 16382 18874 35256Bulilima 20353 25078 45431Mangwe 15304 17756 33060Gwanda 28114 30652 58766Insiza 25270 25667 50937Matobo 22310 25721 48031Umzingwane 16595 16888 33483Gwanda Urban 5743 6573 12316Beitbridge Urban 13372 13782 27154Plumtree 3019 3676 6695Total 166462 184667 351129

Matabeleland SouthProvince Appendices
131

Matabeleland SouthProvince Appendices
132
Table A4.3: Population Age 3 - 24 Currently at School by Single Age and Sex, Matabeleland South Province, Zimbabwe 2012 CensusAGE No Education Primary Secondary Tertiary Not known Total
Males Females Males Females Males Females Males Females Males Females Males Females 3 591 706 - - - - - - - - 591 7064 2303 2464 - - - - - - - - 2303 24645 5174 5379 771 860 - - - - 12 14 5957 62536 3389 3070 4626 4929 - - - - 3 9 8018 80087 1079 918 8060 8122 - - - - - 6 9139 90468 357 294 8976 9276 - - - - 2 1 9335 95719 146 89 9436 9572 - - - - 3 2 9585 9663
10 43 37 9215 9269 - - - - - 1 9258 930711 19 22 9319 9269 - - - - - 2 9338 929312 16 14 10592 10031 299 459 - - 2 - 10909 1050413 7 4 6416 5574 1883 2789 - - 1 - 8307 836714 7 7 3063 2036 3999 5273 - - - 2 7069 731815 3 7 1008 527 4428 5376 - - - - 5439 591016 3 2 - - 4686 5100 - - 1 - 4690 510217 - 2 - - 3488 3411 - - 1 1 3489 341418 2 3 - - 1968 1811 28 29 1 1 1999 184419 - 1 - - 952 836 43 58 - - 995 89520 2 - - - 442 415 86 85 - - 530 50021 - 1 - - 250 226 103 106 - - 353 33322 1 - - - 91 128 97 115 - 1 189 24423 1 1 - - 57 59 103 116 - - 161 17624 2 2 - - 29 54 66 81 - - 97 137
Total 13145 13023 71482 69465 22572 25937 526 590 26 40 107751 109055

Matabeleland SouthProvince Appendices
133
Table A4.4: Population Age 3+ by Age Group, Sex and highest level of Education Completed, Matabeleland South Province, Zimbabwe 2012 Census
AGE No Education Primary Secondary Tertiary Not known Total Males Females Males Females Males Females Males Females Males Females Males Females
3-4 4687 4924 - - - - - - - - 4687 49245-9 20497 19704 22947 24193 - - - - 18 25 43462 4392210-14 431 301 46721 43876 2418 3612 - - 5 6 49575 4779515 - 19 104 82 18316 11400 23412 26675 25 23 55 20 41912 3820020 - 24 78 49 9963 8384 15704 20914 371 433 89 29 26205 2980925 - 29 60 75 7377 7644 12837 16156 1135 1285 80 37 21489 2519730 - 34 34 41 5837 6569 10263 11567 1289 1258 58 23 17481 1945835 - 39 38 35 4573 6030 7726 8760 1106 951 56 32 13499 1580840 - 44 35 48 3064 5110 6096 6437 1138 700 50 35 10383 1233045 - 49 64 123 2543 5544 3699 3493 933 518 51 58 7290 973650 - 54 97 225 4377 7965 1921 1572 545 292 90 117 7030 1017155 - 59 91 170 4611 7270 1142 947 293 139 79 111 6216 863760 - 64 75 139 3845 5581 702 564 182 109 89 81 4893 647465 - 69 62 140 3314 4470 519 323 166 118 73 80 4134 513170 - 74 68 175 2926 3471 345 166 170 98 60 67 3569 397775 + 175 435 4761 5722 335 189 248 99 160 259 5679 6704NS 10 20 56 62 36 22 2 4 29 46 133 154Total 26606 26686 145231 153291 87155 101397 7603 6027 1042 1026 267637 288427

Matabeleland SouthProvince Appendices
134
Table A6.1 Number of Women, Children Ever Born, Births in the Last 12 Months, Average Parities and ASFR by Age Group, Matabeleland Province, Zimbabwe 2012 Census
Children Ever BornAge Of Women Number of
WomenMale Female Total Total
BirthsAverage Parities
ASFR
15 - 19 38585 15234 21568 36802 3319 0.954 0.086020 - 24 30181 20500 22728 43228 5950 1.432 0.197125 - 29 25554 26487 27629 54116 4331 2.118 0.169530 - 34 19802 28049 28742 56791 2610 2.868 0.131835 - 39 16127 28877 28926 57803 1472 3.584 0.091340 - 44 12793 26224 26629 52853 519 4.131 0.040645 - 49 10800 24961 24737 49698 109 4.602 0.0101Total 153842 170332 180959 351291 18310
Table A6. 2: Number of Women, Children Ever Born, Births in the Last 12 Months, Average Parities and ASFR by Urban /Rural Residence, Matabeleland South Zimbabwe 2012 Census
UrbanChildren Ever Born
Age of Women
Number of Women
Male Female Total Total Births
Average Parities
ASFR
15 - 19 5954 1605 2238 3843 387 0.645 0.065020 - 24 7210 3913 4095 8008 1183 1.111 0.164125 - 29 6962 5988 6222 12210 1084 1.754 0.155730 - 34 4902 5814 5764 11578 609 2.362 0.124235 - 39 3208 4518 4475 8993 248 2.803 0.077340 - 44 2064 3326 3318 6644 43 3.219 0.020845 - 49 1237 2235 2265 4500 12 3.638 0.0097Total 31537 27399 28377 55776 3566
Table A6.3: Number of Women, Children Ever Born, Births in the Last 12 Months, Average Parities and ASFR by Level of Education of Mother, Mat South Province, Zimbabwe 2012 Census
No EducationChildren Ever Born
Age of Women Total Women
Male Female Total Total Births
Average Parities
ASFR
15 - 19 82 24 36 60 3 0.732 0.036620 - 24 49 26 34 60 8 1.224 0.163325 - 29 75 87 70 157 9 2.093 0.120030 - 34 41 45 55 100 4 2.439 0.097635 - 39 35 85 45 130 2 3.714 0.057140 - 44 48 102 95 197 3 4.104 0.062545 - 49 123 317 280 597 - 4.854Total 453 686 615 1301 29

Matabeleland SouthProvince Appendices
135
PrimaryChildren Ever Born
Age of Women
Total Women
Male Female Total Total Births
Average Parities
ASFR
15 - 19 11400 5031 6559 11590 1284 1.017 0.112620 - 24 8384 6661 7117 13778 1786 1.643 0.213025 - 29 7644 9242 9638 18880 1358 2.470 0.177730 - 34 6569 10625 10926 21551 908 3.281 0.138235 - 39 6030 12119 12259 24378 635 4.043 0.105340 - 44 5110 11811 11770 23581 223 4.615 0.043645 - 49 5544 14065 13717 27782 60 5.011 0.0108Total 50681 69554 71986 141540 6254
Secondary and AboveChildren Ever Born
Age of Women
Total Women Male Female Total
Total Births
Average Parities ASFR
15 - 19 26698 9999 14733 24732 1999 0.926 0.074920 - 24 21347 13552 15294 28846 4090 1.351 0.191625 - 29 17441 16780 17534 34314 2917 1.967 0.167230 - 34 12825 16894 17241 34135 1653 2.662 0.128935 - 39 9711 16098 16069 32167 809 3.312 0.083340 - 44 7137 13272 13745 27017 273 3.785 0.038345 - 49 4011 7806 7976 15782 39 3.935 0.0097Total 99170 94401 102592 196993 11780
Not KnownChildren Ever Born
Age of Women
Total Women Male Female Total
Total Births
Average Parities ASFR
15 - 19 20 12 8 20 3 1.000 0.150020 - 24 29 22 19 41 3 1.414 0.103425 - 29 37 33 23 56 4 1.514 0.108130 - 34 23 29 29 58 2 2.522 0.087035 - 39 32 53 49 102 4 3.188 0.125040 - 44 35 78 64 142 - 4.05745 - 49 58 156 120 276 1 4.759 0.0172Total 234 383 312 695 17

Matabeleland SouthProvince Appendices
136
Total Education Children Ever Born
Age of Women
Total Women Male Female Total
Total Births
Average Parities ASFR
15 - 19 38201 15066 21336 36402 3289 0.953 0.086120 - 24 29810 20264 22464 42728 5887 1.433 0.197525 - 29 25199 26143 27269 53412 4288 2.120 0.170230 - 34 19460 27595 28255 55850 2568 2.870 0.132035 - 39 15808 28355 28422 56777 1450 3.592 0.091740 - 44 12331 25265 25675 50940 499 4.131 0.040545 - 49 9736 22344 22093 44437 100 4.564 0.0103Total 150545 165032 175514 340546 18081
Table A6.4 Number of Women, Children Ever Born, Births in the Last 12 Months, Average Parities and ASFR by Urban/Rural Residence, MatabelelandSouth Province, Zimbabwe 2012 Census
Beitbridge RuralChildren Ever Born
Age of Women
Number of Women Male Female Total
Total Births
Average Parities ASFR
15 - 19 4446 2218 2707 4925 493 1.108 0.110920 - 24 3447 2834 2871 5705 749 1.655 0.217325 - 29 2987 3568 3754 7322 576 2.451 0.192830 - 34 2126 3540 3637 7177 311 3.376 0.146335 - 39 1933 3964 3934 7898 193 4.086 0.099840 - 44 1428 3315 3189 6504 75 4.555 0.052545 - 49 1141 2890 2730 5620 20 4.926 0.0175Total 17508 22329 22822 45151 2417
BulilimaChildren Ever Born
Age of Women
Number of Women Male Female Total
Total Births
Average Parities ASFR
15 - 19 5422 2316 3523 5839 474 1.077 0.087420 - 24 3606 2471 2930 5401 714 1.498 0.198025 - 29 2681 2758 2903 5661 411 2.112 0.153330 - 34 2139 2876 3118 5994 266 2.802 0.124435 - 39 1895 3283 3382 6665 185 3.517 0.097640 - 44 1669 3464 3504 6968 80 4.175 0.047945 - 49 1577 3593 3592 7185 17 4.556 0.0108Total 18989 20761 22952 43713 2147

Matabeleland SouthProvince Appendices
137
MangweChildren Ever Born
Age of Women
Number of Women Male Female Total
Total Births
Average Parities ASFR
15 - 19 3992 1741 2598 4339 336 1.087 0.084220 - 24 2625 1807 2117 3924 530 1.495 0.201925 - 29 1937 2015 2068 4083 303 2.108 0.156430 - 34 1631 2331 2423 4754 240 2.915 0.147135 - 39 1356 2489 2488 4977 135 3.670 0.099640 - 44 1158 2309 2530 4839 55 4.179 0.047545 - 49 1107 2548 2525 5073 10 4.583 0.0090Total 13806 15240 16749 31989 1609
Gwanda RuralChildren Ever Born
Age of WomenNumber of
Women Male Female TotalTotal Births
Average Parities ASFR
15 - 19 6176 2354 3366 5720 559 0.926 0.090520 - 24 4447 3098 3499 6597 903 1.483 0.203125 - 29 3564 3869 4065 7934 647 2.226 0.181530 - 34 2869 4304 4336 8640 378 3.012 0.131835 - 39 2566 4845 4747 9592 237 3.738 0.092440 - 44 2266 4750 4838 9588 72 4.231 0.031845 - 49 1984 4683 4620 9303 13 4.689 0.0066Total 23872 27903 29471 57374 2809
InsizaChildren Ever Born
Age of Women
Number of Women Male Female Total
Total Births
Average Parities ASFR
15 - 19 5297 2159 2868 5027 475 0.949 0.089720 - 24 4066 3046 3333 6379 888 1.569 0.218425 - 29 3654 4257 4412 8669 661 2.372 0.180930 - 34 2954 4597 4683 9280 422 3.142 0.142935 - 39 2345 4649 4630 9279 251 3.957 0.107040 - 44 1770 3981 4047 8028 85 4.536 0.048045 - 49 1478 3704 3783 7487 18 5.066 0.0122Total 21564 26393 27756 54149 2800
MatoboChildren Ever Born
Age of WomenNumber of
Women Male Female TotalTotal Births
Average Parities ASFR
15 - 19 5321 2026 3008 5034 446 0.946 0.083820 - 24 3693 2526 2900 5426 755 1.469 0.204425 - 29 2908 3027 3139 6166 528 2.120 0.181630 - 34 2396 3464 3521 6985 316 2.915 0.131935 - 39 2066 3862 3801 7663 187 3.709 0.090540 - 44 1723 3692 3685 7377 74 4.281 0.042945 - 49 1575 3656 3604 7260 19 4.610 0.0121Total 19682 22253 23658 45911 2325

Matabeleland SouthProvince Appendices
138
UmzingwaneChildren Ever Born
Age of WomenNumber of
Women Male Female TotalTotal Births
Average Parities ASFR
15 - 19 3413 1149 1668 2817 272 0.825 0.079720 - 24 2679 1764 1925 3689 516 1.377 0.192625 - 29 2312 2334 2408 4742 371 2.051 0.160530 - 34 1817 2448 2533 4981 221 2.741 0.121635 - 39 1465 2365 2546 4911 101 3.352 0.068940 - 44 1156 2180 2322 4502 47 3.894 0.040745 - 49 1023 2271 2256 4527 3 4.425 0.0029Total 13865 14511 15658 30169 1531Gwanda
Children Ever Born
Age of WomenNumber of Women Male Female Total
Total Births
Average Parities ASFR
15 - 19 1421 426 625 1051 76 0.740 0.053520 - 24 1474 704 863 1567 221 1.063 0.149925 - 29 1323 1102 1160 2262 217 1.710 0.164030 - 34 1005 1113 1157 2270 127 2.259 0.126435 - 39 666 841 878 1719 63 2.581 0.094640 - 44 486 744 740 1484 7 3.053 0.014445 - 49 335 604 566 1170 4 3.493 0.0119Total 6710 5534 5989 11523 715
BeitbridgeChildren Ever Born
Age of WomenNumber of
Women Male Female TotalTotal Births
Average Parities ASFR
15 - 19 2239 593 821 1414 135 0.632 0.060320 - 24 3310 1821 1780 3601 538 1.088 0.162525 - 29 3440 2957 3052 6009 511 1.747 0.148530 - 34 2359 2774 2786 5560 264 2.357 0.111935 - 39 1494 2085 2058 4143 98 2.773 0.065640 - 44 892 1391 1371 2762 16 3.096 0.017945 - 49 400 692 722 1414 4 3.535 0.0100Total 14134 12313 12590 24903 1566
PlumtreeChildren Ever Born
Age of Women
Number of Women Male Female Total
Total Births
Average Parities ASFR
15 - 19 858 252 384 636 53 0.741 0.061820 - 24 834 429 510 939 136 1.126 0.163125 - 29 748 600 668 1268 106 1.695 0.141730 - 34 506 602 548 1150 65 2.273 0.128535 - 39 341 494 462 956 22 2.804 0.064540 - 44 245 398 403 801 8 3.269 0.032745 - 49 180 320 339 659 1 3.661 0.0056Total 3712 3095 3314 6409 391

Matabeleland SouthProvince Appendices
139
Total Mat South
Children Ever BornAge of
WomenNumber of
Women Male Female TotalTotal Births
Average Parities ASFR
15 - 19 38585 15234 21568 36802 3319 0.954 0.086020 - 24 30181 20500 22728 43228 5950 1.432 0.197125 - 29 25554 26487 27629 54116 4331 2.118 0.169530 - 34 19802 28049 28742 56791 2610 2.868 0.131835 - 39 16127 28877 28926 57803 1472 3.584 0.091340 - 44 12793 26224 26629 52853 519 4.131 0.040645 - 49 10800 24961 24737 49698 109 4.602 0.0101Not Stated 153842 170332 180959 351291 18310 2.283 0.1190Total 294629 80037 81426 161463 18310
Table A6.5: Number of Women , Children Ever Born, Births in the Last 12 Months, Average Parities and ASFR by Marital Status, Zimbabwe 2012 Census.
Never MarriedChildren Ever Born
Age of WomenNumber of
Women Male Female TotalTotal Births
Average Parities ASFR
15 - 19 32466 11951 18222 30173 1712 0.929 0.052720 - 24 13257 6987 9362 16349 1894 1.233 0.142925 - 29 5755 4180 5055 9235 622 1.605 0.108130 - 34 3004 2718 3139 5857 249 1.950 0.082935 - 39 1730 1848 2126 3974 113 2.297 0.065340 - 44 1043 1249 1427 2676 36 2.566 0.034545 - 49 633 860 907 1767 2 2.791 0.0032Total 57888 29793 40238 70031 4628
MarriedChildren Ever Born
Age of WomenNumber of
Women Male Female TotalTotal Births
Average Parities ASFR
15 - 19 4788 2632 2491 5123 1392 1.070 0.290720 - 24 14718 11787 11344 23131 3654 1.572 0.248325 - 29 16998 19471 19291 38762 3359 2.280 0.197630 - 34 13879 21525 21560 43085 2096 3.104 0.151035 - 39 11322 22064 21657 43721 1191 3.862 0.105240 - 44 8501 18816 18816 37632 395 4.427 0.046545 - 49 6885 16966 16653 33619 91 4.883 0.0132Total 77091 113261 111812 225073 12178
Divorced/separatedChildren Ever Born
Age of WomenNumber of
Women Male Female TotalTotal Births
Average Parities ASFR
15 - 19 537 316 403 719 171 1.339 0.318420 - 24 1848 1506 1728 3234 352 1.750 0.190525 - 29 2228 2219 2634 4853 279 2.178 0.125230 - 34 1886 2376 2536 4912 159 2.604 0.084335 - 39 1510 2291 2474 4765 83 3.156 0.055040 - 44 1237 2114 2259 4373 37 3.535 0.029945 - 49 1036 2091 2093 4184 5 4.039 0.0048Total 10282 12913 14127 27040 1086

Matabeleland SouthProvince Appendices
140
WidowedChildren Ever Born
Age of WomenNumber of
Women Male Female TotalTotal Births
Average Parities ASFR
15 - 19 40 36 24 60 8 1.500 0.200020 - 24 152 99 131 230 19 1.513 0.125025 - 29 454 518 532 1050 54 2.313 0.118930 - 34 949 1351 1419 2770 95 2.919 0.100135 - 39 1533 2630 2635 5265 84 3.434 0.054840 - 44 1987 4004 4089 8093 51 4.073 0.025745 - 49 2228 5009 5055 10064 11 4.517 0.0049Total 7343 13647 13885 27532 322
Table A7. 1: Number of Women, Children Surviving, by Sex and Age of Mother by District, Matabeleland South Zimbabwe 2012 CensusBeitbridge Rural
Surviving ChildrenAge of Women Male Female total
15 - 19 2175 2675 485020 - 24 2652 2738 539025 - 29 3309 3536 684530 - 34 3259 3351 661035 - 39 3618 3640 725840 - 44 2992 2911 590345 - 49 2609 2458 5067Total 20614 21309 41923
BulilimaSurviving Children
Age of Women Male Female total15 - 19 2279 3502 578120 - 24 2378 2841 521925 - 29 2586 2745 533130 - 34 2690 2943 563335 - 39 3080 3190 627040 - 44 3252 3298 655045 - 49 3335 3326 6661Total 19600 21845 41445Mangwe
Surviving ChildrenAge of Women Male Female total15 - 19 1721 2579 430020 - 24 1743 2057 380025 - 29 1891 1965 385630 - 34 2201 2299 450035 - 39 2342 2381 472340 - 44 2183 2400 458345 - 49 2396 2366 4762Total 14477 16047 30524

Matabeleland SouthProvince Appendices
141
Gwanda RuralSurviving Children
Age of Women Male Female total15 - 19 2320 3334 565420 - 24 2963 3390 635325 - 29 3602 3830 743230 - 34 3976 4047 802335 - 39 4477 4451 892840 - 44 4401 4508 890945 - 49 4336 4267 8603Total 26075 27827 53902
InsizaSurviving Children
Age of Women Male Female total15 - 19 2133 2832 496520 - 24 2875 3184 605925 - 29 3943 4163 810630 - 34 4275 4397 867235 - 39 4312 4366 867840 - 44 3669 3779 744845 - 49 3364 3478 6842Total 24571 26199 50770
MatoboSurviving Children
Age of Women Male Female total15 - 19 2006 2982 498820 - 24 2441 2815 525625 - 29 2871 2991 586230 - 34 3254 3350 660435 - 39 3641 3615 725640 - 44 3456 3481 693745 - 49 3434 3384 6818Total 21103 22618 43721
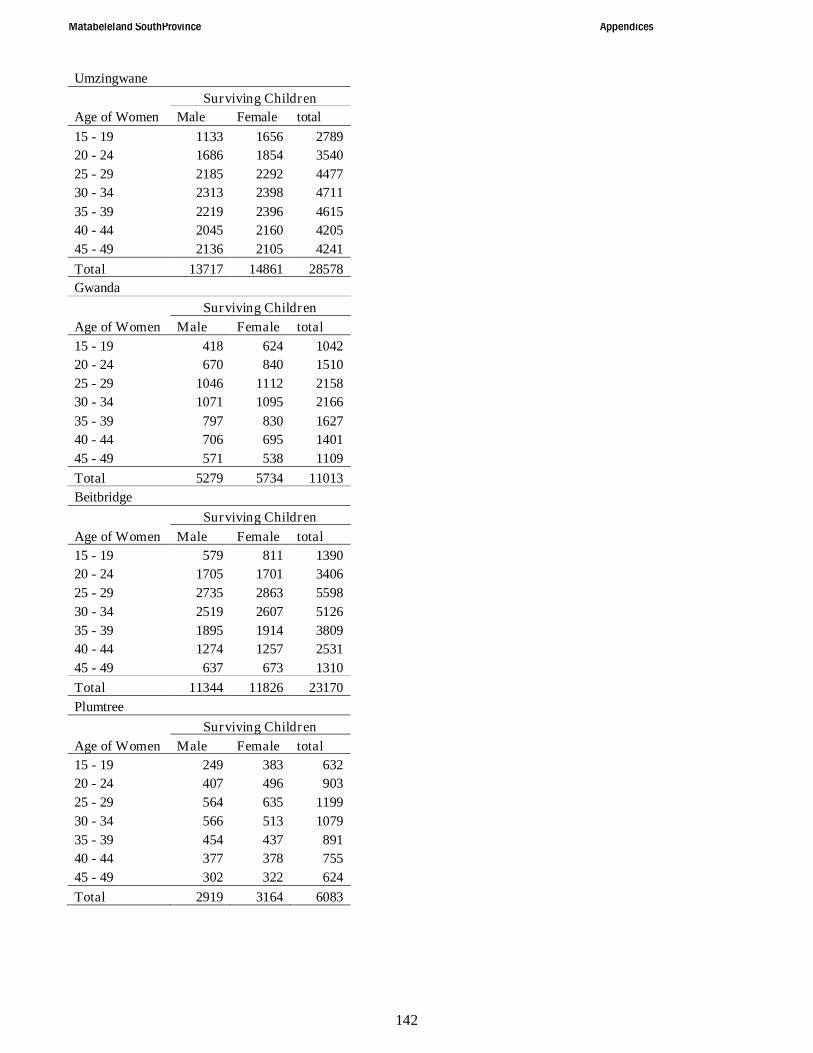
Matabeleland SouthProvince Appendices
142
UmzingwaneSurviving Children
Age of Women Male Female total15 - 19 1133 1656 278920 - 24 1686 1854 354025 - 29 2185 2292 447730 - 34 2313 2398 471135 - 39 2219 2396 461540 - 44 2045 2160 420545 - 49 2136 2105 4241Total 13717 14861 28578Gwanda
Surviving ChildrenAge of Women Male Female total15 - 19 418 624 104220 - 24 670 840 151025 - 29 1046 1112 215830 - 34 1071 1095 216635 - 39 797 830 162740 - 44 706 695 140145 - 49 571 538 1109Total 5279 5734 11013Beitbridge
Surviving ChildrenAge of Women Male Female total15 - 19 579 811 139020 - 24 1705 1701 340625 - 29 2735 2863 559830 - 34 2519 2607 512635 - 39 1895 1914 380940 - 44 1274 1257 253145 - 49 637 673 1310Total 11344 11826 23170Plumtree
Surviving ChildrenAge of Women Male Female total15 - 19 249 383 63220 - 24 407 496 90325 - 29 564 635 119930 - 34 566 513 107935 - 39 454 437 89140 - 44 377 378 75545 - 49 302 322 624Total 2919 3164 6083

Matabeleland SouthProvince Appendices
143
TotalSurviving Children
Age of Women Male Female total15 - 19 15013 21378 3639120 - 24 19520 21916 4143625 - 29 24732 26132 5086430 - 34 26124 27000 5312435 - 39 26835 27220 5405540 - 44 24355 24867 4922245 - 49 23120 22917 46037Total 159699 171430 331129
Table A7. 2: Number of Women, Children Surviving, by Education and Age of Mother, By Sex, Zimbabwe 2012Census
No EducationSurviving Children
Age of Women Male Female total15 - 19 23 36 5920 - 24 26 33 5925 - 29 79 66 14530 - 34 42 52 9435 - 39 83 44 12740 - 44 95 85 18045 - 49 278 260 538Total 626 576 1202
PrimarySurviving Children
Age of Women Male Female total15 - 19 4933 6474 1140720 - 24 6255 6809 1306425 - 29 8502 9008 1751030 - 34 9822 10149 1997135 - 39 11196 11463 2265940 - 44 10918 10919 2183745 - 49 13000 12653 25653Total 64626 67475 132101
Secondary AboveSurviving Children
Age of Women Male Female total15 - 19 9882 14632 2451420 - 24 12993 14810 2780325 - 29 15799 16689 3248830 - 34 15821 16327 3214835 - 39 15040 15196 3023640 - 44 12419 12947 2536645 - 49 7365 7525 14890

Matabeleland SouthProvince Appendices
144
Total 89319 98126 187445
Not KnownSurviving Children
Age of Women Male Female total15 - 19 11 8 1920 - 24 13 19 3225 - 29 31 23 5430 - 34 28 28 5635 - 39 53 48 10140 - 44 75 58 13345 - 49 144 111 255Total 355 295 650
TotalSurviving Children
Age of Women Males Females Total15 - 19 14849 21150 3599920 - 24 19290 21671 4096125 - 29 24412 25790 5020230 - 34 25715 26560 5227535 - 39 26372 26751 5312340 - 44 23509 24010 4751945 - 49 20787 20549 41336Total 154934 166481 321415

Matabeleland SouthProvince Appendices
145

Matabeleland SouthProvince Appendices
146

Matabeleland SouthProvince Appendices
147

Matabeleland SouthProvince Appendices
148
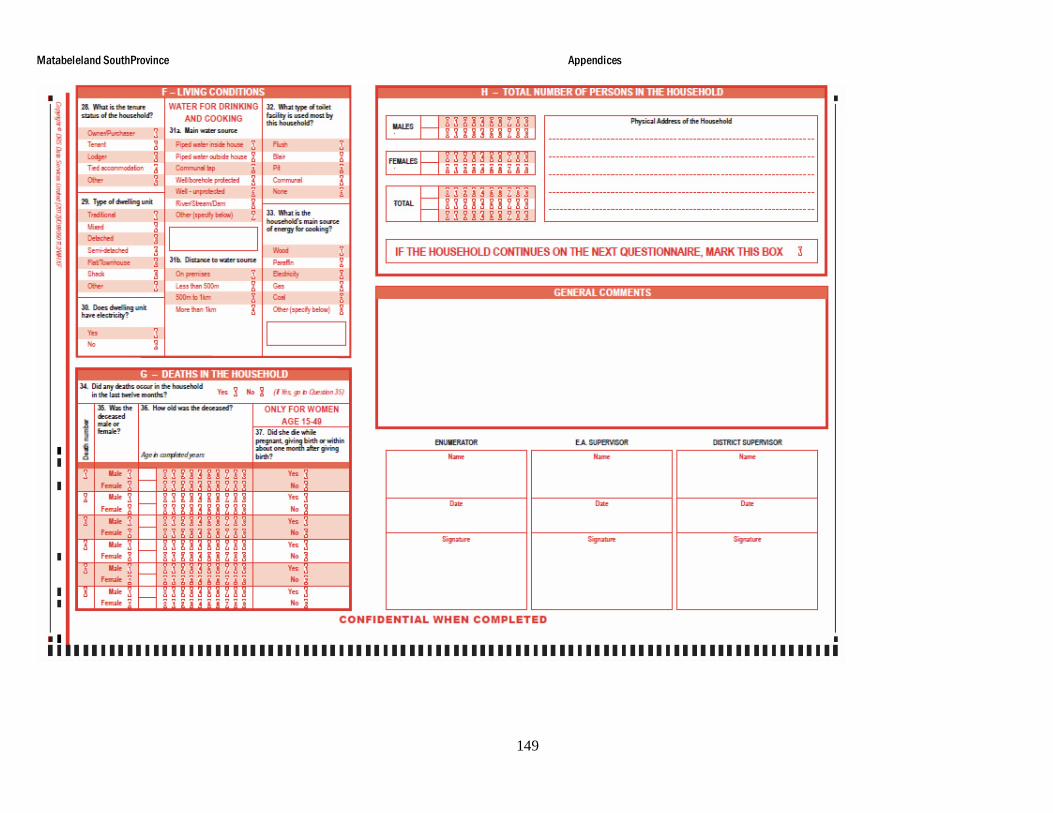
Matabeleland SouthProvince Appendices
149