provincial profile: western cape - statistics south africa · provincial profile: western cape the...
TRANSCRIPT
Provincial profile: Western Cape
The South Africa I know, the home I understand
Provincial profile: Western Cape
Census 2011
Statistics South Africa
Pali LehohlaStatistician-GeneralReport No. 03-01-70 (2011)
Statistics South Africa
Census 2011 Provincial Profile: Western Cape, Report 03-01-70
ii
Census 2011 Provincial Profile: Western Cape / Statistics South Africa Published by Statistics South Africa, Private Bag X44, Pretoria 0001 © Statistics South Africa, 2014 Users may apply or process this data, provided Statistics South Africa (Stats SA) is acknowledged as the original source of the data; that it is specified that the application and/or analysis is the result of the user's independent processing of the data; and that neither the basic data nor any reprocessed version or application thereof may be sold or offered for sale in any form whatsoever without prior permission from Stats SA. Stats SA Library Cataloguing-in-Publication (CIP) Data Census 2011 Provincial Profile: Western Cape / Statistics South Africa. Pretoria: Statistics South Africa 2014 61p. [Report No. 03-01-70 (2011)] ISBN: 978-0-621-43209-1 A complete set of Stats SA publications is available at the Stats SA Library and the following libraries: National Library of South Africa, Pretoria Division National Library of South Africa, Cape Town Division Natal Society Library, Pietermaritzburg Library of Parliament, Cape Town Bloemfontein Public Library Johannesburg Public Library Eastern Cape Library Services, King William's Town Central Regional Library, Polokwane Central Reference Library, Nelspruit Central Reference Collection, Kimberley Central Reference Library, Mmabatho This publication is available on the Stats SA website: www.statssa.gov.za Enquiries: Western Cape Provincial Office Tel: (021) 481 5500
Statistics South Africa
Census 2011 Provincial Profile: Western Cape, Report 03-01-70
iii
Contents Chapter 1: Introduction ................................................................................................................... 1 1.1 Overview............................................................................................................................................. 1 1.2 How the count was done.................................................................................................................... 1
1.2.1 Planning ...................................................................................................................................... 1 1.2.2 Pre-enumeration ........................................................................................................................ 1 1.2.3 Listing, publicity and enumeration ............................................................................................. 2 1.2.4 Data processing .......................................................................................................................... 2 1.2.5 Data editing and validation system ............................................................................................ 2
1.2.5.1 Editing team ..................................................................................................................... 3 1.2.5.2 Role of the team ............................................................................................................... 3 1.2.5.3 Editing strategy for Census 2011 ...................................................................................... 3
1.2.6 Independent monitoring and evaluation of census field activities ............................................ 3 1.2.7 Post-enumeration survey (PES) .................................................................................................. 4
1.2.7.1 Preparations for the PES .................................................................................................. 5 1.2.7.2 Methodology .................................................................................................................... 5 1.2.7.3 Sampling ........................................................................................................................... 6 1.2.7.4 Questionnaire development ............................................................................................ 6 1.2.7.5 Fieldwork methodology ................................................................................................... 6 1.2.7.6 Matching and reconciliation methodology ...................................................................... 7 1.2.7.7 PES data collection ........................................................................................................... 7 1.2.7.8 Matching and reconciliation ............................................................................................. 8 1.2.7.9 Estimation and tabulation ................................................................................................ 9
1.2.8 Conclusion ................................................................................................................................10 Chapter 2: Geography of South Africa ........................................................................................... 11 2.1 Provincial boundary changes: 2001 to 2011 ....................................................................................11 2.2 Local municipal boundary changes, 2001–2011 ..............................................................................14 2.3 Comparing Census 2011 with previous censuses .............................................................................16 Chapter 3: Population size and distribution ................................................................................... 17 3.1 National and provincial ....................................................................................................................17 3.2 Age and sex structure .......................................................................................................................22
3.2.1 Pyramids ...................................................................................................................................22 3.3 Broad age groups..............................................................................................................................24 3.4 Language ..........................................................................................................................................26
3.4.1 Province ....................................................................................................................................26 3.4.2 District ......................................................................................................................................27
3.5 Migration ..........................................................................................................................................28 3.6 General health and functioning........................................................................................................29 3.7 Education ..........................................................................................................................................30
3.7.1 School attendance ....................................................................................................................30 3.7.2 Type of institution ....................................................................................................................31 3.7.3 Educational attainment ............................................................................................................32

Statistics South Africa
Census 2011 Provincial Profile: Western Cape, Report 03-01-70
iv
3.8 Labour force .....................................................................................................................................33 3.8.1 District ......................................................................................................................................33
Chapter 4: Results pertaining to households .................................................................................. 35 4.1 Household information ....................................................................................................................35 4.2 Housing .............................................................................................................................................37
4.2.1 Type of dwelling .......................................................................................................................37 4.2.2 Refuse disposal .........................................................................................................................38 4.2.3 Toilet facilities ..........................................................................................................................39 4.2.4 Electricity for lighting, cooking, heating ...................................................................................40 4.2.5 Access to water ........................................................................................................................41
4.3 Household goods ..............................................................................................................................42 Chapter 5: Conclusion ................................................................................................................... 43 Terms and definitions .................................................................................................................... 53
List of tables Table 1.1: Net census coverage error: Total and rate by province ........................................................10 Table 2.1: Geographical land area changes since 2001 .........................................................................11 Table 3.1: Population and percentage share by province, censuses of 1996, 2001 and 2011 ..............17 Table 3.2: Distribution of the population by district municipality and municipality, censuses of 1996, 2001 and 2011 ..............................................................................................................................18 Table 3.3: Population distribution and percentage change by district municipality and municipality, censuses of 1996, 2001 and 2011 ....................................................................................19 Table 3.4: Percentage distribution of the population by population group and province, Census 2011 ........................................................................................................................................................20 Table 3.5: Percentage distribution of the population by population group, district municipality and municipality, Census 2011 ...............................................................................................................21 Table 3.6: First language by province, 2011 ...........................................................................................26 Table 3.7: First language by district municipality: 2011 .........................................................................27 Table: 3.8: Province of birth by province of usual residence .................................................................28 Table 3.9: Disability status by district and sex .......................................................................................29
Statistics South Africa
Census 2011 Provincial Profile: Western Cape, Report 03-01-70
v
List of figures Figure 2.1: Percentage distribution of land area by province, 2011 ......................................................16 Figure 3.1: Distribution of population by age and sex, South Africa ......................................................22 Figure 3.2: Distribution of population by age and sex, Western Cape ..................................................23 Figure 3.3: Age dependency ratios by province, 1996–2011 .................................................................24 Figure 3.4: Age dependency ratios by district municipality ...................................................................25 Figure 3.5: Percentage of persons aged 5–24 years attending school by district municipality, censuses of 1996, 2001 and 2011 ..........................................................................................................30 Figure 3.6: Type of institution attended by persons aged 5–24 years by district municipality and population group, Census 2011 .............................................................................................................31 Figure 3.7: Percentage distribution of persons aged 20 years and older by highest education level and district municipality, censuses of 1996, 2001 and 2011 .........................................................32 Figure 3.8: Unemployment rate (official definition) by district municipality – 1996, 2001 and 2011 ........................................................................................................................................................33 Figure 3.9: Employment status by district and sex, 2011 ......................................................................34 Figure 4.1: Average household size by district municipality, censuses of 1996, 2001 and 2011 ..........35 Figure 4.2: Percentage of households headed by females by district, censuses of 1996, 2001 and 2011 ........................................................................................................................................................36 Figure 4.3: Percentage distribution of households by type of main dwelling and district municipality, censuses of 1996, 2001 and 2011 ....................................................................................37 Figure 4.4: Percentage distribution of households by type of refuse removal and district municipality, censuses of 1996, 2001 and 2011 ....................................................................................38 Figure 4.5: Percentage distribution of households by type of toilet facility by district municipality, censuses of 1996, 2001 and 2011 ....................................................................................39 Figure 4.6: Percentage of households using electricity for lighting, cooking and heating by district municipality, censuses of 1996, 2001 and 2011 ....................................................................................40 Figure 4.7: Percentage of households that have access to piped water by district municipality, censuses of 1996, 2001 and 2011 ..........................................................................................................41 Figure 4.8: Percentage of selected household goods by district municipality, censuses of 2001 and 2011 .................................................................................................................................................42
List of maps Map 2.1: Provincial boundary changes since 2001 ................................................................................12 Map 2.2: Municipal boundary changes since 2001 ................................................................................15

Statistics South Africa
Census 2011 Provincial Profile: Western Cape, Report 03-01-70
vi
Appendix Appendix.................................................................................................................................................45 Table 6.1: Population and percentage share by province ......................................................................45 Table 6.2: Distribution of population by age and sex, South Africa .......................................................45 Table 6.3: Distribution of population by age and sex, Western Cape ....................................................46 Table 6.4: Age dependency ratios by province, 1996–2011 ..................................................................46 Table 6.5: Distribution of the population aged 5–24 years attending school by district municipality, 1996, 2001 and 2011 ........................................................................................................47 Table 6.6: Disability status by district and sex .......................................................................................47 Table 6.7: Unemployment rate (official definition) by district municipality, 1996, 2001 and 2011 ......49 Table 6.8: Average household size by district municipality, 1996, 2001 and 2011 ...............................49 Table 6.9: Distribution of household by type of main dwelling and district municipality, 1996, 2001 and 2011 ........................................................................................................................................50 Table 6.10: Distribution of households by type of refuse removal and district municipality, 1996, 2001 and 2011 ........................................................................................................................................50 Table 6.11: Distribution of households using electricity for lighting, cooking and heating by district municipality, 1996, 2001 and 2011 ............................................................................................51 Table 6.12: Distribution of households by toilet facility and district municipality in Western Cape, 1996–2011 ..............................................................................................................................................51 Table 6.13: Distribution of households by access to piped water and district municipality, 1996, 2001 and 2011 ........................................................................................................................................52

Statistics South Africa
Census 2011 Provincial Profile: Western Cape, Report 03-01-70
1
Chapter 1: Introduction
1.1 Overview
Censuses are a principal means of collecting basic population and housing statistics required for social and economic development, policy interventions, their implementation and evaluation. South Africa has conducted three Censuses (1996, 2001 and 2011). Census 2011 was the third census to be conducted since the post-democratic elections in 1994, and a number of population and household attributes were measured and a variety of indicators generated. This chapter provides profile results on all census topics, namely demographics, migration, education, general health and functioning, labour force, mortality, and households.
1.2 How the count was done
Census 2011 was conducted from 9 to 31 October 2011. The various activities carried out prior to the finalisation of the results included planning, pre-enumeration, enumeration, processing and editing.
1.2.1 Planning
The planning process involved the development of the overall strategy, the structure for the project, component plans and budget. These processes were started in 2003 and were subsequently reviewed in 2008, after the completion of the Community Survey (CS) in 2007. Methodologies and procedures were then developed and tested in a form of mini-tests and a pilot in 2008 and 2009. The findings from these tests helped to refine the plans and methods for the final test in 2010 called the “Dress Rehearsal”. The latter was expected to be a replica of how the actual count was to be conducted in 2011, and therefore the timing had to be the same month as the main census, i.e. October month.
1.2.2 Pre-enumeration
The pre-enumeration phase mainly involved the final preparatory work before the actual count. It started with the production of census questionnaires, fieldwork manuals, field gear and other equipment. The phase also involved acquisition of satellite offices required in the districts, and the recruitment and training of the first level of field management staff which included 130 District Census Coordinators (DCCs) and 6 000 Fieldwork Coordinators (FWCs). At the same time, the country was sub-divided into 103 576 small areas called enumeration areas (EAs).The main reason for the subdivision of the country into EAs was to allow for recruitment, fieldwork and logistics to take place effectively. The pre-enumeration phase involved over 7 000 staff.

Statistics South Africa
Census 2011 Provincial Profile: Western Cape, Report 03-01-70
2
1.2.3 Listing, publicity and enumeration
The enumeration phase started with the training of supervisors as listers. Each supervisor was required to list all dwellings within an EA and had a minimum of four EAs to cover. These areas were called supervisory units. As supervisors were listing, they were also expected to publicise the activities of Census 2011 within their supervisory units. Upon completion of listing, final adjustments of workload and the number of enumerators required were finalised. Enumerators were trained on how to correctly complete questionnaires and to read a map. The latter was to aid them to identify the boundaries of their assigned areas. Enumerators were also given a few days before the start of the count to update their orientation book with any developments that might have happened since listing, as well as to introduce themselves to the communities they were to work with, through posters bearing their photos and special identification cards. On the night of 9 October, the actual count began with enumeration of the homeless and special institutions. The enumeration phase was undertaken by an estimated 160 000 field staff, including management.
1.2.4 Data processing
The processing of over 15 million questionnaires commenced in January 2012, immediately after the completion of the reverse logistics (all operations related to the reuse of products and materials) in December 2011. Each box and its contents were assigned a store location in the processing centre via a store management system. Each time a box was required for any process it was called through this system. The processing phase was sub-divided into the following processes: primary preparation – where all completed questionnaires were grouped into clusters of 25 and the spine of the questionnaire cut off; Secondary preparation – where questionnaires were finally prepared for scanning, by removing foreign materials in between pages and ensure that all pages are loose; Scanning– questionnaires were put through a scanner to create an electronic image; and finally, Tiling and completion – where any unrecognised reading/badly-read image by the scanner had to be verified by a data capturer. This process took eight months. Over 2 000 data processors working three shifts per day were employed for this phase to ensure that 225 million single pages were accounted for.
1.2.5 Data editing and validation system
The execution of each phase of the census operations introduces some form of errors in census data. Despite quality assurance methodologies embedded in all the phases, i.e. data collection, data capturing (both manual and automated), coding, and editing, a number of errors creep in and distort the collected information. To promote consistency and improve data quality, editing is a paramount phase in identifying and minimising errors such as invalid values, inconsistent entries or unknown/missing values. The editing process for Census 2011 was based on defined rules (specifications).

Statistics South Africa
Census 2011 Provincial Profile: Western Cape, Report 03-01-70
3
1.2.5.1 Editing team
The Census 2011 editing team was drawn from various divisions of the organisation based on skills and experience in data editing. The team thus comprised subject matter specialists (demographers and programmers), managers and data processors.
1.2.5.2 Role of the team
Among other census activities, editing team roles and responsibilities included:
• Establishment of editing plan/schedule • Formulation and application of clear and concise editing specifications • Validation of census data using other data sources • Ensuring of consistency of editing rules between censuses (2001 and 2011) where
applicable • Provision of imputation flags and rates • Identification of errors and providing corrections where possible • Review and refinement of the edit specifications based on edit trial evaluations, cross
tabulations, and comparison of census data with other datasets • Testing the specifications before confirming and applying them
1.2.5.3 Editing strategy for Census 2011
The Census 2011 questionnaire was very complex, characterised by many sections, interlinked questions and skipping instructions. Editing of such complex, interlinked data items required application of a combination of editing techniques. The strategy used for Census 2011 data editing was implementation of automated error detection and correction with minimal changes. Combinations of logical and dynamic imputation were used. Logical imputations were preferred, and in many cases substantial effort was undertaken to deduce a consistent value based on the rest of the household’s information.
1.2.6 Independent monitoring and evaluation of census field activities
Independent monitoring of the Census 2011 field activities was carried out by a team of 31 professionals and 381 Monitoring and Evaluation Monitors from the Monitoring and Evaluation division. These included field training, publicity, listing and enumeration. This was to make sure that the activities were implemented according to the plans and had independent reports on the same. They also conducted Census 2011 and the post-enumeration survey (PES) verification studies to identify the out-of-scope cases within census (a sample of 7 220 EAs) and the PES sample (600 EAs) as reported in the Census 2011 PES EA Summary Books.

Statistics South Africa
Census 2011 Provincial Profile: Western Cape, Report 03-01-70
4
1.2.7 Post-enumeration survey (PES)
A post-enumeration survey (PES) is an independent sample survey that is conducted immediately after the completion of census enumeration in order to evaluate the coverage and content errors of the census. The PES for Census 2011 was undertaken shortly after the completion of census enumeration, from November to December 2011, in approximately 600 enumeration areas (EAs), which later increased to 608 due to subdivision of large EAs. The main goal of the PES was to collect high quality data that would be compared with census data in order to determine how many people were missed in the census and how many were counted more than once.
A population census is a massive exercise, and while every effort is made to collect information on all individuals in the country, including the implementation of quality assurance measures, it is inevitable that some people will be missed and some will be counted more than once.
A PES assists in identifying the following types of errors:
• Coverage error: this includes both erroneous omissions (e.g. a household that was not enumerated) and erroneous inclusions (e.g. a household that moved into the enumeration area (EA) after census but was still enumerated, or a household that was enumerated more than once).
• Content error: this refers to the errors on the reported characteristics of the people or households enumerated during census.
The errors may emanate from the following reasons:
• Failure to account for all inhabited areas in the EA frame; • EA boundary problems; • Incomplete listing of structures and failure to identify all dwellings within an EA; • Failure to enumerate/visit all listed dwellings within an EA; • Failure to identify all households within a dwelling unit in instances whereby a
dwelling unit has more than one household; • Failure to enumerate households (complete questionnaires) for all households due to
refusals, unreturned questionnaires for self-enumeration, inability to contact households, etc.);
• Failure to include all individuals within households; • Failure to observe the inclusion rule based on a person’s presence on Census night
(i.e. failure to apply the de facto rule accurately); and • Lost questionnaires or damaged questionnaires that could not be processed.
Usually more people are missed during a census, so the census count of the population is lower than the true population. This difference is called net undercount. Rates of net undercount can vary significantly for different population groups depending on factors such
Statistics South Africa
Census 2011 Provincial Profile: Western Cape, Report 03-01-70
5
as sex, age and geographic location. Stats SA obtains estimates of the net undercount, including the type and extent of content errors (reported characteristics of persons and households enumerated in the census) using information collected through the PES.
1.2.7.1 Preparations for the PES
Planning involved the development of documents outlining the goal and objectives of the PES, timelines of the project, identification of resources (financial, human and otherwise) required for implementing the project, and the development of methodology documents. Timelines for the PES were synchronised with those of Census 2011 to ensure the relevance of the project, and adhered to international best practice for maintaining a closed population between census and PES data collection, i.e. it should be carried out within a few months, preferably within six months, after the completion of census fieldwork to ensure that the impact of natural population changes, such as births, deaths and migration, as well as lapses in respondent recall do not complicate the exercise.
Activities of the PES included the following:
• Sampling: sample design and selection; • Development of data collection methodologies: methods and procedures for data
collection (publicity, listing and enumeration), including quality control measures applied during data collection;
• Development of matching and reconciliation procedures and systems: guidelines for matching, including rules for determining the match status of households and individuals, as well as computer-based system for capturing household and person records for matching purposes;
• Questionnaire development: selection of data items which allowed measurement of coverage and content, including layout design and printing of questionnaire;
• Data collection: publicity, listing and enumeration of households in selected enumeration areas (EAs);
• Matching and reconciliation: office matching (comparison) of census and PES household and person records, and revisits to households in order to confirm or get more information that might assist in matching unresolved cases; and
• Analysis and reporting: compilation of tables and report on PES results.
1.2.7.2 Methodology
The PES is an independent survey that replicates the census in sampled enumeration areas (EAs). The major assumption used in the PES is that the census and the PES are independent; the estimate of the percentage missed by the PES but found by the census, and the percentage missed by the census but found by the PES, can be used to construct estimates of the percentage missed by both PES and census. The PES sought to estimate the total number of persons and households in housing units on the night of 09–10 October 2011

Statistics South Africa
Census 2011 Provincial Profile: Western Cape, Report 03-01-70
6
(Census night). The units of observation were the persons who spent the Census night and/or the PES night in these living quarters.
1.2.7.3 Sampling
The sampling frame for the PES was the complete list of Census 2011 EAs, amounting to 103 576 EAs. The primary sampling units (PSUs) were the Census EAs. The principle for selecting the PES sample is that the EA boundaries for sampled EAs should have well-defined boundaries, and these boundaries should correspond with those of Census EAs to allow for item-by-item comparison between the Census and PES records. The stratification and sampling process followed will allow for the provision of estimates at national, provincial, urban (geography type = urban) and non-urban (geography type = farm and traditional) levels, but estimates will only be reliable at national and provincial levels. The sample of 600 EAs was selected and allocated to the provinces based on expected standard errors which were based on those obtained in PES 2001. Populations in institutions (other than workers’ hostels), floating and homeless individuals were excluded from the PES sample.
1.2.7.4 Questionnaire development
The approach to questionnaire design focused on capturing the main elements for measuring coverage and content errors. Only a few elements from the Census 2011 questionnaire which were not likely to change within a short period (that is between the census and the PES reference nights) were retained. The questionnaire allowed for the classification of each listed person as ‘non-mover’, ‘in-mover’, ‘out-mover’, or ‘out-of-scope’, with regard to their household presence status on Census night (09–10 October 2011).The data items for the PES questionnaire included first name and surname, date of birth, age, sex, population group and presence of person in dwelling unit on Census and/or PES night.
1.2.7.5 Fieldwork methodology
The PES replicated the census in the sampled EAs, which meant that all methodologies and procedures for data collection were based on census methodologies and procedures. PES fieldwork was split into the following three phases: Publicity and listing, Enumeration and Mop-up operations.
• Publicity and listing were conducted at the same time. Publicity focused on informing and educating respondents and relevant stakeholders about the purpose of the PES to ensure successful coverage of all dwelling units (DUs) in selected EAs. Listing involved the recording of all structures (including all DUs, number of households in DUs and number of persons in households) in the sampled EAs in the EA Summary Books.
• Enumeration involved interviewing respondents and recording responses in the fields provided in the PES questionnaire. Self-enumeration for the PES was discouraged, but was used in instances where the respondent insisted on self-enumeration.

Statistics South Africa
Census 2011 Provincial Profile: Western Cape, Report 03-01-70
7
• Mop-up operations were conducted in the form of follow-up visits by senior field staff to households that could not be contacted during the enumeration period.
1.2.7.6 Matching and reconciliation methodology
The matching exercise involved the comparison of household and person records in census data and PES data. A two-way case-by-case matching was conducted using the two sources: PES questionnaires and census questionnaires. Reconciliation visits were conducted in order to confirm or get more information that would assist in matching unresolved cases, i.e. households or individuals enumerated in the census that did not correspond with households or individuals enumerated in the PES. Guidelines for matching, including rules for determining the match status of households and individuals, were developed. A computer-assisted manual matching system was developed for the capturing of data for matching purposes.
1.2.7.7 PES data collection
PES data collection commenced immediately after the completion of census fieldwork. The PES is a much smaller scale operation (and hence easier to control) than the census. These features enable the PES to deliver a more accurate estimate of the percentage of people and dwellings missed by the census. PES data collection (field operations) was independent from Census operations and the following measures were taken to maintain the operational independence of the PES:
• independent listing of enumeration areas (EAs) in the PES sample; • using separate/independent office staff in the PES and census where possible; • ensuring the PES interviewers were not employed as census field staff in the same
area, and vice versa; and • maintaining the confidentiality of the PES sample so that census field and office staff
were not aware which areas are included in the PES.
Temporary personnel (Fieldworkers and Fieldwork Supervisors) were recruited from the EAs/districts in which they would be working and underwent rigorous training on fieldwork procedures to ensure that they deliver work of high quality at the end of the fieldwork phase. Experienced permanent staff from Household Surveys (based in provincial offices) was seconded to the project for the duration of data collection in supervisory positions to ensure high quality data and minimise costs. The PES followed the integrated approach towards fieldwork; whereby one Fieldworker conducted publicity, listing and enumeration in one EA. A total of 768 Fieldworkers and Fieldwork Supervisors were appointed for the collection of data in the 608 EAs (initially 600, but increased to 608 due to split EAs). A ratio of one Fieldwork Supervisor for four Fieldworkers was applied, but due to the spread of the sample in various districts, this ratio could not always be applied.

Statistics South Africa
Census 2011 Provincial Profile: Western Cape, Report 03-01-70
8
1.2.7.8 Matching and reconciliation
The matching process involved the comparison of household and person records in Census data and PES data. The main phases in the matching process were:
• Initial matching involved searching through the census records in order to find the corresponding cases from the PES enumeration records, and vice-versa (a two-way match);
• Capturing involved the capturing of PES and census information on a capturing tool which formed part of the computer-assisted manual matching system. Information for non-matched households and persons was also captured;
• Computer-assisted matching which was the automated assigning of an initial match status for the household and persons, and persons moving status. This process was done concurrently with the capturing process. Classifications from initial matching are as follows:
1. Matched 2. Possible match
In PES not in census:
3. In PES not in census – definite non-match 4. In PES not in census – insufficient or unclear information 5. In-mover 6. Born after census 7. In census not in PES
• Reconciliation visits are follow-up visits to households in the PES sampled EAs. The purpose of reconciliation visits was to collect relevant information in order to determine the final match status of unresolved cases identified during initial matching. Cases of ‘possible match’, ‘in PES not in census – insufficient or unclear information’, and ‘in census not in PES’ were considered unresolved and were sent to the field for reconciliation; and
• Final matching involved the use of the results obtained from the reconciliation visits and initial matching phases to assign a definite match status to each case. The table below illustrates the outcomes from final matching.

Statistics South Africa
Census 2011 Provincial Profile: Western Cape, Report 03-01-70
9
1. Matched
In PES not in census: 2. Missed in census 3. PES erroneous inclusion – cases in PES not in census that were outside the
EA boundaries or otherwise erroneously included in PES 4. PES insufficient information – cases in PES not in census for which a final
match status cannot be assigned due to insufficient information 5. In-mover 6. Born after census
In census not in PES: 7. Correctly enumerated in census, missed in PES 8. Census erroneous inclusion 9. Census insufficient information – cases in census not in PES for which a final
match status cannot be assigned due to insufficient information
1.2.7.9 Estimation and tabulation
Coverage measures were calculated only for cases belonging to the PES universe.
The initial estimates – weighted estimates of total from the sample include the following:
a) Estimated number of non-movers; b) Estimated number of out-movers; c) Estimated number of matched non-movers; d) Estimated number of matched out-movers; e) Estimated number of in-movers; f) Estimated number of erroneous inclusions in the census; and g) Estimated number of correctly enumerated persons missed in the PES
Dual system estimation was used to arrive at the true population of the country. This means that two independent sources or ‘systems’ are used to arrive at the estimate of the true population: the census and the PES. Both estimates contribute to the dual-system estimate, which is more complete than either the census or the PES estimate alone. In the end, this true population is compared with the census-enumerated population and the difference is the net undercount (or overcount). The following table indicates the undercount rates as estimated by the PES.
Statistics South Africa
Census 2011 Provincial Profile: Western Cape, Report 03-01-70
10
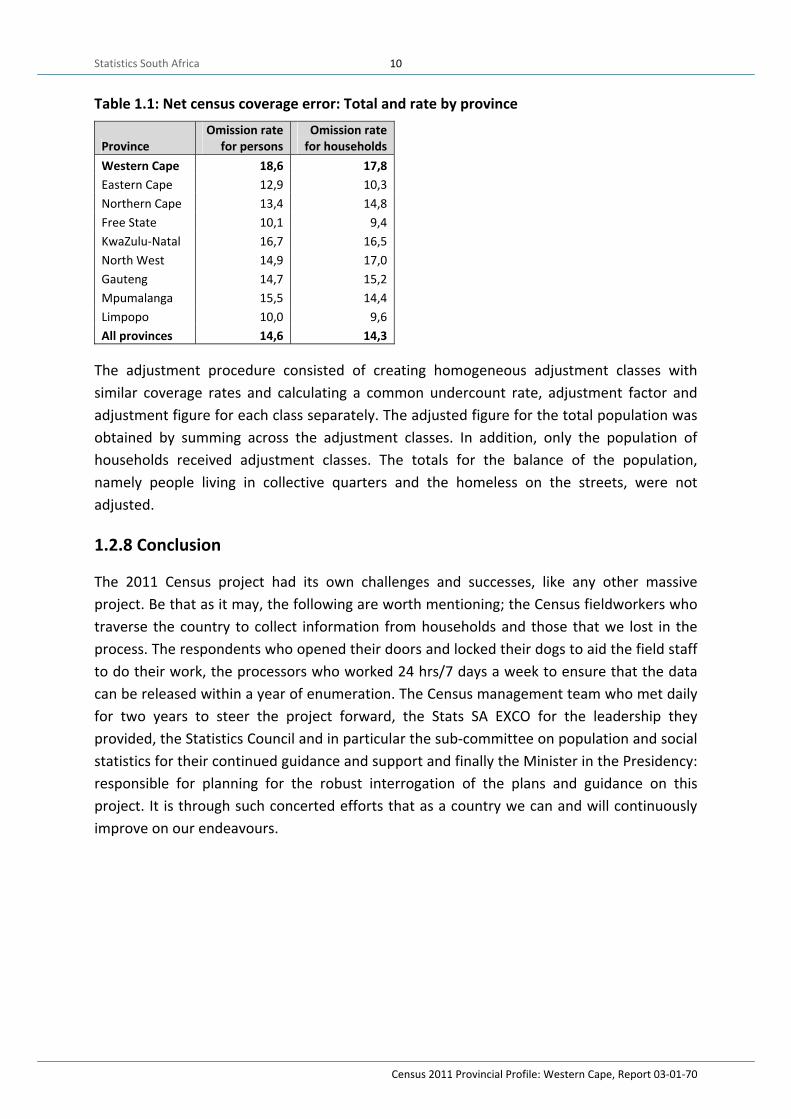
Table 1.1: Net census coverage error: Total and rate by province
Province Omission rate
for persons Omission rate
for households Western Cape 18,6 17,8 Eastern Cape 12,9 10,3 Northern Cape 13,4 14,8 Free State 10,1 9,4 KwaZulu-Natal 16,7 16,5 North West 14,9 17,0 Gauteng 14,7 15,2 Mpumalanga 15,5 14,4 Limpopo 10,0 9,6 All provinces 14,6 14,3
The adjustment procedure consisted of creating homogeneous adjustment classes with similar coverage rates and calculating a common undercount rate, adjustment factor and adjustment figure for each class separately. The adjusted figure for the total population was obtained by summing across the adjustment classes. In addition, only the population of households received adjustment classes. The totals for the balance of the population, namely people living in collective quarters and the homeless on the streets, were not adjusted.
1.2.8 Conclusion
The 2011 Census project had its own challenges and successes, like any other massive project. Be that as it may, the following are worth mentioning; the Census fieldworkers who traverse the country to collect information from households and those that we lost in the process. The respondents who opened their doors and locked their dogs to aid the field staff to do their work, the processors who worked 24 hrs/7 days a week to ensure that the data can be released within a year of enumeration. The Census management team who met daily for two years to steer the project forward, the Stats SA EXCO for the leadership they provided, the Statistics Council and in particular the sub-committee on population and social statistics for their continued guidance and support and finally the Minister in the Presidency: responsible for planning for the robust interrogation of the plans and guidance on this project. It is through such concerted efforts that as a country we can and will continuously improve on our endeavours.
Statistics South Africa
Census 2011 Provincial Profile: Western Cape, Report 03-01-70
11
Chapter 2: Geography of South Africa
2.1 Provincial boundary changes: 2001 to 2011
A number of changes occurred in terms of provincial and municipal boundaries during the period between the censuses of 2001 and 2011. Of the nine provinces, only two provinces (Western Cape and Free State) were not affected by changes. The provincial boundary changes were mostly as a result of eight cross-boundary municipalities which were absorbed in full into respective provinces.
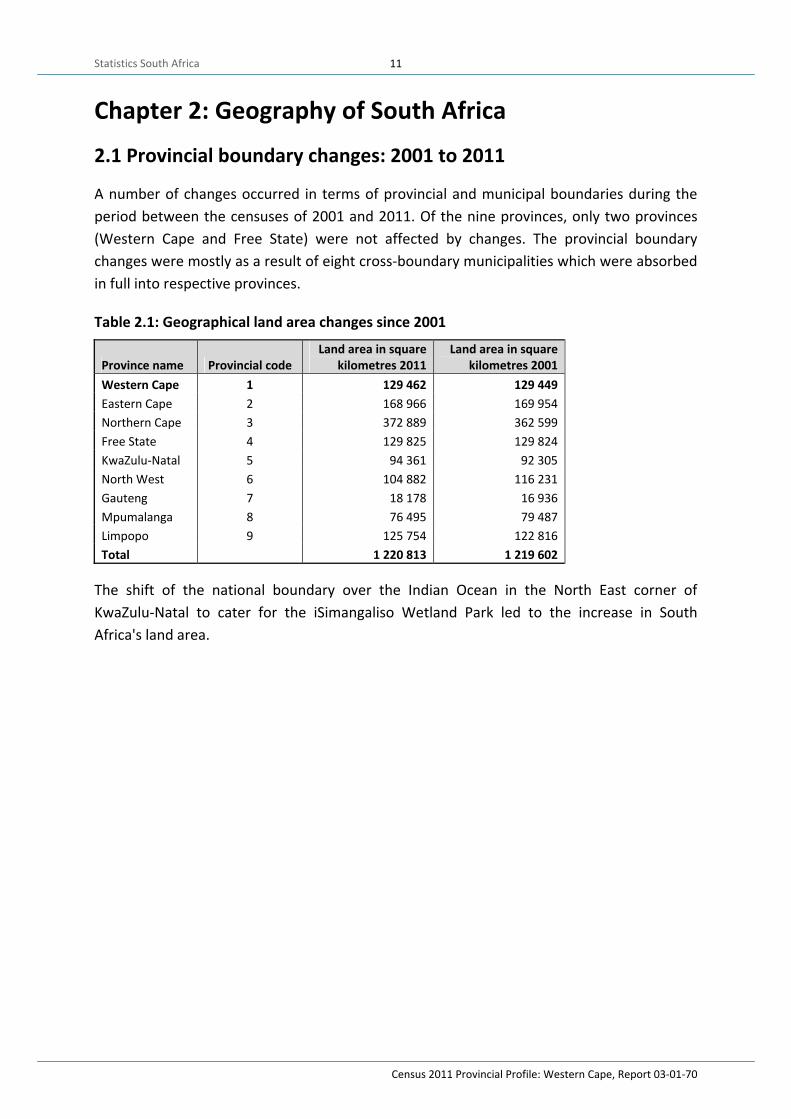
Table 2.1: Geographical land area changes since 2001
Province name Provincial code Land area in square
kilometres 2011 Land area in square
kilometres 2001 Western Cape 1 129 462 129 449 Eastern Cape 2 168 966 169 954 Northern Cape 3 372 889 362 599 Free State 4 129 825 129 824 KwaZulu-Natal 5 94 361 92 305 North West 6 104 882 116 231 Gauteng 7 18 178 16 936 Mpumalanga 8 76 495 79 487 Limpopo 9 125 754 122 816 Total 1 220 813 1 219 602
The shift of the national boundary over the Indian Ocean in the North East corner of KwaZulu-Natal to cater for the iSimangaliso Wetland Park led to the increase in South Africa's land area.

Statistics South Africa
Census 2011 Provincial Profile: Western Cape, Report 03-01-70
12
Map 2.1: Provincial boundary changes since 2001
Provincial boundary changes mostly affected North West (land size decreased to 11 348,9 square kilometres). Most of this was absorbed by Northern Cape. The second largest decrease in land size was for Mpumalanga which decreased by 2 991,9 square kilometres with Limpopo being the main recipient of this land area.
It should be noted that the increased extent of KwaZulu-Natal is not mainly based on the exchange of UMzimkhulu (formerly in the Eastern Cape Province) and Matatiele (formerly in KwaZulu-Natal), but due to the shift of the national boundary over the Indian Ocean in the north east corner of the province to cater for the iSimangaliso Wetland Park. In terms of which areas moved to which province, a detailed outline is provided for below.
Northern Cape and North West • Ga Segonyana and Phokwane municipalities were cross-boundary municipalities
between Northern Cape and North West in 2001 and were allocated to Northern Cape in full, based on the current provincial boundaries.
• Kagisano municipality (2001) was split into Kagisano/ Molopo municipality and Joe Morolong municipality, with the former portion now in North West and the latter now part of the Northern Cape province.

Statistics South Africa
Census 2011 Provincial Profile: Western Cape, Report 03-01-70
13
• Moshaweng municipality (now part of Joe Morolong municipality) was incorporated in full in Northern Cape based on the current provincial boundaries.
North West and Gauteng • Merafong City municipality (2001) was a cross-boundary local municipality between
North West and Gauteng and was allocated to the Gauteng province based on the current provincial boundaries.
• West Rand (DMA) municipality (2001) was not aligned to the then provincial boundary and was absorbed into Mogale City municipality in full, based on the current provincial boundaries.
• City of Tshwane Metropolitan Municipality was a cross-boundary municipality between Gauteng and North West provinces. The portions adjacent to Moretele and Madibeng municipalities were allocated to Gauteng in full, based on the current provincial boundaries.
North West and Limpopo • Limpopo lost a portion of the Bela-Bela municipality to North West’s Moretele
municipality. In turn, North West lost a portion of the Moretele municipality to Limpopo’s Bela-Bela municipality, based on the current provincial boundaries.
Gauteng and Mpumalanga • A portion of Delmas municipality (2001) (now called Victor Kanye) was allocated to
the City of Tshwane in Gauteng, based on the current provincial boundaries. • Kungwini municipality, now incorporated into the City of Tshwane, was a cross-
boundary municipality and is now fully allocated to Gauteng, based on the current provincial boundaries.
Mpumalanga and Limpopo • Greater Groblersdal (now called Elias Motsoaledi), Greater Marble Hall (now called
Ephraim Mogale), and Greater Tubatse were cross-boundary municipalities between Mpumalanga and Limpopo and have now been allocated in full to the Limpopo province. Ephraim Mogale municipality absorbed the Schuinsdraai Nature Reserve.
• Bushbuck Ridge municipality was a cross-boundary municipality between Limpopo and Mpumalanga and has now been allocated in full to the Mpumalanga province. (Bushbuck Ridge also absorbed a portion of the Kruger Park cross-boundary District Management Area.)
KwaZulu-Natal and Eastern Cape • UMzimkhulu, formerly in Eastern Cape, and Matatiele, formerly in KwaZulu-Natal,
were in effect exchanged, with UMzimkhulu now being in KwaZulu-Natal and Matatiele now being in Eastern Cape, based on the current provincial boundaries.
Statistics South Africa
Census 2011 Provincial Profile: Western Cape, Report 03-01-70
14
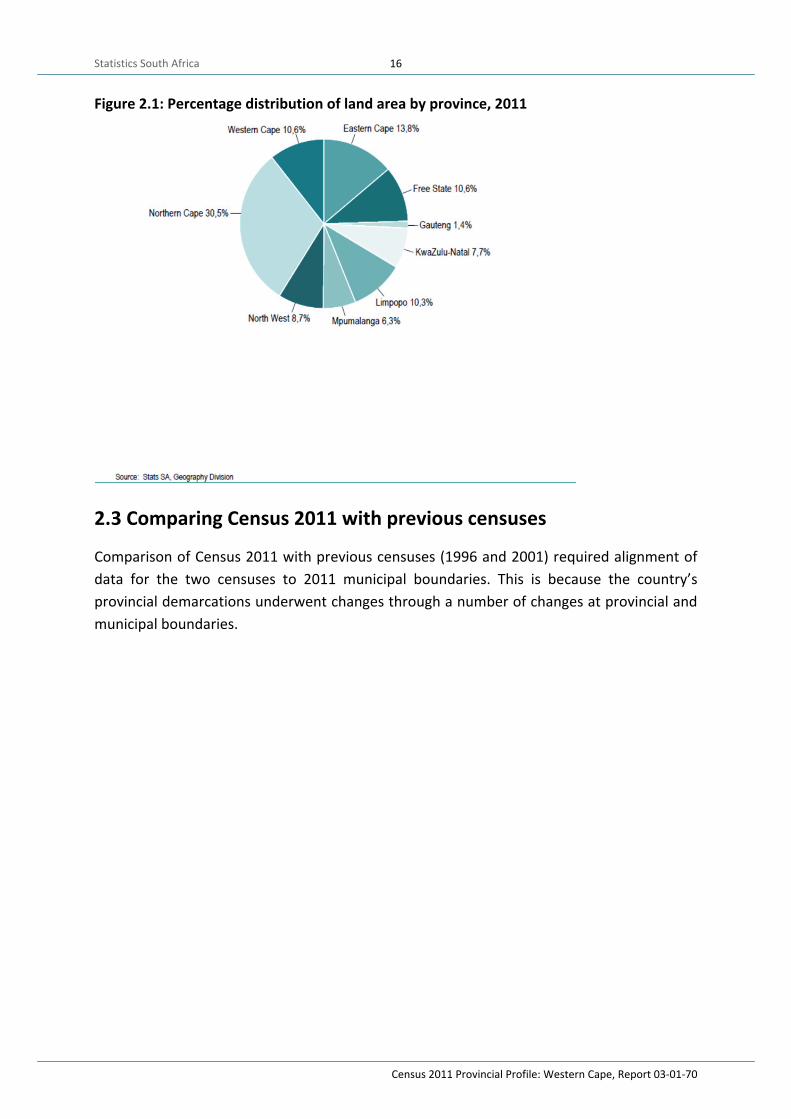
Free State • Free State is one of the provinces that were not affected by the provincial
boundaries. It is centrally situated among the remaining eight provinces. It is bordered by six provinces. The only two provinces not bordering it are Limpopo and Western Cape. It also forms a border with Lesotho. Free State province is the third largest province in terms of land area in South Africa, occupying the same percentage land area as the Western Cape. It covers approximately 129 825 km² and constitutes 10,6% of South Africa’s land area. The province is subdivided into four district municipalities and a metropolitan municipality.
2.2 Local municipal boundary changes, 2001–2011
In 2001, the geographical frame consisted of 262 local municipalities. This total has been reduced to 234 local municipalities in the 2011 geographical frame. The difference of 28 municipalities is explained as follows:
In total, 25 District Management Areas (DMAs) were absorbed into the existing provinces.
• The City of Tshwane absorbed a further two municipalities (Nokeng Tsa Taemane and Kungwini).
• A new municipality (Kagisano Molopo – NW379) was established by merging NW391 (Kagisano) and NW395 (Molopo).
For municipalities, 107 municipalities decreased in geographical area while 155 municipalities had an increase in geographical area.

Statistics South Africa
Census 2011 Provincial Profile: Western Cape, Report 03-01-70
15
Map 2.2: Municipal boundary changes since 2001
Statistics South Africa
Census 2011 Provincial Profile: Western Cape, Report 03-01-70
16
Figure 2.1: Percentage distribution of land area by province, 2011
2.3 Comparing Census 2011 with previous censuses
Comparison of Census 2011 with previous censuses (1996 and 2001) required alignment of data for the two censuses to 2011 municipal boundaries. This is because the country’s provincial demarcations underwent changes through a number of changes at provincial and municipal boundaries.

Statistics South Africa
Census 2011 Provincial Profile: Western Cape, Report 03-01-70
17
Chapter 3: Population size and distribution
3.1 National and provincial
South Africa has had three successful censuses since the first democratic elections in 1994. The first census was conducted in 1996, followed by a second one in 2001 and the third in 2011. In this chapter, data from previous censuses (1996 and 2001) are compared with the data from Census 2011. This section mainly focuses on the demographic characteristics of the population of Western Cape; another part of this section covers migration and the labour force.
Table 3.1: Population and percentage share by province, censuses of 1996, 2001 and 2011
Province
1996 2001 2011
Population %
share Population %
share %change
(1996-2001) Population %
share % change
(2001-2011) Western Cape 3 956 875 9,7 4 524 335 10,1 14,3 5 822 734 11,2 28,7 Eastern Cape 6 147 244 15,1 6 278 651 14,0 2,1 6 562 053 12,7 4,5 Northern Cape 1 011 864 2,5 991 919 2,2 -2,0 1 145 861 2,2 15,5 Free State 2 633 504 6,5 2 706 775 6,0 2,8 2 745 590 5,3 1,4 KwaZulu-Natal 8 572 302 21,1 9 584 129 21,4 11,8 10 267 300 19,8 7,1 North West 2 727 223 6,7 2 984 098 6,7 9,4 3 509 953 6,8 17,6 Gauteng 7 834 125 19,3 9 388 854 20,9 19,8 12 272 263 23,7 30,7 Mpumalanga 3 123 869 7,7 3 365 554 7,5 7,7 4 039 939 7,8 20,0 Limpopo 4 576 566 11,3 4 995 462 11,1 9,2 5 404 868 10,4 8,2 South Africa 40 583 573 100,0 44 819 778 100,0 10,4 51 770 561 100,0 15,5
Table 3.1 shows that in both 1996 and 2001, the province with the highest population was KwaZulu-Natal, followed by Gauteng. In 2011, however, Gauteng had the biggest population (12 272 263) compared to other provinces, followed by KwaZulu-Natal (10267 300). Western Cape had a population of 5 822 734. Its share increased from 9,7% in 1996 to 10,1% in 2001 and to 11,2% in 2011. The province also recorded the second highest percentage change between 2001 and 2011 (28,7%) after Gauteng (30,7%).

Statistics South Africa
Census 2011 Provincial Profile: Western Cape, Report 03-01-70
18
Table 3.2: Distribution of the population by district municipality and municipality, censuses of 1996, 2001 and 2011
District municipality 1996 2001 2011 N % N % N %
West Coast 234 952 5,9 282 672 6,3 391 766 6,7 Matzikama 43 906 1,1 54 199 1,2 67 147 1,2 Cederberg 31 704 0,8 39 559 0,9 49 768 0,9 Bergrivier 37 485 1,0 46 538 1,1 61 897 1,1 Saldanha Bay 56 557 1,4 70 261 1,6 99 193 17 Swartland 65 301 1,7 72 115 1,6 113 762 2,0 Cape Winelands 563 783 14,3 630 284 13,9 787 490 13,5 Witzenberg 76 386 1,9 89 087 2,0 115 946 2,0 Drakenstein 186 334 4,7 194 417 4,4 251 262 4,3 Stellenbosch 103 996 2,6 118 709 2,7 155 733 2,7 Breede Valley 129 984 3,3 146 387 3,3 166 825 2,9 Langeberg 67 083 1,7 81 684 1,8 97 724 1,7 Overberg 158 862 4,0 203 729 4,5 258 176 4,4 Swellendam 24 579 0,6 28 285 0,6 35 916 0,6 Theewaterskloof 74 582 1,8 93 276 2,1 108 790 1,9 Overstrand 36 686 0,9 55 012 1,2 80 432 1,4 Cape Agulhas 23 015 0,6 27 155 0,6 33 038 0,6 Eden 380 887 9,6 454 924 10,1 574 265 9,9 Kannaland 21 190 0,5 23 971 0,5 24 767 0,4 Hessequa 38 553 1,0 44 114 1,0 52 642 0,9 Mossel Bay 59 789 1,5 71 494 1,6 89 430 1,5 George 120 148 3,0 149 436 3,4 193 672 3,3 Oudtshoorn 79 181 2,0 84 692 1,9 95 933 1,7 Bitou 18 427 0,5 29 182 0,7 49 162 0,8 Knysna 43 599 1,1 52 035 1,2 68 659 1,2 Central Karoo 56 114 1,4 60 483 1,3 71 011 1,2 Laingsburg 5 913 0,2 6 680 0,2 8 289 0,1 Prince Albert 9 508 0,2 10 512 0,2 13 136 0,2 Beaufort West 40 693 1,0 43 290 1,0 49 586 0,9 City of Cape Town 2 562 277 64,8 2 892 243 65,0 3 740 026 64,2 Western Cape 3 956 875 100,0 4 452 220 100,0 5 822 734 100,0
Table 3.2 shows that:
• The City of Cape Town has continued to account for almost two-thirds of the population since 1996, followed by Cape Winelands district municipality. Central Karoo has always recorded the smallest share.
Statistics South Africa
Census 2011 Provincial Profile: Western Cape, Report 03-01-70
19
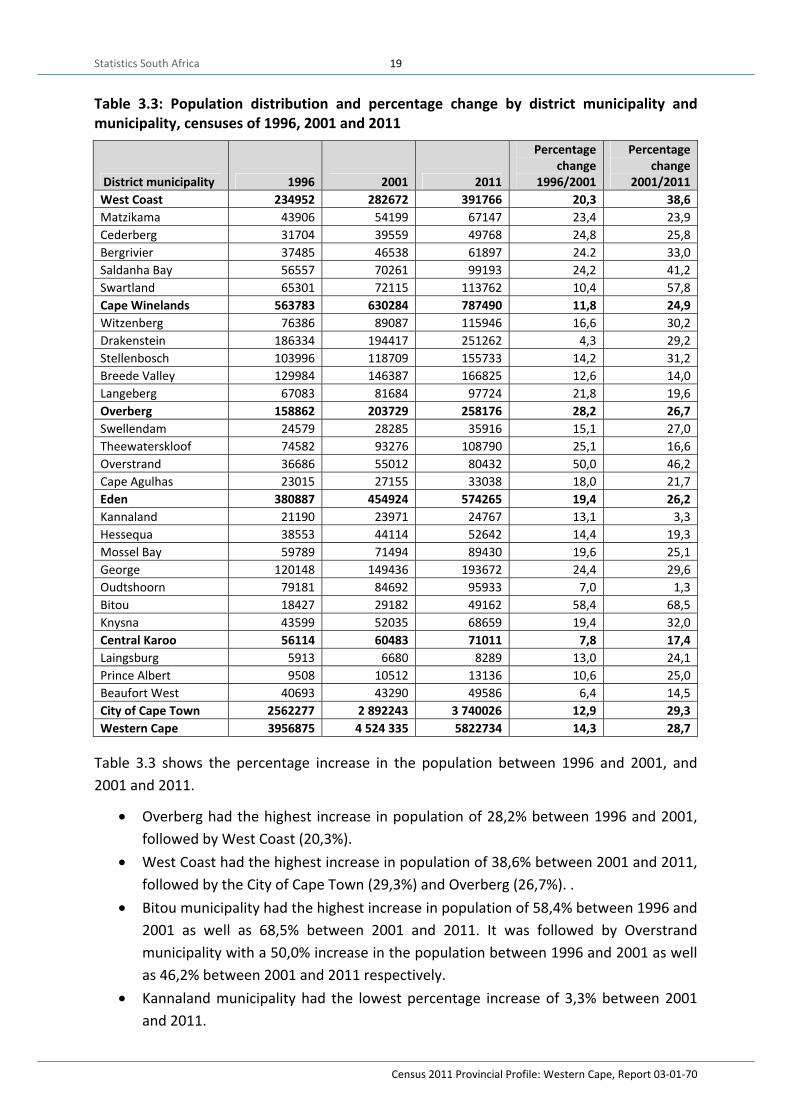
Table 3.3: Population distribution and percentage change by district municipality and municipality, censuses of 1996, 2001 and 2011
District municipality 1996 2001 2011
Percentage change
1996/2001
Percentagechange
2001/2011 West Coast 234952 282672 391766 20,3 38,6 Matzikama 43906 54199 67147 23,4 23,9 Cederberg 31704 39559 49768 24,8 25,8 Bergrivier 37485 46538 61897 24.2 33,0 Saldanha Bay 56557 70261 99193 24,2 41,2 Swartland 65301 72115 113762 10,4 57,8 Cape Winelands 563783 630284 787490 11,8 24,9 Witzenberg 76386 89087 115946 16,6 30,2 Drakenstein 186334 194417 251262 4,3 29,2 Stellenbosch 103996 118709 155733 14,2 31,2 Breede Valley 129984 146387 166825 12,6 14,0 Langeberg 67083 81684 97724 21,8 19,6 Overberg 158862 203729 258176 28,2 26,7 Swellendam 24579 28285 35916 15,1 27,0 Theewaterskloof 74582 93276 108790 25,1 16,6 Overstrand 36686 55012 80432 50,0 46,2 Cape Agulhas 23015 27155 33038 18,0 21,7 Eden 380887 454924 574265 19,4 26,2 Kannaland 21190 23971 24767 13,1 3,3 Hessequa 38553 44114 52642 14,4 19,3 Mossel Bay 59789 71494 89430 19,6 25,1 George 120148 149436 193672 24,4 29,6 Oudtshoorn 79181 84692 95933 7,0 1,3 Bitou 18427 29182 49162 58,4 68,5 Knysna 43599 52035 68659 19,4 32,0 Central Karoo 56114 60483 71011 7,8 17,4 Laingsburg 5913 6680 8289 13,0 24,1 Prince Albert 9508 10512 13136 10,6 25,0 Beaufort West 40693 43290 49586 6,4 14,5 City of Cape Town 2562277 2 892243 3 740026 12,9 29,3 Western Cape 3956875 4 524 335 5822734 14,3 28,7
Table 3.3 shows the percentage increase in the population between 1996 and 2001, and 2001 and 2011.
• Overberg had the highest increase in population of 28,2% between 1996 and 2001, followed by West Coast (20,3%).
• West Coast had the highest increase in population of 38,6% between 2001 and 2011, followed by the City of Cape Town (29,3%) and Overberg (26,7%). .
• Bitou municipality had the highest increase in population of 58,4% between 1996 and 2001 as well as 68,5% between 2001 and 2011. It was followed by Overstrand municipality with a 50,0% increase in the population between 1996 and 2001 as well as 46,2% between 2001 and 2011 respectively.
• Kannaland municipality had the lowest percentage increase of 3,3% between 2001 and 2011.
Statistics South Africa
Census 2011 Provincial Profile: Western Cape, Report 03-01-70
20
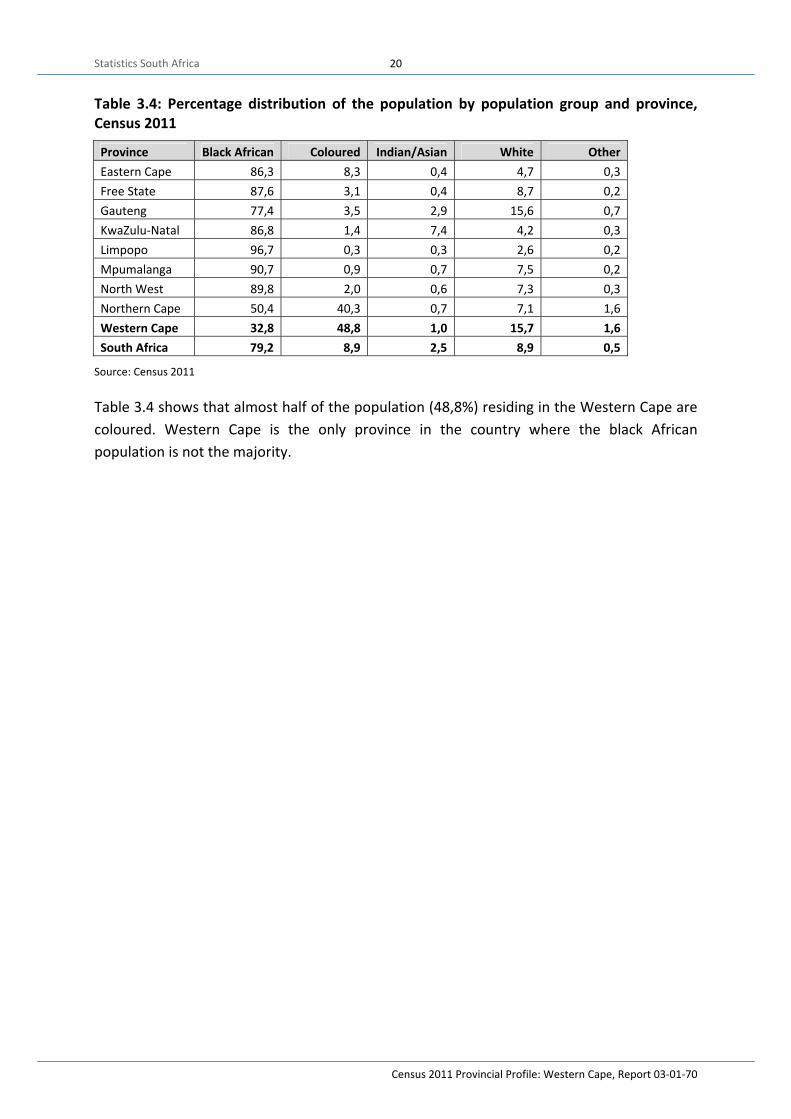
Table 3.4: Percentage distribution of the population by population group and province, Census 2011
Province Black African Coloured Indian/Asian White Other Eastern Cape 86,3 8,3 0,4 4,7 0,3 Free State 87,6 3,1 0,4 8,7 0,2 Gauteng 77,4 3,5 2,9 15,6 0,7 KwaZulu-Natal 86,8 1,4 7,4 4,2 0,3 Limpopo 96,7 0,3 0,3 2,6 0,2 Mpumalanga 90,7 0,9 0,7 7,5 0,2 North West 89,8 2,0 0,6 7,3 0,3 Northern Cape 50,4 40,3 0,7 7,1 1,6 Western Cape 32,8 48,8 1,0 15,7 1,6 South Africa 79,2 8,9 2,5 8,9 0,5
Source: Census 2011
Table 3.4 shows that almost half of the population (48,8%) residing in the Western Cape are coloured. Western Cape is the only province in the country where the black African population is not the majority.

Statistics South Africa
Census 2011 Provincial Profile: Western Cape, Report 03-01-70
21
Table 3.5: Percentage distribution of the population by population group, district municipality and municipality, Census 2011
District municipality Black African Coloured Indian or Asian White Other West Coast 16,4 66,6 0,6 15,7 0,8 Matzikama 8,5 74,7 0,6 14,8 1,3 Cederberg 12,7 75,7 0,3 11,0 0,4 Bergrivier 11,3 71,0 0,4 16,9 0,4 Saldanha Bay 24,5 55,8 0,8 18,0 0,9 Swartland 18,3 64,8 0,5 15,6 0,7 Cape Winelands 23,7 62,1 0,4 12,9 0,9 Witzenberg 25,3 65,9 0,2 7,7 0,8 Drakenstein 22,7 62,5 0,4 13,5 0,9 Stellenbosch 28,1 52,2 0,4 18,5 0,8 Breede Valley 24,3 63,3 0,6 10,7 1,1 Breede River/Winelands 16,2 70,3 0,3 12,3 0,9 Overberg 25,6 54,2 0,3 18,9 1,0 Swellendam 12,4 68,8 0,3 17,4 1,1 Theewaterskloof 26,4 62,9 0,4 9,4 0,9 Overstrand 36,2 31,0 0,3 31,3 1,2 Cape Agulhas 11,5 65,6 0,3 21,6 0,9 Eden 24,7 54,2 0,4 19,2 1,5 Kannaland 4,7 84,6 0,3 9,8 0,5 Hessequa 7,4 68,5 0,4 23,2 0,5 Mossel Bay 29,5 43,5 0,5 25,5 1,1 George 28,2 50,4 0,5 19,7 1,2 Oudtshoorn 9,1 77,4 0,3 12,5 0,7 Bitou 45,2 31,2 0,5 16,9 6,2 Knysna 36,1 40,9 0,4 21,0 1,6 Central Karoo 12,7 76,2 0,4 10,1 0,6 Laingsburg 7,0 79,0 0,2 13,3 0,5 Prince Albert 2,8 84,5 0,3 11,8 0,6 Beaufort West 16,3 73,5 0,5 9,2 0,5 City of Cape Town 38,6 42,4 1,4 15,7 1,9 Western Cape 32,9 48,8 1,1 15,7 1,6
Table 3.5 outlines the percentage of population groups per district and municipality.
The table indicates that:
• The coloured population group had the highest representation across all districts and municipalities in the Western Cape except Bitou and Overstrand municipalities.
• The City of Cape Town had an even population group distribution between black Africans (38,6%) and coloureds (42,4%).

Statistics South Africa
Census 2011 Provincial Profile: Western Cape, Report 03-01-70
22
3.2 Age and sex structure
3.2.1 Pyramids
Figure 3.1: Distribution of population by age and sex, South Africa
Figure 3.1 outlines the population pyramid for South Africa, by age and sex.
The pyramid indicates that:
• The majority of the population are below 35 years of age • The proportion of the 20–24 and 25–29 age groups of the population increased
between 1996 and 2011. This could perhaps be attributed to in-migration of people in search of employment and improved socio-economic conditions.
8,0 6,0 4,0 2,0 0,0 2,0 4,0 6,0 8,0
0 - 45 - 9
10 - 1415 - 1920 - 2425 - 2930 - 3435 - 3940 - 4445 - 4950 - 5455 - 5960 - 6465 - 6970 - 7475 - 7980 - 84
85 +
Percentage %
Age
grou
ps
2011 Female
2011 Male
2001 Female
2001 Male
1996 Female
1996 Male

Statistics South Africa
Census 2011 Provincial Profile: Western Cape, Report 03-01-70
23
6,0 4,0 2,0 0,0 2,0 4,0 6,0
0 - 45 - 9
10 - 1415 - 1920 - 2425 - 2930 - 3435 - 3940 - 4445 - 4950 - 5455 - 5960 - 6465 - 6970 - 7475 - 7980 - 84
85+
2011 Female
2011 Male
2001 Female
2001 Male
1996 Female
1996 Male
Figure 3.2: Distribution of population by age and sex, Western Cape
Figure 3.2 shows the population pyramid for Western Cape, by age and sex.
• The pyramid indicates that the proportion of the population had increased between 2001 and 2011, for the 20–34 age groups. This can be attributed to in-migration taking place between provinces.
• According to Census 2011 results, the proportion of the population decreased from the age of 55 onwards.
Statistics South Africa
Census 2011 Provincial Profile: Western Cape, Report 03-01-70
24
3.3 Broad age groups
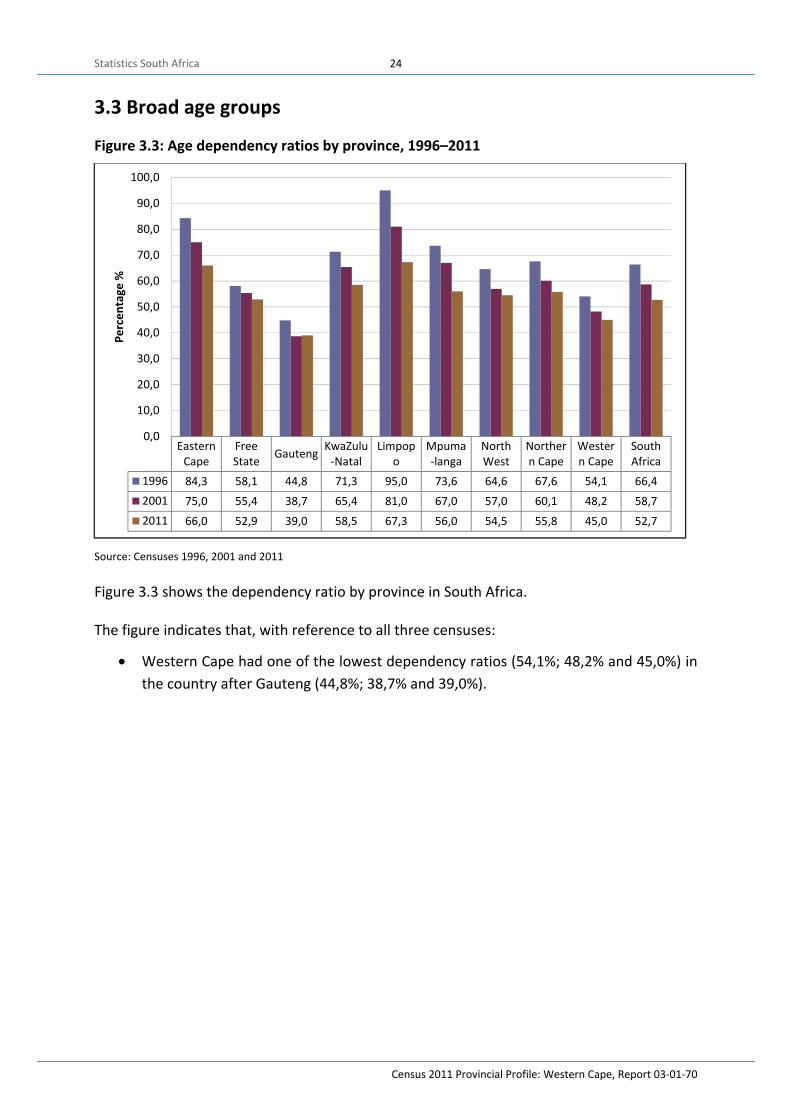
Figure 3.3: Age dependency ratios by province, 1996–2011
Source: Censuses 1996, 2001 and 2011
Figure 3.3 shows the dependency ratio by province in South Africa.
The figure indicates that, with reference to all three censuses:
• Western Cape had one of the lowest dependency ratios (54,1%; 48,2% and 45,0%) in the country after Gauteng (44,8%; 38,7% and 39,0%).
EasternCape
FreeState Gauteng KwaZulu
-NatalLimpop
oMpuma-langa
NorthWest
Northern Cape
Western Cape
SouthAfrica
1996 84,3 58,1 44,8 71,3 95,0 73,6 64,6 67,6 54,1 66,42001 75,0 55,4 38,7 65,4 81,0 67,0 57,0 60,1 48,2 58,72011 66,0 52,9 39,0 58,5 67,3 56,0 54,5 55,8 45,0 52,7
0,0
10,0
20,0
30,0
40,0
50,0
60,0
70,0
80,0
90,0
100,0
Perc
enta
ge %
Statistics South Africa
Census 2011 Provincial Profile: Western Cape, Report 03-01-70
25
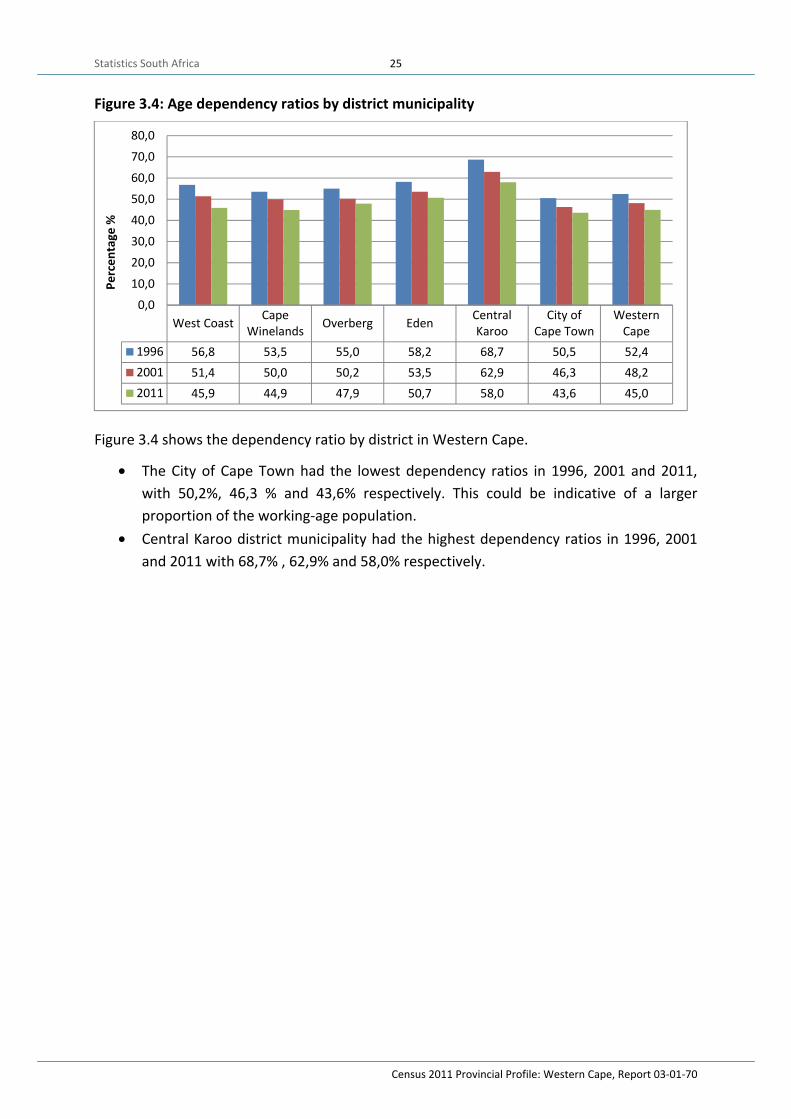
Figure 3.4: Age dependency ratios by district municipality
Figure 3.4 shows the dependency ratio by district in Western Cape.
• The City of Cape Town had the lowest dependency ratios in 1996, 2001 and 2011, with 50,2%, 46,3 % and 43,6% respectively. This could be indicative of a larger proportion of the working-age population.
• Central Karoo district municipality had the highest dependency ratios in 1996, 2001 and 2011 with 68,7% , 62,9% and 58,0% respectively.
West Coast CapeWinelands Overberg Eden Central
KarooCity of
Cape TownWestern
Cape1996 56,8 53,5 55,0 58,2 68,7 50,5 52,42001 51,4 50,0 50,2 53,5 62,9 46,3 48,22011 45,9 44,9 47,9 50,7 58,0 43,6 45,0
0,010,0
20,030,0
40,050,060,0
70,080,0
Perc
enta
ge %

Statistics South Africa
Census 2011 Provincial Profile: Western Cape, Report 03-01-70
26
3.4 Language
3.4.1 Province
Table 3.6: First language by province, 2011
Province Afrikaans English IsiNdebele IsiXhosa IsiZulu Sepedi Sesotho Setswana Sign
language SiSwati Tshivenda Xitsonga Other Eastern Cape 10,6 5,6 0,2 78,8 0,5 02 2,4 0,2 0,6 0,0 0,1 0,1 0,6 Free State 12,8 2,9 0,4 7,4 4,4 02 64,2 5,3 1,1 0,0 0,2 0,4 0,6 Gauteng 12,4 13,3 3,2 6,6 19,8 10,6 11,6 9,1 0,4 1,1 2,2 6,6 3,1 KwaZulu-Natal 1,6 13,2 1,1 3,4 77,9 0,2 0,8 0,5 0,5 0,1 0,1 0,1 0,8 Limpopo 2,7 1,4 1,9 0,4 1,1 53,0 1,5 2,0 0,2 0,5 16,7 17,0 1,6 Mpumalanga 7,3 3,1 10,1 1,3 24,1 9,3 3,4 1,8 0,3 27,6 0,3 10,4 1,0 North West 9,0 3,5 1,3 5,5 2,5 2,4 5,8 63,4 0,4 0,3 0,4 3,7 1,8 Northern Cape 53,8 3,2 0,5 5,4 0,9 0,0 14 33,0 0,5 0,0 0,0 0,0 0,9 Western Cape 49,6 20,2 0,3 24,7 0,4 0,2 1,2 0,4 0,4 0,1 0,1 0,2 2,2
Table 3.6 shows the percentage of people speaking each of the official languages per province.
The table indicates that:
• The majority of people in Western Cape were Afrikaans speaking (49,6%), followed by IsiXhosa (24,7%) and English (20,2%).

Statistics South Africa
Census 2011 Provincial Profile: Western Cape, Report 03-01-70
27
3.4.2 District
Table 3.7: First language by district municipality: 2011
Language West Coast Cape
Winelands Overberg Eden Central
Karoo City of
Cape Town Western
Cape Afrikaans 83,6 74,8 70,3 70,8 87,6 35,7 49,6 English 4,0 4,3 6,8 7,5 2,5 28,4 20,2 IsiNdebele 0,2 0,1 0,2 0,2 0,0 0,3 0,3 IsiXhosa 8,5 16,6 17,9 18,3 7,4 29,8 24,7 IsiZulu 0,2 0,1 0,2 0,3 0,0 0,5 0,4 Sepedi 0,2 0,1 0,0 0,1 0,0 0,2 0,2 Sesotho 1,2 1,9 2,0 0,6 0,8 1,0 1,2 Setswana 0,6 0,4 0,5 0,5 0,8 0,4 0,4 Sign language 0,3 0,4 0,2 0,3 0,0 0,4 0,4 SiSwati 0,0 0,1 0,0 0,1 0,0 0,1 0,1 Tshivenda 0,2 0,1 0,0 0,1 0,0 0,1 0,1 Xitsonga 0,2 0,1 0,0 0,1 0,0 0,2 0,2 Other 0,8 1,0 1,4 1,0 0,8 2,9 2,2
Table 3.7 shows the percentage of people speaking each of the official languages by district municipality.
The table indicates that:
• The majority of people in all districts, except the City of Cape Town were Afrikaans speaking.
• The City of Cape Town had a fairly equal percentage of people speaking various first languages (Afrikaans at 35,7%, followed by IsiXhosa at 29,8% and English at 28,4%).
• A significant proportion of people in Cape Winelands, Overberg and Eden speak IsiXhosa (16,6%, 17,9% and 18,3% respectively).
Statistics South Africa
Census 2011 Provincial Profile: Western Cape, Report 03-01-70
28
3.5 Migration
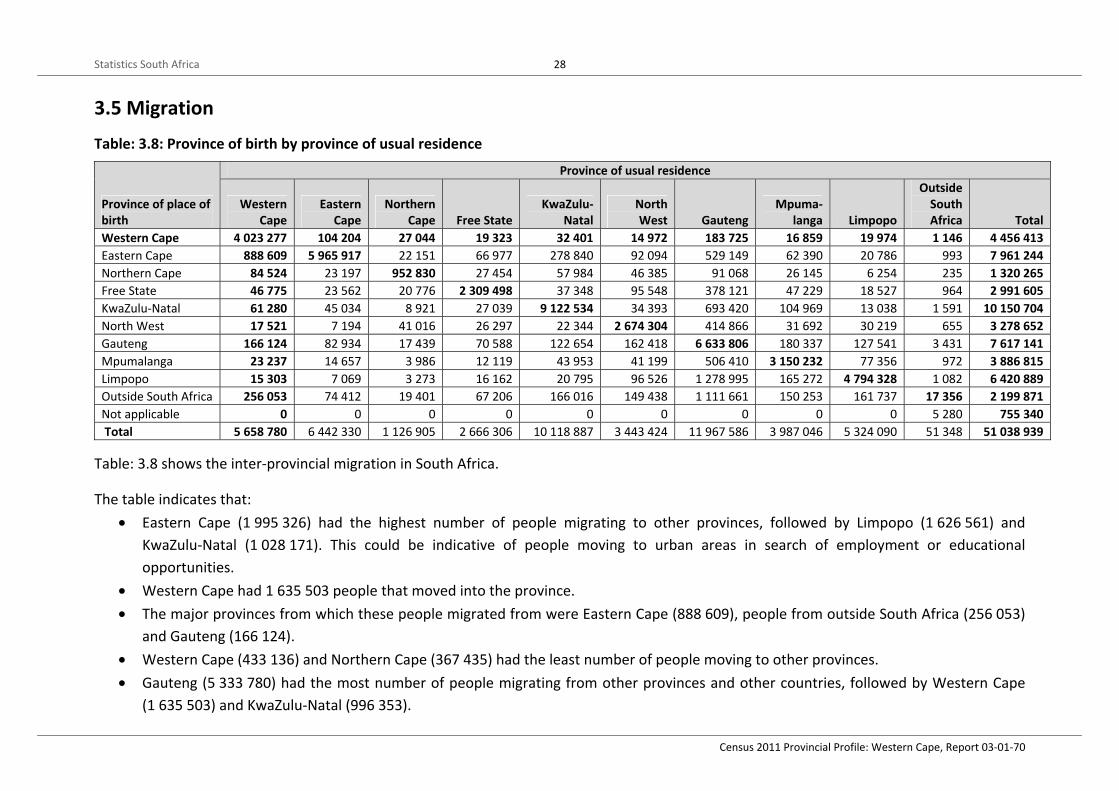
Table: 3.8: Province of birth by province of usual residence
Province of place of birth
Province of usual residence
Western Cape
EasternCape
NorthernCape Free State
KwaZulu-Natal
NorthWest Gauteng
Mpuma-langa Limpopo
OutsideSouthAfrica Total
Western Cape 4 023 277 104 204 27 044 19 323 32 401 14 972 183 725 16 859 19 974 1 146 4 456 413 Eastern Cape 888 609 5 965 917 22 151 66 977 278 840 92 094 529 149 62 390 20 786 993 7 961 244 Northern Cape 84 524 23 197 952 830 27 454 57 984 46 385 91 068 26 145 6 254 235 1 320 265 Free State 46 775 23 562 20 776 2 309 498 37 348 95 548 378 121 47 229 18 527 964 2 991 605 KwaZulu-Natal 61 280 45 034 8 921 27 039 9 122 534 34 393 693 420 104 969 13 038 1 591 10 150 704 North West 17 521 7 194 41 016 26 297 22 344 2 674 304 414 866 31 692 30 219 655 3 278 652 Gauteng 166 124 82 934 17 439 70 588 122 654 162 418 6 633 806 180 337 127 541 3 431 7 617 141 Mpumalanga 23 237 14 657 3 986 12 119 43 953 41 199 506 410 3 150 232 77 356 972 3 886 815 Limpopo 15 303 7 069 3 273 16 162 20 795 96 526 1 278 995 165 272 4 794 328 1 082 6 420 889 Outside South Africa 256 053 74 412 19 401 67 206 166 016 149 438 1 111 661 150 253 161 737 17 356 2 199 871 Not applicable 0 0 0 0 0 0 0 0 0 5 280 755 340 Total 5 658 780 6 442 330 1 126 905 2 666 306 10 118 887 3 443 424 11 967 586 3 987 046 5 324 090 51 348 51 038 939
Table: 3.8 shows the inter-provincial migration in South Africa.
The table indicates that: • Eastern Cape (1 995 326) had the highest number of people migrating to other provinces, followed by Limpopo (1 626 561) and
KwaZulu-Natal (1 028 171). This could be indicative of people moving to urban areas in search of employment or educational opportunities.
• Western Cape had 1 635 503 people that moved into the province. • The major provinces from which these people migrated from were Eastern Cape (888 609), people from outside South Africa (256 053)
and Gauteng (166 124). • Western Cape (433 136) and Northern Cape (367 435) had the least number of people moving to other provinces. • Gauteng (5 333 780) had the most number of people migrating from other provinces and other countries, followed by Western Cape
(1 635 503) and KwaZulu-Natal (996 353).
Statistics South Africa
Census 2011 Provincial Profile: Western Cape, Report 03-01-70
29
3.6 General health and functioning
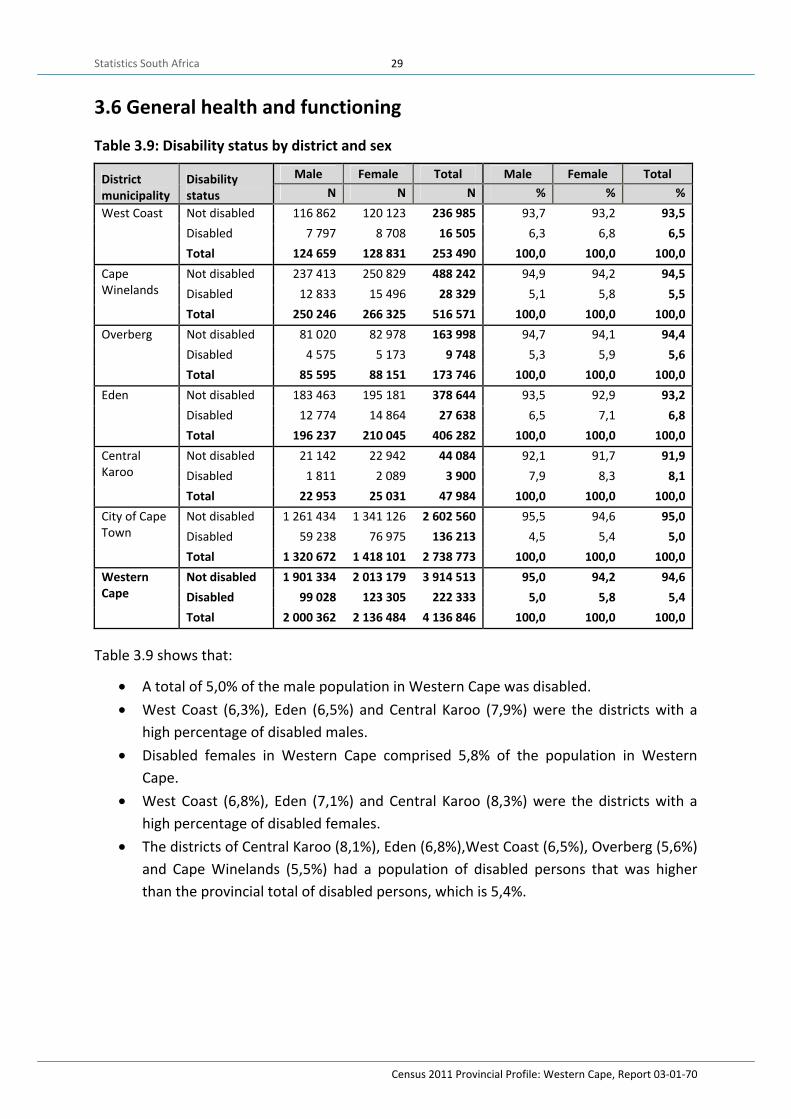
Table 3.9: Disability status by district and sex
District municipality
Disability status
Male Female Total Male Female Total N N N % % %
West Coast Not disabled 116 862 120 123 236 985 93,7 93,2 93,5Disabled 7 797 8 708 16 505 6,3 6,8 6,5Total 124 659 128 831 253 490 100,0 100,0 100,0
Cape Winelands
Not disabled 237 413 250 829 488 242 94,9 94,2 94,5Disabled 12 833 15 496 28 329 5,1 5,8 5,5Total 250 246 266 325 516 571 100,0 100,0 100,0
Overberg Not disabled 81 020 82 978 163 998 94,7 94,1 94,4Disabled 4 575 5 173 9 748 5,3 5,9 5,6Total 85 595 88 151 173 746 100,0 100,0 100,0
Eden Not disabled 183 463 195 181 378 644 93,5 92,9 93,2Disabled 12 774 14 864 27 638 6,5 7,1 6,8Total 196 237 210 045 406 282 100,0 100,0 100,0
Central Karoo
Not disabled 21 142 22 942 44 084 92,1 91,7 91,9Disabled 1 811 2 089 3 900 7,9 8,3 8,1Total 22 953 25 031 47 984 100,0 100,0 100,0
City of Cape Town
Not disabled 1 261 434 1 341 126 2 602 560 95,5 94,6 95,0Disabled 59 238 76 975 136 213 4,5 5,4 5,0Total 1 320 672 1 418 101 2 738 773 100,0 100,0 100,0
Western Cape
Not disabled 1 901 334 2 013 179 3 914 513 95,0 94,2 94,6Disabled 99 028 123 305 222 333 5,0 5,8 5,4Total 2 000 362 2 136 484 4 136 846 100,0 100,0 100,0
Table 3.9 shows that:
• A total of 5,0% of the male population in Western Cape was disabled. • West Coast (6,3%), Eden (6,5%) and Central Karoo (7,9%) were the districts with a
high percentage of disabled males. • Disabled females in Western Cape comprised 5,8% of the population in Western
Cape. • West Coast (6,8%), Eden (7,1%) and Central Karoo (8,3%) were the districts with a
high percentage of disabled females. • The districts of Central Karoo (8,1%), Eden (6,8%),West Coast (6,5%), Overberg (5,6%)
and Cape Winelands (5,5%) had a population of disabled persons that was higher than the provincial total of disabled persons, which is 5,4%.

Statistics South Africa
Census 2011 Provincial Profile: Western Cape, Report 03-01-70
30
3.7 Education
3.7.1 School attendance
Figure 3.5: Percentage of persons aged 5–24 years attending school by district municipality, censuses of 1996, 2001 and 2011
Figure 3.5 shows the percentage of persons aged 5 to 24 years who were attending school for the period 1996–2011 for all district municipalities in Western Cape. It shows that on average, two-thirds of these learners were attending school across all district municipalities. The City of Cape Town (67,8%) and Central Karoo (67,6%) recorded the highest percentage of persons who attended school. The percentage for both these district municipalities was also higher than the provincial average of 67,0%.
WesternCape
WestCoast
CapeWinelands Overberg Eden Central
Karoo City of
Cape Town1996 64,9 60,0 63,8 59,6 63,4 64,8 66,12001 65,3 59,9 66,0 60,1 63,8 63,4 66,32011 67,0 62,1 66,7 64,0 66,8 67,6 67,8
54,0
56,0
58,0
60,0
62,0
64,0
66,0
68,0
70,0
Perc
enta
ge %
Statistics South Africa
Census 2011 Provincial Profile: Western Cape, Report 03-01-70
31
3.7.2 Type of institution
Figure 3.6: Type of institution attended by persons aged 5–24 years by district municipality and population group, Census 2011
Source: Census 2011
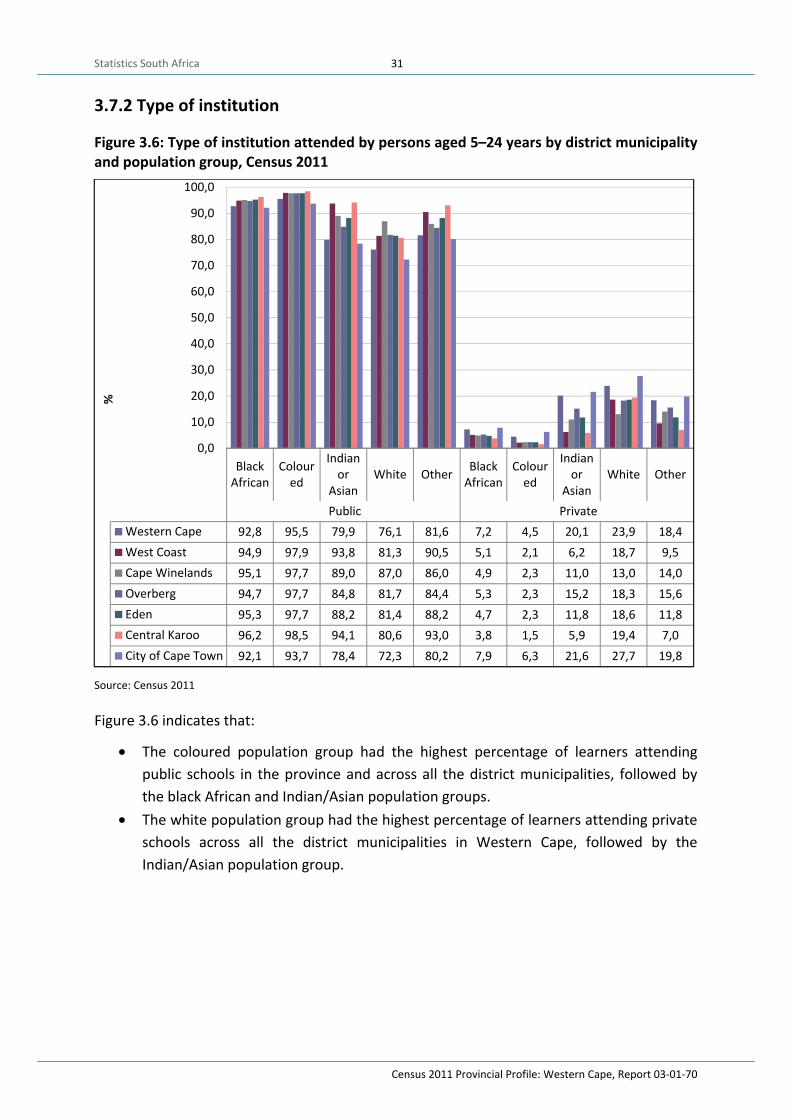
Figure 3.6 indicates that:
• The coloured population group had the highest percentage of learners attending public schools in the province and across all the district municipalities, followed by the black African and Indian/Asian population groups.
• The white population group had the highest percentage of learners attending private schools across all the district municipalities in Western Cape, followed by the Indian/Asian population group.
BlackAfrican
Coloured
Indianor
AsianWhite Other Black
AfricanColour
ed
Indianor
AsianWhite Other
Public PrivateWestern Cape 92,8 95,5 79,9 76,1 81,6 7,2 4,5 20,1 23,9 18,4West Coast 94,9 97,9 93,8 81,3 90,5 5,1 2,1 6,2 18,7 9,5Cape Winelands 95,1 97,7 89,0 87,0 86,0 4,9 2,3 11,0 13,0 14,0Overberg 94,7 97,7 84,8 81,7 84,4 5,3 2,3 15,2 18,3 15,6Eden 95,3 97,7 88,2 81,4 88,2 4,7 2,3 11,8 18,6 11,8Central Karoo 96,2 98,5 94,1 80,6 93,0 3,8 1,5 5,9 19,4 7,0City of Cape Town 92,1 93,7 78,4 72,3 80,2 7,9 6,3 21,6 27,7 19,8
0,0
10,0
20,0
30,0
40,0
50,0
60,0
70,0
80,0
90,0
100,0
%

Statistics South Africa
Census 2011 Provincial Profile: Western Cape, Report 03-01-70
32
3.7.3 Educational attainment
Figure 3.7: Percentage distribution of persons aged 20 years and older by highest education level and district municipality, censuses of 1996, 2001 and 2011
Figure 3.7 indicates that:
• The proportion of persons that have attained the highest qualification of grade 12 has increased across all districts between 1996 and 2011, while that of persons with no schooling has decreased
• The City of Cape Town had the highest increase in the proportion of persons aged 20 years and older that have attained a higher qualification (higher than grade 12) between 1996 and 2011.
1996 2001 2011 1996 2001 2011 1996 2001 2011No schooling Grade 12/Std 10 Higher
West Coast 11,9 9,2 5,4 13,9 18,5 23,7 8,4 6,8 8,2Cape Winelands 10,5 8,4 4,4 15,4 19,1 24,4 10,0 9,3 10,7Overberg 9,2 7,3 4,0 13,9 19,4 23,1 10,0 8,7 11,6 Eden 9,3 7,8 3,7 17,5 22,1 28,1 9,9 9,7 11,0Central Karoo 20,4 16,8 10,2 11,4 14,5 21,5 6,6 5,9 7,1City of Cape Town 4,4 4,2 1,8 20,5 25,4 29,9 12,5 12,6 16,7Western Cape 6,6 5,7 2,7 18,8 23,4 28,2 11,5 11,2 14,4
0,0
5,0
10,0
15,0
20,0
25,0
30,0
35,0
Perc
enta
ge
Statistics South Africa
Census 2011 Provincial Profile: Western Cape, Report 03-01-70
33
3.8 Labour force
3.8.1 District
Figure 3.8: Unemployment rate (official definition) by district municipality – 1996, 2001 and 2011
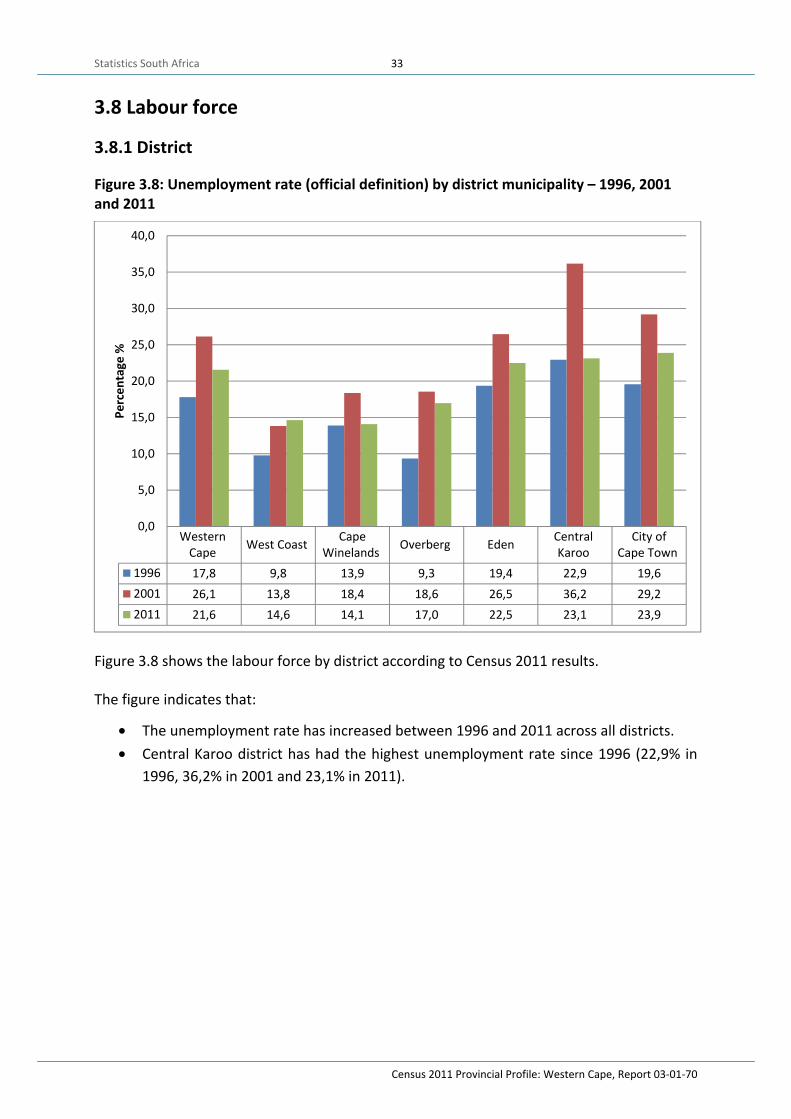
Figure 3.8 shows the labour force by district according to Census 2011 results.
The figure indicates that:
• The unemployment rate has increased between 1996 and 2011 across all districts. • Central Karoo district has had the highest unemployment rate since 1996 (22,9% in
1996, 36,2% in 2001 and 23,1% in 2011).
WesternCape West Coast Cape
Winelands Overberg Eden CentralKaroo
City ofCape Town
1996 17,8 9,8 13,9 9,3 19,4 22,9 19,62001 26,1 13,8 18,4 18,6 26,5 36,2 29,22011 21,6 14,6 14,1 17,0 22,5 23,1 23,9
0,0
5,0
10,0
15,0
20,0
25,0
30,0
35,0
40,0
Perc
enta
ge %
Statistics South Africa
Census 2011 Provincial Profile: Western Cape, Report 03-01-70
34
Figure 3.9: Employment status by district and sex, 2011
Source: Census 2011
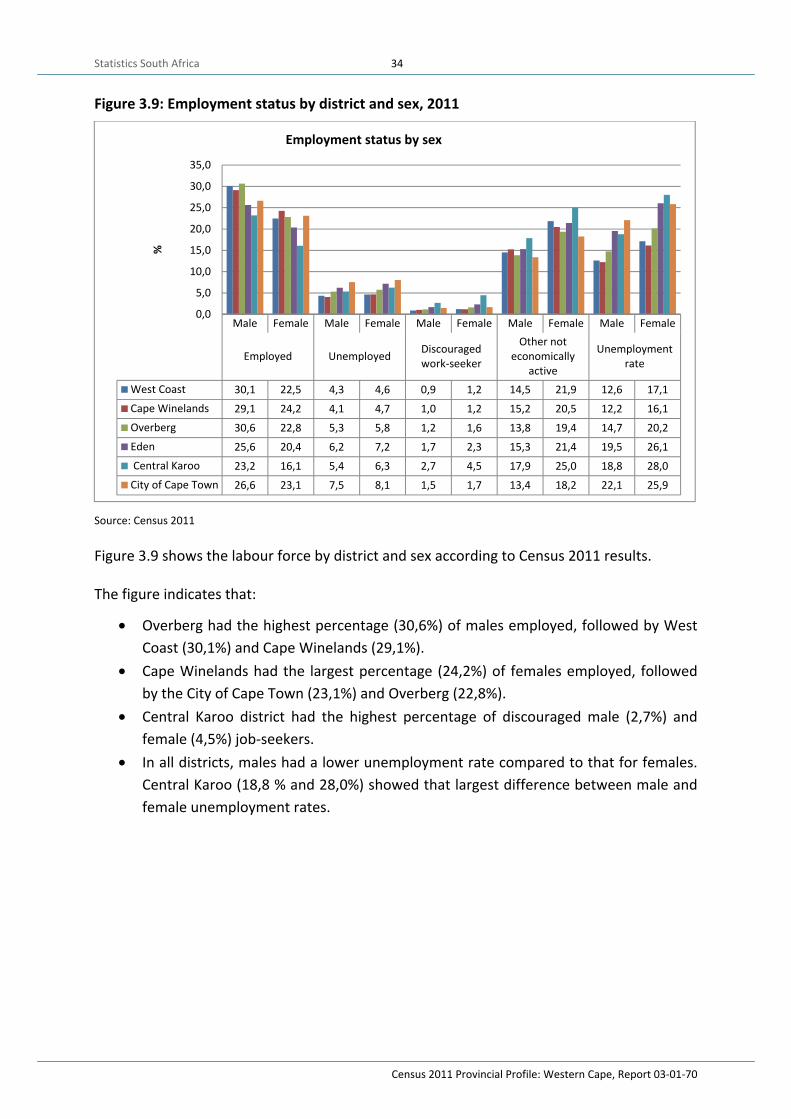
Figure 3.9 shows the labour force by district and sex according to Census 2011 results.
The figure indicates that:
• Overberg had the highest percentage (30,6%) of males employed, followed by West Coast (30,1%) and Cape Winelands (29,1%).
• Cape Winelands had the largest percentage (24,2%) of females employed, followed by the City of Cape Town (23,1%) and Overberg (22,8%).
• Central Karoo district had the highest percentage of discouraged male (2,7%) and female (4,5%) job-seekers.
• In all districts, males had a lower unemployment rate compared to that for females. Central Karoo (18,8 % and 28,0%) showed that largest difference between male and female unemployment rates.
Male Female Male Female Male Female Male Female Male Female
Employed Unemployed Discouragedwork-seeker
Other noteconomically
active
Unemploymentrate
West Coast 30,1 22,5 4,3 4,6 0,9 1,2 14,5 21,9 12,6 17,1Cape Winelands 29,1 24,2 4,1 4,7 1,0 1,2 15,2 20,5 12,2 16,1Overberg 30,6 22,8 5,3 5,8 1,2 1,6 13,8 19,4 14,7 20,2Eden 25,6 20,4 6,2 7,2 1,7 2,3 15,3 21,4 19,5 26,1 Central Karoo 23,2 16,1 5,4 6,3 2,7 4,5 17,9 25,0 18,8 28,0City of Cape Town 26,6 23,1 7,5 8,1 1,5 1,7 13,4 18,2 22,1 25,9
0,0
5,0
10,0
15,0
20,0
25,0
30,0
35,0%
Employment status by sex
Statistics South Africa
Census 2011 Provincial Profile: Western Cape, Report 03-01-70
35
Chapter 4: Results pertaining to households
4.1 Household information
Figure 4.1: Average household size by district municipality, censuses of 1996, 2001 and 2011
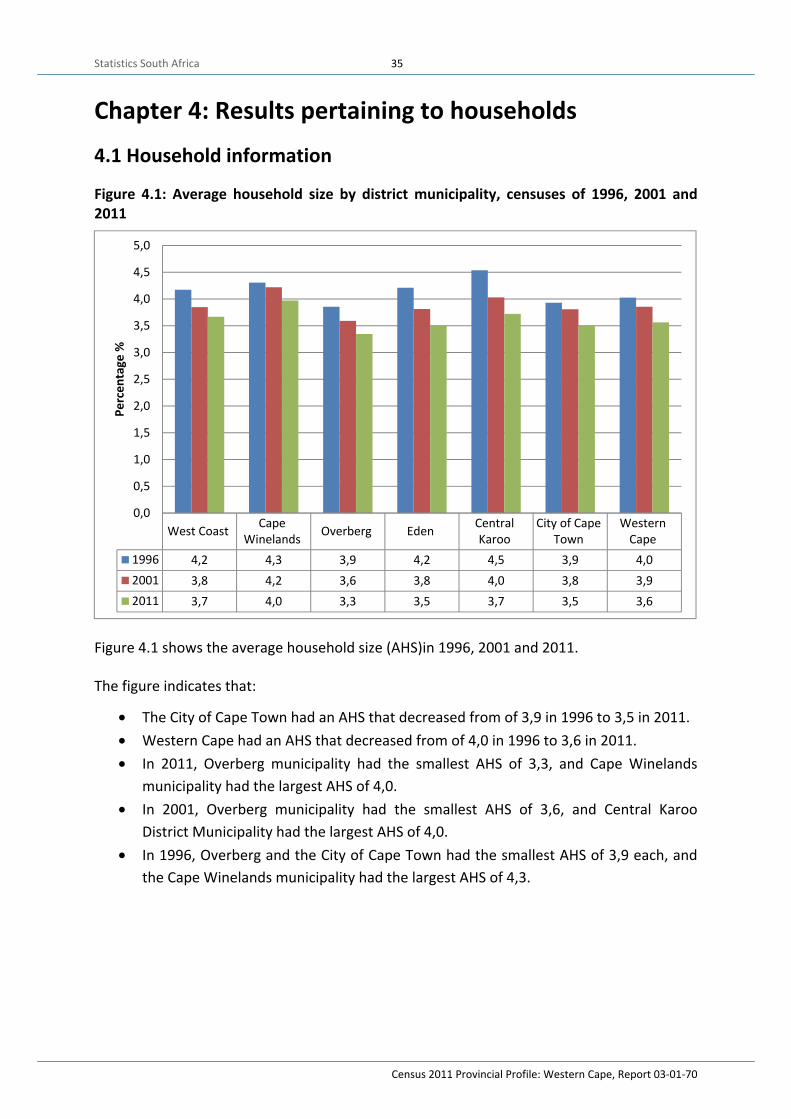
Figure 4.1 shows the average household size (AHS)in 1996, 2001 and 2011.
The figure indicates that:
• The City of Cape Town had an AHS that decreased from of 3,9 in 1996 to 3,5 in 2011. • Western Cape had an AHS that decreased from of 4,0 in 1996 to 3,6 in 2011. • In 2011, Overberg municipality had the smallest AHS of 3,3, and Cape Winelands
municipality had the largest AHS of 4,0. • In 2001, Overberg municipality had the smallest AHS of 3,6, and Central Karoo
District Municipality had the largest AHS of 4,0. • In 1996, Overberg and the City of Cape Town had the smallest AHS of 3,9 each, and
the Cape Winelands municipality had the largest AHS of 4,3.
West Coast CapeWinelands Overberg Eden Central
KarooCity of Cape
TownWestern
Cape1996 4,2 4,3 3,9 4,2 4,5 3,9 4,02001 3,8 4,2 3,6 3,8 4,0 3,8 3,92011 3,7 4,0 3,3 3,5 3,7 3,5 3,6
0,0
0,5
1,0
1,5
2,0
2,5
3,0
3,5
4,0
4,5
5,0
Perc
enta
ge %
Statistics South Africa
Census 2011 Provincial Profile: Western Cape, Report 03-01-70
36
Figure 4.2: Percentage of households headed by females by district, censuses of 1996, 2001 and 2011
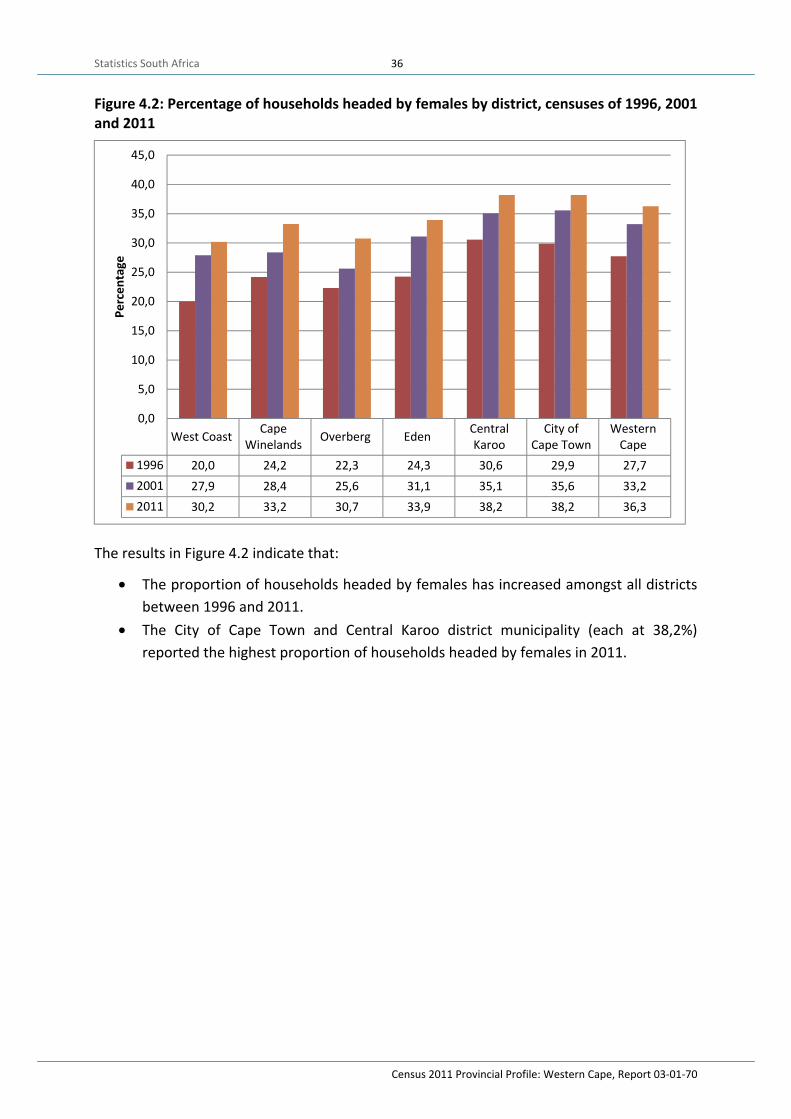
The results in Figure 4.2 indicate that:
• The proportion of households headed by females has increased amongst all districts between 1996 and 2011.
• The City of Cape Town and Central Karoo district municipality (each at 38,2%) reported the highest proportion of households headed by females in 2011.
West Coast CapeWinelands Overberg Eden Central
KarooCity of
Cape TownWestern
Cape1996 20,0 24,2 22,3 24,3 30,6 29,9 27,72001 27,9 28,4 25,6 31,1 35,1 35,6 33,22011 30,2 33,2 30,7 33,9 38,2 38,2 36,3
0,0
5,0
10,0
15,0
20,0
25,0
30,0
35,0
40,0
45,0
Perc
enta
ge
Statistics South Africa
Census 2011 Provincial Profile: Western Cape, Report 03-01-70
37
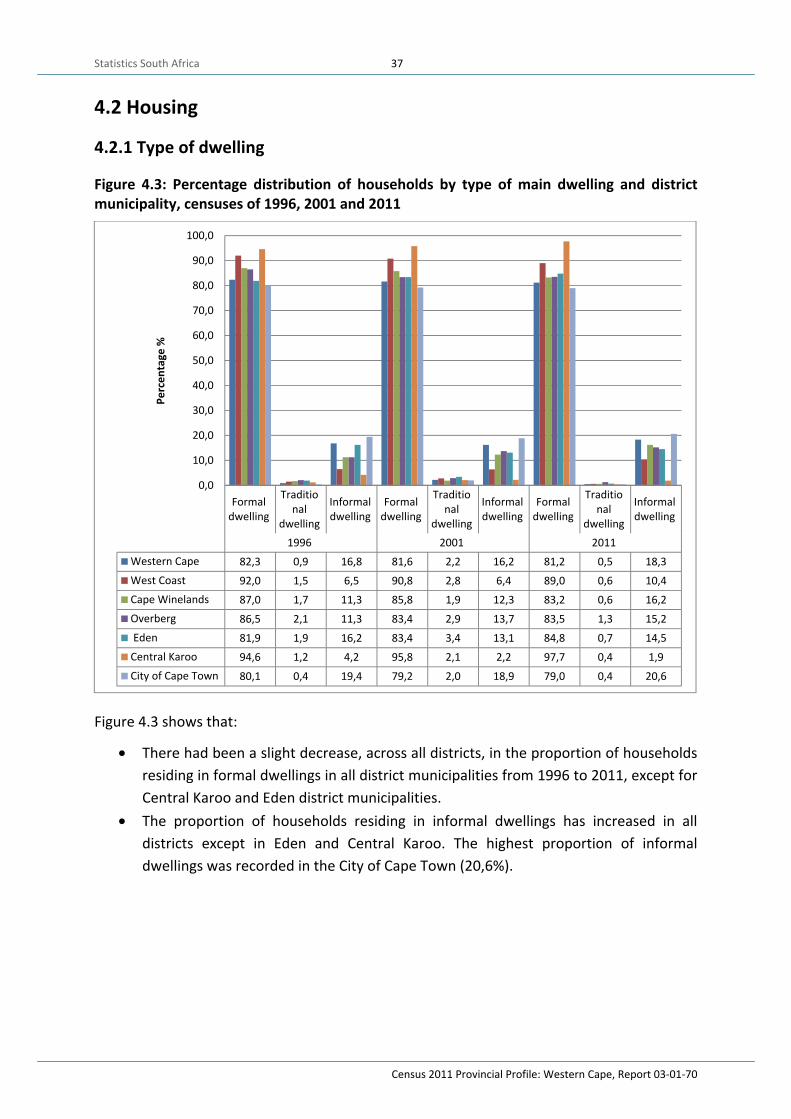
4.2 Housing
4.2.1 Type of dwelling
Figure 4.3: Percentage distribution of households by type of main dwelling and district municipality, censuses of 1996, 2001 and 2011
Figure 4.3 shows that:
• There had been a slight decrease, across all districts, in the proportion of households residing in formal dwellings in all district municipalities from 1996 to 2011, except for Central Karoo and Eden district municipalities.
• The proportion of households residing in informal dwellings has increased in all districts except in Eden and Central Karoo. The highest proportion of informal dwellings was recorded in the City of Cape Town (20,6%).
Formaldwelling
Traditional
dwelling
Informaldwelling
Formaldwelling
Traditional
dwelling
Informaldwelling
Formaldwelling
Traditional
dwelling
Informaldwelling
1996 2001 2011Western Cape 82,3 0,9 16,8 81,6 2,2 16,2 81,2 0,5 18,3West Coast 92,0 1,5 6,5 90,8 2,8 6,4 89,0 0,6 10,4Cape Winelands 87,0 1,7 11,3 85,8 1,9 12,3 83,2 0,6 16,2Overberg 86,5 2,1 11,3 83,4 2,9 13,7 83,5 1,3 15,2 Eden 81,9 1,9 16,2 83,4 3,4 13,1 84,8 0,7 14,5Central Karoo 94,6 1,2 4,2 95,8 2,1 2,2 97,7 0,4 1,9City of Cape Town 80,1 0,4 19,4 79,2 2,0 18,9 79,0 0,4 20,6
0,0
10,0
20,0
30,0
40,0
50,0
60,0
70,0
80,0
90,0
100,0
Perc
enta
ge %

Statistics South Africa
Census 2011 Provincial Profile: Western Cape, Report 03-01-70
38
4.2.2 Refuse disposal
Figure 4.4: Percentage distribution of households by type of refuse removal and district municipality, censuses of 1996, 2001 and 2011
Source: Census 1996, 2001 and 2011
Figure 4.4 shows the percentage distribution of households by type of refuse disposal for Western Cape, according to the 1996, 2001 and 2011 census results.
The figure indicates that:
• There has been an increase across all districts, in the proportion of households where refuse had been removed by local authorities between 1996 and 2011.
• There has been a decrease across all districts, in the proportion of households making use of communal dumping facilities or getting rid of it themselves between 1996 and 2011.
• Only a small proportion of households across all districts did not have access to rubbish removal services between 1996 and 2011.
1996 2001 2011 1996 2001 2011 1996 2001 2011Removed by localauthories/ private
companyCommunal/own refuse No rubbish disposal
West Coast 66,3 71,8 79,0 32,7 28,0 19,7 1,0 1,1 1,2Cape Winelands 72,2 72,0 85,1 25,6 25,9 13,3 2,1 2,0 1,6Overberg 68,8 80,5 86,8 27,7 18,4 12,2 3,5 1,1 1,0Eden 78,5 82,9 88,3 18,8 15,4 9,3 2,7 1,7 2,3Central Karoo 71,8 78,6 80,3 26,5 21,1 18,3 1,7 0,4 1,4City of Cape Town 93,0 95,5 95,2 4,8 3,1 4,2 2,1 1,4 0,7Western Cape 86,2 88,8 91,7 11,6 9,8 7,3 2,2 1,4 1,0
0,010,020,030,040,050,060,070,080,090,0
100,0
Perc
enta
ge %

Statistics South Africa
Census 2011 Provincial Profile: Western Cape, Report 03-01-70
39
4.2.3 Toilet facilities
Figure 4.5: Percentage distribution of households by type of toilet facility by district municipality, censuses of 1996, 2001 and 2011
Figure 4.5 indicates that:
• There has been an increase across all districts, in the proportion of households making use of flush or chemical toilet facilities between 1996 and 2011.
• There has been an increase between 1996 and 2001 and a decrease between 2001 and 2011, across all districts, in the proportion of households making use of the bucket system. The highest decrease was recorded in Central Karoo from 16,6% in 1996 to 1,3% in 2011.
Flushand
chemicaltoilet
Buckettoilet
None/None of
theabove
Flushand
chemicaltoilet
Buckettoilet None
Flushand
chemicaltoilet
Buckettoilet None
1996 2001 2011West Coast 78,9 5,6 6,6 86,1 3,5 7,1 87,5 1,7 4,3Cape Winelands 82,3 2,4 6,2 86,4 1,6 8,5 91,5 2,6 2,9 Overberg 79,8 6 5,9 85,6 1,6 9,6 90,1 1,3 4,7 Eden 75,7 6,4 6,5 82,2 3,3 9 85,7 1,9 4Central Karoo 68,4 16,6 8,9 85,6 2,1 7,8 89,5 1,3 3,2City of Cape Town 89,6 3,1 4,9 87,4 4,5 7,3 91,4 4,5 2,7Western Cape 79,1 6,7 6,5 85,6 2,8 8,2 89,3 2,2 3,6
0102030405060708090
100
Perc
enta
ge

Statistics South Africa
Census 2011 Provincial Profile: Western Cape, Report 03-01-70
40
4.2.4 Electricity for lighting, cooking, heating
Figure 4.6: Percentage of households using electricity for lighting, cooking and heating by district municipality, censuses of 1996, 2001 and 2011
Source: Census 1996, 2001 and 2011
The results in Figure 4.6 above indicate that:
• There has been an increase across all districts, in the proportion of households making use of electricity as main source of energy for lighting, cooking and heating, between 1996 and 2011.
1996 2001 2011 1996 2001 2011 1996 2001 2011Cooking Heating Lighting
West Coast 72,1 79,2 89,7 71,5 74,2 83,2 82,5 87,8 94,8Cape Winelands 75,5 79,6 88,1 71,5 72,1 76,8 85,2 88,0 93,2Overberg 69,4 75,3 81,6 70,4 70,4 73,9 82,6 83,7 91,5Eden 65,8 72,5 82,9 65,9 68,7 72,8 79,3 85,5 91,4Central Karoo 49,3 62,4 81,8 43,1 53,6 71,4 79,6 83,9 89,7City of Cape Town 80,2 80,1 87,9 77,9 75,0 75,1 87,2 88,8 94,2Western Cape 77,0 78,8 87,2 74,9 73,4 75,5 85,7 88,0 93,6
0,010,020,030,040,050,060,070,080,090,0
100,0
Perc
enta
ge

Statistics South Africa
Census 2011 Provincial Profile: Western Cape, Report 03-01-70
41
4.2.5 Access to water
Figure 4.7: Percentage of households that have access to piped water by district municipality, censuses of 1996, 2001 and 2011
Figure 4.7 shows the percentage of households that have access to piped water in Western Cape, according to the 1996, 2001 and 2011 census results.
The figure shows that:
• Between 1996 and 2011, there has been an increase across all districts in the proportion of households making use of piped water in their dwellings.
• Between 1996 and 2001, there has been a decrease, and then an increase between 2001 and 2001, across all districts, in the proportion of households making use of piped water from an access point outside the yard of the dwelling that they reside at.
• There had been a decrease across all wards in the proportion of households not having access to piped water between 1996 and 2011.
1996 2001 2011 1996 2001 2011 1996 2001 2011
Piped water inside thedwelling or yard
Piped water fromaccess point outside
the yard
No access to pipedwater
West Coast 92,6 89,7 96,0 4,2 8,3 3,0 3,2 2,0 1,0Cape Winelands 89,5 86,6 89,1 6,8 11,2 10,1 3,7 2,1 0,8Overberg 86,4 86,0 88,7 8,6 12,8 10,5 5,0 1,2 0,8Eden 84,7 83,7 88,9 7,9 12,0 8,9 7,5 4,3 2,2Central Karoo 95,4 93,1 97,1 1,9 5,7 2,3 2,7 1,1 0,6City of Cape Town 89,8 84,4 87,3 8,3 14,3 12,0 1,9 1,2 0,7Western Cape 89,4 85,2 88,4 7,8 13,1 10,7 2,8 1,7 0,9
0,0
10,0
20,0
30,0
40,0
50,0
60,0
70,0
80,0
90,0
100,0Pe
rcen
tage
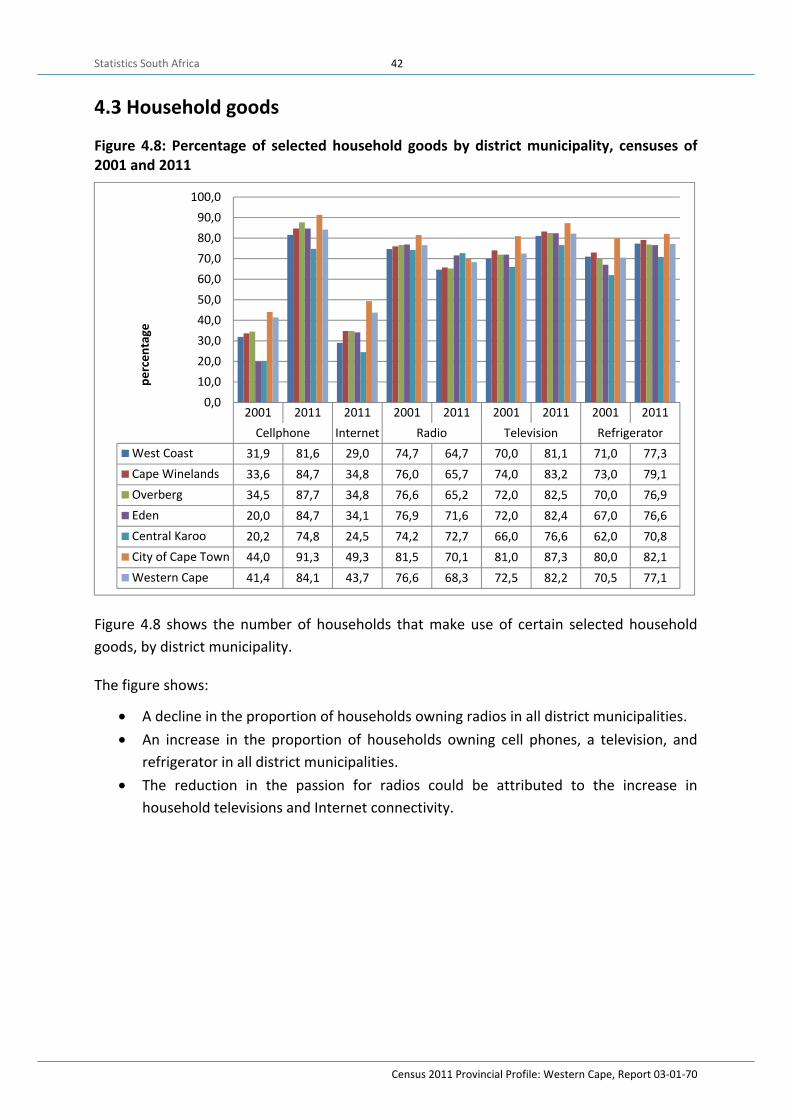
Statistics South Africa
Census 2011 Provincial Profile: Western Cape, Report 03-01-70
42
4.3 Household goods
Figure 4.8: Percentage of selected household goods by district municipality, censuses of 2001 and 2011
Figure 4.8 shows the number of households that make use of certain selected household goods, by district municipality.
The figure shows:
• A decline in the proportion of households owning radios in all district municipalities. • An increase in the proportion of households owning cell phones, a television, and
refrigerator in all district municipalities. • The reduction in the passion for radios could be attributed to the increase in
household televisions and Internet connectivity.
2001 2011 2011 2001 2011 2001 2011 2001 2011Cellphone Internet Radio Television Refrigerator
West Coast 31,9 81,6 29,0 74,7 64,7 70,0 81,1 71,0 77,3Cape Winelands 33,6 84,7 34,8 76,0 65,7 74,0 83,2 73,0 79,1Overberg 34,5 87,7 34,8 76,6 65,2 72,0 82,5 70,0 76,9Eden 20,0 84,7 34,1 76,9 71,6 72,0 82,4 67,0 76,6Central Karoo 20,2 74,8 24,5 74,2 72,7 66,0 76,6 62,0 70,8City of Cape Town 44,0 91,3 49,3 81,5 70,1 81,0 87,3 80,0 82,1Western Cape 41,4 84,1 43,7 76,6 68,3 72,5 82,2 70,5 77,1
0,010,020,030,040,050,060,070,080,090,0
100,0
perc
enta
ge

Statistics South Africa
Census 2011 Provincial Profile: Western Cape, Report 03-01-70
43
Chapter 5: Conclusion Western Cape had the highest omission rate for persons and households (18,6% and 17,8% respectively) compared to other provinces. Amongst all district municipalities in Western Cape, the City of Cape Town had the largest population density, followed by Cape Winelands.
Western Cape has shown a consistent increase in the percentage share of total population between 1996 and 2011, from 9,7% in 1996 to 10,1% in 2001 and to 11,2% in 2011. Compared to other provinces, Western Cape had a mixed population group profile: Coloured (48,8%), black African (32,9%) as well as white (15,7%).
Overberg municipality had the highest population increase (28,2%) between 1996 and 2001, followed by West Coast (20,3%). Results from 1996, 2001 and 2011 indicate that the largest population of people resided in the City of Cape Town with 64,8%, 65,0% and 64,2% respectively.
In 1996, the highest proportion of the population in Western Cape was between the ages of 0 and 34 years. Between 2001 and 2011, the highest proportion of the population was between the ages of 0 and 29 years. There has been a decrease in the dependency ratios between 1996 and 2011.
Most people in Western Cape are Afrikaans speaking (49,6%), followed by IsiXhosa (24,7%) and English (20,2%). The City of Cape Town had a fairly equal percentage of people speaking various first languages (Afrikaans at 35,7%, followed by IsiXhosa at 29,8% and English at 28,4%).
The percentage of learners attending school on a regular basis, across all district municipalities has increased.
Central Karoo had the highest percentage of people aged 20 years and older with no education, followed by West Coast and Cape Winelands. The City of Cape Town had the highest percentage of people aged 20 years and older with a higher education.
In 2011, the City of Cape Town had the highest unemployment rate (23,9%), followed by Central Karoo (23,1%) and Eden (22,5%). In 2011, Overberg had the highest percentage of employed persons (53,4%), followed by Cape Winelands (53,3%) and West Coast (52,6%).
In 2001 and 2011, Western Cape reported an average household size of 3,9 and 3,6 respectively. Western Cape also reported a slight increase between 2001 and 2011, in the proportion of households living in informal dwellings. There was an increase in the proportion of households where refuse had been removed by local authorities. The percentage of households using a communal dump or getting rid of their own refuse also decreased.
Statistics South Africa
Census 2011 Provincial Profile: Western Cape, Report 03-01-70
44
There has been an increase from 77,0% in 1996 to 87,2% in 2011 in the proportion of households making use of electricity for cooking, and from 85,7% in 1996 to 93,6% in 2011 for lighting in Western Cape. The same upward trend has been depicted for all district municipalities.

Statistics South Africa
Census 2011 Provincial Profile: Western Cape, Report 03-01-70
45
Appendix Table 6.1: Population and percentage share by province
Province 1996 2001 2011 Eastern Cape 6 147 244 6 278 651 6 562 053 Free State 2 633 504 2 706 775 2 745 590 Gauteng 7 834 125 9 388 854 12 272 263 KwaZulu-Natal 8 572 302 9 584 129 10 267 300 Limpopo 4 576 566 4 995 462 5 404 868 Mpumalanga 3 123 869 3 365 554 4 039 939 North West 2 727 223 2 984 098 3 509 953 Northern Cape 1 011 864 991 919 1 145 861 Western Cape 3 956 875 4 524 335 5 822 734 South Africa 40 583 573 44 819 778 51 770 560
Table 6.2: Distribution of population by age and sex, South Africa
Age group 1996 2001 2011
Male Female Male Female Male Female 0–4 2 216 763 2 226 858 2 223 731 2 226 085 2 867 585 2 817 867 5–9 2 333 563 2 335 160 2 425 804 2 427 751 2 425 181 2 394 570 10–14 2 308 759 2 345 341 2 518 956 2 542 961 2 344 275 2 250 611 15–19 2 050 213 2 130 503 2 453 079 2 528 642 2 498 572 2 504 905 20–24 1 917 918 2 064 435 2 099 293 2 195 230 2 694 646 2 679 896 25–29 1 663 064 1 792 664 1 899 124 2 035 814 2 542 682 2 516 635 30–34 1 463 499 1 610 702 1 594 488 1 746 412 2 036 206 1 992 804 35–39 1 284 955 1 368 800 1 441 507 1 630 264 1 709 347 1 758 420 40–44 1 030 597 1 108 028 1 233 632 1 385 832 1 402 328 1 546 291 45–49 813 816 863710 967 604 1 119 776 1 195 740 1 424 543 50–54 600 477 668 418 769 499 868 521 1 011 349 1 206 940 55–59 483 678 586 258 552 323 652 943 811 950 985 458 60–64 352 053 538 483 444 510 620 784 612 364 773 404 65–69 304 013 454 874 304 763 483 164 401 548 556 256 70–74 195 119 287 044 232 547 398 922 293 498 454 832 75–79 141 844 235 583 136 436 231 101 165 283 315 984 80–84 62 072 116 831 90 835 180 111 100 694 222 222 85+ 298 483 328 995 45 907 111 425 75 543 180 130

Statistics South Africa
Census 2011 Provincial Profile: Western Cape, Report 03-01-70
46
Table 6.3: Distribution of population by age and sex, Western Cape
Age group 1996 2001 2011
Male Female Male Female Male Female 0–4 191 148 188 876 204 553 200 989 288 052 276 748 5–9 191 798 189 621 205 336 203 870 231 828 228 333 10–14 191 164 191 841 210 029 211 923 221 782 217 061 15–19 174 325 175 894 217 575 228 671 235 421 244 701 20–24 196 033 201 220 210 504 220 328 292 007 291 543 25–29 186 602 191 627 209 971 215 830 299 476 293 072 30–34 171 115 177 443 191 773 201 055 245 789 235 812 35–39 142 999 150 405 174 944 186 539 219 196 217 442 40–44 115 549 124 346 146 544 160 856 193 282 201 755 45–49 93 176 98 546 112 348 125 208 164 540 183 326 50–54 71 303 76 564 91 071 99 069 137 624 155 061 55–59 58 209 63 351 67 073 75 291 105 257 122 841 60–64 45 228 54 408 54 581 64 310 81 580 96 978 65–69 35 144 42 490 38 985 48 766 56 107 69 103 70–74 22 769 30 995 27 328 37 051 40 357 52 837 75–79 13 901 21 530 16 275 25 036 24 135 35 806 80–84 6 962 13 966 9 091 15 649 13 253 23 182 85+ 4 315 10 234 4 339 11 572 8 821 18 627
Table 6.4: Age dependency ratios by province, 1996–2011
Age group 1996 2001 2011
Male Female Male Female Male Female 0–4 2 216 763 2 226 858 2 223 731 2 226 085 2 867 585 2 817 867 5–9 2 333 563 2 335 160 2 425 804 2 427 751 2 425 181 2 394 570 10–14 2 308 759 2 345 341 2 518 956 2 542 961 2 344 275 2 250 611 15–19 2 050 213 2 130 503 2 453 079 2 528 642 2 498 572 2 504 905 20–24 1 917 918 2 064 435 2 099 293 2 195 230 2 694 646 2 679 896 25–29 1 663 064 1 792 664 1 899 124 2 035 814 2 542 682 2 516 635 30–34 1 463 499 1 610 702 1 594 488 1 746 412 2 036 206 1 992 804 35–39 1 284 955 1 368 800 1 441 507 1 630 264 1 709 347 1 758 420 40–44 1 030 597 1 108 028 1 233 632 1 385 832 1 402 328 1 546 291 45–49 813 816 863 710 967 604 1 119 776 1 195 740 1 424 543 50–54 600 477 668 418 769 499 868 521 1 011 349 1 206 940 55–59 483 678 586 258 552 323 652 943 811 950 985 458 60–64 352 053 538 483 444 510 620 784 612 364 773 404 65–69 304 013 454 874 304 763 483 164 401 548 556 256 70–74 195 119 287 044 232 547 398 922 293 498 454 832 75–79 141 844 235 583 136 436 231 101 165 283 315 984 80–84 62 072 116 831 90 835 180 111 100 694 222 222 85+ 43 230 94 054 45 907 111 425 75 543 180 130

Statistics South Africa
Census 2011 Provincial Profile: Western Cape, Report 03-01-70
47
Table 6.5: Distribution of the population aged 5–24 years attending school by district municipality, 1996, 2001 and 2011
District municipality 1996 2001 2011
Yes No Yes No Yes No West Coast 50217 33517 61882 41397 76458 46615 Cape Winelands 132442 75111 163201 83980 172500 85994 Overberg 31935 21646 42431 28153 48348 27188 Eden 85975 49547 106930 60790 119332 59401 Central Karoo 13774 7466 15012 8667 16242 7792 City of Cape Town 615639 315959 726497 369297 788353 374529 Western Cape 929981 503245 1115954 592283 1221232 601519
Table 6.6: Disability status by district and sex
District municipality
COMMUNICATION No difficulty Some difficulty A lot of difficulty Cannot do at all Male Female Male Female Male Female Male Female
Western Cape 98,8 99,0 0,8 0,7 0,2 0,2 0,2 0,1 West Coast 98,6 98,7 0,9 0,9 0,3 0,2 0,2 0,2 Cape Winelands 98,9 99,0 0,8 0,7 0,2 0,2 0,2 0,2 Overberg 98,9 98,9 0,8 0,8 0,2 0,2 0,1 0,2 Eden 98,7 98,8 0,9 0,8 0,2 0,2 0,2 0,1 Central Karoo 98,3 98,4 1,1 1,0 0,4 0,3 0,2 0,3 City of Cape Town 98,9 99,0 0,8 0,7 0,2 0,2 0,1 0,1
District municipality
HEARING No difficulty Some difficulty A lot of difficulty Cannot do at all Male Female Male Female Male Female Male Female
Western Cape 97,5 97,3 2,1 2,2 0,4 0,4 0,1 0,1 West Coast 96,7 96,7 2,6 2,7 0,6 0,5 0,1 0,1 Cape Winelands 97,6 97,4 1,9 2,1 0,4 0,4 0,1 0,1 Overberg 97,0 97,0 2,4 2,4 0,5 0,5 0,1 0,1 Eden 96,8 96,8 2,6 2,6 0,5 0,5 0,1 0,1 Central Karoo 96,6 96,8 2,6 2,6 0,7 0,5 0,1 0,1 City of Cape Town 97,7 97,5 1,9 2,1 0,3 0,3 0,1 0,1

Statistics South Africa
Census 2011 Provincial Profile: Western Cape, Report 03-01-70
48
Table 6.6: Disability status by district and sex (concluded)
District municipality
REMEMBERING/CONCENTRATING No difficulty Some difficulty A lot of difficulty Cannot do at all Male Female Male Female Male Female Male Female
Western Cape 97,8 97,5 1,6 2,0 0,4 0,4 0,2 0,1 West Coast 97,5 97,1 1,9 2,2 0,5 0,5 0,2 0,2 Cape Winelands 98,1 97,9 1,4 1,6 0,4 0,4 0,2 0,2 Overberg 97,9 97,6 1,6 1,8 0,4 0,4 0,1 0,1 Eden 97,5 97,0 1,9 2,3 0,5 0,5 0,2 0,2 Central Karoo 97,0 96,7 2,2 2,6 0,7 0,5 0,2 0,2 City of Cape Town 97,9 97,5 1,6 2,0 0,4 0,4 0,1 0,1
District municipality
SEEING No difficulty Some difficulty A lot of difficulty Cannot do at all Male Female Male Female Male Female Male Female
Western Cape 92,1 88,9 6,8 9,5 0,9 1,4 0,1 0,1 West Coast 90,8 88,6 7,8 9,7 1,3 1,6 0,1 0,1 Cape Winelands 92,2 89,6 6,6 8,7 1,1 1,5 0,1 0,2 Overberg 92,0 89,5 6,8 8,9 1,1 1,4 0,1 0,1 Eden 91,1 88,5 7,5 9,7 1,3 1,7 0,1 0,2 Central Karoo 90,4 88,0 7,8 9,6 1,7 2,2 0,2 0,2 City of Cape Town 92,4 88,9 6,7 9,7 0,8 1,3 0,1 0,1
District municipality
SELF CARE No difficulty Some difficulty A lot of difficulty Cannot do at all Male Female Male Female Male Female Male Female
Western Cape 97,8 97,9 1,1 1,1 0,3 0,3 0,7 0,7 West Coast 97,1 97,2 1,4 1,4 0,4 0,4 1,0 1 Cape Winelands 97,8 97,9 1,0 1,0 0,3 0,3 0,9 0,8 Overberg 98,0 98,0 1,1 1,1 0,3 0,3 0,6 0,5 Eden 97,1 97,2 1,3 1,3 0,4 0,4 1,2 1,1 Central Karoo 96,3 96,5 1,7 1,7 0,8 0,6 1,2 1,3 City of Cape Town 98,1 96,6 1,0 1,6 0,3 0,5 0,6 1,3
District municipality
WALKING OR CLIMBING STAIRS No difficulty Some difficulty A lot of difficulty Cannot do at all Male Female Male Female Male Female Male Female
Western Cape 97,4 96,9 1,8 2,2 0,6 0,7 0,3 0,3 West Coast 96,8 96,5 2,2 2,4 0,8 0,8 0,3 0,3 Cape Winelands 97,4 97,0 1,6 2,0 0,6 0,7 0,3 0,3 Overberg 97,0 96,7 2,1 2,3 0,7 0,7 0,3 0,3 Eden 96,6 96,3 2,3 2,6 0,8 0,8 0,3 0,3 Central Karoo 96,0 95,7 2,5 2,8 1,1 1,1 0,4 0,4 City of Cape Town 97,6 97,0 1,6 2,1 0,5 0,6 0,3 0,2

Statistics South Africa
Census 2011 Provincial Profile: Western Cape, Report 03-01-70
49
Table 6.7: Unemployment rate (official definition) by district municipality, 1996, 2001 and 2011
District municipality 1996 2001 2011
Employed Unemployed Employed Unemployed Employed Unemployed West Coast 91 271 9 888 107 285 17 212 141 117 24 204 Cape Winelands 207 265 33 433 221 546 49 803 289 765 47 487 Overberg 60 311 6 220 71 704 16 341 93 061 19 011 Eden 119 067 28 595 136 719 49 190 175 055 50 787 Central Karoo 14 023 4 173 13 565 7 685 17 460 5 254 City of Cape Town 904 120 219 896 938 903 386 764 1 294 239 405 989
Table 6.8: Average household size by district municipality, 1996, 2001 and 2011
District municipality 1996 2001 2011 West Coast 4,2 3,8 3,7 Cape Winelands 4,3 4,2 4,0 Overberg 3,9 3,6 3,3 Eden 4,2 3,8 3,5 Central Karoo 4,5 4,0 3,7 City of Cape Town 3,9 3,8 3,5

Statistics South Africa
Census 2011 Provincial Profile: Western Cape, Report 03-01-70
50
Table 6.9: Distribution of household by type of main dwelling and district municipality, 1996, 2001 and 2011
District municipality Formal dwelling Traditional dwelling Informal dwelling
1996 2001 2011 1996 2001 2011 1996 2001 2011 West Coast 51 030 66 405 93 832 849 2 073 631 3 618 4 689 11 017 Cape Winelands 111 751 127 730 163 078 2 179 2 898 1 198 14 492 18 276 31 652 Overberg 35 227 47 034 63 252 868 1 631 986 4 618 7 702 11 554 Eden 73 111 99 108 137 447 1 738 4 088 1 106 14 434 15 575 23 591 Central Karoo 11 473 14 356 18 495 144 308 85 505 323 357 City of Cape Town 516 693 599 471 837 532 2 850 14 769 3 767 125 204 142 981 218 780
Table 6.10: Distribution of households by type of refuse removal and district municipality, 1996, 2001 and 2011
District municipality
1996 2001 2011 Removed
by localauthority
at leastonce a
week
Removed by local
authority less
often
Communal refuse dump
Own refuse dump
No rubbish
disposal
Removed by local
authority at least once a
week
Removed by local
authority less
often
Communal refuse dump
Own refuse dump
No rubbish
disposal
Removed by local
authority at least once a
week
Removed by local
authority less
often
Communal refuse dump
Own refuse dump
No rubbish
disposal
West Coast 36 264 426 5 435 12 494 491 52 104 272 1 943 18 659 472 81 686 1 846 2 690 18 176 1 289 Cape Winelands 90 322 1 814 15 609 17 111 2 692 105 655 1 898 11 706 27 022 3 047 158 426 7 934 7 560 18 426 3 108
Overberg 26 853 697 4 276 6 818 1 371 44 744 943 1 336 9 099 603 64 246 1 479 1 630 7 589 786
Eden 68 410 939 1 923 14 705 2 376 98 430 494 1 437 16 930 2 014 141 772 1 255 2 852 12 219 3 799 Central Karoo 8 096 24 414 2 585 43 11 751 43 205 2 955 55 15 018 201 312 3 163 261 City of Cape Town 578 213 20 481 9 617 21 549 13 465 717 028 8 474 9 532 13 965 10 485 1 007 289 7 261 29 613 14 682 7 209
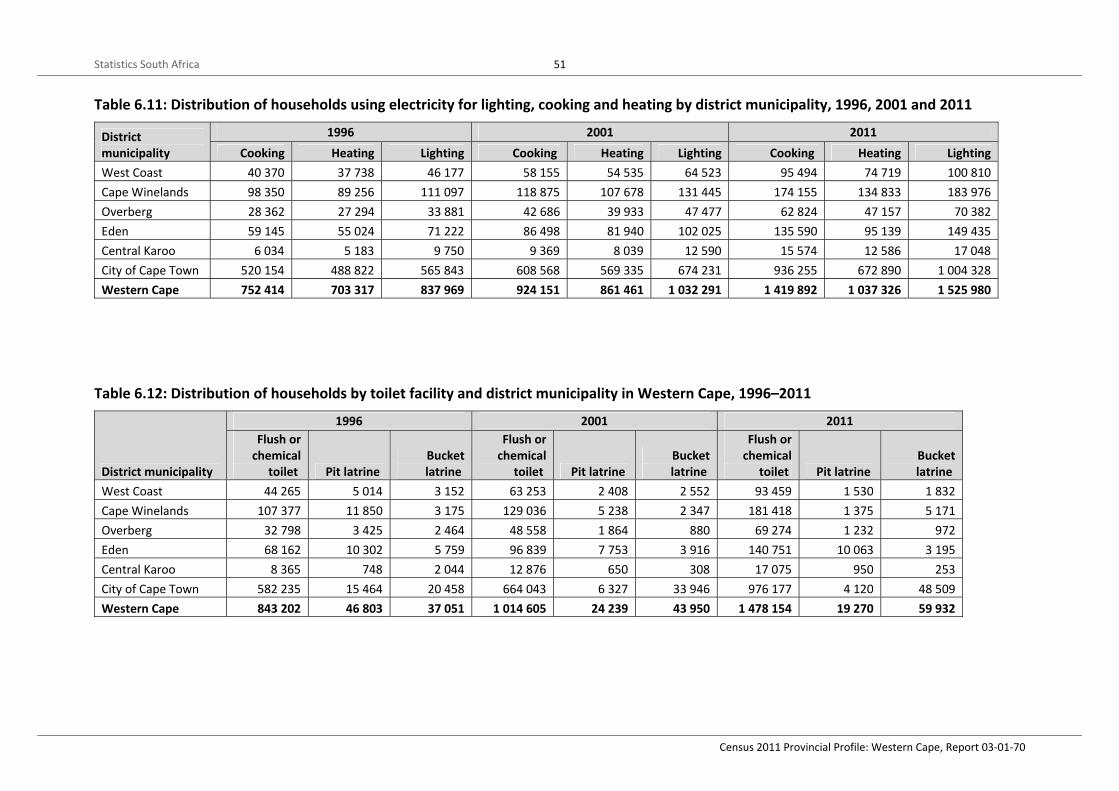
Statistics South Africa
Census 2011 Provincial Profile: Western Cape, Report 03-01-70
51
Table 6.11: Distribution of households using electricity for lighting, cooking and heating by district municipality, 1996, 2001 and 2011
District municipality
1996 2001 2011 Cooking Heating Lighting Cooking Heating Lighting Cooking Heating Lighting
West Coast 40 370 37 738 46 177 58 155 54 535 64 523 95 494 74 719 100 810 Cape Winelands 98 350 89 256 111 097 118 875 107 678 131 445 174 155 134 833 183 976 Overberg 28 362 27 294 33 881 42 686 39 933 47 477 62 824 47 157 70 382 Eden 59 145 55 024 71 222 86 498 81 940 102 025 135 590 95 139 149 435 Central Karoo 6 034 5 183 9 750 9 369 8 039 12 590 15 574 12 586 17 048 City of Cape Town 520 154 488 822 565 843 608 568 569 335 674 231 936 255 672 890 1 004 328 Western Cape 752 414 703 317 837 969 924 151 861 461 1 032 291 1 419 892 1 037 326 1 525 980
Table 6.12: Distribution of households by toilet facility and district municipality in Western Cape, 1996–2011
District municipality
1996 2001 2011 Flush or
chemical toilet Pit latrine
Bucket latrine
Flush or chemical
toilet Pit latrine Bucket latrine
Flush or chemical
toilet Pit latrine Bucket latrine
West Coast 44 265 5 014 3 152 63 253 2 408 2 552 93 459 1 530 1 832 Cape Winelands 107 377 11 850 3 175 129 036 5 238 2 347 181 418 1 375 5 171 Overberg 32 798 3 425 2 464 48 558 1 864 880 69 274 1 232 972 Eden 68 162 10 302 5 759 96 839 7 753 3 916 140 751 10 063 3 195 Central Karoo 8 365 748 2 044 12 876 650 308 17 075 950 253 City of Cape Town 582 235 15 464 20 458 664 043 6 327 33 946 976 177 4 120 48 509 Western Cape 843 202 46 803 37 051 1 014 605 24 239 43 950 1 478 154 19 270 59 932
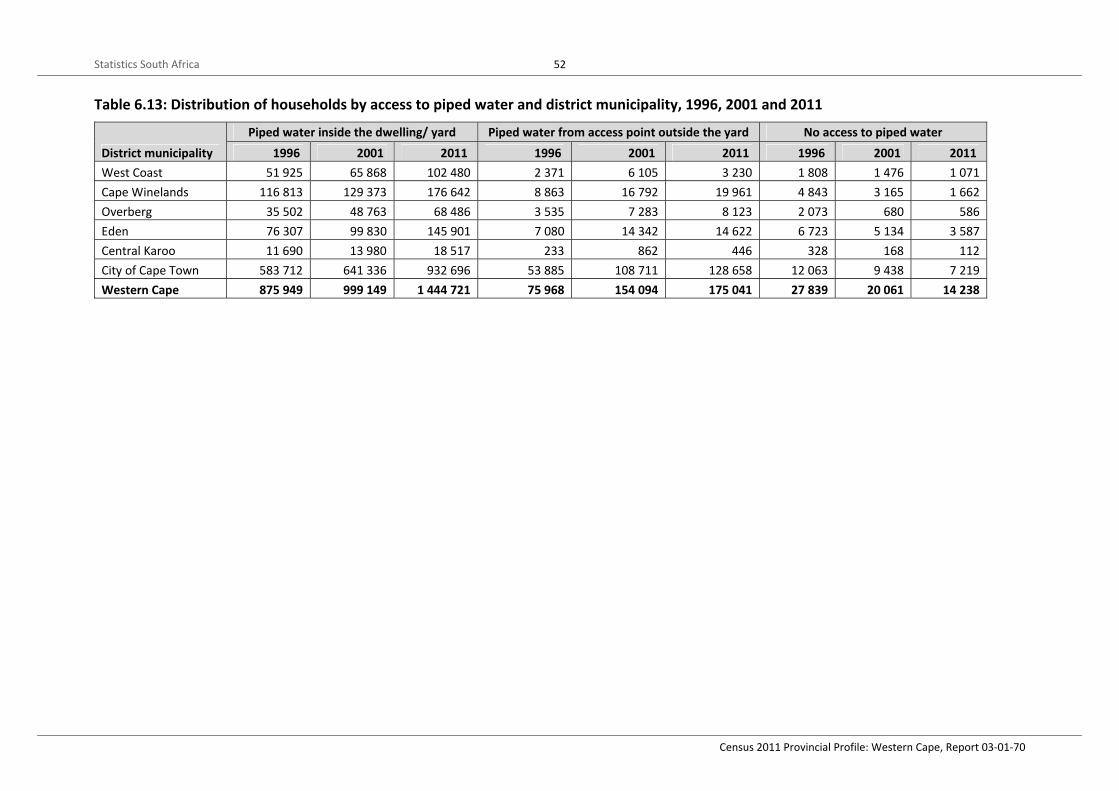
Statistics South Africa
Census 2011 Provincial Profile: Western Cape, Report 03-01-70
52
Table 6.13: Distribution of households by access to piped water and district municipality, 1996, 2001 and 2011
District municipality Piped water inside the dwelling/ yard Piped water from access point outside the yard No access to piped water
1996 2001 2011 1996 2001 2011 1996 2001 2011 West Coast 51 925 65 868 102 480 2 371 6 105 3 230 1 808 1 476 1 071 Cape Winelands 116 813 129 373 176 642 8 863 16 792 19 961 4 843 3 165 1 662 Overberg 35 502 48 763 68 486 3 535 7 283 8 123 2 073 680 586 Eden 76 307 99 830 145 901 7 080 14 342 14 622 6 723 5 134 3 587 Central Karoo 11 690 13 980 18 517 233 862 446 328 168 112 City of Cape Town 583 712 641 336 932 696 53 885 108 711 128 658 12 063 9 438 7 219 Western Cape 875 949 999 149 1 444 721 75 968 154 094 175 041 27 839 20 061 14 238
Statistics South Africa
Census 2011 Provincial Profile: Western Cape, Report 03-01-70
53
Terms and definitions
Census (Population Census) The process of counting the number of people, at a given point in time in a country, and collecting information about their demographic, social and economic characteristics. After data collection, the process includes the processing, analysis and dissemination of the information collected.
Census night The night before Census day. It is the decisive point of time for being included in the Census (midnight on that night).
De facto census A census in which people are enumerated according to where they were on Census night. In this case, at midnight on the night of 9/10 October 2011.
De jure census A census in which people are enumerated according to where they usually live.
Bucket toilet system A toilet system with a pail or other removable receptacle placed directly under the toilet seat, and where no water or chemicals are used.
Disability Difficulties encountered in functioning due to body impairments or activity limitation, with or without assistive devices.
Dwelling unit Structure or part of a structure or group of structures occupied or meant to be occupied by one or more than one household. Includes structure or part of a structure which is vacant and/or under construction, but can be lived in at the time of the survey. Includes units in collective living quarters, unlike housing units. Dwelling units may therefore comprise housing units plus units in collective living quarters when applicable. (Examples of each are a house, a group of huts, and a flat.)
A dwelling unit has a separate entrance from outside or from a common space, as in a block of flats. Premises that are not intended for use as living quarters, but used for human habitation at the time of the census, such as a barn, warehouse, etc., are also classified as dwelling units for census purposes.
Emigrant A person who leaves a country with the intention of staying in the country of arrival.
Employed Persons who work for pay; profit or family gain in the reference period.
Statistics South Africa
Census 2011 Provincial Profile: Western Cape, Report 03-01-70
54
Enumeration area An enumeration area (EA) is the smallest geographical unit (piece of land) into which the country is divided for census or survey purposes. EAs typically contain between 100 and 250 households. Each EA is expected to have clearly defined boundaries.
Formal dwelling A structure built according to approved plans, i.e. house on a separate stand, flat or apartment, townhouse, room in a backyard or rooms or flatlet elsewhere.
Health and functioning Whether a person has difficulty in seeing, hearing, communicating, walking or climbing stairs, remembering or concentrating, and self-care such as washing all over, dressing or feeding.
Household A household is a group of persons who live together and provide themselves jointly with food or other essentials for living, or a single person who lives alone. Note that a household is not necessarily the same as a family.
Household head A person recognised as such by household, usually the main decision-maker, or the person who owns or rents the dwelling, or the person who is the main breadwinner. The head can be either male or female. If two people are equal decision-makers, the oldest can be named as the household head.
Household income All receipts by all members of a household, in cash and in kind, in exchange for employment, or in return for capital investment, or receipts obtained from other sources such as pension.
Immigrant A person who enters a country from another country with the intention of staying in that country.
In-migrants A person who moves from one part of a country to another part with the intention of staying where they move to. This person would be regarded as an in-migrant at the place where they move to.
Informal dwelling Makeshift structure not approved by a local authority and not intended as a permanent dwelling. Typically built with found materials (corrugated iron, cardboard, plastic, etc.). Contrasted with formal dwelling and traditional dwelling.
Labour absorption rate The proportion of the working-age population that is employed.

Statistics South Africa
Census 2011 Provincial Profile: Western Cape, Report 03-01-70
55
Labour force All employed and unemployed persons of working age.
Labour force participation rate Labour force as a percentage of the working-age population.
Not economically active Persons who were neither employed or unemployed (e.g. full-time students; retired persons; and homemakers who did not want to work).
Out-migrants A person who moves from one part of a country to another part with the intention of staying where they move to. This person would be regarded as an out-migrant at the place where they move from.
Post-enumeration survey A sample survey conducted immediately after a census to evaluate the census. Results are used to make adjustments for the census undercount or overcount.
Sex Biological distinction between males and females.
Traditional dwelling A dwelling made primarily of clay, mud, reeds or other locally available natural materials. This is a general term that includes huts, rondavels, etc. Such dwellings can be found as single units or in clusters.
Unemployed (official definition) Persons who did not work, but who looked for work and were available to work in the reference period.
Unemployment rate Unemployed persons as a percentage of the labour force.
Unspecified All cases whereby an answer was expected but was left blank during enumeration.
Wattle and daub Traditional construction method whereby walls are built with wooden sticks/poles and covered with mud or a mixture of mud and clay.
Working-age population Persons aged 15–64 years.

ISBN: 978-0-621-43209-1