providing value: who decides?
TRANSCRIPT

Providing Value: Who Decides?
January 21st,2021
Objectives
• Define what we mean by providing value • Value to payers • Value to patients • Value to our providers and staff
• What is waste and how do we reduce waste & variation
• Describe Journey Mapping as a tool to value

What Does Value mean ?

When asked to prioritize quality, cost or service as components of value:
88% of physicians ranked quality (defined as the efficiency, effectiveness, safety and outcomes) as the top priority, compared with 62% of patients, and 20% of employers.
43% of employers ranked customer satisfaction, or service, as a top priority of value, compared with 12% of patients, and 7% of physicians.
37% of employers said cost was a top component of value, followed by 26% of patients, and only 5% of physicians.
. What is Value?
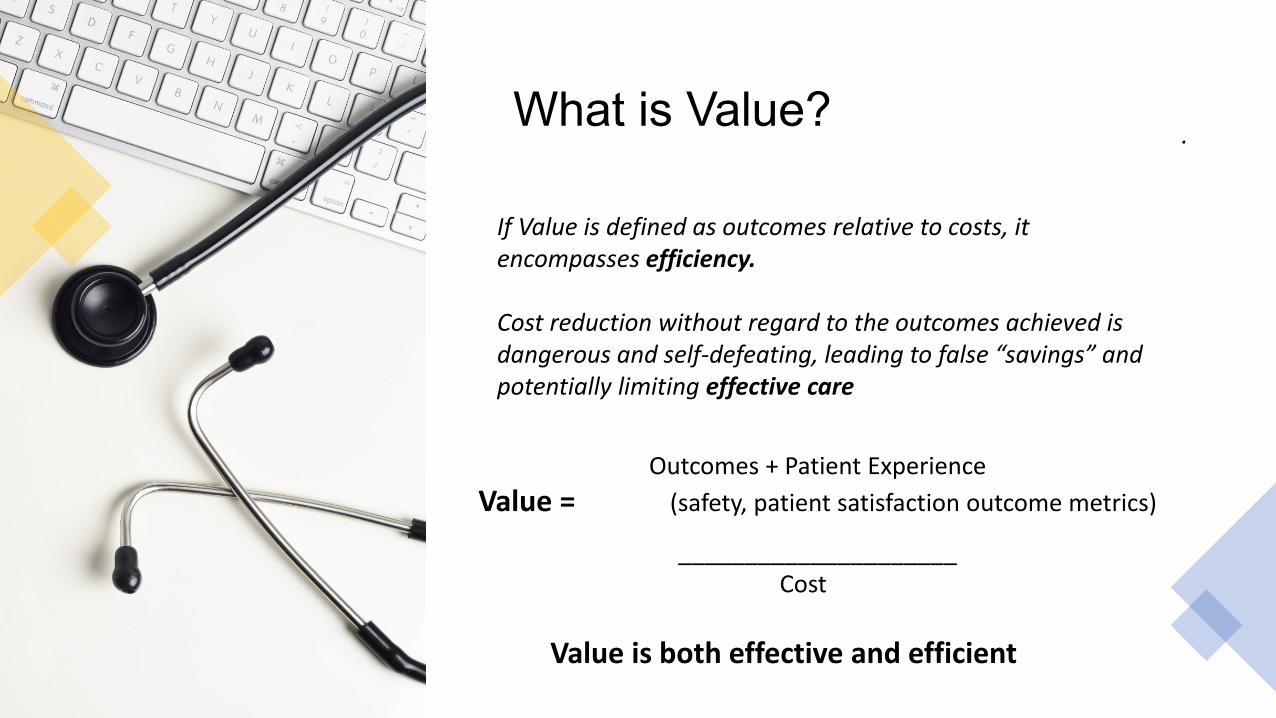
If Value is defined as outcomes relative to costs, it encompasses efficiency.
Cost reduction without regard to the outcomes achieved is dangerous and self-defeating, leading to false “savings” and potentially limiting effective care
Outcomes + Patient ExperienceValue = (safety, patient satisfaction outcome metrics)
_____________________Cost
Value is both effective and efficient
Providers and staff
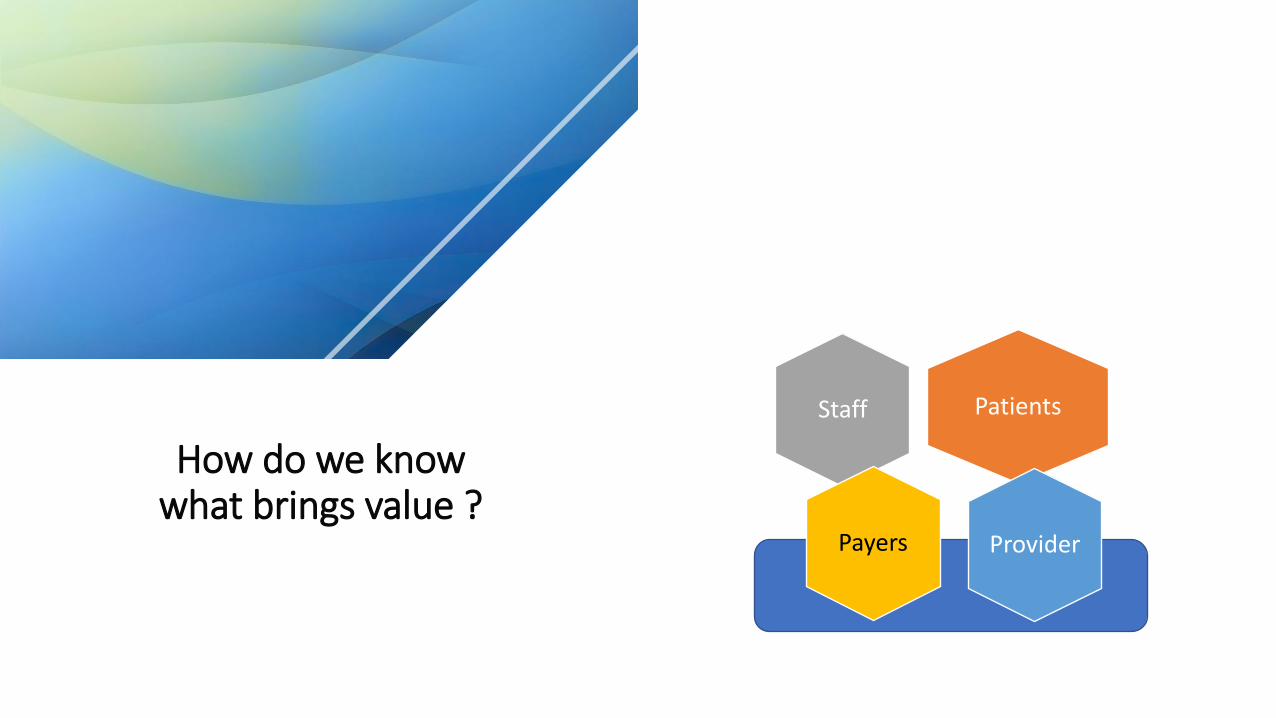
How do we know what brings value ?
Patients Staff
Payers Provider

Colorado 2021
Division of InsuranceSTRATEGIES TO ENHANCE HEALTH INSURANCE AFFORDABILITY

Scope and Purpose:
• The purpose of the regulation is to establish standards for health insurance carriers to enhance the affordability of their products by implementing payment system reforms. These reforms reduce overall health care costs by increasing utilization of primary and preventive care and value-based alternative payment models.
• The regulation establishes requirements for carrier investments in primary care, per the requirements of HB19-1233, and targets for carrier total medical expenditures in alternative payment models.
• This regulation applies to all carriers marketing and issuing non-grandfathered individual, small group, and/or large group health benefit plans with over 10,000 covered lives in Colorado on or after the effective date of this regulation. This regulation excludes individual short-term health insurance policies, as defined in § 10-16-102(60), C.R.S
Definitions
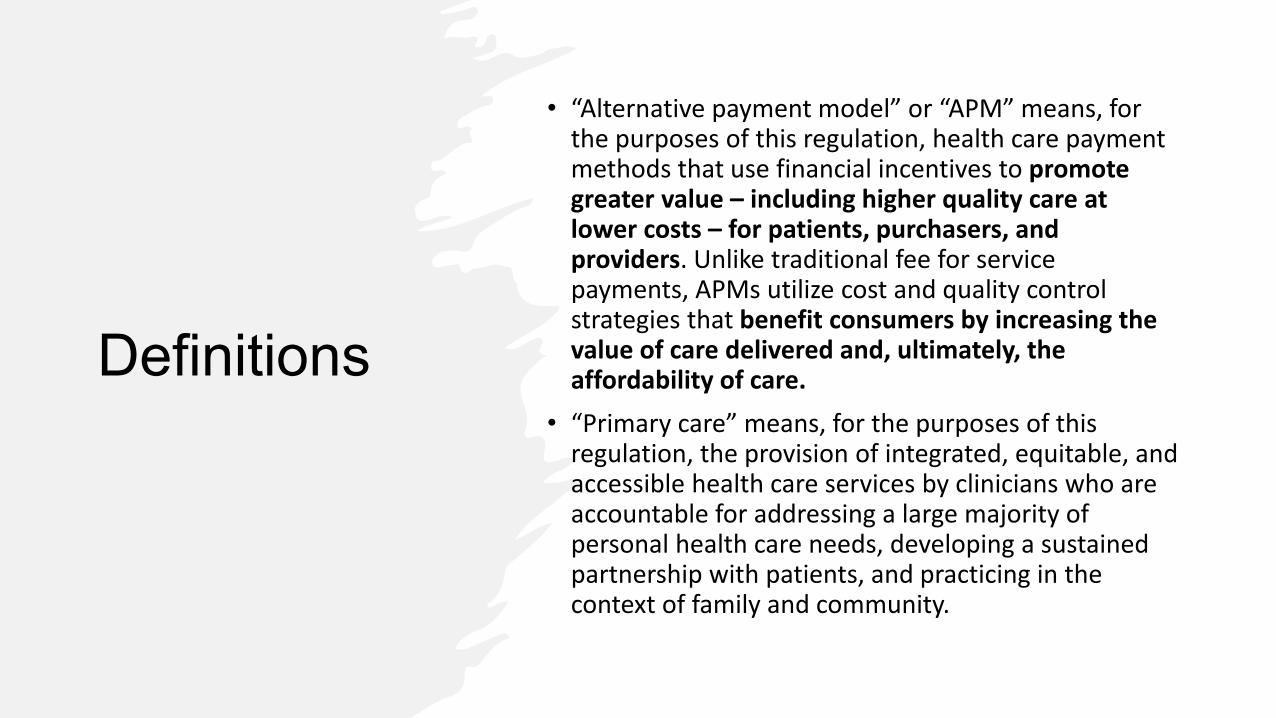
• “Alternative payment model” or “APM” means, for the purposes of this regulation, health care payment methods that use financial incentives to promote greater value – including higher quality care at lower costs – for patients, purchasers, and providers. Unlike traditional fee for service payments, APMs utilize cost and quality control strategies that benefit consumers by increasing the value of care delivered and, ultimately, the affordability of care.
• “Primary care” means, for the purposes of this regulation, the provision of integrated, equitable, and accessible health care services by clinicians who are accountable for addressing a large majority of personal health care needs, developing a sustained partnership with patients, and practicing in the context of family and community.
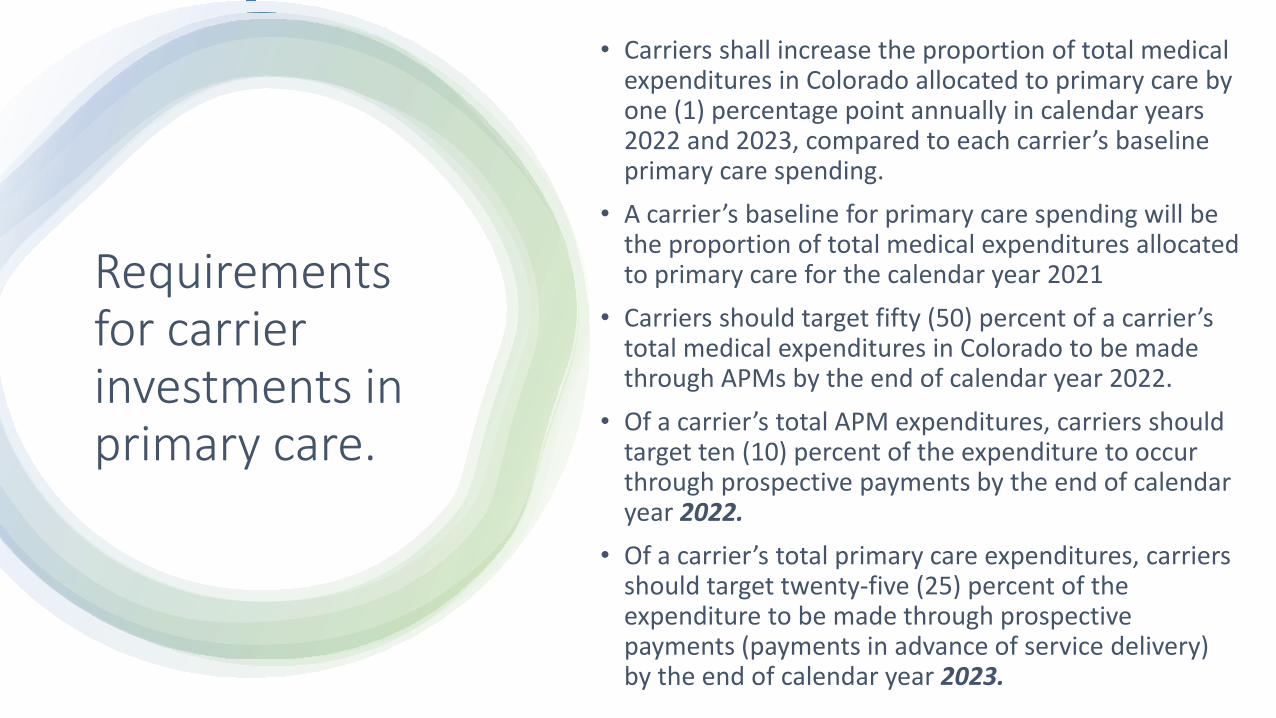
Requirements for carrier investments in primary care.
• Carriers shall increase the proportion of total medical expenditures in Colorado allocated to primary care by one (1) percentage point annually in calendar years 2022 and 2023, compared to each carrier’s baseline primary care spending.
• A carrier’s baseline for primary care spending will be the proportion of total medical expenditures allocated to primary care for the calendar year 2021
• Carriers should target fifty (50) percent of a carrier’s total medical expenditures in Colorado to be made through APMs by the end of calendar year 2022.
• Of a carrier’s total APM expenditures, carriers should target ten (10) percent of the expenditure to occur through prospective payments by the end of calendar year 2022.
• Of a carrier’s total primary care expenditures, carriers should target twenty-five (25) percent of the expenditure to be made through prospective payments (payments in advance of service delivery) by the end of calendar year 2023.
Value Based Payment Models Impact to Our Customers
Payors PatientsStaff Providers

Defining Customers Value
VOC = Voice of customer
CTQs = critical to quality. Key measurable characteristics of a process or service whose performance standard must be met in order to satisfy the customer. These outputs are defined by the customer
CTC = Critical to Cost

Identify Discovery needs Translate
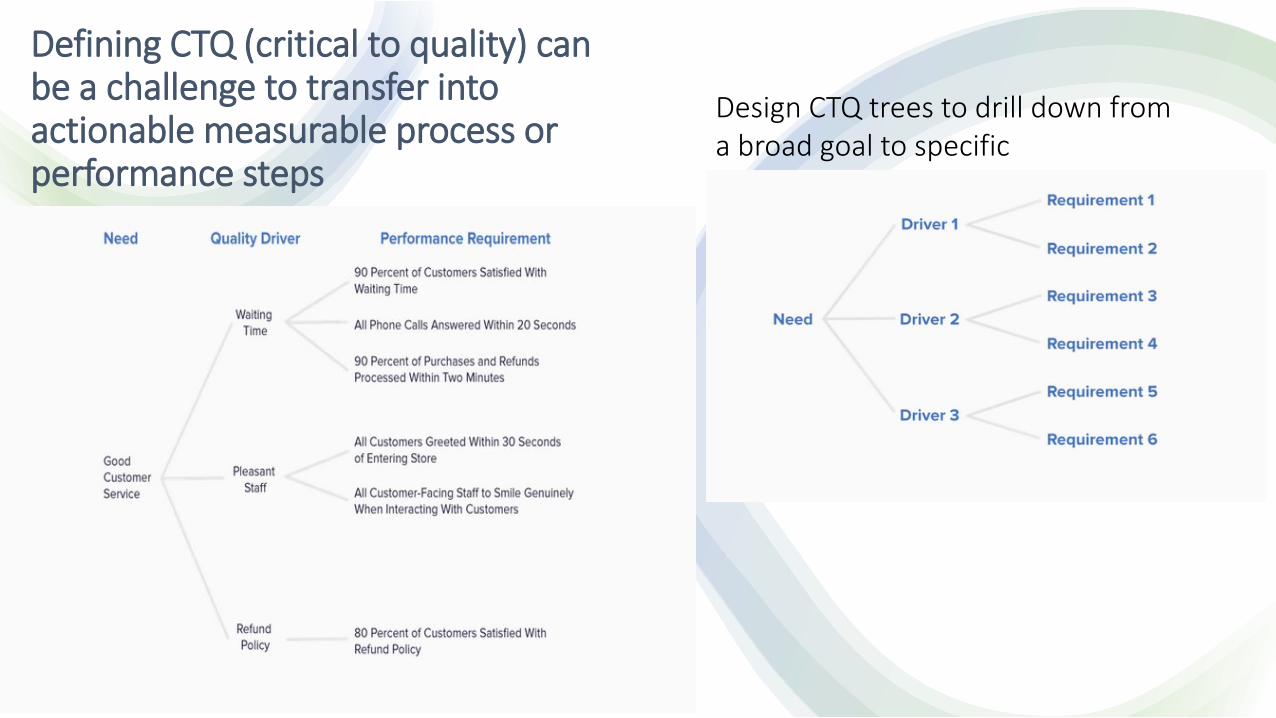
Defining CTQ (critical to quality) can be a challenge to transfer into actionable measurable process or performance steps
Design CTQ trees to drill down from a broad goal to specific

A solid data foundation is the place to start. With the right data, you can assess the current situation, identify opportunities to improve performance, design an appropriate program and track your progress.
With a solid data foundation, you are prepared to embark on the four tactics of a value-based care program: reduce variation, introduce value, improve total cost of care and enable sustainability.
SOLID DATA FOUNDATION

Measure Total Cost of Care (TCOC)
• Total cost of care: the paid claims and co-payments across all providers and all care delivery settings associated with an individual patient.
• Understanding where and how costs are incurred.
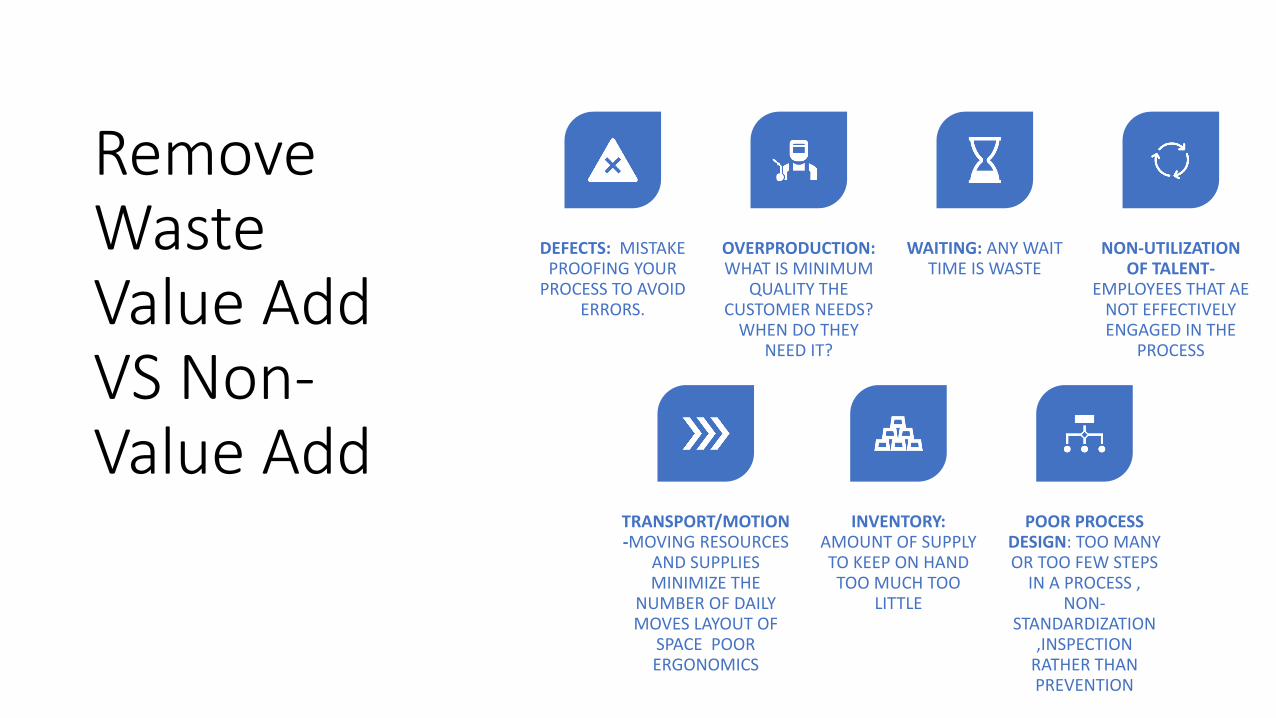
Remove Waste Value Add VS Non-Value Add
DEFECTS: MISTAKE PROOFING YOUR
PROCESS TO AVOID ERRORS.
OVERPRODUCTION: WHAT IS MINIMUM
QUALITY THE CUSTOMER NEEDS?
WHEN DO THEY NEED IT?
WAITING: ANY WAIT TIME IS WASTE
NON-UTILIZATION OF TALENT-
EMPLOYEES THAT AE NOT EFFECTIVELY ENGAGED IN THE
PROCESS
TRANSPORT/MOTION -MOVING RESOURCES
AND SUPPLIES MINIMIZE THE
NUMBER OF DAILY MOVES LAYOUT OF
SPACE POOR ERGONOMICS
INVENTORY: AMOUNT OF SUPPLY TO KEEP ON HAND
TOO MUCH TOO LITTLE
POOR PROCESS DESIGN: TOO MANY OR TOO FEW STEPS
IN A PROCESS , NON-
STANDARDIZATION ,INSPECTION
RATHER THAN PREVENTION
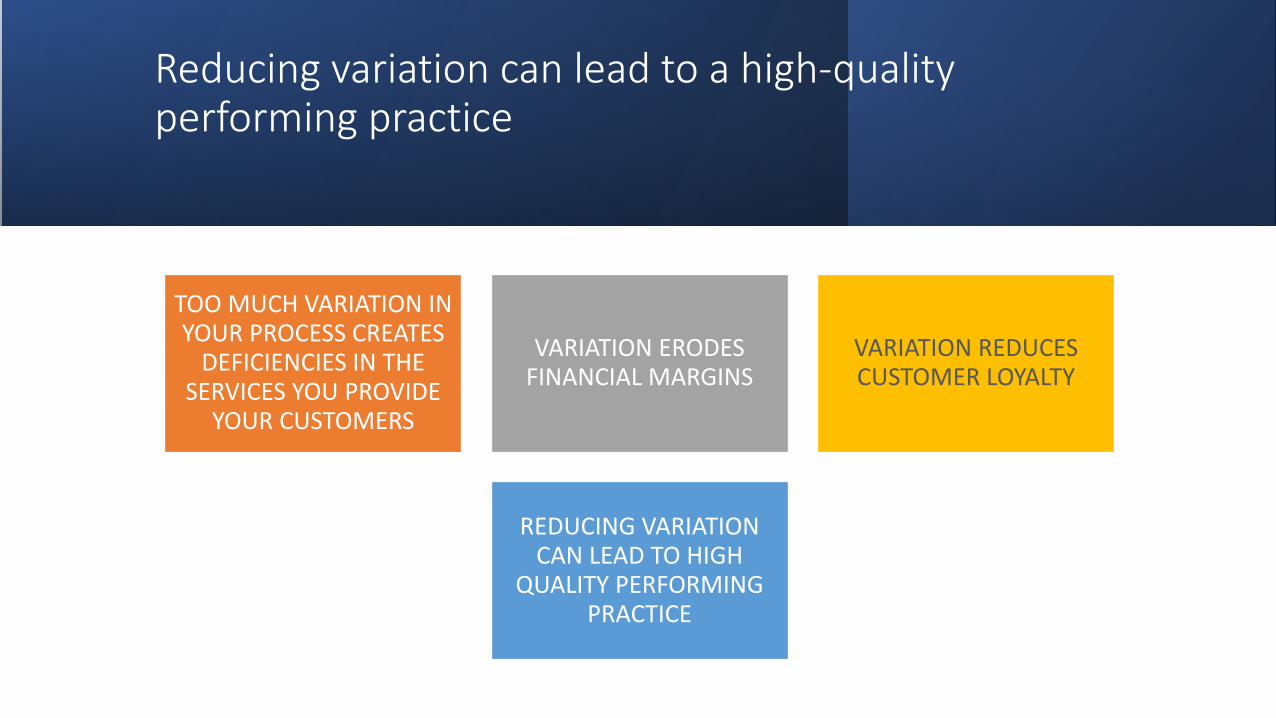
Reducing variation can lead to a high-quality performing practice
TOO MUCH VARIATION IN YOUR PROCESS CREATES
DEFICIENCIES IN THE SERVICES YOU PROVIDE
YOUR CUSTOMERS
VARIATION ERODES FINANCIAL MARGINS
VARIATION REDUCES CUSTOMER LOYALTY
REDUCING VARIATION CAN LEAD TO HIGH
QUALITY PERFORMING PRACTICE

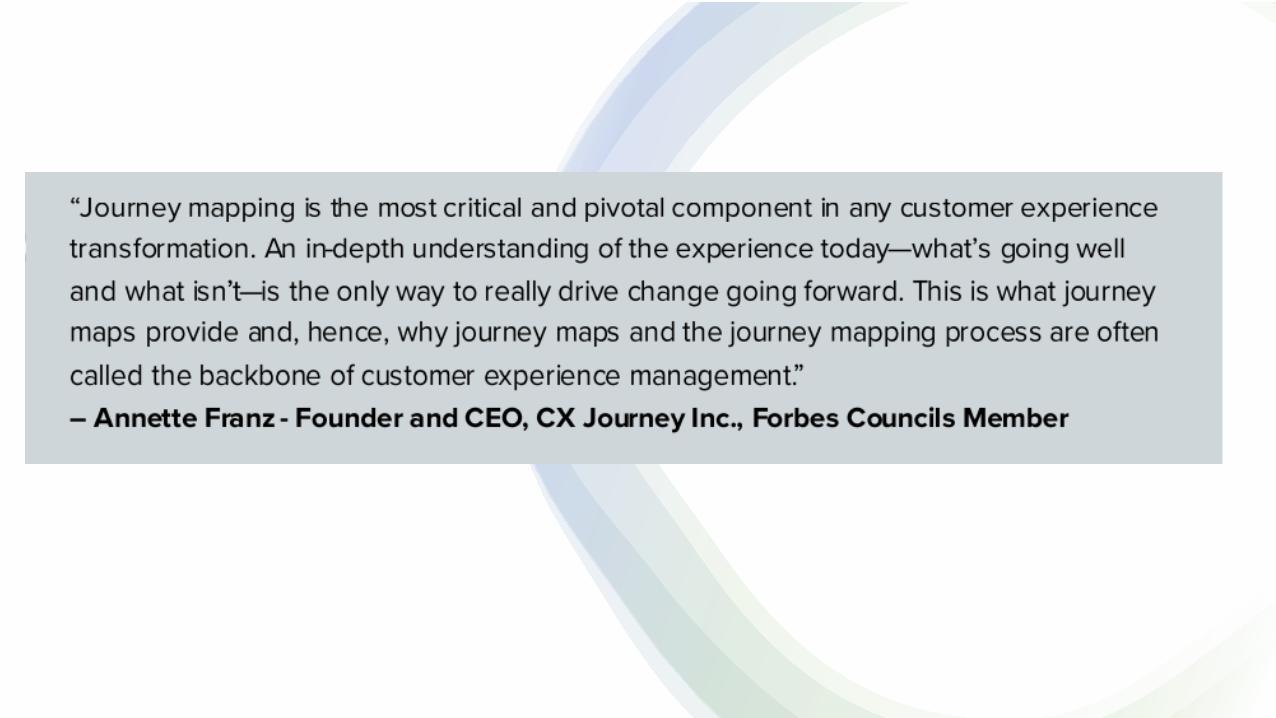
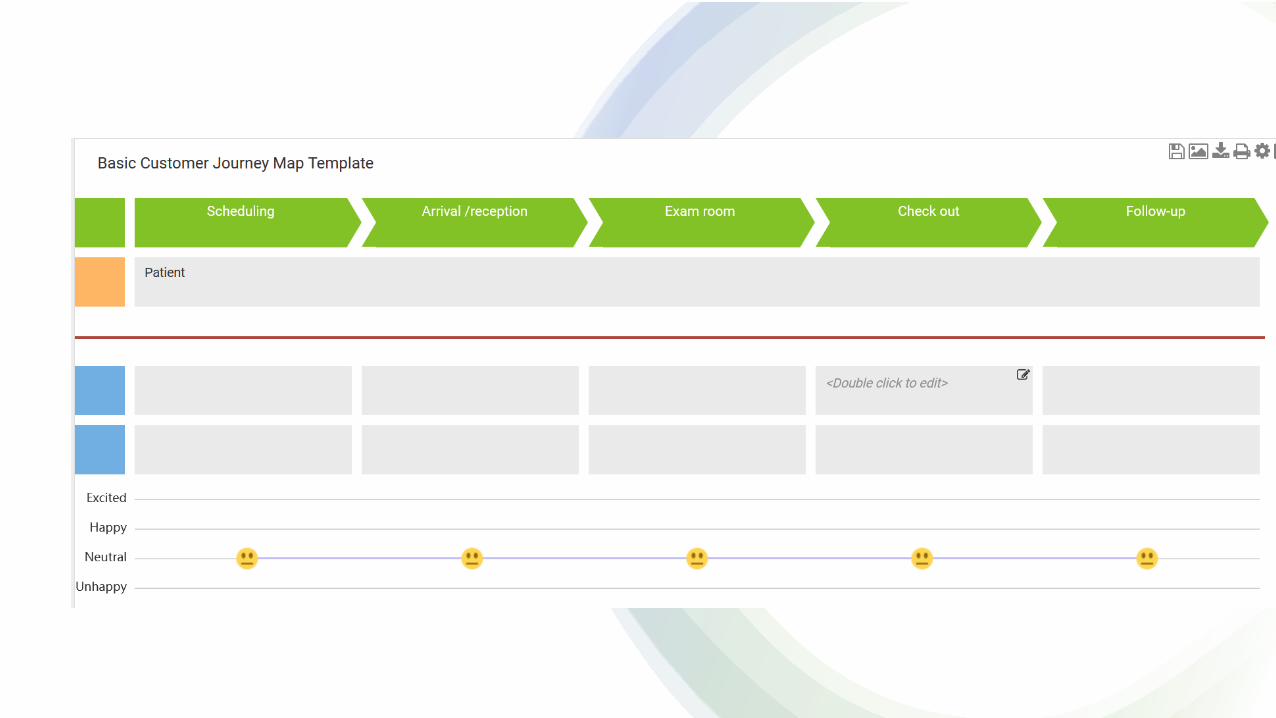
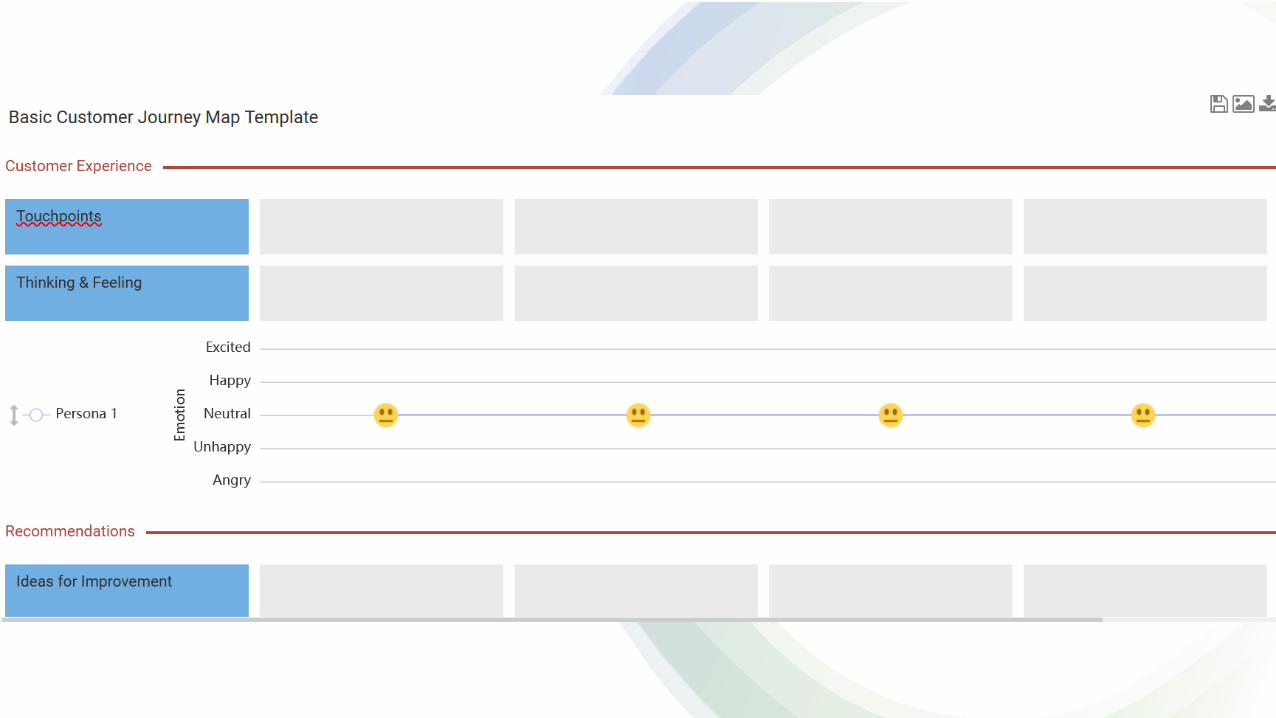
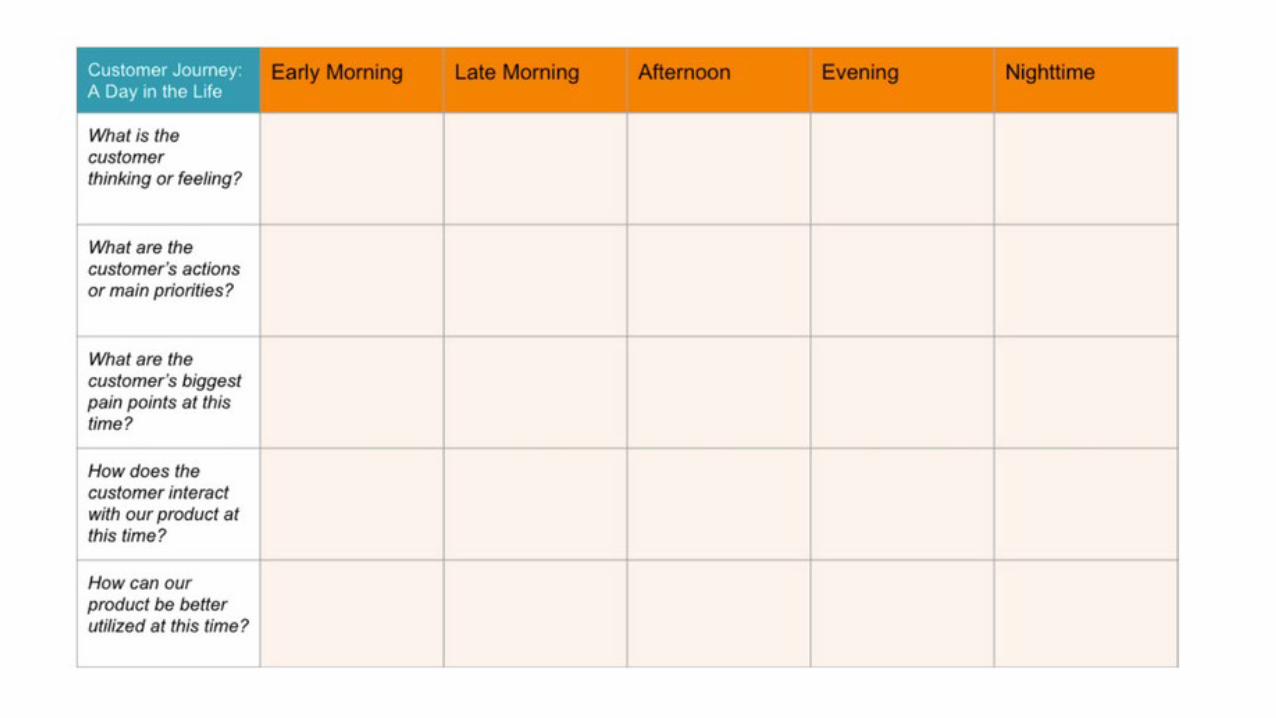
Journey Mapping How do we identify VOC?
How do we identify waste?
How do we identify variation?A great way to visualize the customer experience, better story telling rather than a report .
• A customer journey map is a visual representation of a customer’s (internal and external) experience with your practice.
• These visuals tell a story about how a customer moves through each phase of interaction and experiences each phase.
• Your customer journey map should include touchpoints and moments of truth, but also potential customer feelings, such as frustration or confusion, and any actions you want the customer to take.
• Customer journey maps are often based on a timeline of events, such as a customer’s visit.
• Customer touchpoints make up the majority of your customer journey map.
• They are how and where customers interact with and experience your practice.
• As you conduct research and plot your touchpoints, be sure to include information that addresses elements of action, emotion, and potential challenges.

• There is no “correct” way to format your customer journey map, but for each phase along the journey timeline, include the touchpoints, actions, channels, and assigned ownership of a touchpoint (sales, customer service, marketing, etc.).
• Then, customize your diagram design with images and color and shape variation to better visualize the different actions, emotions, transitions, etc. at a glance.

https://www.hopkinsmedicine.org/international/partners-forum/past-presentations/2016/04_boekemeyer_slater_mapping_the_patient_experience_at_clc.pdf


Journey Mapping is Important Because Our Journey Has Changed
References Four Ways CCaaS Delivers A Better Employee and Customer Experience in 2021. Matt Wujeik. CCW Digital www.customercontactweekdigital.com
The Healthcare Imperative: Lowering Costs and Improving Outcomes: Workshop Series Summary. https://www.ncbi.nlm.nih.gov/books/NBK53906/
Eliminating Waste, promoting Value Across the Health System, Emily Sokol November 2019. https://healthpayerintelligence.com/news/eliminating-waste-promoting-value-across-the-health-system
Creating Journey map templateshttps://miro.com/templates/customer-journey-map

Share Your Ideas