proteomic characterization of golgi membranes enriched
TRANSCRIPT
1
Proteomic characterization of Golgi membranes enriched from Arabidopsis suspension
cell cultures
Sara Fasmer Hansen1,3, Berit Ebert2, Carsten Rautengarten2 and Joshua L. Heazlewood2,3*
1Department of Plant and Environmental Sciences, Faculty of Science, University of
Copenhagen, Frederiksberg C, Denmark
2ARC Centre of Excellence in Plant Cell Walls, School of BioSciences, The University of
Melbourne, Victoria 3010, Australia
3Joint BioEnergy Institute and Physical Biosciences Division, Lawrence Berkeley National
Laboratory, Berkeley, CA 94702, USA
*Corresponding Author
Joshua L. Heazlewood
ARC Centre of Excellence in Plant Cell Walls
School of BioSciences
The University of Melbourne
Victoria 3010, Australia
Tel: +61 3 8344 2677
Email: [email protected]
Running Head: Proteome analysis of Golgi membranes

2
Summary
The plant Golgi apparatus has a central role in the secretory pathway and is the principal site
within the cell for the assembly and processing of macromolecules. The stacked membrane
structures of the Golgi apparatus along with its interactions with the cytoskeleton and
endoplasmic reticulum have historically made the isolation and purification of this organelle
difficult. Density centrifugation has typically been used to enrich Golgi membranes from
plant microsomal preparations, and aside from minor adaptations, the approach is still widely
employed. Here we outline the enrichment of Golgi membranes from an Arabidopsis cell
suspension culture that can be used to investigate the proteome of this organelle. We also
provide a useful workflow for the examination of proteomic data as the result of multiple
analyses. Finally, we highlight a simple technique to validate the subcellular localization of
proteins by fluorescent tags after their identification by tandem mass spectrometry.
Key Words
Golgi apparatus, density gradient centrifugation, subcellular localization, fluorescent protein
3
1. Introduction
The Golgi apparatus is a unique and complex structure within the eukaryotic cell. The
organelle is composed of flat membranes called cisternae that interlink to form stacks [1].
The plant Golgi apparatus is a major junction of the secretory system where proteins, lipids,
carbohydrates are processed and biosynthesized prior to their distribution to all parts of the
cell. This includes the synthesis of matrix polysaccharides destined for the cell wall [2,3], the
production of complex N-glycans [4], the synthesis of glycolipids [5], sequestration of protein
complexes [6], intracellular signalling [7] and trafficking of macromolecules [8].
The Golgi apparatus is an integral component of the plant endomembrane [9], and along with
the endoplasmic reticulum (ER) is one of the more difficult structures to purify from plant
tissue [10]. In fact it is this very proximity of the Golgi to the ER [11] and the intimate
interactions with the cytoskeleton [12] that has historically made the enrichment and
purification of this structure problematic. These difficulties in purifying Golgi bodies from
plant material have resulted in the development of more advanced purification techniques
such as LOPIT [13,14] and the application of free-flow electrophoresis [15-17]. Nonetheless,
it is still suitable to enrich Golgi membranes from plant material for a variety of downstream
applications, including proteomic surveys, using traditional density centrifugation
procedures. In fact, the utilization of density centrifugation is still the most widely used
approach for the enrichment of Golgi membranes from microbes [18], animals [19] and
plants [20,21]. While Golgi membrane fractions isolated from plant material by density
centrifugation alone are usually not of sufficient purity to conduct a thorough proteomic
characterization of this organelle [22], the recent high purity surveys conducted on the
Arabidopsis Golgi proteome [14,16] in conjunction with our functional knowledge of this

4
organelle means that a comparative or quantitative survey conducted on enriched material
should still be considered a viable approach.
Here we outline a detailed protocol for the enrichment of Golgi membranes from an
Arabidopsis suspension cell culture using a discontinuous sucrose gradient that would be
suitable for proteomic investigations. A proteomic data analysis workflow is also provided to
assist in the identification of high confidence candidates after mass spectrometry. Finally, an
approach employing transient expression in Nicotiana benthamiana is outlined for the
subcellular validation of candidate proteins by fluorescent tags.
2. Materials
Prepare solutions with ultrapure water (18 MΩ cm at 25°C) and analytical grade reagents.
Utilize higher grade reagents (LC-MS grade) for solutions and buffers used in conjunction
with mass spectrometry. Prepare reagents at room temperature. Unless otherwise stated,
prepare buffers the day before and store at 4°C. Perform all centrifugation steps at 4°C.
2.1. Arabidopsis suspension cell cultures
1. Arabidopsis suspension cell cultures (see Note 1).
2. Temperature controlled shaking incubator (22°C, 120 rpm) with constant light (100
μE).
3. Arabidopsis Cell Culture Medium: 2% (w/v) sucrose, α-naphthalenacetic acid (0.5
mg/L), kinetin (0.05 mg/L), 1 x Murashige and Skoog basal salt mixture [23]. Prepare
media and adjust to pH 5.7 with potassium hydroxide (KOH), autoclave for 20 min at
121°C and store at 4°C (see Note 2).
4. 250 mL glass Erlenmeyer flasks.
5
2.2. Protoplast preparation of Arabidopsis suspension cell cultures
1. Digestion Buffer: 500 mM Mannitol, 5 mM 2-(N-morpholino) ethanesulfonic acid
(MES), adjust to pH 5.7 with KOH. Store at 4°C. Just prior to use, add 0.4% (w/v)
Cellulase “Onozuka” R-10 and 0.05% (w/v) pectolyase Y-23 (Yakult
Pharmaceutical).
2. Protoplast Wash Buffer: 500 mM Mannitol, 5 mM 2-(N-morpholino) ethanesulfonic
acid (MES), adjust to pH 5.7 with KOH. Store at 4°C.
3. Miracloth (Merck Millipore).
4. Variable speed bench top orbital shaker (see Note 3).
5. Preparative centrifuge for 250 mL tubes and capacity to 800 × g, such as an Avanti
J25 centrifuge (Beckman Coulter) with a JLA-16.250 rotor (Beckman Coulter).
2.3. Protoplast homogenization
1. Homogenization Buffer: 1% (w/v) dextran (Mw 200,000), 0.4 M sucrose, 10 mM
disodium hydrogen phosphate (Na2HPO4), 3 mM ethylenediaminetetraacetic acid
(EDTA), 0.1% (w/v) bovine serum albumin (BSA), 5 mM dithiothreitol (DTT) (see
Note 4), pH to 7.1 with sodium hydroxide (NaOH).
2. Glass-Teflon Potter-Elvehjem Tissue Grinder with a 20 to 40 mL capacity (see Note
5).
3. Preparative centrifuge for 50 mL tubes and capacity to 5,000 × g, such as an Avanti
J25 centrifuge (Beckman Coulter) with a JA-25.50 rotor (Beckman Coulter).
4. Light microscope capable of visualizing plant cells and large subcellular structures,
minimum 40X objective.

6
2.4. Enrichment of Golgi membranes by differential centrifugation
1. Gradient Buffer 1: 1.4 M Sucrose, 10 mM Na2HPO4, 3 mM EDTA, pH 7.1 with
NaOH, can store at -20°C.
2. Gradient Buffer 2: 1.0 M sucrose, 10 mM Na2HPO4, 3 mM EDTA, dextran Mw
200,000 (1% w/v), 5 mM DTT (see Note 4), pH 7.1 with NaOH, can store at -20°C.
3. Gradient Buffer 3: 0.2 M sucrose, 10 mM Na2HPO4, 3 mM EDTA, dextran Mw
200,000 (1% w/v), 5 mM DTT (see Note 4), pH 7.1 with NaOH, can store at -20°C.
4. Gradient Buffer 4: 0.1 M sucrose, 10 mM Na2HPO4, 3 mM EDTA, dextran Mw
200,000 (1% w/v), 5 mM DTT (see Note 4), pH 7.1 with NaOH, can store at -20°C.
5. Ultracentrifuge with swing-out rotor for 40 mL tubes and capable of 100,000 × g for
gradients, such as an Optima™ XE (Beckman Coulter) with a SW 30 Ti rotor
(Beckman Coulter).
6. Disposable plastic pipettes (1 mL).
7. 5 M KCl
8. 10 mM Tris-HCl, pH 8.5
9. Ultracentrifuge with fixed angle rotor for 2 mL tubes and capable of 100,000 × g,
such as an Optima™ MAX-TL (Beckman Coulter) with a TLA-100 rotor (Beckman
Coulter).
10. Protein Quantification Assay, such as Pierce™ BCA Protein Assay Kit.
2.5. Analysis of Golgi enriched membranes by mass spectrometry (LC-MS/MS)
1. Tandem mass spectrometer (MS/MS) with liquid chromatography (LC) delivery
system capable of data dependent acquisition (DDA) / independent data acquisition
(IDA) such as the Q Exactive™ Hybrid Quadrupole-Orbitrap Mass Spectrometer

7
(Thermo Scientific) with a Proxeon Easy-nLC II HPLC (Thermo Scientific) (see Note
6).
2. Digestion Buffer: 1 M urea and 10 mM tris(hydroxymethyl)aminomethane (Tris-
HCl), pH 8.5 solution (see Note 7).
3. 1 M dithiothreitol (DTT) (see Note 8).
4. 1 M iodoacetamide (IAA). (see Note 9).
5. High grade trypsin, such as Trypsin, from Porcine pancreas (Sigma-Aldrich).
6. Solid phase extraction (SPE) for peptides, such as Micro SpinColumns with C18
(Harvard Apparatus, MA, USA).
7. SPE Buffer 1: 80% acetonitrile (v/v) with 0.1% trifluoroacetic acid (v/v).
8. SPE Buffer 2: 2% acetonitrile (v/v) with 0.1% trifluoroacetic acid (v/v).
9. MS Buffer A: 2 % acetonitrile, 0.1 % formic acid.
10. SpeedVac concentrator.
11. Access to search engine to identify proteins from tandem mass spectrometry data,
such as Mascot (Matrix Science) (see Note 10).
12. Proteome integration, profiling and quantitation software, such as Scaffold 3
(Proteome Software) (see Note 11).
2.6 Validation of Golgi localization by fluorescent protein fusions
2.6.1 Cultivation of Nicotiana benthamiana
1. Plastic plant pots (80 x 80 mm).
2. Germination tray (280 x 540 mm) with a transparent plastic lid.
3. Nicotiana benthamiana ‘Domin’ seeds.
4. Soil, such as PRO-MIX (Premier Horticulture).
5. Plant growth chamber (see Note 12).

8
2.6.2 Plasmid preparation and Agrobacterium tumefaciens transformation
1. cDNA from plant material (see Note 13).
2. Thermocycler (PCR machine).
3. Gene specific primers (see Note 14).
4. DNA Polymerase e.g. Phusion™ High-Fidelity DNA Polymerase (Thermo
Scientific), dNTPs (see Note 15).
5. Agarose gel electrophoresis equipment.
6. Agarose e.g. UltraPure™ Agarose (Life Technologies).
7. 1 x TAE buffer e.g. TAE Buffer (Tris-acetate-EDTA) (50X) (Life Technologies).
8. DNA loading buffer e.g. Gel Loading Solution (Life Technologies).
9. DNA ladder e.g. 1 Kb Plus DNA Ladder (Life Technologies).
10. UV light box.
11. Gel and PCR clean-up kit e.g. NucleoSpin® Gel and PCR Clean-up (Macherey-
Nagel).
12. Plasmid preparation kit e.g. QIAprep Spin Miniprep Kit (Qiagen).
13. pCR®8/GW/TOPO® TA Cloning Kit (Life Technologies).
14. Gateway® LR Clonase® II Enzyme mix (Life Technologies).
15. Gateway compatible vector containing a fluorescent protein e.g. pEarleyGate [24]
(see Note 16).
16. Competent Escherichia coli (E. coli) e.g. One Shot® TOP10 Chemically Competent
E. coli (Life Technologies).
17. Spectinomycin, kanamycin and gentamycin (Sigma-Aldrich).
18. Temperature mixer, such as the Thermomixer compact (Eppendorf).
19. Electro-competent Agrobacterium e.g. strain GV3101::pMP90 (see Note 17).
9
20. Disposable electroporation cuvettes with 1 or 2 mm gap sizes.
21. Electroporation system, such as a Gene Pulser Xcell™ Electroporation Systems (Bio-
Rad).
22. Luria-Bertani (LB) media (10 g tryptone, 10 g NaCl, 5 g yeast extract, adjust to pH 7
with NaOH and sterilize by autoclaving).
23. Luria-Bertani (LB) media supplemented with agar (10 g tryptone, 10 g NaCl, 5 g
yeast extract, 7.5 g agar in 1 L water, adjust to pH 7 with NaOH and sterilize by
autoclaving).
2.6.3 Infiltration
1. Luria-Bertani (LB) media (10 g tryptone, 10 g NaCl, 5 g yeast extract, 7.5 g agar in 1
L water, adjust to pH 7 with NaOH and sterilize by autoclaving).
2. Sterile pipette tips or toothpicks.
3. Preparative centrifuge, such as Allegra 25R Benchtop Centrifuge (Beckman Coulter).
4. Infiltration Buffer (10 mM 2-(N-morpholino)ethanesulfonic acid (MES) pH 5.6, 10
mM MgSO4, 100 μM acetosyringone) (see Note 18).
5. 1 mL disposable polypropylene syringes.
2.6.4 Confocal Microscopy
1. Confocal Laser Scanning Microscope (see Note 19).
2. Coverslip holder, such as Attofluor® cell chamber for microscopy (Life
Technologies).
3. 25 mm round glass coverslips.
4. 10 % glycerol.
10
3. Methods
3.1. Growth of Arabidopsis suspension cell cultures
1. The Arabidopsis suspension cell cultures are cultivated in 120 mL aliquots.
2. To maintain healthy cultures, the cells are subcultured weekly into a flask containing
100 mL of Arabidopsis Cell Culture Medium.
3. Cells are subcultured at a ratio of 1:5 to 1:10, depending on density of 7-day old
cultures (see Note 20)
4. Typically, 15 to 20 mL from a 7-day culture are added to a new flask containing 100
mL growth media.
3.2. Preparation of protoplasts
1. Filter 7-day old cells from approximately 4 to 5 flasks through Miracloth and squeeze
out the remaining culture medium to yield around 50 g of cells fresh weight.
2. Add 250 mL Digestion Buffer to a 500 mL beaker and then add 0.4% (w/v) cellulase
and 0.05% (w/v) pectolyase and resuspend the enzymes (see Note 21). Add the 50 g
of cells and gently mix, then gently transfer to a 4 L wide-bottomed conical flask (see
Note 22)
3. Place on an orbital shaker and rotate slowly in the dark (wrapped in foil) for 3 h (see
Note 23).
4. After 3 h, protoplasts are harvested by centrifugation at 800 x g for 5 min.
5. Gently resuspended the cell pellet in about 100 mL Digestion Buffer (no added
enzymes), centrifuge at 800 x g and discard the buffer. Repeat this step two more
times to ensure complete removal of cellulase and pectolyase from the protoplasts
(see Note 24).
11
6. After the final wash, discard the buffer and place the protoplasts on ice.
3.3. Disruption of Arabidopsis protoplasts
1. Resuspend the pellet/protoplasts in Homogenization Buffer using a minimum ratio of
1:1 (w/v) and keep on ice. This volume is determined using the original fresh weight
of the cells.
2. Transfer about 10 to 20 mL of the protoplast- buffer solution into the Potter-Elvehjem
homogenizer.
3. Disrupt the protoplasts using 4 to 5 strokes at even pressure of the pestle in the Potter-
Elvehjem homogenizer (see Note 25). Transfer disrupted protoplasts to a 250 mL
beaker on ice.
4. Prior to processing / rupturing the rest of the protoplasts, check to ensure disruption
was effective by examining homogenate with a light microscope.
5. If over 75 % of cells have been ruptured, process the rest of the protoplast
homogenate, otherwise process the initial sample again with further strokes in the
Potter-Elvehjem homogenizer.
6. Centrifuge the homogenate at 5000 x g for 15 min.
7. Carefully decant supernatant into a 250 mL beaker on ice.
3.4. Enrichment of Golgi membranes
1. Add 5 mL of Gradient Buffer 1 to two 40 mL ultracentrifuge tubes. With a disposable
plastic pipette, gently layer the homogenate on to the Gradient Buffer 1 until all tubes
are at least two thirds full (Fig. 1).
2. Ultracentrifuge homogenate at 100,000 x g for 1 h (see Note 26)

12
3. Remove the supernatant without disturbing the membrane rich lysate that has formed
on the sucrose cushion (Gradient Buffer 1) (see Note 27).
4. Once the supernatant has been removed, carefully layer 15 to 20 mL of Gradient
Buffer 2 on top of the membrane rich lysate. Follow this with 8 to 10 mL of Gradient
Buffer 3 and then 5 to 8 mL of Gradient Buffer 4 (see Note 28).
5. Ultracentrifuge samples at 100,000 x g for 90 min.
6. After ultracentrifugation, remove tubes and inspect the banding pattern. Two distinct
bands should be present above the 1.0 M Gradient Buffer (Fig. 1). Gently remove the
upper band between the 0.1 M and 0.2 M Gradient Buffers with a disposable plastic
pipette and discard. Then carefully remove the remaining upper band containing the
enriched Golgi membranes situated on top of the 1.0 M Gradient Buffer and place in a
15 mL tube on ice (see Note 29).
7. Estimate the protein concentration of the extract using a Protein Quantification Assay
and transfer the sample into 10 µg aliquots and place on ice.
8. Add 5M KCl to achieve an estimated final concentration of about 50 mM to each 10
µg aliquot of enriched Golgi membrane protein fractions and incubate for 15 min at
4°C, shake gently (see Note 30).
9. Ultracentrifuge samples at 100,000 x g for 60 min and discard the supernatant.
10. Wash the pellet twice with 1 mL 10 mM Tris-HCl pH 8.5.
11. At this stage, any 10 µg salt washed Golgi membrane aliquots not being processed for
analysis by tandem mass spectrometry can be stored at -80°C.
3.5. Characterization of enriched Golgi fractions by tandem mass spectrometry
1. Resuspend the 10 µg salt washed Golgi membrane pellet in about 50 µL Digestion
Buffer.
13
2. Add DTT to the diluted protein extract to a final concentration of 25 mM and incubate
30 min (room temperature).
3. Then add IAA to a final concentration of 50 mM and incubate 30 min (room
temperature) in the dark.
4. Add trypsin at a 1:10 trypsin:protein ratio (see Note 31) and incubate overnight
(37°C) (see Note 32).
5. Remove urea and concentrate samples with a Micro SpinColumn (25 to 75 µL
capacity). Initially hydrate the C18 matrix with ultrapure water (75 µL) for 10 min and
centrifuge (1000 x g, 2 minutes) as per manufacturer’s instructions.
6. Wash the SpinColumn with the 50 µL SPE Buffer 1 and centrifuge (1000 x g, 2 min)
and prime twice with 50 µL SPE Buffer 2, centrifuging (1000 x g, 2 min) after each
step.
7. Add digested peptides in urea solution to the SpinColumn and centrifuge (1000 x g, 2
min), wash twice with 50 µL SPE Buffer 2, centrifuging (1000 x g, 2 min) after each
step.
8. Finally elute into a new tube with 25 to 50 µL SPE Buffer 1 by centrifuging 1000 x g
for 2 min. Concentrate and remove acetonitrile with a SpeedVac concentrator until 1
to 5 µL of peptide solution remains in the tube.
9. Dilute around 4 µg of peptide in MS Buffer A to a volume of about 16 µL (see Note
33)
10. Analyze about 1 µg (4 µL) of the peptide sample by nanoflow liquid chromatography
tandem mass spectrometry (LC-MS/MS) using an automated data dependent
acquisition method optimized for the analysis of complex proteomes (see Note 34).

14
11. Data produced after LC-MS/MS analysis can be interrogated with search algorithms,
such as the software package Mascot (Fig. 2A) to identify proteins found in each
sample (see Note 35).
12. The integration and relative quantitation of proteins identified in samples by LC-
MS/MS can be achieved using software such as Scaffold, which can be used to merge
multiple results from Mascot. The software enables further filters to be applied to both
identified peptides and proteins (Fig. 2B), further ensuring that only high confidence
protein matches are identified (see Note 36).
13. When analyzing well-characterized proteomes from systems like Arabidopsis,
resources can be readily employed to analyze results. Useful approaches involve
functional categorizations using Gene Ontologies [25] or the subcellular distribution
of a proteome using resources like the SUBcellular Arabidopsis database [26] (Fig.
3).
3.5. Transient Protein Expression for Subcellular Localization
To validate proteins identified in enriched Golgi membrane preparations it is possible to
easily verify their location to this organelle using the following procedure.
3.5.1. Cultivation of Nicotiana benthamiana
1. Plastic pots of around 80 x 80 mm containing high quality soil, such as PRO-MIX HP
MYCORRHIZAE™ should be thoroughly watered and then drained.
2. About 30 seeds of N. benthamiana ‘Domin’ are spread onto the moist soil, and pots
put onto a plastic tray and covered with a transparent plastic lid.
3. Place the trays in a 25°C chamber with 60 % humidity and 16 hr light / 8 hr dark
cycle.

15
4. After about a week, remove the plastic lid and propagate the plants under the same
growth conditions for another week.
5. Transfer the two-week old seedlings into fresh pots (as previously described).
Transplant one seedling per pot (see Note 37) and continue to propagate plants under
identical growth conditions until ready to be infiltrated with Agrobacterium (see Note
38).
3.5.2. Plasmid preparation and transformation of Agrobacterium
1. Amplify the gene of interest by PCR employing gene specific primers and appropriate
plant cDNA (see Note 39).
2. Analyse the resultant PCR product using a 1 % agarose gel with 1 x TAE buffer.
3. Visualize the PCR product using a UV light box and confirm the expected size.
4. Excise the DNA band and extract the DNA from the agarose gel using a Gel clean-up
kit.
5. Clone the purified PCR product with the pCR®8/GW/TOPO® TA Cloning Kit into
the pCR®8 donor vector to create the entry clone.
6. Transform competent E.coli with the cloning reaction and select for positive
transformant on LB plates with 100 μg/mL spectinomycin.
7. Purify the plasmid DNA from an overnight E.coli culture (LB with 100 μg/mL
spectinomycin) using a Plasmid preparation kit and confirm the identity of the entry
clone by sequencing.
8. Use the confirmed entry clone in a LR Clonase II Enzyme reaction and clone it into a
destination vector (e.g. pEarleyGate) containing an in-frame fluorescent protein.
9. Transform this reaction into E.coli and select on LB plate containing kanamycin (50
μg/mL). Using a sterile toothpick, transfer a colony to 5 mL LB with kanamycin (50

16
µg/mL) and grow at 37°C overnight with shaking. Purify the plasmid using a plasmid
preparation kit and confirm the integrity of the clone by sequencing.
10. Add 1 µl of the expression vector (e.g. pEarleyGate vector containing gene of
interest) to competent Agrobacterium and sit on ice for 15 min (see Note 40).
11. Set up the electroporation device according to the manufacturer‘s instructions (see
Note 41), transfer mixture to pre-chilled cuvette and apply voltage to transform
Agrobacterium.
12. Immediately after the electroporation add 1 mL of LB media to the cuvette (see Note
42) and mix by gently pipetting.
13. Transfer the contents of the cuvette into a sterile 1.5 mL microfuge tube and incubate
for at least 1 hr at 30°C with constant agitation.
14. Pipette 25 to 50 µL (see Note 43) onto LB plates containing appropriate selective
antibiotics (see Note 44) and incubate for 48 hrs at 30°C until colonies are visible.
3.5.3. Infiltration of N. benthamiana
1. Inoculate 10 mL LB media (containing the appropriate selective antibiotics) with an
Agrobacterium colony and grow overnight at 30°C with constant shaking to log
phase.
2. Centrifuge the overnight culture for 10 min at 4000 x g at 20°C.
3. Remove the supernatant, wash the pellet with 10 mL of Infiltration Buffer (see Note
45) and repeat the centrifugation step.
4. Resuspend the Agrobacterium in Infiltration Buffer to an optical density (OD) of 0.01
to 0.3 at 600 nm (see Note 46).
5. Infiltrate the abaxial surface of leaves from three to four week old N. benthamiana
plants using a 1 mL plastic syringe without a needle (see Note 47). Hold the adaxial

17
side of the leaf firmly and press the syringe from abaxial side against your finger.
Infiltrated areas will turn a darker green (see Note 48).
6. Grow infiltrated plants for an additional two days before examining expression of the
fluorescent protein by confocal microscopy (see Note 49).
3.5.4. Confocal microscopy
1. Use a sterile razor blade to cut a 12 x 12 mm piece from the infiltrated area of the leaf
(see Note 50).
2. Place the leaf section onto a coverslip and add a drop of 10% glycerol on its surface.
3. Put a second coverslip on top and mount into a coverslip holder.
4. Place the slide onto the confocal stage and focus using brightfield at low
magnification.
5. At this magnification use an appropriate filter or setting, depending on the fluorescent
protein employed, to find cells exhibiting a florescent signal. Once a cell is located, a
higher magnification can be employed.
6. Configure the confocal to enable sequential or simultaneous acquisitions (see Note
51).
7. Perform a live scan using the confocal. In our example, we employed a simultaneous
acquisition for the yellow fluorescent protein (YFP) and mCherry after co-infiltrating
a vector containing UXT3-YFP and the Golgi marker, α-Mannosidase I-mCherry
(Fig. 4).
8. Images can be processed with a microscope software such as ImageJ [27].

18
5. Notes
1. The Arabidopsis suspension cell cultures outlined here were originally created over
20 years ago from stem explants of the accession Landsberg erecta [28]. While any
suspension cell culture should produce similar results, in our hands, this particular
suspension culture contains a population of Golgi membranes which are minimally
interconnected with the cytoskeleton. This results in enriched Golgi membranes with
reduced contamination when compared to Arabidopsis seedlings or recently created
cell lines. This particular cell line has been distributed globally and can be sourced
through diligent inquiries.
2. Prior to autoclaving, media can be dispensed into 250 mL glass Erlenmeyer flasks in
100 mL aliquots and sealed with foil until required. Large batches can be pre-made
(50 to 100) and stored at 4°C in the dark.
3. A variable speed bench top orbital shaker with a relatively large orbital throw is
optimal (at least 2 cm). This enables a slow rotation while maintaining the cells in
solution and providing efficient enzymatic digestion of the cell wall.
4. The DTT should be added immediately prior to use. A stock solution of DTT (1 M)
can be stored in aliquots at -20°C if required.
5. The performance of the homogenizer is very important to gently rupture the
protoplasts. Generally, negative pressure on the up-stroke should result in an air
bubble between the Teflon pestle and the homogenate. This seems to be indicative of
adequate restriction between the Teflon pestle and the glass mortar which constricts
the protoplasts as they pass, resulting in their disruption. The performance of the
homogenizer (generation of the air bubble) can be tested with water.
6. While access to high resolution tandem mass spectrometry has become somewhat
common, they are expensive instruments to purchase and maintain. As a consequence

19
many institutions provide access via dedicated facilities. While these facilities can
seem like an expensive option, current pricing makes them highly completive when
analysing up to 50 samples per year.
7. Urea is unstable and can degrade in solution when exposed to elevated temperatures
(> 25°C) or over time. This degradation results in the generation of isocyanic acid
which subsequently reacts with the amino terminus of proteins as well as the
sidechains of lysine and arginine residues. Consequently, it is recommended that urea
solutions be made fresh as required. A 2 mL urea / Tris-HCl solution is relatively
simple to make and usually adequate for most purposes.
8. A stock solution of DTT can be stored at -20°C in aliquots and thawed as required.
9. A stock solution of IAA can be stored at -20°C in aliquots and thawed as required.
IAA is used to alkylate the thiol group on cysteine residues after reduction with DTT.
It is virtually impossible to detect cysteine containing peptides unless controlled
alkylation is undertaken. However, given the low occurrence of cysteine residues in
proteins, the absence of this step has little impact on the final results, namely number
of proteins identified and sequence coverage. IAA is light and heat sensitive and
should be stored in the dark or wrapped in foil.
10. Suppliers of most tandem mass spectrometers designed for standard proteomic
workflows will usually supply software with their instruments that can be used for the
interrogation of tandem spectra for the identification of proteins. There are also a
number of open source software packages available as well as a range of third party
software that can also be employed to identify proteins from fragmentation spectra. In
general, these algorithms are relatively similar, we generally use Mascot (a third party
software package from Matrix Science) and have found that it provides quality results
when high confidence cut-offs are employed. Access to the software is free if

20
submitting less than 1200 spectra in a single submission
(http://www.matrixscience.com/).
11. A considerable data handling problem when dealing with results from multiple
analyses of tandem spectra is data integration. While some software platforms have
developed workflows to integrate multiple samples, Scaffold from Proteome Software
(http://www.proteomesoftware.com/) provides a powerful way to combine and
compare protein identifications from multiple samples. The software provides some
quantitation support via spectral counting to enable limited comparative assessment
between samples.
12. A growth chamber capable of maintaining 25°C and 60 % humidity with a day/night
cycle is optimal. However, plants can also be grown in a glasshouse with some
temperature control.
13. cDNA can be obtained from the plant tissue of interest after RNA extraction using a
plant RNA extraction kit, such as the RNeasy Plant Mini Kit (Qiagen). The mRNA is
then reverse transcribed into cDNA using a Reverse Transcriptase, such as
Superscript III Reverse Transcriptase (Life Technologies).
14. Ensure the reverse primer does not contain a stop codon to enable a C-terminal fusion
with the fluorescent protein.
15. To amplify a gene of interest and avoid errors, a proofreading DNA polymerase
should be used.
16. The pEarleyGate vector collection generally works well, however many other vectors
are available that contain strong promoters and fluorescent tags.
17. Agrobacterium tumefaciens strain GV3101::pMP90 is a commonly used and works
well when transforming N. benthamiana and can also be used to stably transform

21
Arabidopsis thaliana. However other Agrobacterium strains are available that also
work in N. benthamiana, including C58C1, EHA105, LBA4404, and AGL1.
18. Prepare the Infiltration Buffer fresh for each infiltration. Stock solutions of 0.5 M
MES-KOH pH 5.5 and 1 M MgSO4 can be prepared in advance but filter sterilization
is recommended. For the 0.5 M MES stock solution, prepare MES first and adjust the
pH to 5.5 with KOH. Acetosyringone should be added separately to the Infiltration
Buffer on the day of use. Prepare a 100 mM acetosyringone stock solution in either
DMSO or 96% (v/v) ethanol, and store in aliquots at -20 ˚C or for shorter periods at
4°C. Do not autoclave the Infiltration Buffer containing acetosyringone.
19. The Confocal Laser Scanning Microscope (CLSM) must have the capability to excite
at the appropriate wavelengths. For example for the pEarleyGate 101 vector 514 nm
for yellow fluorescent protein (YFP) is necessary.
20. After 7 days, a 120 mL culture should produce around 8 to10 g of cells, fresh weight.
The amount of biomass should be checked regularly and the volume of cells (usually
10 to 20 mL) used to subculture into a new flask adjusted accordingly.
21. Enzymes should be added to the Digestion Buffer just prior to use. Enzymes are
easily solubilized by vigorous shaking in a 50 mL aliquot of Digestion Buffer.
22. Maintain a cell to Digestion Buffer ratio of around 1:5 (w/v) for the digestion of cells.
The amount of enzyme may need to be optimized if different plant material / cell
cultures are employed. This combination and ratio of enzymes seems to be optimal for
primary cell walls.
23. Rotate at the cells in the Digestion Buffer at the lowest possible speed; however the
cells must remain suspended.
24. The pellet comprising intact protoplasts is delicate and thus the supernatant should be
carefully removed to avoid breaking of the protoplasts.
22
25. For the first few attempts at protoplast disruption, check the results using a light
microscope with a 40 x objective. This should reveal rupturing of at least 75% of the
protoplasts. The key to homogenization is ensuring enough mechanical stress to
disrupt the protoplasts without destroying subcellular integrity. The number of strokes
of the homogenizer should be calibrated using light microscopy.
26. This step should result in a yellow band sitting on the cushion (Gradient Buffer 1) of
about 1 to 2 mm thick.
27. The removal of the supernatant to the top of the yellow membrane band will be a
compromise between the quality of the resultant gradient and the disturbance of the
cushion. Attempts to remove too much supernatant will likely result in a reduction in
yield.
28. For the successful enrichment of Golgi membranes from other contaminating
membranes on the cushion, such as mitochondria, it is not recommended to use a
sucrose concentration less than about 1.0 M in Gradient Buffer 2.
29. The membrane band (discarded) found between Gradient Buffer 4 (0.1 M) and
Gradient Buffer 3 (0.2 M) should contain less material and be visibly thinner than the
band representing the enriched Golgi membranes directly above the 1.0 M Gradient
Buffer.
30. The incubation with KCl is used to remove electrostatic interactions of non-specific
peripheral proteins from the enriched Golgi membrane preparations.
31. The recommended ratio of trypsin to protein (w/w) is generally 1:20 or 50, however
this will depend on the type of trypsin being utilized. If using modified trypsin (not
subject to autolysis), then recommended ratios can be used, however if unmodified
trypsin is used, we recommend using it at higher ratios. The advantage of unmodified

23
trypsin, is that autolytic products (peptides) can act as internal controls for sample
handling and mass spectrometry.
32. Overnight digestion is likely excessive, however the timing usually suits the standard
sample processing workflow.
33. These volumes and concentrations are dependent on the liquid chromatography
method being employed.
34. The analysis of a 1 µg complex peptide lysate by nanoflow LC-MS/MS should result
in the high confidence identification of between 1000 and 2000 proteins.
35. To ensure only high confidence proteins and peptides are identified from
fragmentation spectra, employ recommended protein and peptide cut-offs to ensure
spectral match probabilities are < 0.05 or false discovery rates are < 1 %. If using
Mascot, an ions score value is provided for peptide matches and needs to be entered
manually in the “Ions score or expect cut-off” box. Using such an approach, only high
confidence peptide matches are used to define the resultant identified proteins. This
means that even proteins identified by a single peptide can be regarded as high
confidence matches, although a replicate experiment will be required to independently
identify and confirm its existence in the sample.
36. There are further settings or views in Scaffold that can result in a final set of identified
proteins that would not be considered high confidence even with the outlined settings
(Fig. 2B). This includes the following settings in the ‘View’ menu: ‘Show Entire
Protein Clusters’ and ‘Show Lower Scoring Matches’. If requiring high confidence
identifications, both should be unchecked.
37. Space the pots within the tray to ensure plants do not crowd each other as they
mature.

24
38. Plants around three to four weeks after germination with a rosette diameter of
approximately 80 to 100 mm seem to be the most suitable for infiltration.
39. Ensure the appropriate plant tissue in which the gene is most highly expressed is used.
It is also important to use a proofreading polymerase for the PCR reaction to avoid the
introduction of sequence errors. For the same reason the number of PCR cycles
should be kept to a minimum.
40. Competent Agrobacterium can be prepared in large batches and store 50 µL aliquots
at -80°C until required. About 1 µL (25 to 100 ng) of the plasmid preparation in water
or TE buffer works for most Agrobacterium transformations. Ensure that plasmid
preparations with higher DNA concentrations are diluted.
41. Make sure that your settings are adjusted for the gap size of the cuvette being
employed and that the setting is appropriate for Agrobacterium.
42. It is essential to promptly add the LB-media to the mixture to avoid a decrease in
transformation efficiency.
43. The volume largely depends on the efficiency rate of the competent Agrobacterium.
Usually 50 µL is sufficient to produce enough colonies.
44. Ensure correct antibiotics are used for selection. Generally antibiotics for both the
Agrobacterium host and plasmid are necessary. The Agrobacterium GV3101::pMP90
is resistant to gentamycin and rifampicin and the pEarleyGate vector series confer
kanamycin resistance.
45. Some protocols do not include a wash step; however we have found that this improves
infiltration and protein expression. This could be due to the effect of antibiotics in the
culture media.
46. The OD required depends on the expression of the protein of interest. Generally we
have found that a lower OD (0.01 to 0.15) gives a better result and minimizes protein

25
aggregates. However low expressed proteins may require higher ODs. When co-
infiltrating multiple constructs, for example, a gene of interest and an organelle
marker protein, mix a combination of the two Agrobacterium solutions to achieve the
final OD.
47. Start with the top leaves as they have less vascular bundles compared to older leaves.
We have found that slightly piercing the leaf by holding the syringe at a 45° angle
while holding the leaf upright can assist infiltration.
48. It is important to use as little pressure as possible while injecting the Agrobacterium
mixture to avoid punching holes and wounding the leaf.
49. Since not all proteins express with the same efficiency, expression should be
monitored at various time points. Generally we monitor expression from 48 to 72
hours.
50. Make sure the infiltrated area is chosen and avoid cutting too close to the region
where the syringe was applied as this region will be wounded and will result in a high
auto-fluorescence signal.
51. Most modern confocal microscopes are capable of performing simultaneous scans
(fast, crosstalk between signals) and sequential scans (slow, but less crosstalk between
signals). The use of simultaneous scanning enables the visualization of two signals
without the need for fixation. This can be useful when examining the Golgi apparatus
as they tend to move around in the cell. While an emission range can be narrowed to
reduce crosstalk when using simultaneous scanning, it will reduce the signal intensity.
Sequential scanning is often essential to ensure the signal from both fluorophores is
valid, but often fixation is required to ensure overlap. Such an approach is important if
using fluorophores with similar emission wavelengths such as YFP and green
fluorescent protein (GFP).
26
Acknowledgments
This work was funded by grants from the Australia Research Council (ARC) to the ARC
Centre of Excellence in Plant Cell Walls [CE110001007] and the U. S. Department of
Energy, Office of Science, Office of Biological and Environmental Research, through
contract DE-AC02-05CH11231 between Lawrence Berkeley National Laboratory and the U.
S. Department of Energy. JLH is supported by an ARC Future Fellowship [FT130101165].
SFH was supported by a research grant [VKR023371] from VILLUM FONDEN. We also
wish to thank the UC Davis Proteomics Core Facility for sample analysis.
27
5. References
1. Morré DJ, Mollenhauer HH (2009) The Golgi apparatus: The first 100 years.
Springer, New York, USA
2. Scheller HV, Ulvskov P (2010) Hemicelluloses. Annu Rev Plant Biol 61:263-289
3. Harholt J, Suttangkakul A, Scheller HV (2010) Biosynthesis of pectin. Plant Physiol
153:384-395
4. Song W, Henquet MGL, Mentink RA et al. (2011) N-glycoproteomics in plants:
Perspectives and challenges. J Proteomics 74:1463-1474
5. Rennie EA, Ebert B, Miles GP et al. (2014) Identification of a sphingolipid alpha-
glucuronosyltransferase that is essential for pollen function in Arabidopsis. Plant Cell
26:3314-3325
6. Wightman R, Turner S (2010) Trafficking of the Pplant cellulose synthase complex.
Plant Physiol 153:427-432
7. Ordenes VR, Moreno I, Maturana D et al. (2012) In vivo analysis of the calcium
signature in the plant Golgi apparatus reveals unique dynamics. Cell Calcium 52:397-404
8. McFarlane HE, Watanabe Y, Yang WL et al. (2014) Golgi- and trans-Golgi network-
mediated vesicle trafficking is required for wax secretion from epidermal cells. Plant Physiol
164:1250-1260
9. Morré DJ, Mollenhauer HH (1974) The endomembrane concept: a functional
integration of endoplasmic reticulum and Golgi apparatus. In: Robards AW (ed) Dynamic
Aspects of Plant infrastructure. McGraw-Hill, New York, USA, pp 84-137.
10. Morré DJ, Mollenhauer HH (1964) Isolation of Golgi apparatus from plant cells. J
Cell Biol 23:295-305
11. Boevink P, Oparka K, Cruz SS et al. (1998) Stacks on tracks: the plant Golgi
apparatus traffics on an actin/ER network. Plant J 15:441-447
28
12. Akkerman M, Overdijk EJR, Schel JHN et al. (2011) Golgi body motility in the plant
cell cortex correlates with actin cytoskeleton organization. Plant Cell Physiol 52:1844-1855
13. Dunkley TPJ, Watson R, Griffin JL et al. (2004) Localization of organelle proteins by
isotope tagging (LOPIT). Mol Cell Proteomics 3:1128-1134
14. Nikolovski N, Rubtsov D, Segura MP et al. (2012) Putative glycosyltransferases and
other plant Golgi apparatus proteins are revealed by LOPIT proteomics. Plant Physiol
160:1037-1051
15. Parsons HT, Weinberg CS, Macdonald LJ et al. (2013) Golgi enrichment and
proteomic analysis of developing Pinus radiata xylem by free-flow electrophoresis. PLOS
ONE 8:e84669
16. Parsons HT, Christiansen K, Knierim B et al. (2012) Isolation and proteomic
characterization of the Arabidopsis Golgi defines functional and novel targets involved in
plant cell wall biosynthesis. Plant Physiol 159:12-26
17. Parsons HT, González Fernández-Niño SM, Heazlewood JL (2014) Separation of the
plant Golgi apparatus and endoplasmic reticulum by free-flow electrophoresis. In: Jorrín
Novo JV, Komatsu S, Weckwerth W, Weinkoop S (eds) Plant Proteomics: Methods and
Protocols, Second Edition, vol 1072. Humana Press, New York, pp 527-539.
18. Forsmark A, Rossi G, Wadskog I et al. (2011) Quantitative proteomics of yeast post-
Golgi vesicles reveals a discriminating role for Sro7p in protein secretion. Traffic 12:740-753
19. Gilchrist A, Au CE, Hiding J et al. (2006) Quantitative proteomics analysis of the
secretory pathway. Cell 127:1265-1281
20. Mast S, Peng L, Jordan TW et al. (2010) Proteomic analysis of membrane
preparations from developing Pinus radiata compression wood. Tree Physiology 30:1456-
1468
29
21. Zeng W, Jiang N, Nadella R et al. (2010) A glucurono(arabino)xylan synthase
complex from wheat contains members of the GT43, GT47, and GT75 families and functions
cooperatively. Plant Physiol 154:78-97
22. Nikolovski N, Shliaha PV, Gatto L et al. (2014) Label-free protein quantification for
plant Golgi protein localization and abundance. Plant Physiol 166:1033-1043
23. Murashige T, Skoog F (1962) A revised medium for rapid growth and bio assays with
tobacco tissue cultures. Physiol Plantarum 15:473-497
24. Earley KW, Haag JR, Pontes O et al. (2006) Gateway-compatible vectors for plant
functional genomics and proteomics. Plant J 45:616-629
25. Gene Ontology Consortium (2004) The Gene Ontology (GO) database and
informatics resource. Nucleic Acids Res 32:D258-D261
26. Heazlewood JL, Verboom RE, Tonti-Filippini J et al. (2007) SUBA: The Arabidopsis
subcellular database. Nucleic Acids Res 35:D213-D218
27. Schneider CA, Rasband WS, Eliceiri KW (2012) NIH Image to ImageJ: 25 years of
image analysis. Nat Methods 9:671-675
28. May MJ, Leaver CJ (1993) Oxidative stimulation of glutathione synthesis in
Arabidopsis thaliana suspension cultures. Plant Physiol 103:621-627
29. Tanz SK, Castleden I, Hooper CM et al. (2013) SUBA3: a database for integrating
experimentation and prediction to define the SUBcellular location of proteins in Arabidopsis.
Nucleic Acids Res 41:D1185-1191
30. Zybailov B, Mosley AL, Sardiu ME et al. (2006) Statistical analysis of membrane
proteome expression changes in Saccharomyces cerevisiae. J Proteome Res 5:2339-2347
31. Ebert B, Rautengarten C, Guo X et al. (2015) Identification and characterization of a
Golgi-localized UDP-xylose transporter family from Arabidopsis. Plant Cell 27:1218-1227

30

31
Figure Captions
Fig. 1. Flowchart outlining the procedure for the enrichment of Golgi membranes from
Arabidopsis suspension cell cultures using a discontinuous gradient.
Fig. 2. Recommended protein and peptide filters for the analysis of mass spectrometry data
derived from the analysis of Arabidopsis samples (A) Mascot (Matrix Science) and (B)
Scaffold (Proteome Software).
Fig. 3. Subcellular breakdown of a typical dataset resulting from a proteomic analysis of
enriched Golgi membranes from the Arabidopsis suspension cell culture. The analysis
outlines proteins identified from two independent enrichment experiments using the outlined
enrichment and data workflow. In total, 1,102 proteins were identified after both samples
were combined using Scaffold. The subcellular locations were obtained from the SUBcellular
Arabidopsis (SUBA) database [29] and distributions are shown according to the total
normalized spectral abundance factor (NSAF) [30], obtained from Scaffold, for proteins
allocated to each compartment.
Fig. 4. The transient subcellular localization of the cis-Golgi marker α-Mannosidase I-
mCherry (αManI-mCherry) and a resident Golgi protein (UXT3-YFP) in N. benthamiana
leaves [31] with an overlay (merge) indicating co-localization. Bar = 25 µm.

Microsomalband
Discontinuous gradient
100k x g1 hr
1.4 M
Enriched Golgi membranes
1.4 M 1.4 M
1.0 M
0.2 M
0.1 M
Layergradient
Lysate on cushion
100k x g90 min
Arabidopsis culture homogenization
Figure 1
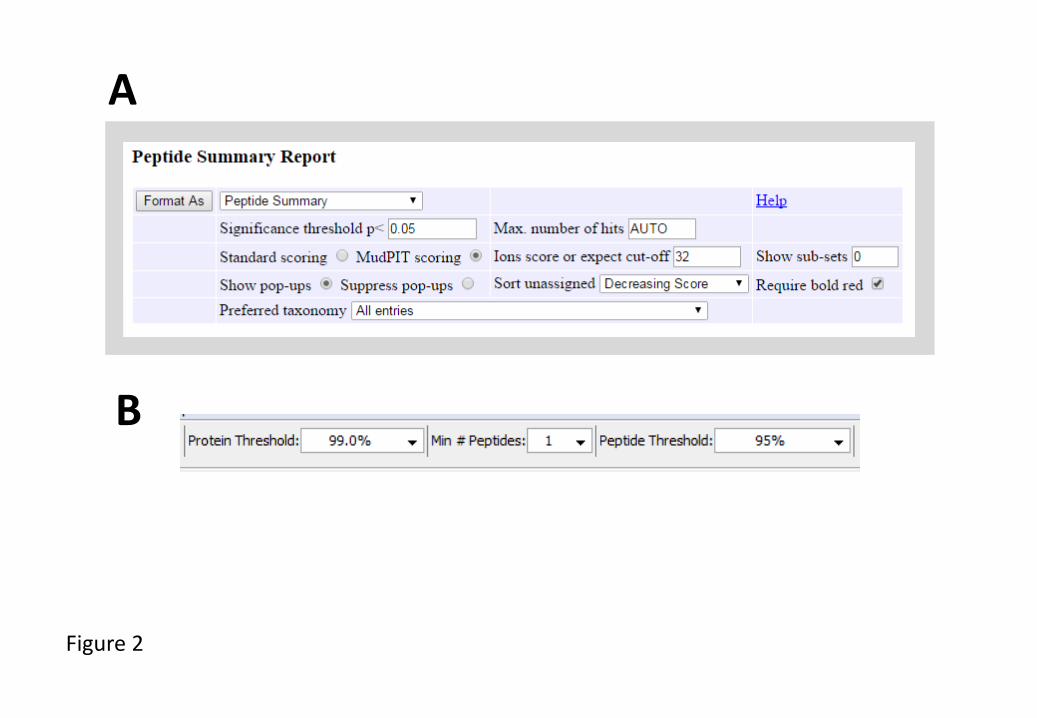
Figure 2
A
B

ER 16%
Golgi 26%
Vacuole9%
PM 12%
Extracellular 2%
Cytosol 27%
Mitochondrion 3%Nucleus 1%Peroxisome 2%Plastid 1%Unknown 1%
Contaminants 35%
Figure 3

αManI-mCherry UXT3-YFP merge
Figure 4

Minerva Access is the Institutional Repository of The University of Melbourne
Author/s:
Hansen, SF; Ebert, B; Rautengarten, C; Heazlewood, JL
Title:
Proteomic characterization of Golgi membranes enriched from Arabidopsis suspension cell
cultures
Date:
2016
Citation:
Hansen, S. F., Ebert, B., Rautengarten, C. & Heazlewood, J. L. (2016). Proteomic
characterization of Golgi membranes enriched from Arabidopsis suspension cell cultures.
Brown, WJ (Ed.). The Golgi Complex: Methods and Protocols, (1), 1496, pp.91-109.
Springer.
Persistent Link:
http://hdl.handle.net/11343/235804
File Description:
Accepted version