protection&indemnity - classltd.com protection _ indemnity mid_term review 2010.pdf ·...
TRANSCRIPT
Protection & IndemnityMid-Term Review 2010

Contents
Introduction 03Mutual Clubs 06P&I Comparative Data 34P&I Club Market Reference 40Specialist Markets 46Further Information 52
Introduction
The Aon Mid-Term Review as always is a reference document allowing thereader to source a wide range of data on the P&I market. It concentrateson the 13 clubs that make up the International Group (IG), as thiscollection of mutual insurance associations insures around 90% of theworld’s merchant fleet. No other industry of anything like the same scaleis able to say that one of its most important insurance coverages is mostlyprovided on a not-for-profit basis.
Not every ship operator is comfortable with the mutual P&Isystem however, and a vibrant fixed premium P&I sectorprovides an alternative approach. Accordingly we have alsoincluded data relating to the major fixed premium P&I insurers.
Much of the mutual system data is presented on a comparativebasis – the “Comparative Data” section. This approach allowsus to generate some Key Performance Indicators relating tocall income, claims, underwriting results, surplus reserves andgross tonnage entered. The basic data is drawn from the clubs’published reports, and provides a financial snapshot of mutualP&I as the clubs count their reserves and mark their assets tomarket at 20 February 2010. As a result this analysis is in someways out of date before it is published; the mutual system is amoving target and six months or more have elapsed since theFebruary cut-off date. A key part of the service provided byAon’s P&I team is to give ongoing, live analysis by keepingthat target firmly in its sights.
One Year LaterAon’s 2009 Mid-Term Review signed off with the predictionthat the clubs would witness a significant growth in solvencyover the three year medium term. As 2009 progressedthe widespread panic of the lead up to that February’s P&Irenewal season began to dispel, and by the end of the summeran air of cautious optimism had spread across the market,as underwriters looked forward to the prospect of broadlypositive investment income coupled with a more benignclaims environment resulting in improved results.
The report and accounts analysed in this Review indeed revealan extraordinary about turn for most clubs come February2010, as balance sheets revealed the true magnitude of theinvestment income made by many clubs, and even betterthan expected underwriting balances. “Relaxed confidence”might best describe the present mood in the mutual P&Imarket. Almost without exception, free reserves have beenrestored to pre-financial market crisis levels since the last setof balance sheets were published.
It is hardly surprising that the sharp downturn in world tradeduring 2009 should have produced fewer “routine” P&Iclaims – perhaps best characterised as claims within theclubs’ retention before the pooling system cuts in (currentlyUS$8 million). The described purpose of that retention is toensure the clubs each bear the more foreseeable claims thatare associated with their business models. What is more difficultto explain is the sudden but nevertheless welcome relief in thenumber and magnitude of pool claims in excess of individualclub retentions in 2008, even while the shipping markets andship employment remained and even reached their peaks.This reduced trend in pool claims was repeated in 2009,albeit that the year started fairly badly and seems set to levelof some way north of 2008, but well below 2006 and 2007.
In this context the very poor results of 2006 and 2007 appearto be more random in nature as opposed to a “new norm”,as some were predicting. Nobody would suggest that the longterm trend in pool claims is downward, and if anything onlyserves to underline the unpredictable nature of such claims,supporting the clubs’ arguments around the need for preparationthrough the maintenance of substantial free reserves.
03
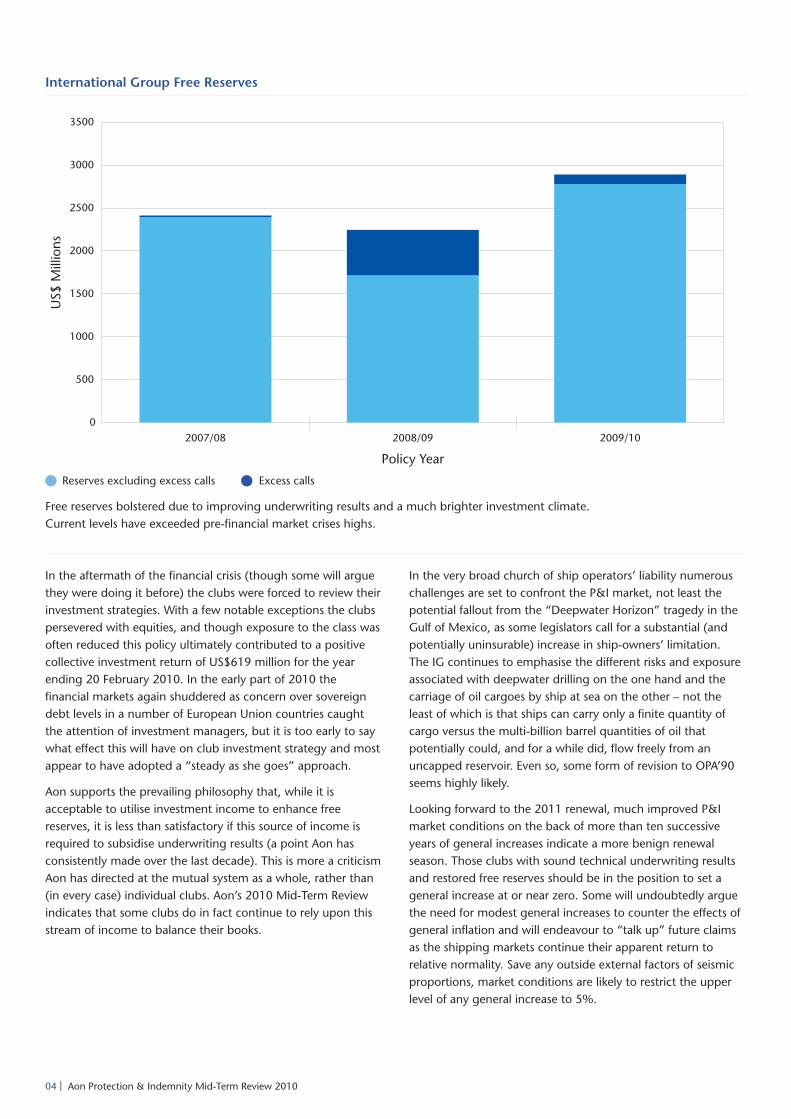
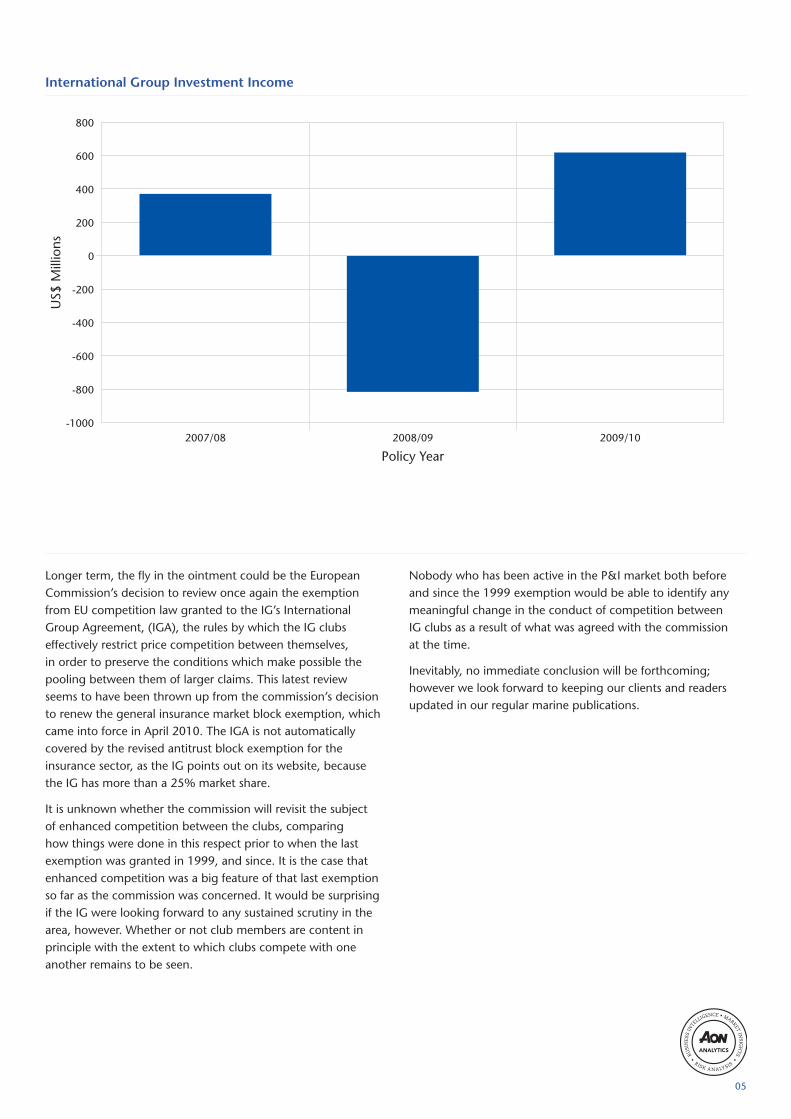
In the aftermath of the financial crisis (though some will arguethey were doing it before) the clubs were forced to review theirinvestment strategies. With a few notable exceptions the clubspersevered with equities, and though exposure to the class wasoften reduced this policy ultimately contributed to a positivecollective investment return of US$619 million for the yearending 20 February 2010. In the early part of 2010 thefinancial markets again shuddered as concern over sovereigndebt levels in a number of European Union countries caughtthe attention of investment managers, but it is too early to saywhat effect this will have on club investment strategy and mostappear to have adopted a “steady as she goes” approach.
Aon supports the prevailing philosophy that, while it isacceptable to utilise investment income to enhance freereserves, it is less than satisfactory if this source of income isrequired to subsidise underwriting results (a point Aon hasconsistently made over the last decade). This is more a criticismAon has directed at the mutual system as a whole, rather than(in every case) individual clubs. Aon’s 2010 Mid-Term Reviewindicates that some clubs do in fact continue to rely upon thisstream of income to balance their books.
In the very broad church of ship operators’ liability numerouschallenges are set to confront the P&I market, not least thepotential fallout from the “Deepwater Horizon” tragedy in theGulf of Mexico, as some legislators call for a substantial (andpotentially uninsurable) increase in ship-owners’ limitation.The IG continues to emphasise the different risks and exposureassociated with deepwater drilling on the one hand and thecarriage of oil cargoes by ship at sea on the other – not theleast of which is that ships can carry only a finite quantity ofcargo versus the multi-billion barrel quantities of oil thatpotentially could, and for a while did, flow freely from anuncapped reservoir. Even so, some form of revision to OPA’90seems highly likely.
Looking forward to the 2011 renewal, much improved P&Imarket conditions on the back of more than ten successiveyears of general increases indicate a more benign renewalseason. Those clubs with sound technical underwriting resultsand restored free reserves should be in the position to set ageneral increase at or near zero. Some will undoubtedly arguethe need for modest general increases to counter the effects ofgeneral inflation and will endeavour to “talk up” future claimsas the shipping markets continue their apparent return torelative normality. Save any outside external factors of seismicproportions, market conditions are likely to restrict the upperlevel of any general increase to 5%.
International Group Free Reserves
Free reserves bolstered due to improving underwriting results and a much brighter investment climate.Current levels have exceeded pre-financial market crises highs.
04 | Aon Protection & Indemnity Mid-Term Review 2010
Reserves excluding excess calls Excess calls
Longer term, the fly in the ointment could be the EuropeanCommission’s decision to review once again the exemptionfrom EU competition law granted to the IG’s InternationalGroup Agreement, (IGA), the rules by which the IG clubseffectively restrict price competition between themselves,in order to preserve the conditions which make possible thepooling between them of larger claims. This latest reviewseems to have been thrown up from the commission’s decisionto renew the general insurance market block exemption, whichcame into force in April 2010. The IGA is not automaticallycovered by the revised antitrust block exemption for theinsurance sector, as the IG points out on its website, becausethe IG has more than a 25% market share.
It is unknown whether the commission will revisit the subjectof enhanced competition between the clubs, comparinghow things were done in this respect prior to when the lastexemption was granted in 1999, and since. It is the case thatenhanced competition was a big feature of that last exemptionso far as the commission was concerned. It would be surprisingif the IG were looking forward to any sustained scrutiny in thearea, however. Whether or not club members are content inprinciple with the extent to which clubs compete with oneanother remains to be seen.
Nobody who has been active in the P&I market both beforeand since the 1999 exemption would be able to identify anymeaningful change in the conduct of competition betweenIG clubs as a result of what was agreed with the commissionat the time.
Inevitably, no immediate conclusion will be forthcoming;however we look forward to keeping our clients and readersupdated in our regular marine publications.
International Group Investment Income
05

06 | Aon Protection & Indemnity Mid-Term Review 2010
Mutual Clubs
American Club 08Britannia 10Gard 12Japan Club 14London Club 16North of England 18Shipowners Club 20Skuld 22Standard Club 24Steamship Mutual 26Swedish Club 28UK P&I Club 30West of England 32
Commentary on individual clubs has been supplied by the clubs themselves.Balance sheet data includes combined P&I and FD&D figures if applicable.
07
American ClubAmerican Steamship Owners Mutual Protection and Indemnity Association, Inc.Shipowners Claims Bureau, Inc., 1 Battery Park Plaza, 31st Floor, New York, NY 10004, USA
www.american-club.comTel: +1.212.847.4500
Manager’s Comment
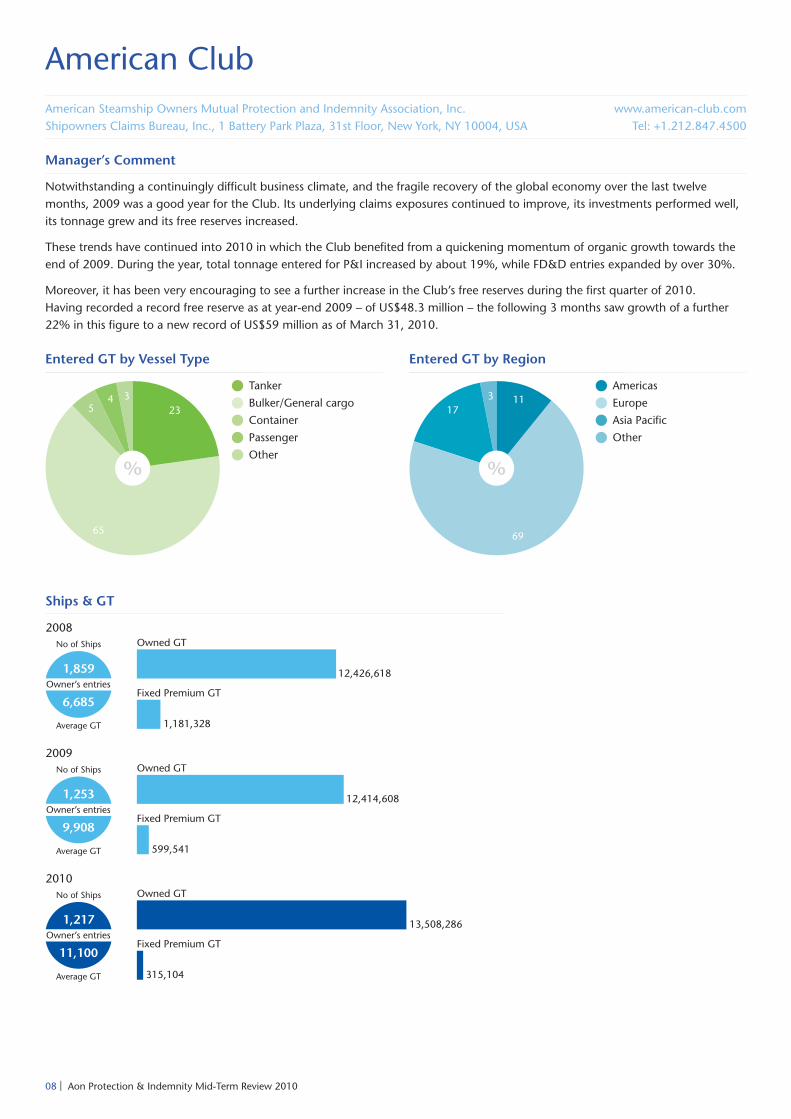
Notwithstanding a continuingly difficult business climate, and the fragile recovery of the global economy over the last twelvemonths, 2009 was a good year for the Club. Its underlying claims exposures continued to improve, its investments performed well,its tonnage grew and its free reserves increased.
These trends have continued into 2010 in which the Club benefited from a quickening momentum of organic growth towards theend of 2009. During the year, total tonnage entered for P&I increased by about 19%, while FD&D entries expanded by over 30%.
Moreover, it has been very encouraging to see a further increase in the Club’s free reserves during the first quarter of 2010.Having recorded a record free reserve as at year-end 2009 – of US$48.3 million – the following 3 months saw growth of a further22% in this figure to a new record of US$59 million as of March 31, 2010.
Entered GT by Vessel Type Entered GT by Region
Tanker
Bulker/General cargo
Container
Passenger
Other
Americas
Europe
Asia Pacific
Other
Ships & GT
08 | Aon Protection & Indemnity Mid-Term Review 2010
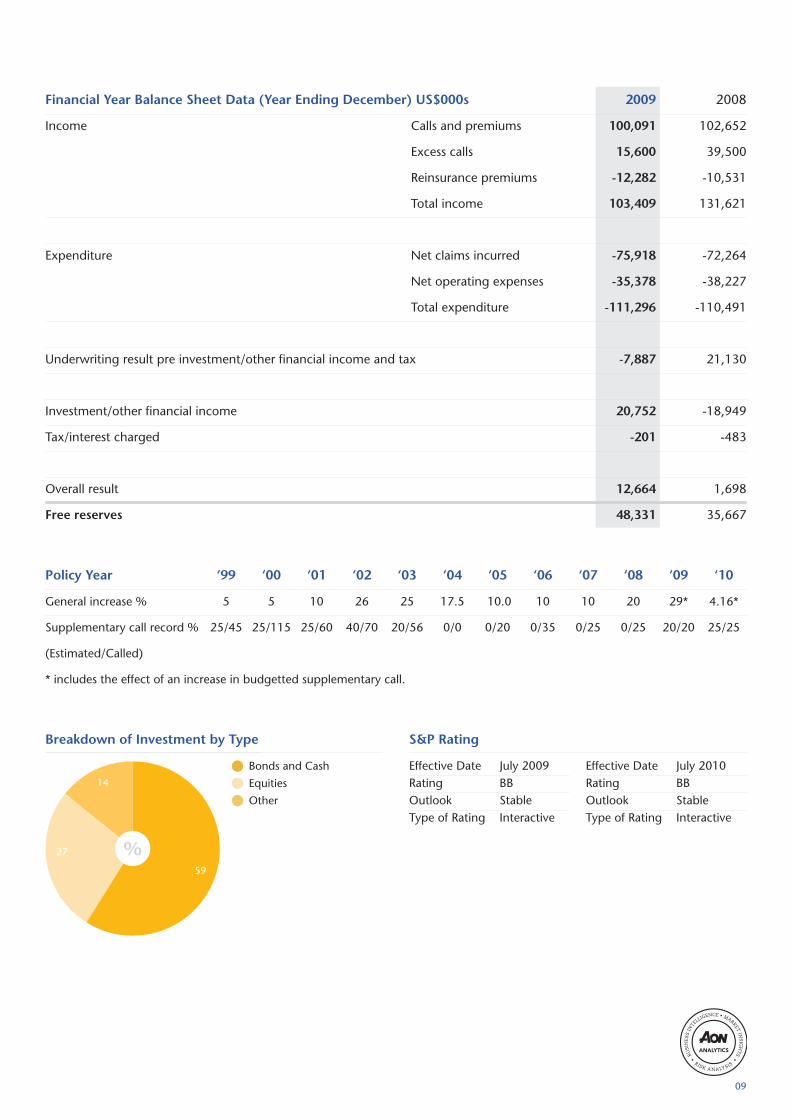
Breakdown of Investment by Type
Bonds and Cash
Equities
Other
S&P Rating
Financial Year Balance Sheet Data (Year Ending December) US$000s 2009 2008
Income Calls and premiums 100,091 102,652
Excess calls 15,600 39,500
Reinsurance premiums -12,282 -10,531
Total income 103,409 131,621
Expenditure Net claims incurred -75,918 -72,264
Net operating expenses -35,378 -38,227
Total expenditure -111,296 -110,491
Underwriting result pre investment/other financial income and tax -7,887 21,130
Investment/other financial income 20,752 -18,949
Tax/interest charged -201 -483
Overall result 12,664 1,698
Free reserves 48,331 35,667
Policy Year ‘99 ‘00 ‘01 ‘02 ‘03 ‘04 ‘05 ‘06 ‘07 ‘08 ‘09 ‘10
General increase % 5 5 10 26 25 17.5 10.0 10 10 20 29* 4.16*
Supplementary call record % 25/45 25/115 25/60 40/70 20/56 0/0 0/20 0/35 0/25 0/25 20/20 25/25
(Estimated/Called)
* includes the effect of an increase in budgetted supplementary call.
Effective Date July 2009Rating BBOutlook StableType of Rating Interactive
Effective Date July 2010Rating BBOutlook StableType of Rating Interactive
09

BritanniaThe Britannia Steam Ship Insurance Association LimitedNew City Court, 20 St Thomas Street, London, SE1 9RR, UK
www.britanniapandi.comTel: +44 (0)20 7407 3588
Manager’s Comment
The heavy claims experience of the last few years has abated and the Association recorded an 18% reduction in the cost of claimswithin its retention in 2009.
The financial statements show a surplus of US$30.6 million. This result was helped by strong return on investments of just over 10%for the year. The Association derives additional strength from its reinsurance with Boudicca Insurance Company Ltd. During thelast 12 months reductions in the projected cost of claims for the 2006/07 and the 2007/08 policy years together with the veryhealthy investment return increased the amount available in Boudicca to meet future claims of the Association from US$85 millionto US$153.8 million. The Association’s free reserves and the resources of Boudicca amount to US$375.9 million.
Entered GT by Vessel Type Entered GT by Region
Tanker
Bulker/General cargo
Container
Other
Americas
Europe
Asia Pacific
Other
Ships & GT
10 | Aon Protection & Indemnity Mid-Term Review 2010
Breakdown of Investment by Type
Cash
Equities
Fixed Interest
S&P Rating
Financial Year Balance Sheet Data (Year Ending February) US$000s 2010 2009
Income Calls and premiums 289,605 275,916
Excess calls 0 0
Reinsurance premiums -83,568 -81,469
Total income 206,037 194,447
Expenditure Net claims incurred -220,308 -189,680
Net operating expenses -25,530 -24,879
Total expenditure -245,838 -214,559
Underwriting result pre investment/other financial income and tax -39,801 -20,112
Investment/other financial income 75,223 -18,274
Tax/interest charged -4,849 -1,136
Overall result 30,573 -39,522
Free reserves excluding Boudicca 222,093 191,520
Free reserves including Boudicca 375,893 276,520
Policy Year ‘99 ‘00 ‘01 ‘02 ‘03 ‘04 ‘05 ‘06 ‘07 ‘08 ‘09 ‘10
General increase % 0 0 10 28.8* 15 8.5 7.5 2.5 5 23.8* 12.5 5
Supplementary call record % 25/15 25/25 25/25 40/40 40/40 40/30 40/30 30/30 30/30 40/40 40/40 40/40
(Estimated/Called)
* includes the effect of an increase in budgetted supplementary call.
Effective Date July 2009Rating AOutlook N/AType of Rating Pi
Effective Date July 2010Rating AOutlook N/AType of Rating Pi
11
GardAssuranceforeningen GardGard AS, Kittelsbuktveien 31, NO-4836 Arendal, Servicebox 600, NO-4809 Arendal, Norway
www.gard.noTel: +47 37 01 91 00
Manager’s Comment
In volume terms, the book grew marginally over the year, increasing by around 5%. Given the slowdown in the maritime industriesoverall, this result was a good one. The increase came from segments such as larger bulkers, tankers and LNG vessels.
The announcement that there would be no general increase for the 2010 policy year generated a great deal of goodwill and wasa key factor in the renewals, which met the targets for premium development and deductibles for the existing portfolio. Close to99% of the mutual tonnage renewed showing a strong commitment from our existing Members. In addition, there was positivetonnage growth, which was achieved by gaining quality tonnage from both existing and new Members.
Entered GT by Vessel Type Entered GT by Region
Tanker
Bulker/General cargo
Container
Passenger
Mobile offshore
Other
Americas
Europe
Asia Pacific
Ships & GT
12 | Aon Protection & Indemnity Mid-Term Review 2010
Breakdown of Investment by Type
Equities
Bonds
Property
S&P Rating
Financial Year Balance Sheet Data (Year Ending February) US$000s 2010 2009
Income Calls and premiums 489,055 460,158
Reduction in 2009 deferred call -41,458 0
Reinsurance premiums -69,899 -66,436
Total income 377,698 393,722
Expenditure Net claims incurred -334,627 -256,962
Net operating expenses -54,518 -42,818
Total expenditure -389,145 -299,780
Underwriting result pre investment/other financial income and tax -11,447 93,942
Investment/other financial income 98,343 -202,486
Tax/interest charged -2,739 -12,971
Overall result 84,157 -121,515
Free reserves 557,542 394,100
Policy Year ‘99 ‘00 ‘01 ‘02 ‘03 ‘04 ‘05 ‘06 ‘07 ‘08 ‘09 ‘10
General increase % -3.85 5 10 25 15 7.5 5 7.5 5 10 15 0
Supplementary call record % 25/15 25/25 25/25 25/25 25/25 25/25 25/20 25/20 25/25 25/25 25/10 25/25
(Estimated/Called)
Effective Date July 2009Rating AOutlook StableType of Rating Interactive
Effective Date July 2010Rating AOutlook StableType of Rating Interactive
13
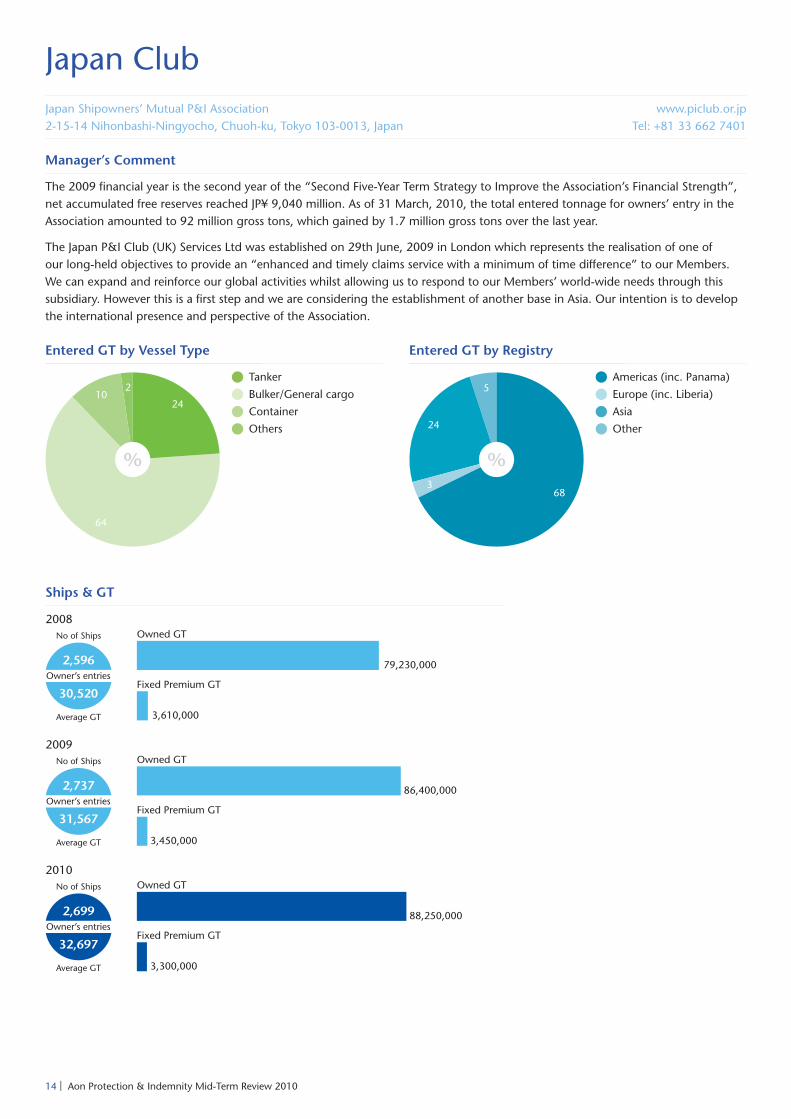
Japan ClubJapan Shipowners’ Mutual P&I Association2-15-14 Nihonbashi-Ningyocho, Chuoh-ku, Tokyo 103-0013, Japan
www.piclub.or.jpTel: +81 33 662 7401
Manager’s Comment
The 2009 financial year is the second year of the “Second Five-Year Term Strategy to Improve the Association’s Financial Strength”,net accumulated free reserves reached JP¥ 9,040 million. As of 31 March, 2010, the total entered tonnage for owners’ entry in theAssociation amounted to 92 million gross tons, which gained by 1.7 million gross tons over the last year.
The Japan P&I Club (UK) Services Ltd was established on 29th June, 2009 in London which represents the realisation of one ofour long-held objectives to provide an “enhanced and timely claims service with a minimum of time difference” to our Members.We can expand and reinforce our global activities whilst allowing us to respond to our Members’ world-wide needs through thissubsidiary. However this is a first step and we are considering the establishment of another base in Asia. Our intention is to developthe international presence and perspective of the Association.
Entered GT by Vessel Type Entered GT by Registry
Tanker
Bulker/General cargo
Container
Others
Americas (inc. Panama)
Europe (inc. Liberia)
Asia
Other
Ships & GT
14 | Aon Protection & Indemnity Mid-Term Review 2010
Breakdown of Investment by Type
Cash
Government bonds
Fixed income,
investment grade
S&P Rating
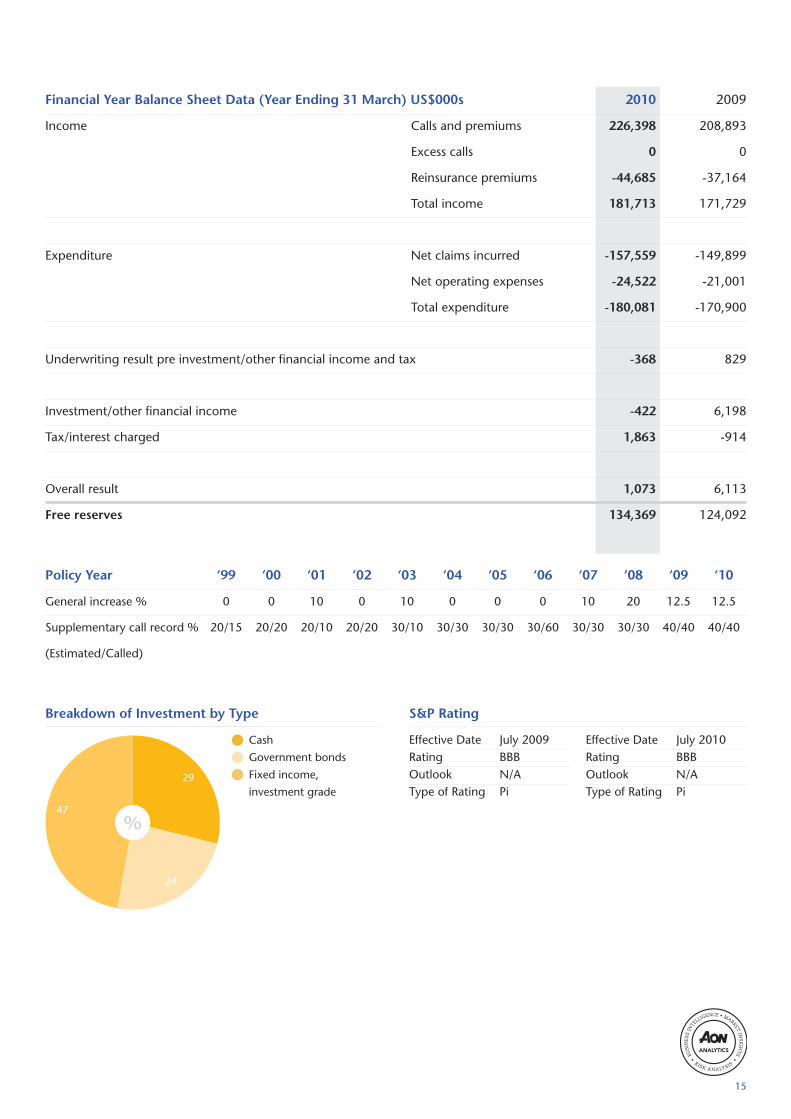
Financial Year Balance Sheet Data (Year Ending 31 March) US$000s 2010 2009
Income Calls and premiums 226,398 208,893
Excess calls 0 0
Reinsurance premiums -44,685 -37,164
Total income 181,713 171,729
Expenditure Net claims incurred -157,559 -149,899
Net operating expenses -24,522 -21,001
Total expenditure -180,081 -170,900
Underwriting result pre investment/other financial income and tax -368 829
Investment/other financial income -422 6,198
Tax/interest charged 1,863 -914
Overall result 1,073 6,113
Free reserves 134,369 124,092
Policy Year ‘99 ‘00 ‘01 ‘02 ‘03 ‘04 ‘05 ‘06 ‘07 ‘08 ‘09 ‘10
General increase % 0 0 10 0 10 0 0 0 10 20 12.5 12.5
Supplementary call record % 20/15 20/20 20/10 20/20 30/10 30/30 30/30 30/60 30/30 30/30 40/40 40/40
(Estimated/Called)
Effective Date July 2009Rating BBBOutlook N/AType of Rating Pi
Effective Date July 2010Rating BBBOutlook N/AType of Rating Pi
15

London ClubThe London Steamship Owners’ Mutual Insurance Association LimitedA Bilbrough & Co Ltd, 50 Leman Street, London E1 8HQ, UK
www.londonpandi.comTel: +44 (0)20 7772 8000
Manager’s Comment
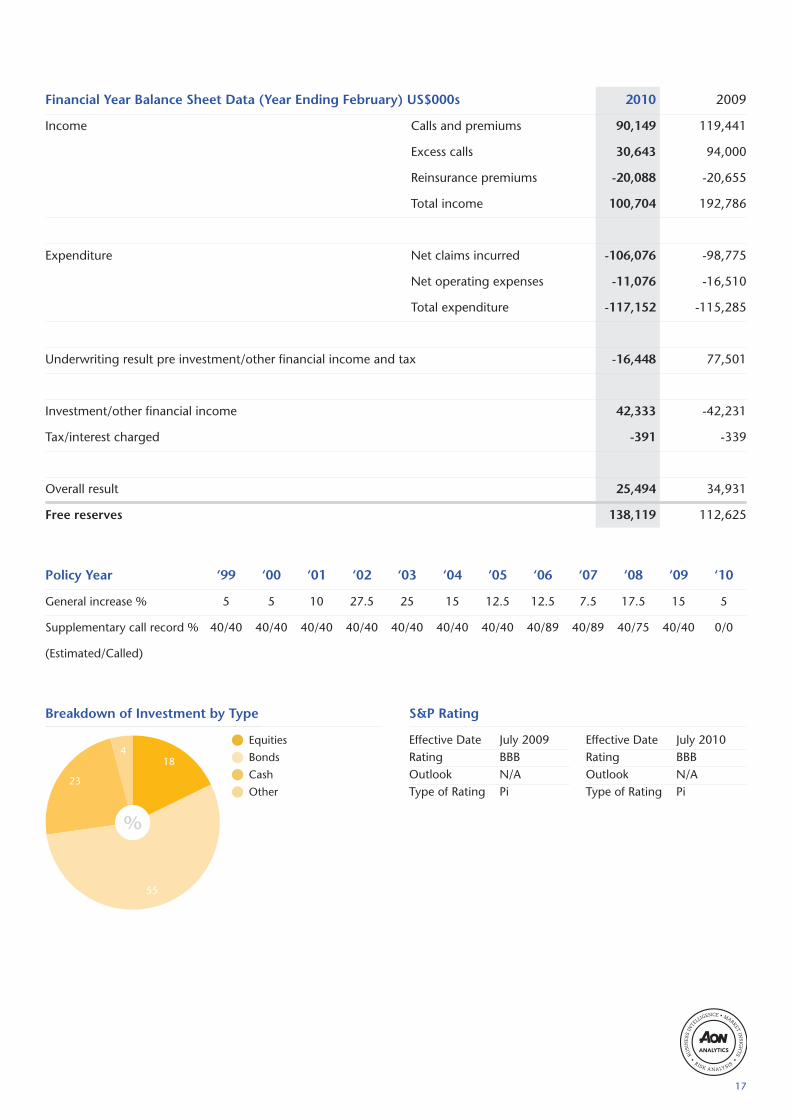
In the year to 20 February 2010, the Club recorded a return on its investments of US$42.7 million - a 14% return. A financial yearsurplus of US$25.9 million was achieved, and as a consequence, free reserves increased by 22% to just over US$141 million.
During the course of the year 6.4 million GT of tonnage was entered with the Club from existing Members, principally in Germanyand China, as well as new Members from Greece and various parts of the Far East. With the addition of tonnage entered sincethe last renewal, the Club's current Membership stands at over 40 millon GT.
The Club has therefore commenced the 2010/11 Policy Year in a significantly strengthened financial position and continues toattract tonnage from its existing as well as new Members.
Entered GT by Vessel Type Entered GT by Region
Tanker
Bulker/General cargo
Container
Americas
Europe
Asia Pacific
Other
Ships & GT
16 | Aon Protection & Indemnity Mid-Term Review 2010
Breakdown of Investment by Type
Equities
Bonds
Cash
Other
S&P Rating
Financial Year Balance Sheet Data (Year Ending February) US$000s 2010 2009
Income Calls and premiums 90,149 119,441
Excess calls 30,643 94,000
Reinsurance premiums -20,088 -20,655
Total income 100,704 192,786
Expenditure Net claims incurred -106,076 -98,775
Net operating expenses -11,076 -16,510
Total expenditure -117,152 -115,285
Underwriting result pre investment/other financial income and tax -16,448 77,501
Investment/other financial income 42,333 -42,231
Tax/interest charged -391 -339
Overall result 25,494 34,931
Free reserves 138,119 112,625
Policy Year ‘99 ‘00 ‘01 ‘02 ‘03 ‘04 ‘05 ‘06 ‘07 ‘08 ‘09 ‘10
General increase % 5 5 10 27.5 25 15 12.5 12.5 7.5 17.5 15 5
Supplementary call record % 40/40 40/40 40/40 40/40 40/40 40/40 40/40 40/89 40/89 40/75 40/40 0/0
(Estimated/Called)
Effective Date July 2009Rating BBBOutlook N/AType of Rating Pi
Effective Date July 2010Rating BBBOutlook N/AType of Rating Pi
17

26
2010
44
North of EnglandNorth of England P&I Association LimitedBaltic Place, South Shore Road, Gateshead NE8 3BA, UK
www.nepia.comTel: +44 (0)191 232 5221
Manager’s Comment
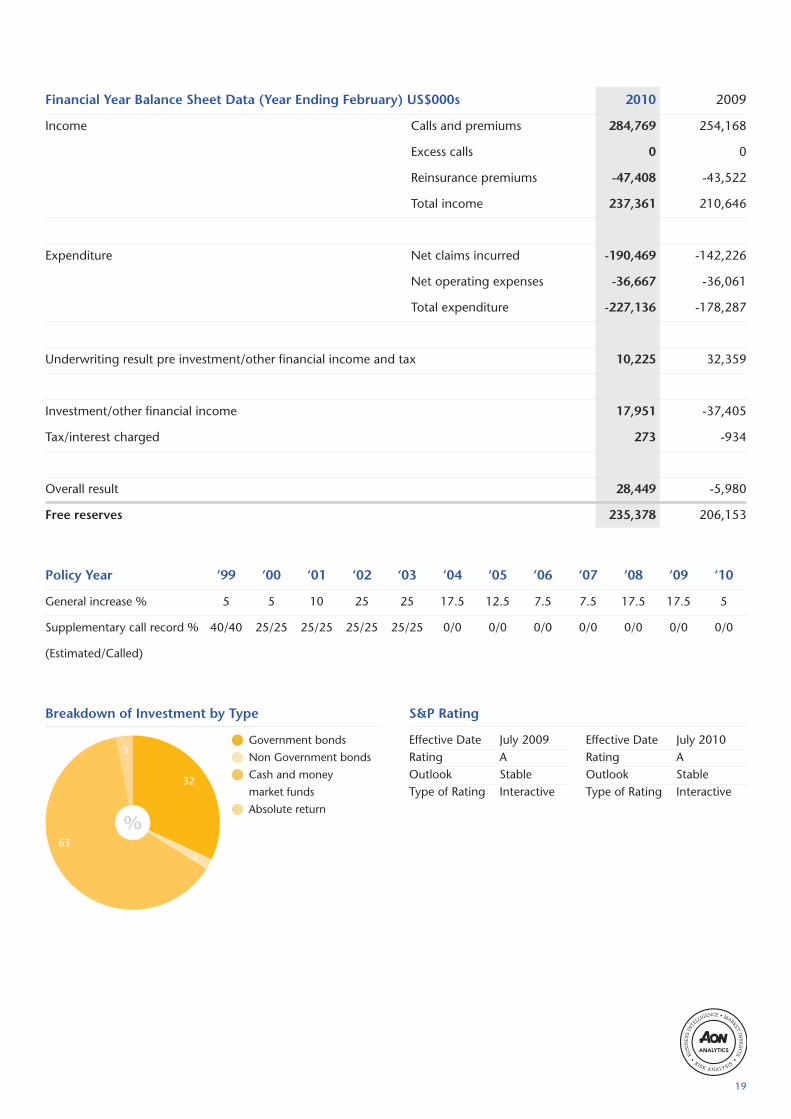
We have improved our financial strength with our free reserves increasing by US$29.2 million to US$240.3 million and net assetsincreasing by US$43.2 million to US$706.7 million. Tonnage entered has grown to 117 million GT and we continue to have aninteractive ‘A’ rating with a stable outlook from S&P. We have not made any un-forecast P&I supplementary calls for 19 years andthe combined ratio for 2009/10 was 94.8%.
In our 150th year of operation we are expanding our Newcastle office which, along with continued recruitment of high qualitypersonnel, will ensure service levels for our members will be enhanced.
Entered GT by Vessel Type Entered GT by Region
Tanker
Bulker/General cargo
Container
Other
Americas
Europe
Asia Pacific
Other
Ships & GT
18 | Aon Protection & Indemnity Mid-Term Review 2010
Breakdown of Investment by Type
Government bonds
Non Government bonds
Cash and money
market funds
Absolute return
S&P Rating
Financial Year Balance Sheet Data (Year Ending February) US$000s 2010 2009
Income Calls and premiums 284,769 254,168
Excess calls 0 0
Reinsurance premiums -47,408 -43,522
Total income 237,361 210,646
Expenditure Net claims incurred -190,469 -142,226
Net operating expenses -36,667 -36,061
Total expenditure -227,136 -178,287
Underwriting result pre investment/other financial income and tax 10,225 32,359
Investment/other financial income 17,951 -37,405
Tax/interest charged 273 -934
Overall result 28,449 -5,980
Free reserves 235,378 206,153
Policy Year ‘99 ‘00 ‘01 ‘02 ‘03 ‘04 ‘05 ‘06 ‘07 ‘08 ‘09 ‘10
General increase % 5 5 10 25 25 17.5 12.5 7.5 7.5 17.5 17.5 5
Supplementary call record % 40/40 25/25 25/25 25/25 25/25 0/0 0/0 0/0 0/0 0/0 0/0 0/0
(Estimated/Called)
Effective Date July 2009Rating AOutlook StableType of Rating Interactive
Effective Date July 2010Rating AOutlook StableType of Rating Interactive
19
Shipowners ClubThe Shipowners' Mutual Protection and Indemnity AssociationSt Clare House, 30-33 Minories, London EC3N 1BP, UK
www.shipownersclub.comTel: +44 (0)20 7488 0911
Manager’s Comment
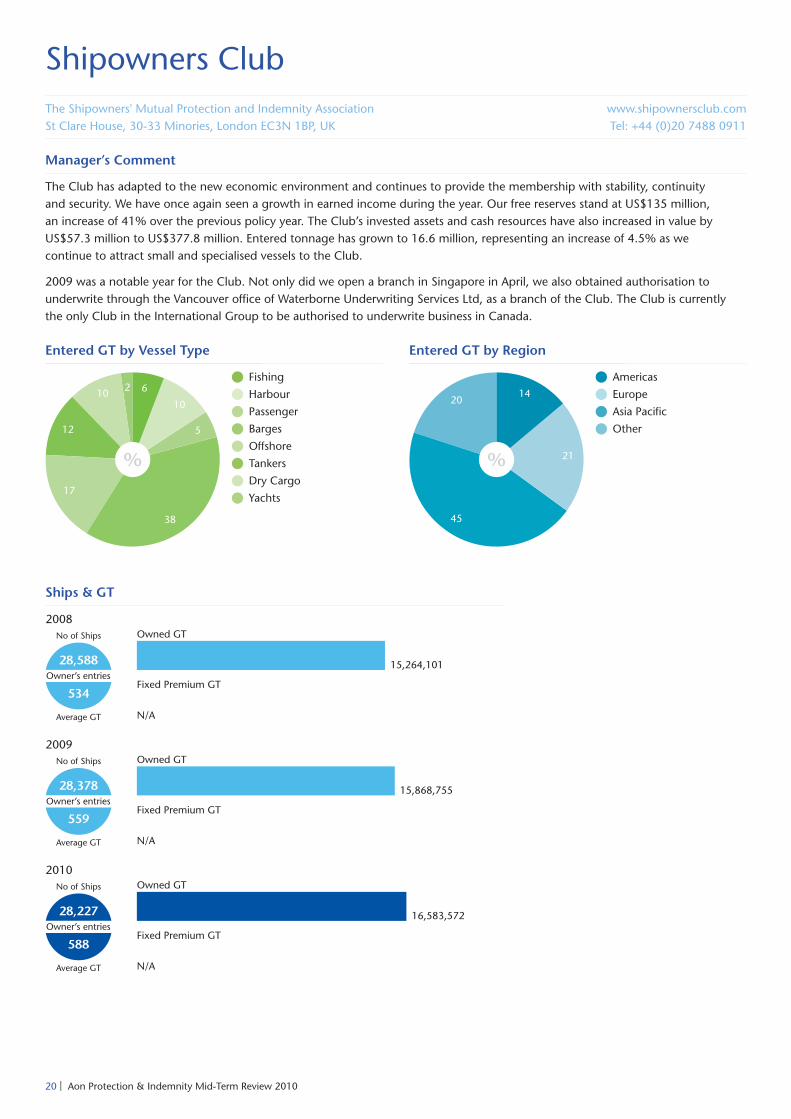
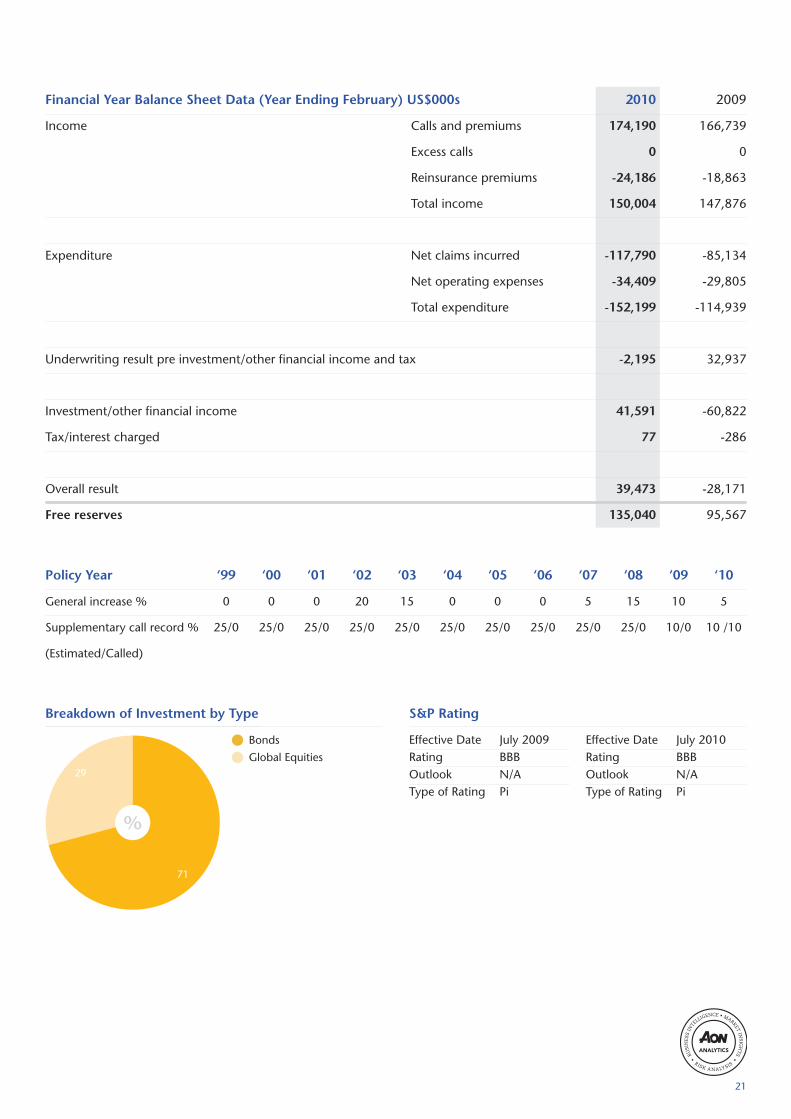
The Club has adapted to the new economic environment and continues to provide the membership with stability, continuityand security. We have once again seen a growth in earned income during the year. Our free reserves stand at US$135 million,an increase of 41% over the previous policy year. The Club’s invested assets and cash resources have also increased in value byUS$57.3 million to US$377.8 million. Entered tonnage has grown to 16.6 million, representing an increase of 4.5% as wecontinue to attract small and specialised vessels to the Club.
2009 was a notable year for the Club. Not only did we open a branch in Singapore in April, we also obtained authorisation tounderwrite through the Vancouver office of Waterborne Underwriting Services Ltd, as a branch of the Club. The Club is currentlythe only Club in the International Group to be authorised to underwrite business in Canada.
Entered GT by Vessel Type Entered GT by Region
Americas
Europe
Asia Pacific
Other
Ships & GT
Fishing
Harbour
Passenger
Barges
Offshore
Tankers
Dry Cargo
Yachts
20 | Aon Protection & Indemnity Mid-Term Review 2010
Breakdown of Investment by Type
Bonds
Global Equities
S&P Rating
Financial Year Balance Sheet Data (Year Ending February) US$000s 2010 2009
Income Calls and premiums 174,190 166,739
Excess calls 0 0
Reinsurance premiums -24,186 -18,863
Total income 150,004 147,876
Expenditure Net claims incurred -117,790 -85,134
Net operating expenses -34,409 -29,805
Total expenditure -152,199 -114,939
Underwriting result pre investment/other financial income and tax -2,195 32,937
Investment/other financial income 41,591 -60,822
Tax/interest charged 77 -286
Overall result 39,473 -28,171
Free reserves 135,040 95,567
Policy Year ‘99 ‘00 ‘01 ‘02 ‘03 ‘04 ‘05 ‘06 ‘07 ‘08 ‘09 ‘10
General increase % 0 0 0 20 15 0 0 0 5 15 10 5
Supplementary call record % 25/0 25/0 25/0 25/0 25/0 25/0 25/0 25/0 25/0 25/0 10/0 10 /10
(Estimated/Called)
Effective Date July 2009Rating BBBOutlook N/AType of Rating Pi
Effective Date July 2010Rating BBBOutlook N/AType of Rating Pi
21
SkuldAssuranceforeningen SKULD(Gjensidig), Ruseløkkvn. 26, 0251 Oslo, Norway
www.skuld.comTel: +47 22 00 22 00
Manager’s Comment
2009 concluded one of our most successful renewals for Skuld with a record growth in volume and tonnage. On the back of asluggish world fleet growth of 7%, Skuld increased its tonnage by 15%, adding 7.7 million GT to total owner entries of 57 millionGT, and seeing a rise in gross premiums of 20% from US$213 million to US$255 million.
Once again, Skuld announced one of the lowest general increases of all the International Group clubs and has avoided unbudgetedcalls. The 2009 bottom line stands at US$57 million, lifting free reserves to US$202 million, and we continue to have an interactiveA- rating with stable outlook.
We advanced strongly in the offshore sector and weathered a competitive charterers’ market very well, underwriting some18% more business than expected.
Entered GT by Vessel Type Entered GT by Region
Americas
Europe
Asia Pacific
Other
Ships & GT
Tanker
Bulker/General cargo
Container
Other
Passenger
22 | Aon Protection & Indemnity Mid-Term Review 2010
Breakdown of Investment by Type
Cash
Fixed income
Equities
Commodities
Private equity
Hedge funds
S&P Rating
Financial Year Balance Sheet Data (Year Ending February) US$000s 2010 2009
Income Calls and premiums 255,400 213,200
Excess calls 0 0
Reinsurance premiums -26,500 -23,300
Total income 228,900 189,900
Expenditure Net claims incurred -179,000 -144,300
Net operating expenses -39,200 -32,700
Total expenditure -218,200 -177,000
Underwriting result pre investment/other financial income and tax 10,700 12,900
Investment/other financial income 52,000 -73,100
Tax/interest charged -5,700 900
Overall result 57,000 -59,300
Free reserves 201,500 144,000
Policy Year ‘99 ‘00 ‘01 ‘02 ‘03 ‘04 ‘05 ‘06 ‘07 ‘08 ‘09 ‘10
General increase % 5 0 10 30 25 15 7.5 5 2.5 7.5 15 5
Supplementary call record % 20/45 20/65 20/20 0/0 0/0 0/0 0/0 0/0 0/0 0/0 0/0 0/0
(Estimated/Called)
Effective Date July 2009Rating A-Outlook StableType of Rating Interactive
Effective Date July 2010Rating A-Outlook StableType of Rating Interactive
23
Standard ClubThe Standard Steamship Owners’ P&I Association (Bermuda) Limited12/13 Essex Street, London WC2R 3AA, UK
www.standard-club.comTel: +44 (0)20 3320 8888
Manager’s Comment
This year marks the Standard Club’s 125th anniversary, and it is pleasing that it coincides with the club having a record level oftonnage insured and a record level of free reserves to support the business. However, the club has to operate within an increasinglyrigorous regulatory environment and work towards a new, tougher solvency regime.
The growth in the tonnage insured is evidence that the club is proving attractive to both existing and new members. The growthhas come from all sectors of shipping, with the club insuring a widely diversified membership operating across the whole spectrumof shipping activities, well-spread geographically.
Entered GT by Vessel Type Entered GT by Region
Ships & GT
Tanker
Bulker/General cargo
Container
Passenger
Other
Americas
Europe
Asia Pacific
Other
24 | Aon Protection & Indemnity Mid-Term Review 2010
Breakdown of Investment by Type
Bonds and cash
Equities
Alternative
Gold
S&P Rating
Financial Year Balance Sheet Data (Year Ending February) US$000s 2010 2009
Income Calls and premiums 250,291 205,065
Excess calls 0 0
Reinsurance premiums -48,114 -31,225
Total income 202,177 173,840
Expenditure Net claims incurred -184,221 -114,492
Net operating expenses -16,615 -17,490
Total expenditure -200,836 -131,982
Underwriting result pre investment/other financial income and tax 1,341 41,858
Investment/other financial income 65,341 -94,090
Tax/interest charged 453 1,782
Overall result 67,135 -50,450
Free reserves 242,807 175,672
Policy Year ‘99 ‘00 ‘01 ‘02 ‘03 ‘04 ‘05 ‘06 ‘07 ‘08 ‘09 ‘10
General increase % 0 0 7.5 2.5 25 20 12.5 5 5 15 15 3
Supplementary call record % 25/15 25/25 25/25 0/0 0/0 0/0 0/0 0/0 0/0 0/0 0/0 0/0
(Estimated/Called)
Effective Date July 2009Rating AOutlook StableType of Rating Interactive
Effective Date July 2010Rating AOutlook StableType of Rating Interactive
25
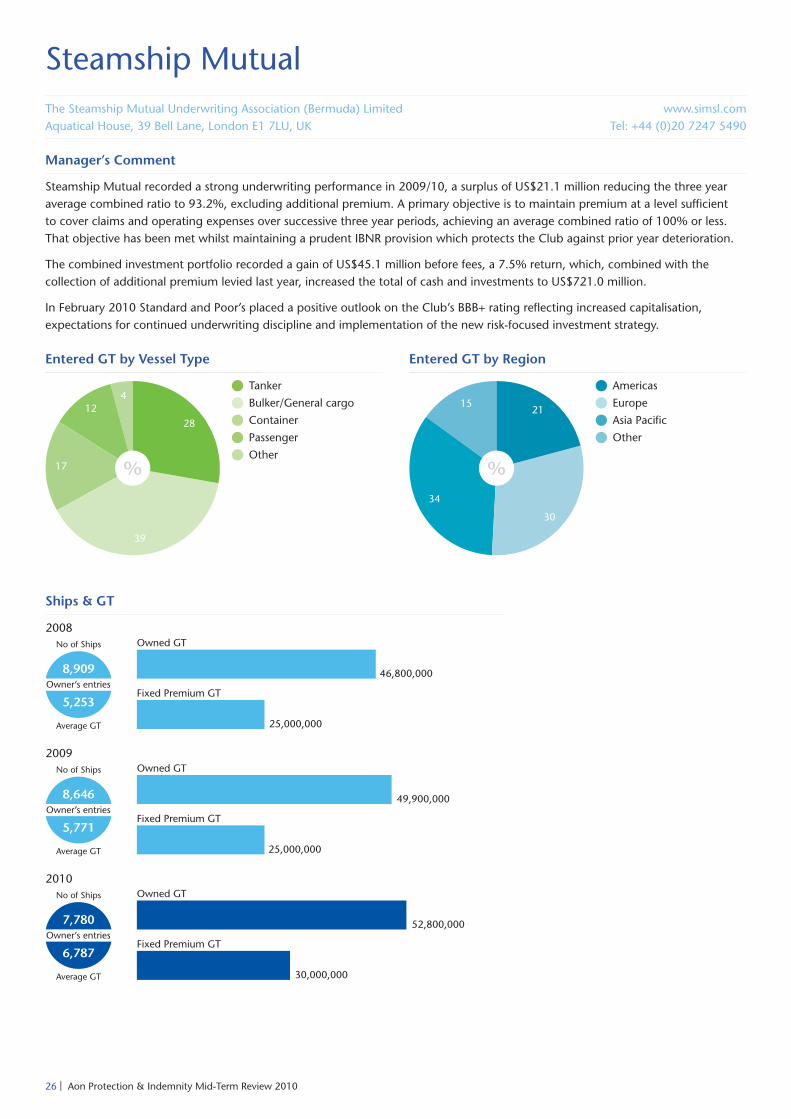
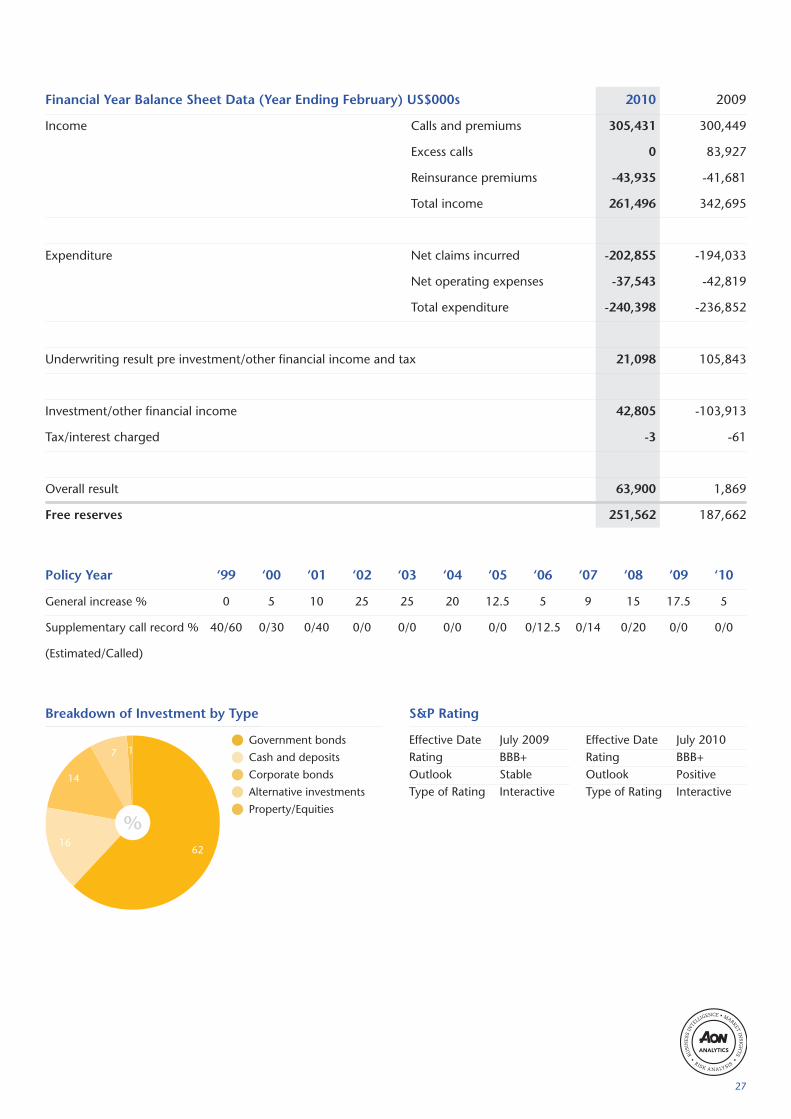
Steamship MutualThe Steamship Mutual Underwriting Association (Bermuda) LimitedAquatical House, 39 Bell Lane, London E1 7LU, UK
www.simsl.comTel: +44 (0)20 7247 5490
Manager’s Comment
Steamship Mutual recorded a strong underwriting performance in 2009/10, a surplus of US$21.1 million reducing the three yearaverage combined ratio to 93.2%, excluding additional premium. A primary objective is to maintain premium at a level sufficientto cover claims and operating expenses over successive three year periods, achieving an average combined ratio of 100% or less.That objective has been met whilst maintaining a prudent IBNR provision which protects the Club against prior year deterioration.
The combined investment portfolio recorded a gain of US$45.1 million before fees, a 7.5% return, which, combined with thecollection of additional premium levied last year, increased the total of cash and investments to US$721.0 million.
In February 2010 Standard and Poor’s placed a positive outlook on the Club’s BBB+ rating reflecting increased capitalisation,expectations for continued underwriting discipline and implementation of the new risk-focused investment strategy.
Entered GT by Vessel Type Entered GT by Region
Americas
Europe
Asia Pacific
Other
Ships & GT
Tanker
Bulker/General cargo
Container
Passenger
Other
26 | Aon Protection & Indemnity Mid-Term Review 2010
Breakdown of Investment by Type
Government bonds
Cash and deposits
Corporate bonds
Alternative investments
Property/Equities
S&P Rating
Financial Year Balance Sheet Data (Year Ending February) US$000s 2010 2009
Income Calls and premiums 305,431 300,449
Excess calls 0 83,927
Reinsurance premiums -43,935 -41,681
Total income 261,496 342,695
Expenditure Net claims incurred -202,855 -194,033
Net operating expenses -37,543 -42,819
Total expenditure -240,398 -236,852
Underwriting result pre investment/other financial income and tax 21,098 105,843
Investment/other financial income 42,805 -103,913
Tax/interest charged -3 -61
Overall result 63,900 1,869
Free reserves 251,562 187,662
Policy Year ‘99 ‘00 ‘01 ‘02 ‘03 ‘04 ‘05 ‘06 ‘07 ‘08 ‘09 ‘10
General increase % 0 5 10 25 25 20 12.5 5 9 15 17.5 5
Supplementary call record % 40/60 0/30 0/40 0/0 0/0 0/0 0/0 0/12.5 0/14 0/20 0/0 0/0
(Estimated/Called)
Effective Date July 2009Rating BBB+Outlook StableType of Rating Interactive
Effective Date July 2010Rating BBB+Outlook PositiveType of Rating Interactive
27
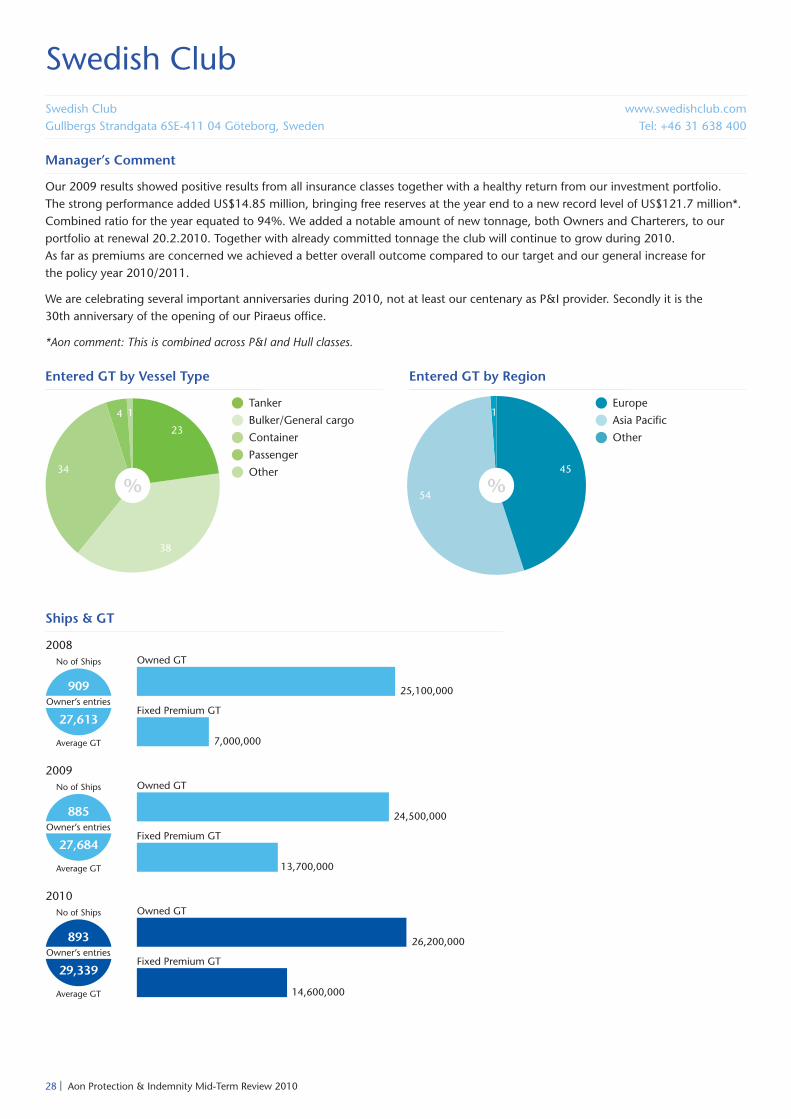
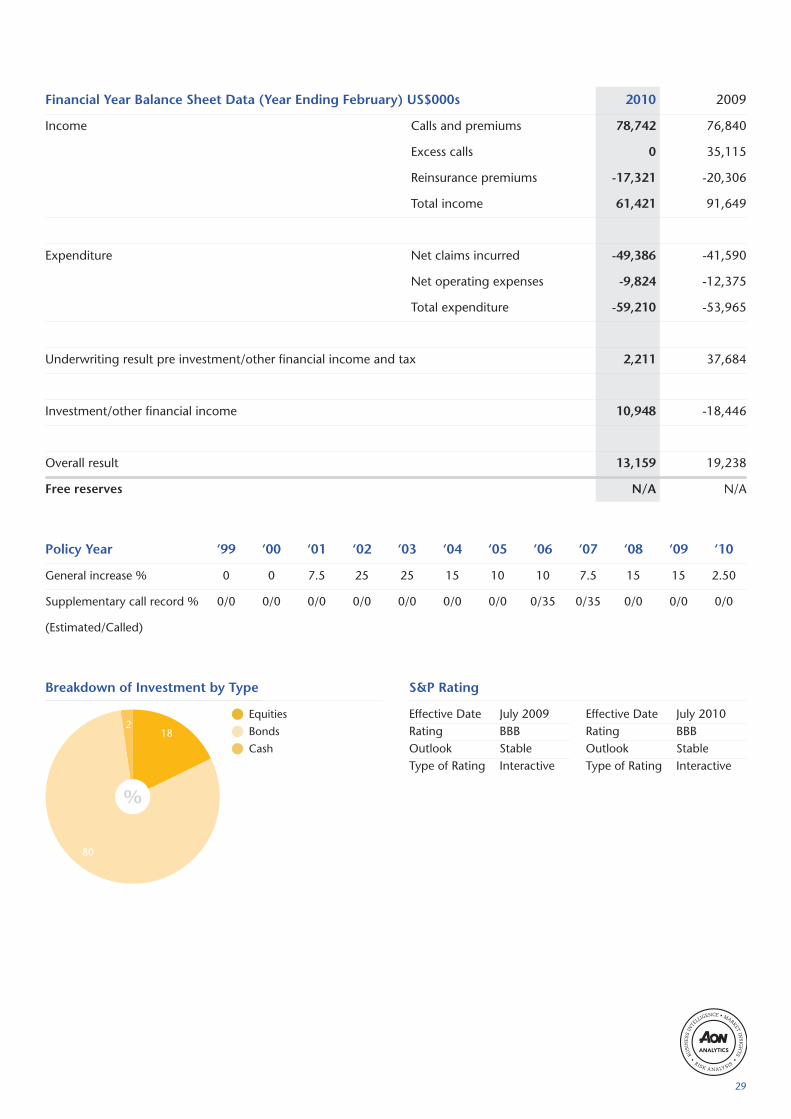
Swedish ClubSwedish ClubGullbergs Strandgata 6SE-411 04 Göteborg, Sweden
www.swedishclub.comTel: +46 31 638 400
Manager’s Comment
Our 2009 results showed positive results from all insurance classes together with a healthy return from our investment portfolio.The strong performance added US$14.85 million, bringing free reserves at the year end to a new record level of US$121.7 million*.Combined ratio for the year equated to 94%. We added a notable amount of new tonnage, both Owners and Charterers, to ourportfolio at renewal 20.2.2010. Together with already committed tonnage the club will continue to grow during 2010.As far as premiums are concerned we achieved a better overall outcome compared to our target and our general increase forthe policy year 2010/2011.
We are celebrating several important anniversaries during 2010, not at least our centenary as P&I provider. Secondly it is the30th anniversary of the opening of our Piraeus office.
*Aon comment: This is combined across P&I and Hull classes.
Entered GT by Vessel Type Entered GT by Region
Europe
Asia Pacific
Other
Ships & GT
Tanker
Bulker/General cargo
Container
Passenger
Other
28 | Aon Protection & Indemnity Mid-Term Review 2010
Breakdown of Investment by Type
Equities
Bonds
Cash
S&P Rating
Financial Year Balance Sheet Data (Year Ending February) US$000s 2010 2009
Income Calls and premiums 78,742 76,840
Excess calls 0 35,115
Reinsurance premiums -17,321 -20,306
Total income 61,421 91,649
Expenditure Net claims incurred -49,386 -41,590
Net operating expenses -9,824 -12,375
Total expenditure -59,210 -53,965
Underwriting result pre investment/other financial income and tax 2,211 37,684
Investment/other financial income 10,948 -18,446
Overall result 13,159 19,238
Free reserves N/A N/A
Policy Year ‘99 ‘00 ‘01 ‘02 ‘03 ‘04 ‘05 ‘06 ‘07 ‘08 ‘09 ‘10
General increase % 0 0 7.5 25 25 15 10 10 7.5 15 15 2.50
Supplementary call record % 0/0 0/0 0/0 0/0 0/0 0/0 0/0 0/35 0/35 0/0 0/0 0/0
(Estimated/Called)
Effective Date July 2009Rating BBBOutlook StableType of Rating Interactive
Effective Date July 2010Rating BBBOutlook StableType of Rating Interactive
29
UK P&I ClubThe United Kingdom Mutual Ship Assurance Association (Bermuda) LimitedThomas Miller P&I Ltd, 90 Fenchurch Street, London, EC3M 4ST, UK
www.ukpandi.comTel: +44 (0)20 7283 4646
Manager’s Comment
The UK Club moved closer to underwriting breakeven and continued to rebuild its capital position over the last year despitecontinuing uncertainty in the world economy and a tougher regulatory background. With a new and comprehensive reinsuranceprogramme and robust financial models to ensure the requisite levels of capital, the Club is facing the future with confidence.
The Board's decision last October to levy the supplementary premium on the 2008 policy year at 20 per cent, as estimated hasremoved the deficits across the policy years of 2006, 2007 and 2008. The surplus generated on 2008 effectively eliminated theremaining deficits on the two earlier policy years.
The Club is currently rated A- (stable outlook) by Standard & Poor’s. According to the rating agency, the Club’s strong capitalisationis supported by very strong capital adequacy. Progress towards underwriting breakeven and achieving a full A rating are keyfinancial targets.
Entered GT by Vessel Type Entered GT by Region
Americas
Europe
Asia Pacific
Other
Ships & GT
Tanker
Bulker/General cargo
Container
Passenger
Other
30 | Aon Protection & Indemnity Mid-Term Review 2010

Breakdown of Investment by Type
Cash
Fixed interest
Absolute return funds
Equities
S&P Rating
Financial Year Balance Sheet Data (Year Ending February) US$000s 2010 2009
Income Calls and premiums 383,867 420,367
Excess calls 63,316 128,356
Reinsurance premiums -75,935 -78,402
Total income 371,248 470,321
Expenditure Net claims incurred -319,964 -353,079
Net operating expenses -44,113 -51,639
Total expenditure -364,077 -404,718
Underwriting result pre investment/other financial income and tax 7,171 65,603
Investment/other financial income 78,665 -56,182
Tax/interest charged -10,663 -2,806
Overall result 75,173 6,615
Free reserves excluding Hybrid capital 310,700 235,527
Free reserves including Hybrid capital 409,105 333,477
Policy Year ‘99 ‘00 ‘01 ‘02 ‘03 ‘04 ‘05 ‘06 ‘07 ‘08 ‘09 ‘10
General increase % 5 0 7.5 20 25 17.5 12.5 12.5 7.5 17.5 12.5 5
Supplementary call record % 40/30 0/0 0/0 0/0 0/0 0/0 0/0 0/20 0/25 0/20 0/0 0/0
(Estimated/Called)
Effective Date July 2009Rating A-Outlook StableType of Rating Interactive
Effective Date July 2010Rating A-Outlook StableType of Rating Interactive
31
West of EnglandWest of England Ship Owners Mutual Insurance Association (Luxembourg)Tower Bridge Court, 226 Tower Bridge Road, London, SE1 2UP, UK
www.westpandi.comTel: +44 (0)20 7716 6000
Manager’s Comment
2009 has in many respects been a more satisfactory year than 2008 for West of England. The Club made steady progress inrecovering from the banking and credit crisis which adversely affected 2008. Most importantly, investment market recoveryenabled it to recoup a significant proportion of its 2008 unrealised losses. Investment gains contributed to a 5% increase infree reserve to US$169.1 million.
Claims experience for Members claims was encouraging. Despite an unwelcome late surge in the number of larger claims,volumes were significantly lower than prior years and the cost appears so far to be developing to a lower level than any recent year.This continues into 2010 although there may be early signs of an increase in frequency of larger claims. The Club’s experiencewas not however consistent with the International Group Pool’s. Overall the Club expects the trend in claims costs to rise.
Entered GT by Vessel Type Entered GT by Region
Americas
Europe
Asia Pacific
Other
Ships & GT
Tanker
Bulker/General cargo
Container
Passenger
Other
32 | Aon Protection & Indemnity Mid-Term Review 2010
Breakdown of Investment by Type
Fixed income
Absolute return
Equities
Cash
S&P Rating
Financial Year Balance Sheet Data (Year Ending February) US$000s 2010 2009
Income Calls and premiums 239,600 255,600
Excess calls 0 152,900
Reinsurance premiums -45,600 -45,000
Total income 194,000 363,500
Expenditure Net claims incurred -214,500 -231,900
Net operating expenses -35,100 -49,900
Total expenditure -249,600 -281,800
Underwriting result pre investment/other financial income and tax -55,600 81,700
Investment/other financial income 66,600 -96,500
Tax/interest charged -2,700 2,000
Overall result 8,300 -12,800
Free reserves 169,100 160,800
Policy Year ‘99 ‘00 ‘01 ‘02 ‘03 ‘04 ‘05 ‘06 ‘07 ‘08 ‘09 ‘10
General increase % 5 5 5 10 25 15 12.5 12.5 5 15 19.2* 5
Supplementary call record % 50/50 50/50 20/20 20/20 20/20 20/35 20/35 20/55 20/55 20/65 30/30 30/30
(Estimated/Called)
*includes the effect of an increase in budgetted supplementary call.
Effective Date July 2009Rating BBBOutlook N/AType of Rating Pi
Effective Date July 2010Rating BBBOutlook N/AType of Rating Pi
33

34 | Aon Protection & Indemnity Mid-Term Review 2010
P&I Comparative Data
Free Reserves/Net Call Income 36Net Claims/Net Call Income
Underwriting Result/Net Call Income 38Overall Result/Net Call Income
Gross Call/GT 39Net Claims/GT
35
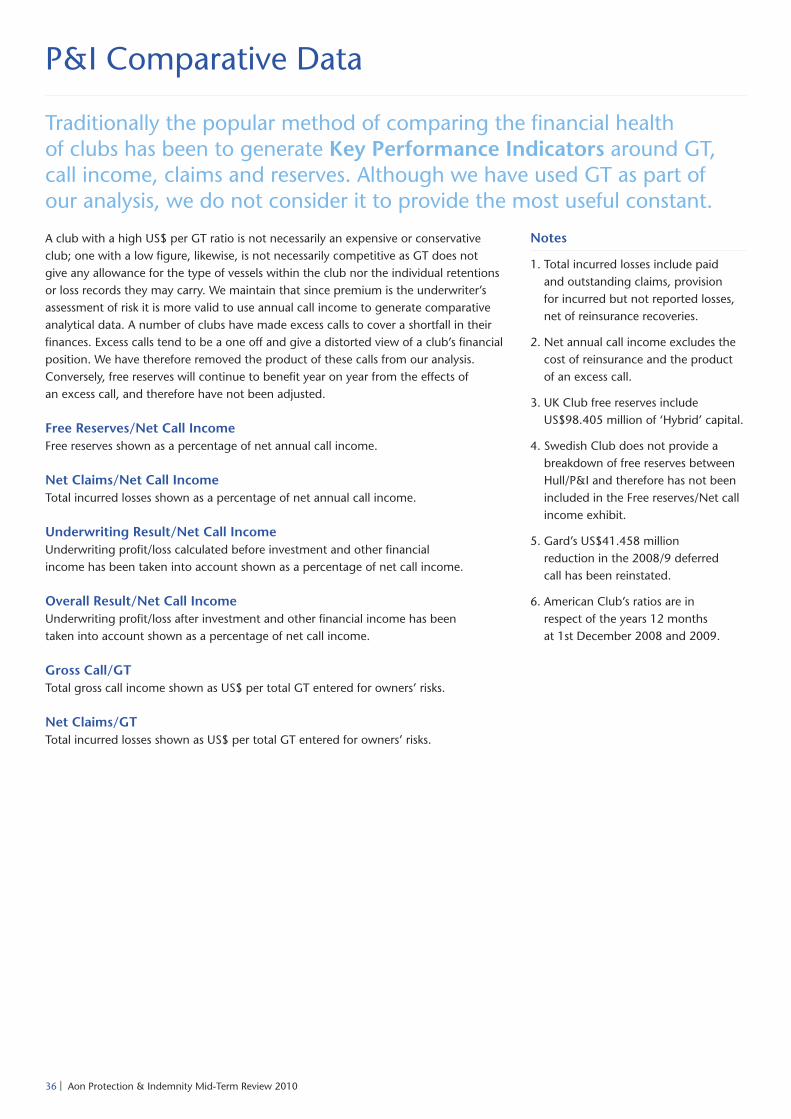
P&I Comparative Data
Traditionally the popular method of comparing the financial healthof clubs has been to generate Key Performance Indicators around GT,call income, claims and reserves. Although we have used GT as part ofour analysis, we do not consider it to provide the most useful constant.
1. Total incurred losses include paidand outstanding claims, provisionfor incurred but not reported losses,net of reinsurance recoveries.
2. Net annual call income excludes thecost of reinsurance and the productof an excess call.
3. UK Club free reserves includeUS$98.405 million of ‘Hybrid’ capital.
4. Swedish Club does not provide abreakdown of free reserves betweenHull/P&I and therefore has not beenincluded in the Free reserves/Net callincome exhibit.
5. Gard’s US$41.458 millionreduction in the 2008/9 deferredcall has been reinstated.
6. American Club’s ratios are inrespect of the years 12 monthsat 1st December 2008 and 2009.
A club with a high US$ per GT ratio is not necessarily an expensive or conservativeclub; one with a low figure, likewise, is not necessarily competitive as GT does notgive any allowance for the type of vessels within the club nor the individual retentionsor loss records they may carry. We maintain that since premium is the underwriter’sassessment of risk it is more valid to use annual call income to generate comparativeanalytical data. A number of clubs have made excess calls to cover a shortfall in theirfinances. Excess calls tend to be a one off and give a distorted view of a club’s financialposition. We have therefore removed the product of these calls from our analysis.Conversely, free reserves will continue to benefit year on year from the effects ofan excess call, and therefore have not been adjusted.
Free Reserves/Net Call IncomeFree reserves shown as a percentage of net annual call income.
Net Claims/Net Call IncomeTotal incurred losses shown as a percentage of net annual call income.
Underwriting Result/Net Call IncomeUnderwriting profit/loss calculated before investment and other financialincome has been taken into account shown as a percentage of net call income.
Overall Result/Net Call IncomeUnderwriting profit/loss after investment and other financial income has beentaken into account shown as a percentage of net call income.
Gross Call/GTTotal gross call income shown as US$ per total GT entered for owners’ risks.
Net Claims/GTTotal incurred losses shown as US$ per total GT entered for owners’ risks.
Notes
36 | Aon Protection & Indemnity Mid-Term Review 2010
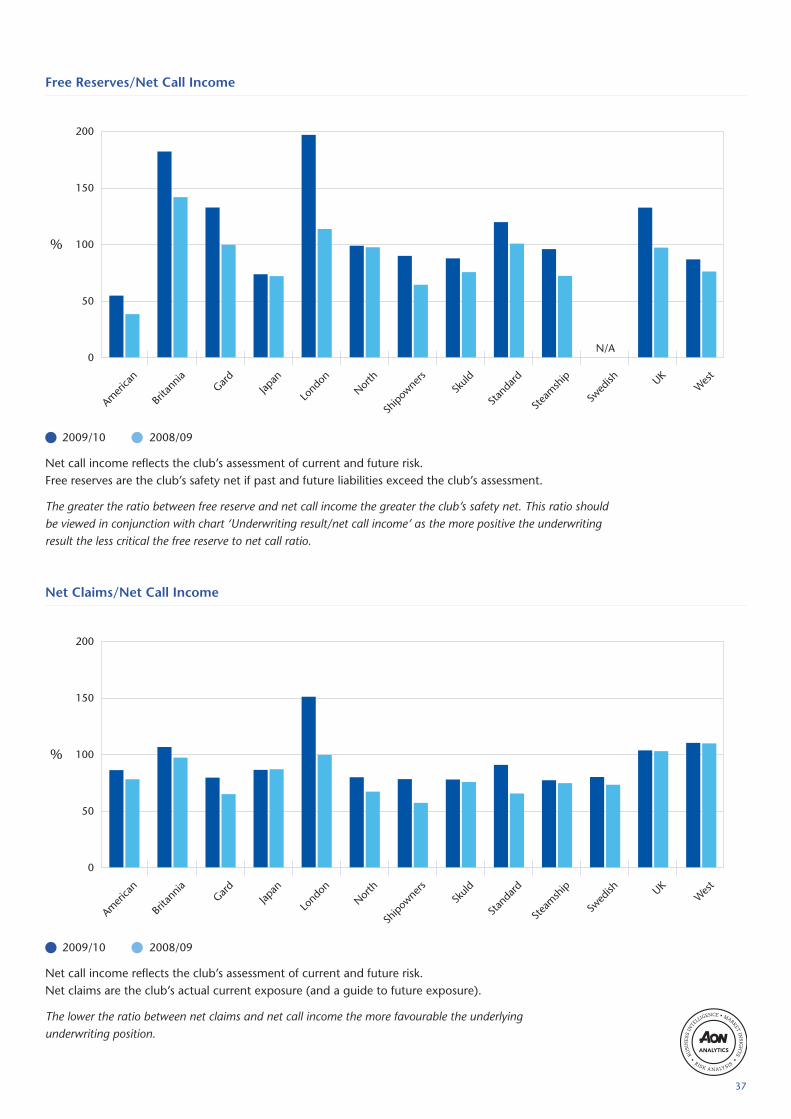
Net call income reflects the club’s assessment of current and future risk.Free reserves are the club’s safety net if past and future liabilities exceed the club’s assessment.
The greater the ratio between free reserve and net call income the greater the club’s safety net. This ratio shouldbe viewed in conjunction with chart ‘Underwriting result/net call income’ as the more positive the underwritingresult the less critical the free reserve to net call ratio.
Free Reserves/Net Call Income
Net call income reflects the club’s assessment of current and future risk.Net claims are the club’s actual current exposure (and a guide to future exposure).
The lower the ratio between net claims and net call income the more favourable the underlyingunderwriting position.
Net Claims/Net Call Income
2009/10 2008/09
2009/10 2008/09
37
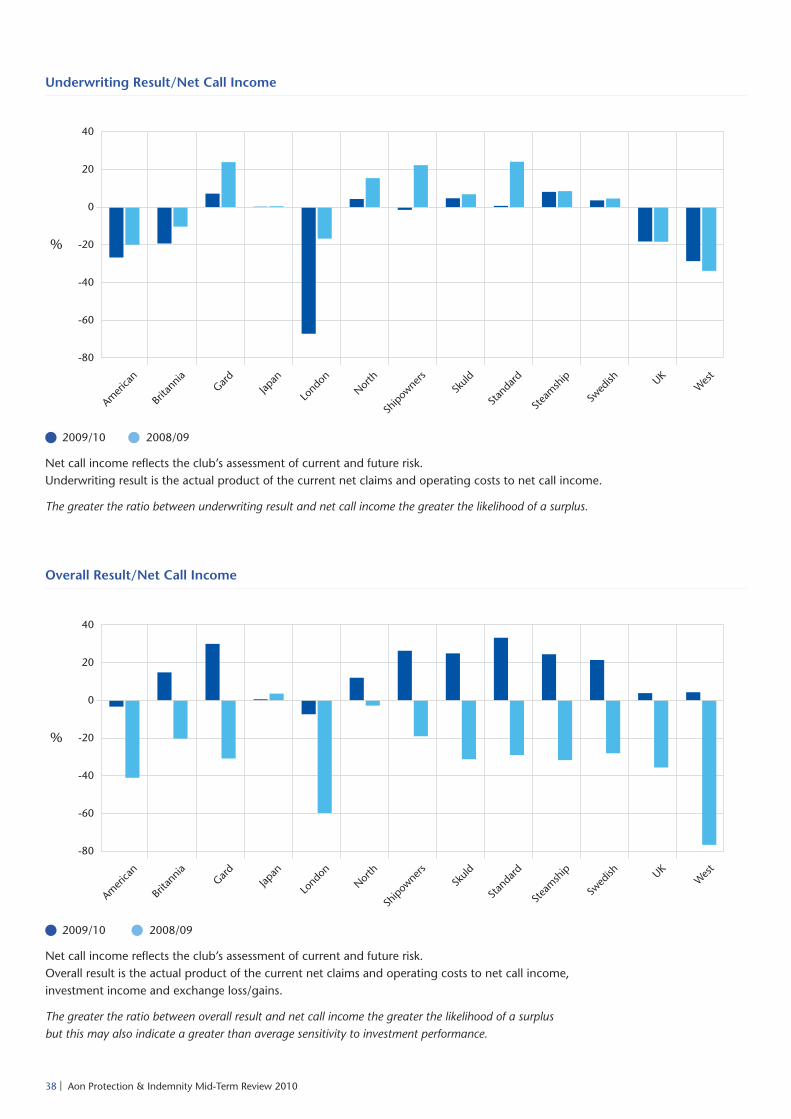
Net call income reflects the club’s assessment of current and future risk.Underwriting result is the actual product of the current net claims and operating costs to net call income.
The greater the ratio between underwriting result and net call income the greater the likelihood of a surplus.
Underwriting Result/Net Call Income
Net call income reflects the club’s assessment of current and future risk.Overall result is the actual product of the current net claims and operating costs to net call income,investment income and exchange loss/gains.
The greater the ratio between overall result and net call income the greater the likelihood of a surplusbut this may also indicate a greater than average sensitivity to investment performance.
Overall Result/Net Call Income
2009/10 2008/09
2009/10 2008/09
38 | Aon Protection & Indemnity Mid-Term Review 2010
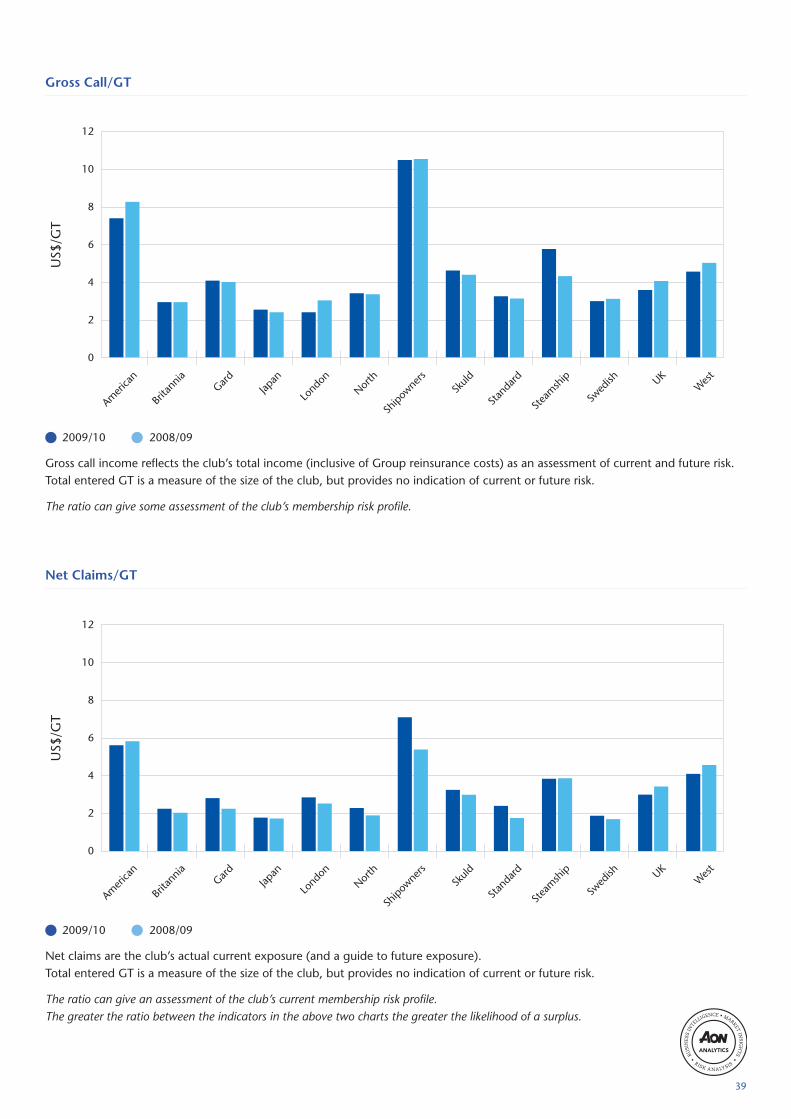
Gross call income reflects the club’s total income (inclusive of Group reinsurance costs) as an assessment of current and future risk.Total entered GT is a measure of the size of the club, but provides no indication of current or future risk.
The ratio can give some assessment of the club’s membership risk profile.
Gross Call/GT
Net claims are the club’s actual current exposure (and a guide to future exposure).Total entered GT is a measure of the size of the club, but provides no indication of current or future risk.
The ratio can give an assessment of the club’s current membership risk profile.The greater the ratio between the indicators in the above two charts the greater the likelihood of a surplus.
Net Claims/GT
2009/10 2008/09
2009/10 2008/09
39

40 | Aon Protection & Indemnity Mid-Term Review 2010
P&I Club Market Reference
2010 Policy Year Mutual Reinsurance Structure 42P&I Class Supplementary Call History 44P&I Class General Increase History 45
41
Excess of Loss
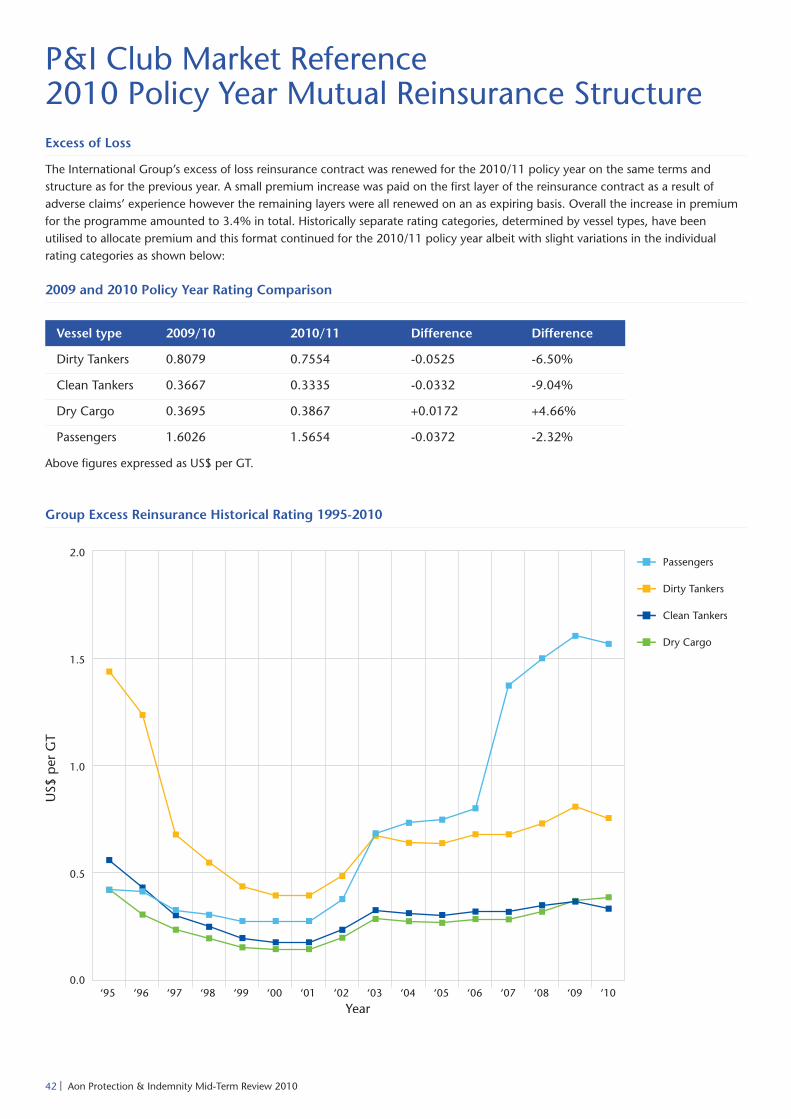
The International Group’s excess of loss reinsurance contract was renewed for the 2010/11 policy year on the same terms andstructure as for the previous year. A small premium increase was paid on the first layer of the reinsurance contract as a result ofadverse claims’ experience however the remaining layers were all renewed on an as expiring basis. Overall the increase in premiumfor the programme amounted to 3.4% in total. Historically separate rating categories, determined by vessel types, have beenutilised to allocate premium and this format continued for the 2010/11 policy year albeit with slight variations in the individualrating categories as shown below:
Above figures expressed as US$ per GT.
P&I Club Market Reference2010 Policy Year Mutual Reinsurance Structure
Group Excess Reinsurance Historical Rating 1995-2010
2009 and 2010 Policy Year Rating Comparison
Vessel type 2009/10 2010/11 Difference Difference
Dirty Tankers 0.8079 0.7554 -0.0525 -6.50%
Clean Tankers 0.3667 0.3335 -0.0332 -9.04%
Dry Cargo 0.3695 0.3867 +0.0172 +4.66%
Passengers 1.6026 1.5654 -0.0372 -2.32%
42 | Aon Protection & Indemnity Mid-Term Review 2010
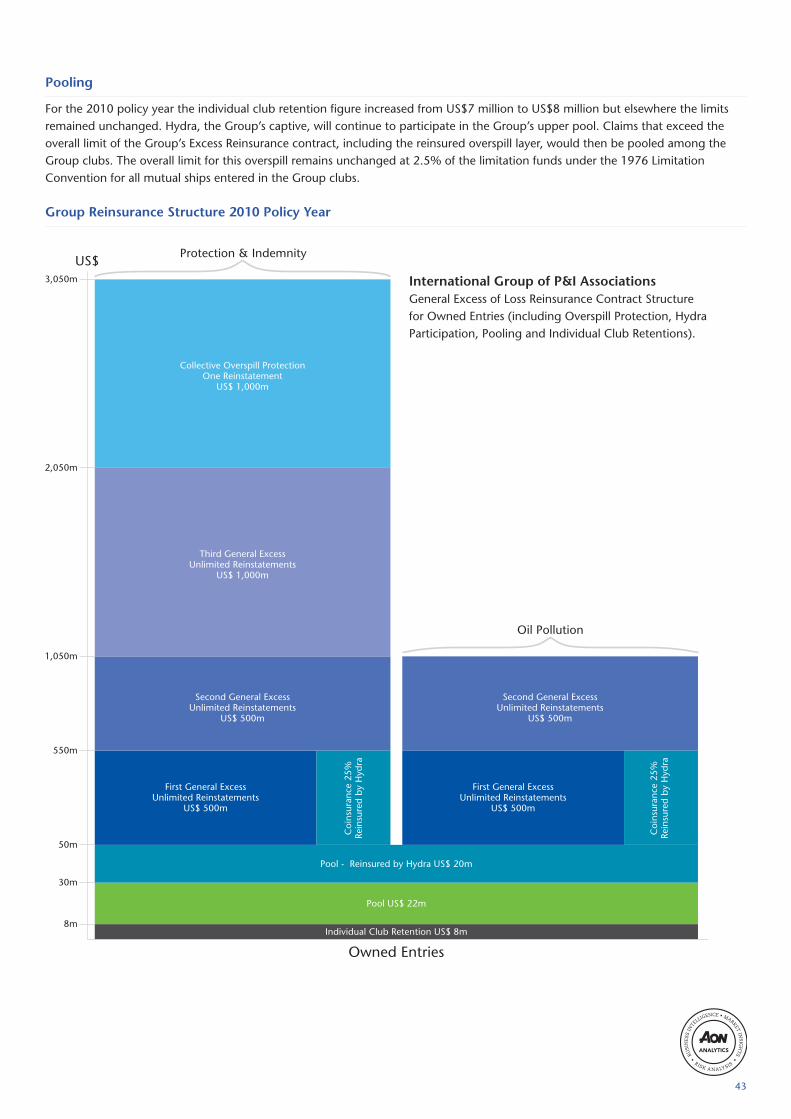
Pooling
For the 2010 policy year the individual club retention figure increased from US$7 million to US$8 million but elsewhere the limitsremained unchanged. Hydra, the Group’s captive, will continue to participate in the Group’s upper pool. Claims that exceed theoverall limit of the Group’s Excess Reinsurance contract, including the reinsured overspill layer, would then be pooled among theGroup clubs. The overall limit for this overspill remains unchanged at 2.5% of the limitation funds under the 1976 LimitationConvention for all mutual ships entered in the Group clubs.
Group Reinsurance Structure 2010 Policy Year
International Group of P&I AssociationsGeneral Excess of Loss Reinsurance Contract Structurefor Owned Entries (including Overspill Protection, HydraParticipation, Pooling and Individual Club Retentions).
43
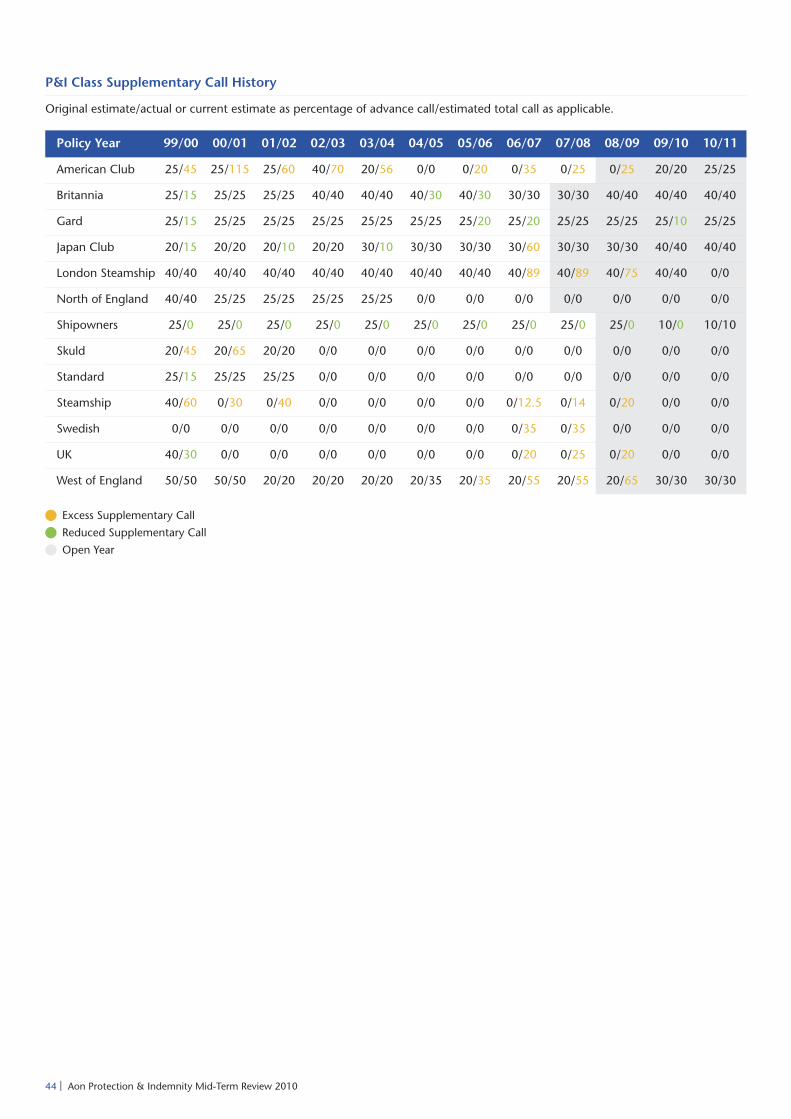
P&I Class Supplementary Call History
Original estimate/actual or current estimate as percentage of advance call/estimated total call as applicable.
Excess Supplementary Call
Reduced Supplementary Call
Open Year
Policy Year 99/00 00/01 01/02 02/03 03/04 04/05 05/06 06/07 07/08 08/09 09/10 10/11
American Club 25/45 25/115 25/60 40/70 20/56 0/0 0/20 0/35 0/25 0/25 20/20 25/25
Britannia 25/15 25/25 25/25 40/40 40/40 40/30 40/30 30/30 30/30 40/40 40/40 40/40
Gard 25/15 25/25 25/25 25/25 25/25 25/25 25/20 25/20 25/25 25/25 25/10 25/25
Japan Club 20/15 20/20 20/10 20/20 30/10 30/30 30/30 30/60 30/30 30/30 40/40 40/40
London Steamship 40/40 40/40 40/40 40/40 40/40 40/40 40/40 40/89 40/89 40/75 40/40 0/0
North of England 40/40 25/25 25/25 25/25 25/25 0/0 0/0 0/0 0/0 0/0 0/0 0/0
Shipowners 25/0 25/0 25/0 25/0 25/0 25/0 25/0 25/0 25/0 25/0 10/0 10/10
Skuld 20/45 20/65 20/20 0/0 0/0 0/0 0/0 0/0 0/0 0/0 0/0 0/0
Standard 25/15 25/25 25/25 0/0 0/0 0/0 0/0 0/0 0/0 0/0 0/0 0/0
Steamship 40/60 0/30 0/40 0/0 0/0 0/0 0/0 0/12.5 0/14 0/20 0/0 0/0
Swedish 0/0 0/0 0/0 0/0 0/0 0/0 0/0 0/35 0/35 0/0 0/0 0/0
UK 40/30 0/0 0/0 0/0 0/0 0/0 0/0 0/20 0/25 0/20 0/0 0/0
West of England 50/50 50/50 20/20 20/20 20/20 20/35 20/35 20/55 20/55 20/65 30/30 30/30
44 | Aon Protection & Indemnity Mid-Term Review 2010
P&I Class General Increase History
Percentage of advance call/estimated total call as applicable including any change in budgeted supplementary call estimate.
Policy Year 99 00 01 02 03 04 05 06 07 08 09 10
American Club 5 5 10 26 25 17.5 10 10 10 20 29.0 4.16
Britannia 0 0 10 28.8 15 8.5 7.5 2.5 5 23.8 12.5 5
Gard -3.85 5 10 25 15 7.5 5 7.5 5 10 15.0 0
Japan Club 0 0 0 0 10 0 0 0 10 20 21.1 12.5
London Steamship 5 5 10 27.5 25 15 12.5 12.5 7.5 17.5 15.0 5
North of England 5 5 10 25 25 17.5 12.5 7.5 7.5 17.5 17.5 5
Shipowners 0 0 0 20 15 0 0 0 5 15 10.0 5
Skuld 5 0 10 30 25 15 7.5 5 2.5 7.5 15.0 5
Standard 0 0 7.5 2.5 25 20 12.5 5 5 15 15.0 3
Steamship 0 5 10 25 25 20 12.5 5 9 15 17.5 5
Swedish 0 0 7.5 25 25 15 10 10 7.5 15 15.0 2.5
UK 5 0 7.5 20 25 17.5 12.5 12.5 7.5 17.5 12.5 5
West of England 5 5 5 10 25 15 12.5 12.5 5 15 19.2 5
45

46 | Aon Protection & Indemnity Mid-Term Review 2010
Specialist Markets
British Marine 48Navigators 49Osprey 50RaetsMarine 51
Commentary on individual insurers has been supplied by the insurers themselves.
47
British MarineBritish Marine, Plantation Place30 Fenchurch Street, London EC3M 3BD, UK
www.british-marine.comTel: +44 (0)20 7488 1024
Now fully integrated within QBE Marine & Energy, British Marine continues to offer fixed cost insurance whilst maintaining theservice ethos of the mutual insurance industry. Premium income grew to US$131 million on a written gross tonnage of 13.52 millionacross 10,945 insured vessels.
Insured GT by Vessel Type Insured GT by Region
Northern Europe
Southern Europe
Far East
Eastern Europe
Middle East
Indian Sub-Continent
Scandinavia
North America
South America
Caribbean & C. America
African Continent
Australasia & Pacific
General cargo
Bulkers
Tugs/Utility
Unitised
Passenger/Miscellaneous
Smoothwater
Tankers
Fishing
Yachts
Dredgers
They Say
British Marine enjoyed another strong renewal at 20th February 2010,yet again highlighting the confidence that they enjoy in the marketplace.
Key highlights were:
• A 96% retention ratio on the renewing portfolio.
• A 3.5% increase in rating on the renewing portfolio.
• A further 13.5% increase in premium generated at the 20th February renewalfrom 60 new shipowner clients to British Marine.
• Continued support from within the existing client base, as 15 owners increasedtheir fleet share.
After 32 years in Walsingham House British Marine has moved to the QBE EuropeHeadquarters in nearby Plantation Place, where they are now installed in their ownunderwriting space alongside colleagues from QBE’s Marine and Energy Division.British’s Marine’s message firmly remains that it’s business as usual.
S&P Rating
Effective Date July 2010Rating A+
48 | Aon Protection & Indemnity Mid-Term Review 2010
NavigatorsNavigators P&I, 7th floor, 2 Minster CourtMincing Lane, London EC3R 7BB, UK
www.navg.comTel: +44 (0)20 7220 6900
They Say
Navigators P&I provides to Owners/Managers/Operators and Time Charterers,unrivalled expertise necessary to protect against or minimise disruption to operationof their commercial ships and promptly delivers funds to indemnify them in eventof loss they have become liable to others arising from such shipping operations.
We continue to offer a US$50 million limit with an option to increase this toUS$100 million in selective circumstances. We continue to concentrate on vesselsnot exceeding 10,000 GT and that do not trade Trans-Atlantic or Trans-Pacific.
Being part of a large international marine insurer, Navigators P&I is in an advantageous position of being able to offer overallmarine packages to include P&I for operators involved in other types of marine activities. Insuring around 3,000 vessels theestimated premium income of Navigators is approximately US$25 million.
Insured GT by Vessel Type Insured GT by Region
Europe
Pacific Rim
Middle East
Latin America
North America
Eastern Europe
General cargo
Tankers
Bulkers
Tugs and barge
Supply/Offshore
Fishing Vessel
Other
S&P Rating
Effective Date July 2010Rating A
49

OspreyOsprey Underwriting Agency Limited, Asia House31-33 Lime Street, London EC3M 7HT, UK
www.osprey-uwr.co.ukTel: +44 (0)20 7283 1277
They Say
Established in 1991, Osprey’s proud longevity has been underpinned by stablesecurity and a service-focused, innovative underwriting and claims handling platform.The Agency writes a worldwide account but has unique expertise as providers ofUS primary P&I insurance.
Against a backdrop of worldwide economic uncertainty the Agency has continuedto write profitably and has achieved an overall account growth of 10% over the last12 months highlighting the excellent service and security which the Agency provides.
Osprey provides P&I coverage to owners of smaller craft and vessels, now up to 25,000 gross tons, on a fixed limit, fixed premiumbasis via various Lloyd’s syndicates and currently insures approximately 2,400 vessels with an estimated premium income in excessof US$30 million.
Insured GT by Vessel Type Insured GT by Region
USA
Europe
Asia
South America
Caribbean
Middle East
Rest of the World
Tug and barge
Fishing vessels
Craft
Miscellaneous
Passenger
Dry cargo
Dredgers
S&P Rating
Effective Date July 2010Rating A+
50 | Aon Protection & Indemnity Mid-Term Review 2010

RaetsMarineRaetsMarine Insurance BV, Fascinatio Boulevard 6222909 Va Capelle A/D Ijssel, The Netherlands
www.raetsmarine.comTel: +311024 25000
They Say
We offer a comprehensive P&I package at fixed premiums, which can be tailor madeto suit the needs of every type of Shipowner, no matter how small. As a niche playerwe target Shipowners with vessels up to 10,000 GT and any other non-cargo carryingvessels, such as specialist crafts, yachts, fishing vessels, tugs and supply vessels operatingat sea or in ports. Trading limits are restricted to no USA, no Trans-Atlantic and noTrans-Pacific voyages; there are no restrictions to age and singletons will be quoted.
We provide a full range of “club type” services. We have in house claims handlerswith both shipping and legal backgrounds, we have a world-wide network ofcorrespondents for local emergencies and we have offices in Paris and Singapore,enabling us to respond to any local needs, speaking the language of the clientsand bridging the gap of major time differences.
Insured GT by Vessel Type Insured GT by Region
Asia Pacific
Central & South America
Europe
Middle East/India
Bulk carrier
Fishing vessels
General cargo
Workboat
Tug
Yacht
General barges
Multi-purpose vessels
Passenger vessels
Others
S&P Rating
Effective Date July 2010Rating A-
RaetsMarine, first established in 1999 as a P&I facility, is now backed by Amlin Corporate Insurance N.V. (ACI). RaetsMarinecontinues to operate as a niche, specialist marine insurer with a head office in Rotterdam and branch offices in Paris, London andSingapore. The anticipated premium income for the year is US$35 million on 4,100 insured vessels with an approximate grosstonnage of 6 million.
51
Aon Analytics provides clients with forward-looking business intelligence,comprehensive benchmarking and total cost of risk analysis as well as globalmarket insights using proprietary technology like the Aon Global Risk InsightPlatform to enable more informed and fact-based decision making around riskmanagement, risk retention and risk transfer goals and objectives.
Aon Global Risk Insight Platform is the world’s leading global repository of global riskand insurance placement information. By providing fact-based insights into Aon’sUS$54 billion in global premium flow, Aon GRIP helps identify the best placementoption regardless of size, industry, coverage line or geography.
The web-accessible data produced by Aon GRIP helps Aon brokers evaluate whichmarkets to approach with a placement and which carriers may provide the best valuefor clients. It also helps Aon brokers to negotiate from a position of strength, makingsure every conversation is based on the most complete, most current set of facts.
52 | Aon Protection & Indemnity Mid-Term Review 2010
Further Information
Aon Analytics
Aon Global Risk Insight Platform (Aon GRIPSM)
Whilst care has been taken in the production of this report and the informationcontained within, Aon does not make any representation as to the accuracy of thereport and accepts no liability for any loss incurred by any person who may rely on it.In any case, the recipient shall be entirely responsible for their use of this report.
For further information, contact:
Steve Griffiths+44 (0)20 7086 [email protected]
Media and press enquiries
David Skapinker+44 (0)20 7505 [email protected]
Contacts


Aon Limited
8 Devonshire Square
London
EC2M 4PL
Tel: +44 (0)20 7086 5500
Fax: +44 (0)20 7621 1511
www.aon.co.uk
Published by Aon Limited
Registered office 8 Devonshire Square, London EC2M 4PL
© Copyright Aon Limited 2010. All rights reserved.
No part of this publication may be reproduced, stored in a retrieval
system, or transmitted in any way or by any means, including
photocopying or recording, without the written permission of the
copyright holder, application for which should be addressed to the
copyright holder.
Aon Limited is authorised and regulated by the Financial Services
Authority in respect of insurance mediation activities only.
RH 4591 - 10.10 - ADWORKS DESIGN - FP Ref: 6311