prospects, challenges and trends in the global ammonia market · • key market developments:...
TRANSCRIPT

Prospects, challenges and trends in the global ammonia market
Georgy Eliseev Fertecon | Agribusiness intelligence

Transformation: A New Era for the Agri-nutrients Industry
Fertecon is now part of IHS Markit Fertecon | Agribusiness intelligence
“The Informa Agribusiness Intelligence portfolio is a clear extension of our Chemical and Downstream businesses and builds our existing
data, pricing, insights, forecasting and news services within our Resources segment. Agriculture is the largest end chemical market in the
world and this transaction expands our capabilities into fertilizers and chemical crop protection, while substantively expanding our capabilities
in biofuels.”
Lance Uggla, CEO of IHS Markit
As of 1 July 2019, Agribusiness Intelligence joined IHS Markit in its Energy & Natural Resources division
UpstreamOil Markets,
Midstream &
DownstreamGas, Power
& Energy
FuturesChemical
and gas
feedstocks
Agribusiness
Intelligence
Agribusiness Intelligence offers
breadth and depth across the
agribusiness value chain:
• Fertilizers
• Crop Protection
• Policy
• Food Commodities
• Animal Health 2

Agenda
Fertecon | Agribusiness intelligence
• Key market developments: 2018-2019
• Key drivers for ammonia demand
• Ammonia cost curve and competitiveness
• Global ammonia trade and trade flows
• Capacity growth in 2014 – 2019 and Outlook to 2025
• New capacity changes trade flows:
• USA
• Russia
• Indonesia
• Overview of industrial demand segment
• Overview of phosphate segment
• Risks and outlook for ammonia trade
3

Transformation: A New Era for the Agri-nutrients Industry
Key market developments: 2018-2019Fertecon | Agribusiness intelligence
Source: Fertecon
0
20
40
60
80
100
120
140
160
180
200
220
240
260
280
300
320
340
360
380
Anmmonia FOB MiddleEast (Left Axis)
Urea FOB Middle East(Left Axis)
Oil Brent $/bbl (RightAxis)
Corn CBOT $/t (RightAxis)
Aug. 18 - Aug. 19$ $
-33%
-4%
-18%
+16%
• Ammonia prices have recently fallen below
the prices of other commodities
• Ammonia prices continuously decrease from
Sep. 2018
• Unlike urea prices, ammonia prices did not
recover in spring 2019
2018 – 2019 Prices for Selected Commodities
4

Transformation: A New Era for the Agri-nutrients Industry
Urea breaks away from ammonia
-100
-50
0
50
100
150
200
250
300
350
400
Urea Production Margin Ammonia FOB Middle East Urea FOB Middle East
Fertecon | Agribusiness intelligence
Source: Fertecon
$
Note: Urea production (upgrade) margin is calculated at 0.58 t of ammonia per 1 t of urea and after deduction
of processing costs per t of urea. Source: Fertecon cost model.
The highest level of
margins since 2012
• Ammonia - urea price
difference reaches record
high
• The urea production margin
(how much producer earns
more if convert ammonia in 1
t of urea) has been positive
since the end of 2017 (no
market self-regulation)
• The urea production margin
has reached the highest level
since 2012
• Why integrated producers do
not swing to urea?
Market self-regulation
Ammonia and Urea Prices, Urea Production Margin, 2016 - 2019
5

Transformation: A New Era for the Agri-nutrients Industry
Key drivers of ammonia demand
for fert urea45%
for non-fert urea9%
for fert AN8%
for non-fert AN4%
for CAN3%
for industrial7%
for DAP/MAP
6%
for NPK/NP8%
for AS4%
for D.A.3%
for other ferts3%
Ammonia demand by end use, 2018 Ammonia export by end use, 2018
Fertecon | Agribusiness intelligence
Source: Fertecon
• Global ammonia demand is
dominated by urea production
– 54%
• Not all integrated
ammonia/urea producers are
flexible to swing from
merchant ammonia to urea or
vice versa
• Some older technology
integrated plant always
produce merchant ammonia
along with urea (CO2
balance)
• Ammonia merchant market is
dominated by industrial
applications and
Phosphates/NPK.
for industrial40%
for MAP/DAP/NPK
39%
for AN/CAN
11%
for D.A.6%
Other/Unknown4%
Caprolactam
Acrylonitrile
MDI/TDI
Aniline
MMA
Adipic acid
Nitrobenzene
Ethanolamine
etc.
AN,
including
non-fert
100% = 179 million tonnes 100% = 19.0 million tonnes
Note: D.A. = direct application
6

Transformation: A New Era for the Agri-nutrients Industry
0
2
4
6
8
10
12
14
16
J F M A M J J A S O N D J F M A M J J A S O N D J F M A M J J A S O N D J F M A M J J A S O N D
2016 2017 2018 2019
Energy Prices Gazprom Average Sales Price (Europeand other markets, including LNG)
Spot TTF Netherlands
Henry Hub, USA
Oil Brent (in mmbtu equivalent)
Feedstock pricesFertecon | Agribusiness intelligence
Sources: Fertecon, Gazprom, IHS Markit, EIA
• Natural gas prices are still at low
levels
• Recently, soft winter and LNG
inflow have pushed the European
spot gas prices down
• Contract gas prices in Europe (LT
contracts from Russia and other
sources) are following the track of
spot prices
$/mmbtu
7

Transformation: A New Era for the Agri-nutrients Industry
Global costs curve becomes lowerFertecon | Agribusiness intelligence
Ammonia exporters cost curve, 2018 respect to 2014
Source: Fertecon
2014 Cost Curve
• Lower gas prices round
the world since 2014
have reduced ammonia
costs
• The global cost curve
became lower and flatter
• This change has not
affected low-cost
producers (Middle East,
North Africa, Russia,
North America)
• However, high-cost
producers have become
more competitive
• High-cost (marginal)
producers can afford
producing at lower
ammonia prices
Source: Fertecon
8

Transformation: A New Era for the Agri-nutrients Industry
Costs: cfr EuropeFertecon | Agribusiness intelligence
147 147
251
300329 342 348 359
472506
537569
0
100
200
300
400
500
600
700
Lybia Algeria Egypt USA Belarus Trinidad Russia EU spotgas
Ukraine EUcontract
gas
Turkey Serbia
2014
Gas Costs Other Plant Costs Domestic Transportation Freight Duty Delivery Cost NW Europe cfr
183 183
225 230248 255 257
273
329 337
376 390
0
100
200
300
400
500
600
700
Algeria Lybia USA Trinidad Belarus EU spotgas
Russia Egypt Ukraine EUcontract
gas
Turkey Serbia
2019
Source: Fertecon
cfr NW Europe Year Average $592
cfr NW Europe 8m Average $338
9

Transformation: A New Era for the Agri-nutrients Industry
Trade flowsFertecon | Agribusiness intelligence
Source: Fertecon
Canada to US (1.0)
LA to US (2.1)
US to LA (0.5)
LA to Asia (0.4)
LA to Africa (0.4)
LA to Europe (0.4)
Eurasia to Europe (2.1)
Eurasia to Africa (1.1)
Africa to Europe (1.4)
ME to Europe (0.1)
Eurasia to Asia (0.4)ME to Asia (3.2)
Latin America Intra-Regional
LA to Asia (0.4)
Eurasia Intra-Regional
Europe Intra-Regional
Asia/Oceania Intra-Regional
Baltic
Yuzhny
1.6
0.9
2.3
0.6
West from Suez East from Suez
~1.2 mt
Africa to Asia (0.4)
• Global Ammonia Trade ~ 19
million tonnes, Sea Trade –
16.6 million tonnes
• Market “West of Suez”
accounts for almost 2/3 of
global market
• Market “East of Suez” is fast
growing
• West has traditional surplus
and East has traditional
shortage, West – East net
transfer is ~1.2 million tonnes
• Trade flows are stable with
special infrastructure in place
and long-term contracts
10

Transformation: A New Era for the Agri-nutrients Industry
Ammonia Demand: East and WestFertecon | Agribusiness intelligence
Source: Fertecon
11

Transformation: A New Era for the Agri-nutrients Industry
Capacity additions peak in 2016-2019
-
100
200
300
400
500
600
0
2
4
6
8
10
12
2009 2010 2011 2012 2013 2014 2015 2016 2017 2018 2019 2020F 2021F 2022F 2023F 2024F
Capacity Additions, million t
Total Total (excl. China) Merchant Ammonia FOB Middle East (annual average)
Fertecon | Agribusiness intelligence
Source: Fertecon
• Prices at >$500 in 2011-2014
• Wave of investments in 2011-
2015
• Commissioning peak in 2015-
2018
• Capacity ramping up in 2017-
2019
• Most of new capacity additions
in 2016-2019 – outside China
• Over 7 million tons of merchant
ammonia new capacity in 2016-
2019
• Not many new projects in 2020
– 2024 (but long list of “possible’
projects
• Only one merchant ammonia
unit expected in 2020 – 2021 in
Oman.
12
Transformation: A New Era for the Agri-nutrients Industry
New projects after 2018Fertecon | Agribusiness intelligence
Source: Fertecon
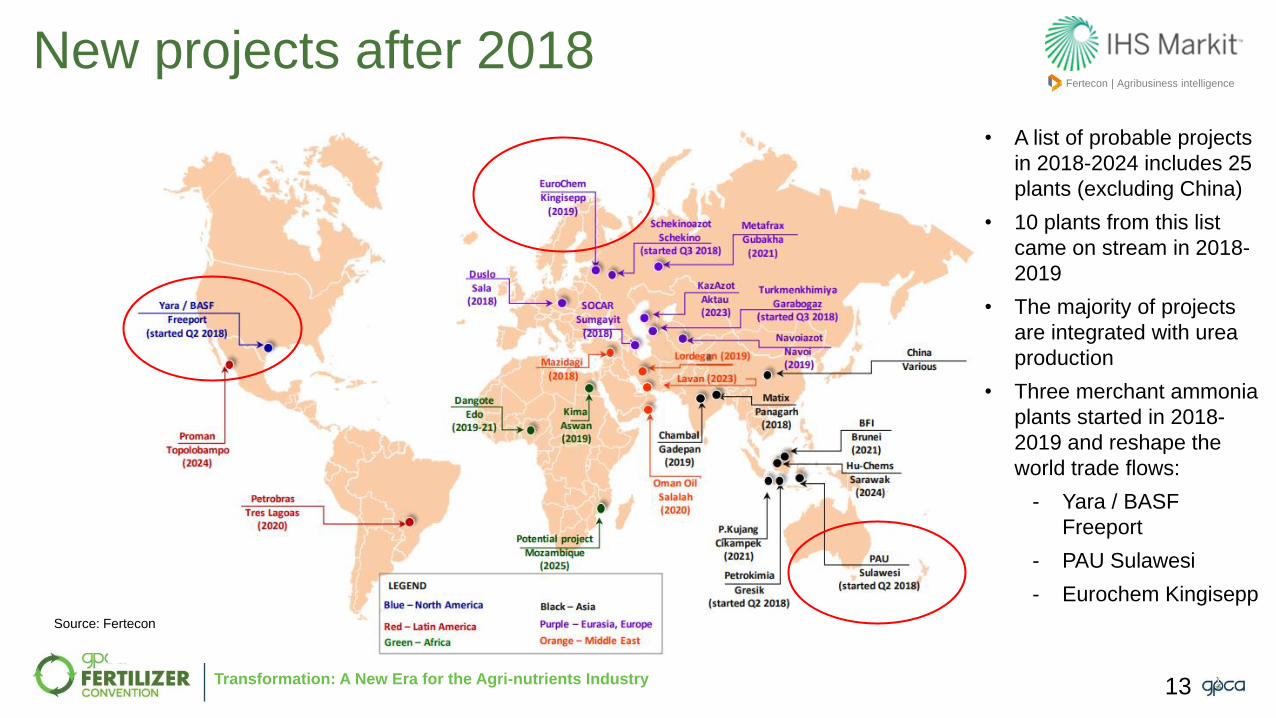
• A list of probable projects
in 2018-2024 includes 25
plants (excluding China)
• 10 plants from this list
came on stream in 2018-
2019
• The majority of projects
are integrated with urea
production
• Three merchant ammonia
plants started in 2018-
2019 and reshape the
world trade flows:
- Yara / BASF
Freeport
- PAU Sulawesi
- Eurochem Kingisepp
13
Transformation: A New Era for the Agri-nutrients Industry
Fertecon | Agribusiness intelligence
Focus on USA
New Mexico
Texas
Oklahoma
Louisiana
ArkansasGeorgia
Florida
Tennessee
South Carolina
Mississippi
Alabama
North Carolina
Washington
Oregon
California
Idaho
Montana
Nevada
Arizona
Colorado
Wyoming
North Dakota
South Dakota
Nebraska
Kansas Missouri
Minnesota
Wisconsin
Indiana
Kentucky
Ohio
Utah
Michigan
Illinois
Iowa
CF IndustriesDonaldsonville
(started Q3 2016)
Incitec / DynoWaggaman
(started Q3 2016)
OCIWever
(started Q2 2017)
CF IndustriesPort Neal
(started Q4 2016)
SimplotRock Springs
(started Q3 2017)
US NitrogenGreene (2016)
LSB industriesEl Dorado
(started Q2 2016)
Yara / BASFFreeport
(started Q2 2018)
FortigenGeneva (completed Q4 2017)
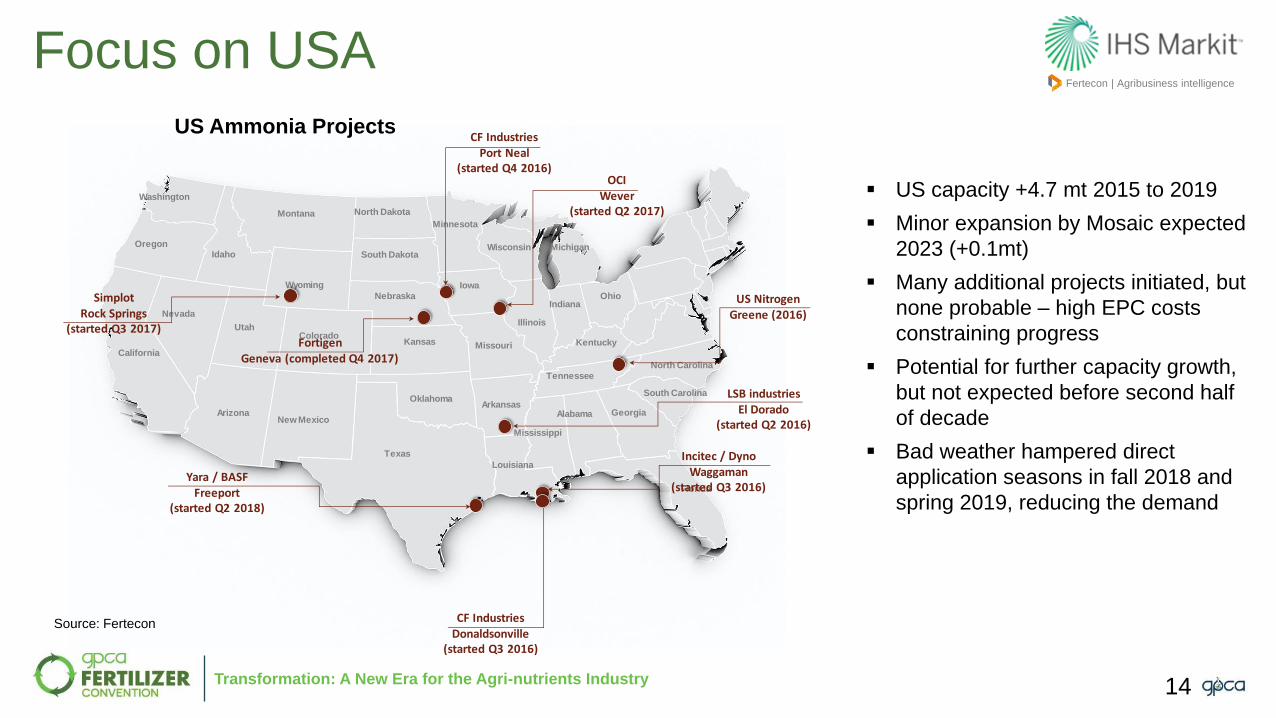
US capacity +4.7 mt 2015 to 2019
Minor expansion by Mosaic expected
2023 (+0.1mt)
Many additional projects initiated, but
none probable – high EPC costs
constraining progress
Potential for further capacity growth,
but not expected before second half
of decade
Bad weather hampered direct
application seasons in fall 2018 and
spring 2019, reducing the demand
US Ammonia Projects
Source: Fertecon
14

Transformation: A New Era for the Agri-nutrients Industry
USA: import substitutionFertecon | Agribusiness intelligence
3,772 3,890
3,160
2,446
1,947
891
-
500
1,000
1,500
2,000
2,500
3,000
3,500
4,000
4,500
2014 2015 2016 2017 2018 2019 7m
US Offshore Ammonia Imports
Texas Florida Louisiana Pacific Total
-50%
DAP/NPK
LA
Tampa, FLTX
973
323
492
Incitec / Dyno, Waggaman,
LA 0.726 mt (Q3 2016)
LSB Industries / El Dorado,
AK 0.340 mt (Q2 2016)
CF Industries, Donaldsonville, LA
1.1 mt, 0.166 merchant (Q3 2016)
CF – Mosaic agreement to supply
0.725 mt since 2017
MS
Yara/BASF, Freeport, TX 0.726 mt (Q2 2018)
Chemicals
Fertilizers,
Chemicals
Imports in 2018
Source: IHS Markit, Fertecon
new projects
Import flows
000’t
000’t
Note: in metric tonnes
15

Transformation: A New Era for the Agri-nutrients Industry
6,742 6,8116,295 6,032
5,046 5,2504,668
3,7633,079
1,241
-
1,000
2,000
3,000
4,000
5,000
6,000
7,000
8,000
2010 2011 2012 2013 2014 2015 2016 2017 2018 2019 H1
USA Ammonia Import
Trinidad Canada Latin America Ukraine and Russia Middle East Others Total
Fertecon | Agribusiness intelligence
USA: from import to export
44 32 38
241 135 113
222
744
358
168
-
500
1,000
2010 2011 2012 2013 2014 2015 2016 2017 2018 2019 H1
USA Ammonia Export CF-Mosaic
Line starts
Source: IHS Markit
Source: IHS Markit
16.4 16.0
18.7 3.1
0.4
Capacity Production Import Export ApparentConsumption
USA Ammonia Production, Export, Import and Apparent Consumption,
2018, million t
10.910.1
6.7 16.8
2018
2010
Source: IHS Markit, Fertecon
000’t
000’t
16

Transformation: A New Era for the Agri-nutrients Industry
Fertecon | Agribusiness intelligence
Trinidad looks for new markets
5.355
4.644 4.6584.321 4.333 4.267 4.507 4.472
4.104
1.132
0
1
2
3
4
5
6
2010 2011 2012 2013 2014 2015 2016 2017 2018 Q1 2019
Trinidad & Tobago Ammonia Export, million t
USA Latin America Europe Asia & Australia Africa
83% 81% 81%80% 78% 77%
69% 56%48%
39%
X% Share of USA in Trinidad’s Export
Source: IHS Markit
Trinidad & Tobago
New Markets for Trinidad
ammonia
• Trinidad & Tobago (T&T) ammonia
faces competition with new capacity
in the US
• The share of USA in T&T export
shrinks from >80% to <50%
• Competition with US supply in LA
markets: Mexico and Chile
• Growing Morocco import absorbs a
part of T&T export
• T&T expand to Europe (contract in
Belgium, eventual sales to Finland,
Turkey) and Asia
• Gas curtailment in Trinidad seem
already overcome
Million t
Source: IHS Markit, Fertecon
17

Transformation: A New Era for the Agri-nutrients Industry
Focus on Russia: KingiseppFertecon | Agribusiness intelligence
Russian Export to NW
Europe (LT contracts Acron
and Uralchem) 2018: 800 kt
Russian Railway Export to
Lithuania (to Eurochem Liphosa
Phosphate plant) 2018: 160 kt
Russian Railway Supply of
Eurochem Phosphorite
Kingisepp Plant 2018: ~130 kt
Russian Export to Belgium
through Yuzhny, 2018: 383 kt
Eurochem becomes 3rd
Russian contract supplier
to NW Europe
• Successful start up of a new plant in March 2019
• ~60,000 t per month of maritime exports, 8,000 t
railway export to Lithuania (May 2019)
• Eurochem new plant mainly supplies ammonia to
Eurochem’s fertilizer plants in Russia, Belgium
and Lithuania, but replaces purchased merchant
ammonia
• New contract supplier of ammonia to NW Europe
Eurochem Kingisepp
NH3 capacity 0.89 mt
115 kt in H1 2019
Eurochem Lifosa (NH3
requirement ~0.2 mt)
Eurochem Antwerp (NH3
requirement 0.2-0.3 mt)
300-500 kt in 2016-2018 0
20
40
60
80
100
120
140
Jan
Feb
Mar
Ap
rM
ay
Jun
Jul
Au
gS
ep
Oct
Nov
Dec
Jan
Feb
Mar
Ap
rM
ay
June
July
Au
gS
ep
Oct
Nov
Dec
Jan
Feb
Mar
Ap
rM
ay
Jun
Jul
Au
gS
ep
Oct
Nov
Dec
Jan
Feb
Mar
Ap
rM
ay
Jun
Jul
Au
g
2016 2017 2018 2019
Export of Ammonia from Baltic Ports
2016: 758 kt
2017: 855 kt 2018: 840 kt2019 8m: 867 kt
Source: Fertecon
18
Transformation: A New Era for the Agri-nutrients Industry
New markets for Yuzhny suppliersFertecon | Agribusiness intelligence
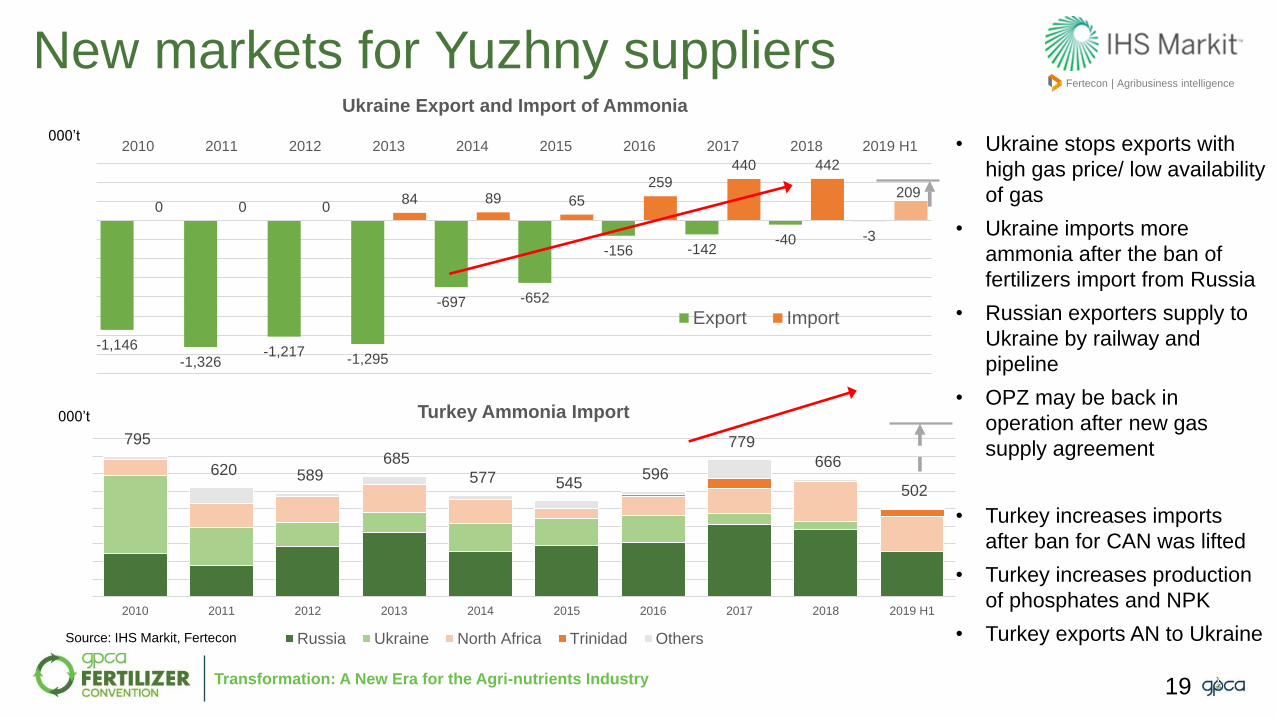
795
620 589 685
577 545 596
779
666
502
2010 2011 2012 2013 2014 2015 2016 2017 2018 2019 H1
Turkey Ammonia Import
Russia Ukraine North Africa Trinidad Others Total
-1,146
-1,326-1,217
-1,295
-697 -652
-156 -142-40 -3
0 0 084 89 65
259
440 442
209
2010 2011 2012 2013 2014 2015 2016 2017 2018 2019 H1
Ukraine Export and Import of Ammonia
Export Import
• Ukraine stops exports with
high gas price/ low availability
of gas
• Ukraine imports more
ammonia after the ban of
fertilizers import from Russia
• Russian exporters supply to
Ukraine by railway and
pipeline
• OPZ may be back in
operation after new gas
supply agreement
• Turkey increases imports
after ban for CAN was lifted
• Turkey increases production
of phosphates and NPK
• Turkey exports AN to Ukraine
000’t
000’t
Source: IHS Markit, Fertecon
19
Transformation: A New Era for the Agri-nutrients Industry
Focus on Asia: PAUFertecon | Agribusiness intelligence
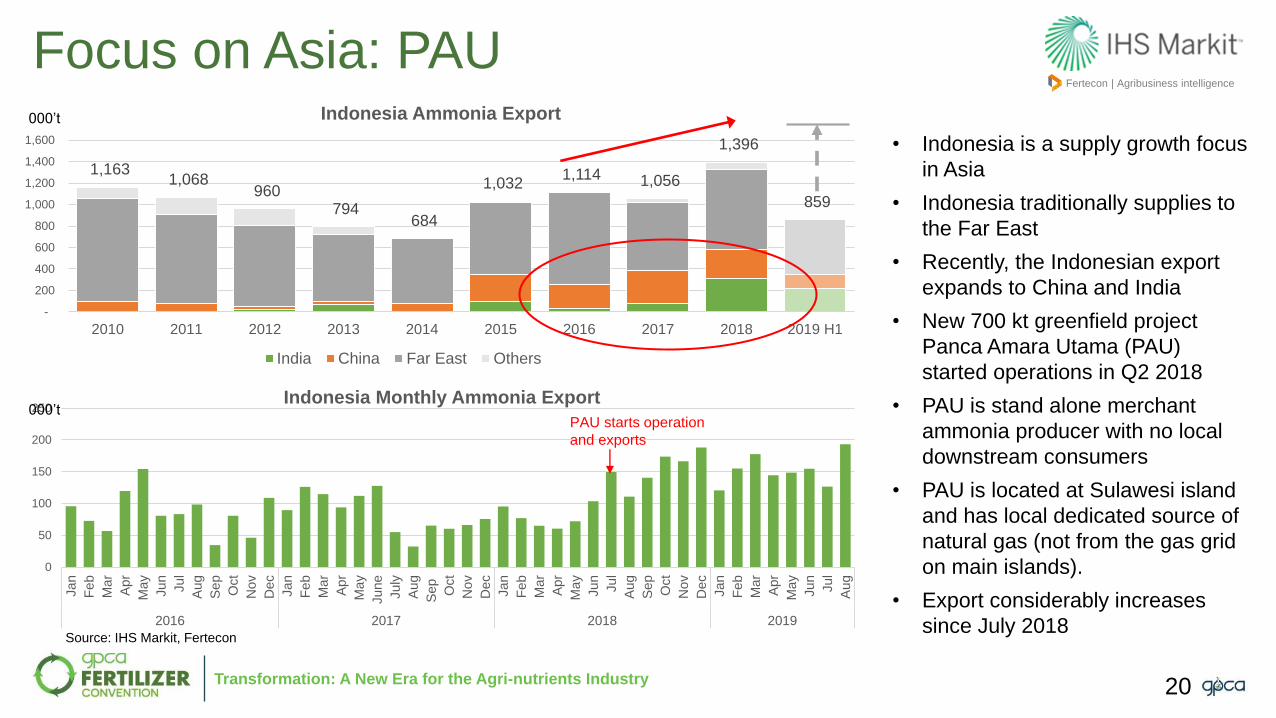
1,163 1,068
960 794
684
1,032 1,114 1,056
1,396
859
-
200
400
600
800
1,000
1,200
1,400
1,600
2010 2011 2012 2013 2014 2015 2016 2017 2018 2019 H1
Indonesia Ammonia Export
India China Far East Others Series5
0
50
100
150
200
250
Ja
n
Fe
b
Ma
r
Ap
r
Ma
y
Ju
n
Ju
l
Au
g
Se
p
Oct
No
v
De
c
Ja
n
Fe
b
Ma
r
Ap
r
Ma
y
Ju
ne
Ju
ly
Au
g
Se
p
Oct
No
v
De
c
Ja
n
Fe
b
Ma
r
Ap
r
Ma
y
Ju
n
Ju
l
Au
g
Se
p
Oct
No
v
De
c
Ja
n
Fe
b
Ma
r
Ap
r
Ma
y
Ju
n
Ju
l
Au
g
2016 2017 2018 2019
Indonesia Monthly Ammonia Export
• Indonesia is a supply growth focus
in Asia
• Indonesia traditionally supplies to
the Far East
• Recently, the Indonesian export
expands to China and India
• New 700 kt greenfield project
Panca Amara Utama (PAU)
started operations in Q2 2018
• PAU is stand alone merchant
ammonia producer with no local
downstream consumers
• PAU is located at Sulawesi island
and has local dedicated source of
natural gas (not from the gas grid
on main islands).
• Export considerably increases
since July 2018
000’t
000’tPAU starts operation
and exports
Source: IHS Markit, Fertecon
20

Transformation: A New Era for the Agri-nutrients Industry
Far East Markets: Industrial Segment Fertecon | Agribusiness intelligence
• Far East merchant ammonia
markets are dominated by
industrial ammonia
applications
• Main markets: caprolactam
and acrylonitrile, are affected
by China – US trade dispute
and general industrial
slowdown in China
• Industrial applications of urea
(resins) and AN (mining) have
also slowed down
• Demand is supported by
environmental segment
(ammonia and urea for
deNOx)
$/t
1,000
1,200
1,400
1,600
1,800
2,000
2,200
2,400
Caprolactam and Acrylonitrile Prices, 2018-2019
Acrylonitrile Asia/Far East imports Caprolactam Asia Spot
Source: IHS Markit
21

Transformation: A New Era for the Agri-nutrients Industry
China increases importFertecon | Agribusiness intelligence
291 288 340 293
203
396 465
719
933
630
-
200
400
600
800
1,000
2010 2011 2012 2013 2014 2015 2016 2017 2018 2019 7m
China Ammonia imports
Indonesia Middle Eeast Trinidad Others Total
NanjingCaojing
Zhanjiang
Dafeng
306
161
425
Chinese Ammonia Terminals
2018 import (port
line-up), 000’t
SK Chemicals (new terminal,
first delivery in Sep. 2019)
BASF
Bayer
Huntsman
Sinopec
Lucite
Shanghai Secco
Akzo-Nobel
Fibrant
BASF-YPC
Zhanhua Phosphates
BASF
000’t
• China reduces ammonia capacity in line with restructuring of the industry
(closure of smaller and older plants), adjusting to slow demand growth (“0
growth” policy of fertilizer consumption).
• Import of ammonia has grown up in 2016-2018 with 3 main import terminals.
• Main consumers of import ammonia are the local JVs of international
chemical companies.
• In 2019 import slows down with more merchant ammonia available in the
country (due to weak domestic fertilizer markets).
• More than 50% of import comes from Middle East.
• Risks of US-China trade conflict.
Source: IHS Markit, Fertecon22

Transformation: A New Era for the Agri-nutrients Industry
Far East slows down Fertecon | Agribusiness intelligence
2,162 2,067 2,123 2,123 2,0331,838
2,0412,231
2,378
1,136
0
500
1,000
1,500
2,000
2,500
2010 2011 2012 2013 2014 2015 2016 2017 2018 2019 H1
Far East Import of Ammonia
South Korea Taiwan Japan Series4
2,162 2,067 2,123 2,123 2,0331,838
2,0412,231
2,378
1,136
0
500
1,000
1,500
2,000
2,500
2010 2011 2012 2013 2014 2015 2016 2017 2018 2019 H1
Far East Sources of Imported Ammonia
Middle East Indonesia and Malaysia Australia Trinidad Others
• South Korea, Taiwan and Japan have
increased import in 2016-2018 by 7-
10% pa.
• Like in China, main consumers of
imported ammonia are in chemical
industry.
• The industrial slowdown in 2019 affects
the ammonia import in far East: no
growth expected in 2019.
• About half of imports come from Middle
East, followed by Indonesia and
Malaysia.
• Competition with ammonia from other
regions (Trinidad, Indonesia, Yuzhny,
USA) is strengthening.
000’t
000’t
Source: IHS Markit, Fertecon
23

Transformation: A New Era for the Agri-nutrients Industry
Weakness in phosphate segmentFertecon | Agribusiness intelligence
547 716
547 647
808 824
1,041
1,447 1,445
659
-
200
400
600
800
1,000
1,200
1,400
1,600
2010 2011 2012 2013 2014 2015 2016 2017 2018 2019 5m
Morocco Ammonia Import
Russia and Ukraine Trinidad North Africa Others Total
100
150
200
250
300
350
400
450
Ammonia and DAP Prices
Ammonia FOB Middle East
DAP FOB Saudi Arabia
• Phosphate fertilizer industry has
had smooth growth in 2016 – 2018
despite growing overcapacity.
• Top producers managed to limit the
excess supply by lower operating
rates and closures of less efficient
operations.
• However, in 2019 the oversupply
finally affected MAP/DAP/NPK
markets.
• The announced reduction of
Chinese output could not yet stop
the decrease of prices.
• Morocco is the fast growing
importer of ammonia for the
expanding phosphate granulation
capacity
• In 2019 Morocco slows down
because of depressed
MAP/DAP/NPK markets.
000’t
$/t
Source: IHS Markit, Fertecon
24

Transformation: A New Era for the Agri-nutrients Industry
Focus on India
1,661
2,171 2,036
1,935 2,005 2,150
2,304 2,341
2,592
1,407
-
500
1,000
1,500
2,000
2,500
3,000
2010 2011 2012 2013 2014 2015 2016 2017 20182019 H1
India Ammonia Imports, 000’t Other Middle East &North Africa
Iran
Indonesia & Malaysia
Russia & Ukraine
Turkey
Others
Total
Fertecon | Agribusiness intelligence
Kandla
SikkaDahej
Mumbai
Goa
Mangalore
Paradeep
Ennore
Cochin
Tuticorin
Kakinada
Vizag
Haldia259
176
111
234
72
69
187133
44
324
188
664
65
Ammonia import to
India, 2018
• India uses imported ammonia for DAP/NP/NPK production.
• Ammonia import grows since 2013.
• Indian P nutrient requirements are covered by import of DAP/NP/NPK, or
by producing phosphates from the imported Phosphatic acid, or from the
imported Phosphorite Rock. Decision is made upon the prices for
DAP/NP/NPK, PhosAcid, Ammonia, Potash, and Subsidy/Minimum Retail
Price.
• Import is dominated by Iran and other Middle East exporters. However,
Iran’s share decreases in 2019 due to sanctions. 2018 import (port
line-up), 000’t
000’t
000’t
Source: IHS Markit, Fertecon
25
Transformation: A New Era for the Agri-nutrients Industry
Focus on Middle EastFertecon | Agribusiness intelligence
3.59
2.66
3.31
3.67
3.20
0.0
0.5
1.0
1.5
2.0
2.5
3.0
3.5
4.0
2014 2015 2016 2017 2018
Ammonia Export from Arab Gulf
Saudi Arabia Iran Qatar Oman
Bahrain UAE Kuwait Arab Gulf
55.4%
17.9%
13.7%
9.8%
1.3%
0.9%0.8%
0.1%
0.0%
2018
India
South Korea
Taiwan
China
Australia
Thailand
Japan
Turkey
South Africa49.8%
19.2%
10.4%
20.4%
0.3%2019 H1
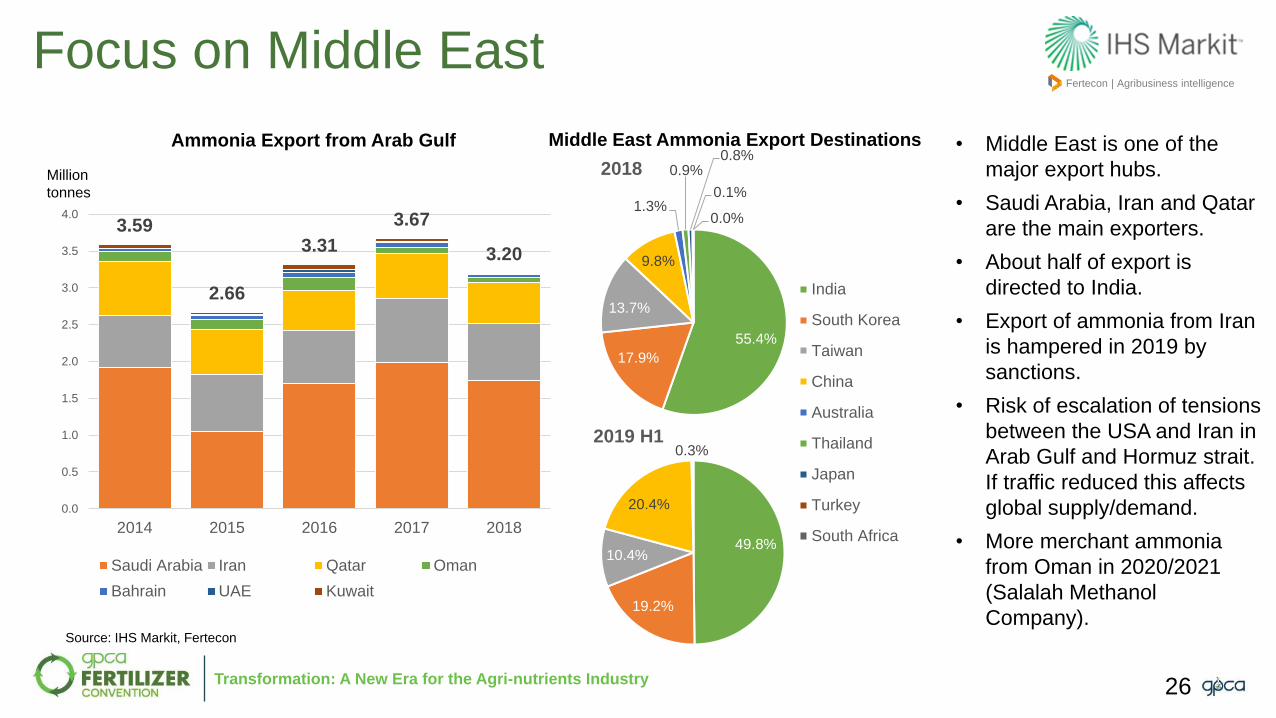
Middle East Ammonia Export Destinations • Middle East is one of the
major export hubs.
• Saudi Arabia, Iran and Qatar
are the main exporters.
• About half of export is
directed to India.
• Export of ammonia from Iran
is hampered in 2019 by
sanctions.
• Risk of escalation of tensions
between the USA and Iran in
Arab Gulf and Hormuz strait.
If traffic reduced this affects
global supply/demand.
• More merchant ammonia
from Oman in 2020/2021
(Salalah Methanol
Company).
Million
tonnes
Source: IHS Markit, Fertecon
26

Transformation: A New Era for the Agri-nutrients Industry
Fertecon | Agribusiness intelligence
27
Kandla
Mumbai
Goa
Mangalore
Paradeep
Ennore
CochinTuticorin
Kakinada
Vizag
HaldiaSikka
Mesaieed
Ammonia Fleet in ME and India
Dahej
Al Jubail
Sur
BIK
AssaluehRAK
Al JabirahOM SUR – KR USN
ETA 09-20
24 kt
WaregemSA RAZ – JO AQJ
ETA 09-27
25 kt
StandorfIran – CN ZHA
ETA 09-21
22 kt
Galle
Fujairah
Clipper MarsUA YUZ – IN PRT
ETA OCT
36 kt
Gas LineIran – TW TXG
ETA 09-24
22 kt
Trammo CornellQA MES – IN KAK
ETA 09-23
25 kt
AlmaronaQA MES - IN NML
ETA 09-23
17 kt
Marianna GoldenIN ENR - ID BXT VIS
ETA 09-24
17 kt
WepionSA RAZ – KR USN
ETA 09-23
24 kt
The MoonIran – IN PRT
ETA 09-30
19 kt
Al BarrahTW TXG – SA JUB
ETA 09-25
24 kt
Aqaba
SCF TobolskCN CJG – SA RAZ
ETA 09-21
23 kt
KentIN PRT –
ETA 09-27
23 kt
Trammo DietlinIN IXY -
ETA 09-27
25 kt
Sitrah
Abu Qir Suez
Ar Ruwais
SeashineQA MES – IN ENR
ETA 09-26
25 kt
In Far East
In Indonesia
In Black Sea
Loaded to India
35%
Unloaded from India0%
Loaded to Far East36%
Unloaded from
Far East19%
Loaded to ME10%
Unloaded from ME0%
Middle East Mkt Tonnage
Loaded from ME
46%
Unloaded to Indonesia9%
Loaded from West from Suez
19%
Unloaded to West of
Suez26%
India Mkt Tonnage
Snapshot 23 Sep 2019
Source: IHS Markit, Fertecon
Ammonia terminals
Loaded ammonia vessels
Unloaded ammonia vessels

Transformation: A New Era for the Agri-nutrients Industry
OutlookFertecon | Agribusiness intelligence
Source: Fertecon
• Regional ammonia net trade
analysis shows a major shift in
the Americas region and tighter
market balance in Asia (east of
Suez)
• Export from Eurasia will
continue to grow
• Net export from the Americas
will stay at 2.7 million tonnes
• Net import will remain stable in
Europe and Africa, and east of
Suez.
28

Thank youwww.gpca.org.ae