proposal for a revision of loan pricing for … · table of contents 1 ... v. flexible and fair...
TRANSCRIPT
Page | 2
African Development Bank
PROPOSAL FOR A REVISION OF LOAN PRICING FOR
SOVEREIGN AND SOVEREIGN-GUARANTEED OPERATIONS
May 2010

Page | 3
The loan pricing proposal was prepared by an inter-departmental
task team listed below:
Loan Pricing Task Team Members: K. Diallo Director, Financial Management, Chair
J.B.Bile Office of the Vice President, Finance
C. Boamah Director, FFCO
P. Kei-Boguinard Division Manager, FFMA, Vice Chair
T. de Kock Division Manager, FFMA, Vice Chair
O. Hollist Division Manager, FFCO
J. Ahogny, Division Manager, FFCO
A. Bellier, Jean Principal Risk Officer, FFMA
N. Ahononga Risk Officer, FFMA
A. Coulibaly Risk Officer, FFMA
O. Fall YPP, FFMA
S. Tape Treasury Officer, FTRY
O. Eweck Investment Officer, FTRY
P. Godfred Lead legal, GECL
P. Toko Budget Officer, COBS
R. Bharat Investment Officer, OPSM

Page | 4
TABLE OF CONTENTS
1
EXECUTIVE SUMMARY...................................................................................................... 7
I. BACKGROUND.......................................................................................................... 10
II. THE BANK’S LOAN PRODUCTS AND PRICING STRUCTURE .......................................... 11
The Bank’s Loan Pricing Structure ...................................................................... 11 Loan Product and Pricing Changes ...................................................................... 12 Current product structure of the Bank’s lending portfolio and funding base .............. 13
III. RECENT MARKET DEVELOPMENTS AND THEIR IMPACT ON MDBs LOAN PRICING ...... 14
Recent changes by sister MDBs and rationale....................................................... 14 Comparative MDB loan pricing levels................................................................... 15 Lessons learnt from pricing changes ................................................................... 16
IV. GUIDING PRINCIPLES FOR THE BANK’S LOAN PRICING FRAMEWORK ........................ 17
Pricing framework – Anchors to the Bank’s charter ............................................... 17 Guiding principles for Sustainable Pricing Level .................................................... 17
V. FLEXIBLE AND FAIR ADJUSTMENT TO THE BANK’S LOAN PRICING FRAMEWORK ....... 20
Adequacy of the Bank’s Loan Pricing ................................................................... 20 Long Term Sustainability of the Bank’s pricing level .............................................. 22 Measures to adress the principle of loan pricing flexibility ...................................... 24 Specific measures to adress the adequacy of loan charge coverage ........................ 25
VI. CONCLUSION AND RECOMMENDATIONS.................................................................. 28
ANNEXES
Annex 1: The Bank’s Loan Pricing Framework
Annex 2: Historical perspective of the bank’s loan products
Annex 3: Historical Loan Income Analysis and Projections
Annex 4: Lending Spread Adjustment- Impact on Net Income and RCUR
Glossary
NB- The analysis provided in this report is based on the best information
available at the time of the review.
Page | 5
LIST OF MAJOR REVISIONS AND UPDATES
The list below summarizes all the changes made since the original version was discussed
during the informal Board of Directors on February 2010.
All changes in the revised document are highlighted in blue.
• The third principle has been enhanced to factor in the need to keep borrowers engaged
with due regard to their financial constraints (Executive Summary page 8 & Section 4
pages 18-20).
• Measure 2 has been revised to take into consideration the various consultations held on
the subject matter with Executive Directors (Executive Summary page 8 & Section 5
pages 24 & Conclusion page 28).
• The reference to a possible waiver for Measure 4 has been deleted (Footnotes 2 and 18).
• The Comparators benchmarking has been updated as of March 2010 (Section 3 table 02,
paragraphs 3.6 &3.11, Section 5 table 06);
• All figures and tables related to year-end 2009 have been updated to reflect the audited
financials.
o The Public sector portfolio structure by product has been updated as of December
2009 (Section 2 table 01 & paragraphs 2.15 & 2.16);
o 2009 figures have been updated according to actual versus budget (Paragraph 5.3,
figure 1, 2, 3a and 3b, table 05 and Annex 3 table A);
• Projections have been revised and are in line with those presented in the GCI document
(Section 5 paragraphs 5.6 to 5.9 and 5.16 to 5.18, figures 2, 3a and 3b, table 05 and
Annex 3 table B , Annex 4, addition of footnote 15);
• Annex 3 has been expanded to provide details on the projected coverage ratios (new
table A2 & new graph).
• Annex 3 has also been revised to factor in a possible revision in the cost sharing formula
and the new projections (Table B).

Page | 6
LIST OF ABBREVIATIONS
ADB African Development Bank
ADF African Development Fund
AsDB Asian Development Bank
CSP Country Strategic Paper
DFI Development Financial Institution
ESW Economic Sector Work
EVSL Enhanced Variable Spread Loan
FSL Fixed Spread Loan
GCI General Capital Increased
IADB Inter American Development Bank
IBRD International Bank for Reconstruction and Development
LIBOR London Interbank Offered Rate
LIC Low Income Country
MDB Multilateral Development Banks
MIC Middle Income Country
RMC Regional Member Country
UA Unit of Account
VSL Variable Spread Loan
Page | 7
EXECUTIVE SUMMARY
During the course of the GCI-VI discussions certain shareholders have requested a
review of the Bank’s loan pricing terms, to ensure consistency with the shared objective
of assuring the long-term financial sustainability of the Bank. This review focuses on the
pricing of sovereign-guaranteed loans only, as the pricing of non-sovereign guaranteed
(i.e. private sector) loans are risk-based and market-driven and do not currently raise
any major concern for shareholders.
The context for this review comprises several mutually reinforcing considerations. As a
result of its co-operative nature, the Bank charges the same spread for all its sovereign-
guaranteed loans. In other words, the Bank does not apply risk-based pricing for
sovereign-guaranteed loans. At the same time, such uniform pricing should contribute
towards the year-to-year internal resource generation capacity, thereby supporting the
growth of the Bank’s development assistance activities (comprising lending and non-
lending activities, including contributions to development initiatives). Further, by
contributing to the longer-term financial sustainability of the Bank, loan pricing also
helps to assure the Bank’s “AAA” rating, which in turn enables the Bank to borrow funds
at highly attractive rates on the capital markets. This will ensure the efficiency of the
Bank’s intermediation role.
Also, it is important to note that a key assumption underpinning many of the Bank’s
pricing considerations (as well as those of most other MDBs) was that MDBs would
always be able to obtain funding at levels below Libor (sub-Libor). The recent financial
crisis has highlighted that this may not always be the case in times of systemic stress
and that the refinancing and liquidity risks associated with some of the Bank’s loan
products could be higher than initially anticipated. Such risks could impact negatively the
Bank’s income generation capacity.
For the above reasons all the shareholders of the Bank, borrowing and non-borrowing,
have a keen interest in assuring the adequacy of the Bank’s loan pricing terms.
The loan pricing framework is anchored to the Agreement Establishing the Bank. Articles
17 and 18 of the Agreement stipulate that: (i) interest rates and charges should be
reasonable; (ii) the Bank shall receive suitable compensation for risk; (iii) terms and
conditions shall take due account of the terms and conditions on which the
corresponding funds were obtained by the Bank (i.e. a cost of funds-plus basis); and (iv)
the Bank should apply sound banking principles.
Consistent with such framework and taking into account the nature and mandate of the
Bank which is not a profit maximizing institution, Management in making proposals
related to the pricing of loans continues to be guided by the following principles:
• First, loan charges should be reflective of the true cost of funding;
• Second, they should be adequate to cover structural costs associated with the
Bank’s operations (i.e. lending related expenses), bearing in mind considerations
of efficiency in the management of expenses;

Page | 8
• Third, they must have embedded flexibility for absorbing average expected losses
over the lifetime of the loan and recover capital costs with due regard to
borrowers financial constraints;
• The fourth important feature is competitiveness with comparable institutions/or
the market and ability to support portfolio growth;
• The fifth component is predictability and transparency.
In the light of the above, Management undertook a comprehensive review of the Bank’s
loan pricing structure taking into consideration the key requirements and guiding
principles of sustainable pricing, recent developments in comparable institutions, the
specific needs of the RMC borrowers and the incentive of keeping them engaged with the
Bank, within the context of the mutually reinforcing considerations summarized above.
The proposals presented in this paper may be classified into two broad categories, as
follows: (i) measures to provide reasonable flexibility to the Bank to adjust to changes in
the major drivers of the cost of doing business without compromising transparency and
predictability; and (ii) pricing adjustments to address specific inadequacies in the current
pricing structure without jeopardizing competitiveness.
MEASURES TO ADDRESS THE PRINCIPLE OF LOAN PRICING FLEXIBILITY
The measures proposed below are subject to Board approval, as is customary, and are
also intended to be applied prospectively only.
• Measure 1 – Periodic review of the adequacy of the lending spread for
new loans
A review of the adequacy of the lending spread for new loans should be
performed within the framework of the Medium Term Financial Outlook of the
Bank. If the lending spread does not cover 100% of operational expenses - which
will be a trigger mechanism-, Management will make a formal proposal of
adjustment to the Board, if deemed necessary.
• Measure 2 - Revision of loan pricing for exceptional stress events
As part of the range of measures that Management and the Board may take to
protect the Bank’s balance sheet and financial integrity and to maintain its credit
AAA rating, in response to exceptional unforeseen stress events, an upward
adjustment of the price of loans signed after the date of the adoption of this
policy could be considered for a limited time. The Board of Directors shall
approve the qualification of an event as exceptional, the related level of pricing
adjustment and application period.

Page | 9
SPECIFIC MEASURES TO ADDRESS THE ADEQUACY OF LOAN CHARGE COVERAGE
• Measure 3 - Upward adjustment of the lending spread for new loans
To ensure long term sustainability and based on the financial outlook of the Bank,
an upward adjustment of the current spread may be necessary to protect the
Bank’s balance sheet. Indeed, the projections of the Bank’s income over the
medium term indicate that the Bank is unlikely to fully recover its operating costs
and provisions. Therefore, Management proposes an increase in the current
spread by 20 basis points in 2010, which would bring the contractual spread from
40 to 60 basis points. Such an increase would ensure full coverage of operational
expenses after the end of the MTS period (around 2014) and the coverage of
expected level of provisions by 2017. If in future years the Bank’s financial
condition improves, a downward adjustment could be considered by the Board to
ease the financial burden on borrowers.
• Measure 4 - Introduction of a Graduated Commitment fee for fast
disbursing Policy Based Loans
Management proposes to introduce a graduated commitment fee on fast
disbursing policy based loans ranging from 25 bps to 75 bps. Such graduated
commitment fee, applicable only to amounts not utilized within the negotiated
loan draw-down timetable, is intended to discourage borrowers, without imposing
an undue penalty, from delaying disbursements on loans possibly contracted for
precautionary purposes only, thereby using up risk capital that could be available
for lending1. The fee would commence at 25 bps from the scheduled
disbursement date of each tranche and increase by 25 bps every six months
thereafter, to a maximum of 75 bps2, on any undrawn portion of each tranche.
1 The average length of disbursement of Policy Based Loans in ADB’s Portfolio is 1.9 years.
2 75 bps was the fee applied before the cancellation of commitment fees.

Page | 10
I. BACKGROUND
1.1 Over the past few years, Management and the Board have devoted significant
time and efforts to the Bank’s Medium Term Financial Prospects and net income
allocation, focusing largely on the long-term sustainability of the Bank’s financial
structure. Also, during the July 2009 meeting of the Board of Directors to discuss the
Bank’s General Capital Increase, Management was requested to examine the adequacy
of the Bank’s loan pricing within the context of the range of long term strategies and
options for strengthening the Bank’s risk bearing capacity.
1.2 The major challenge facing the Bank is the competing demands on the Bank’s net
income, including: 1) responding to the increasing need to strengthen reserves and 2)
meeting and expanding commitments made by the Bank for important development
initiatives.
1.3 Although the Bank is not a profit maximizing institution, adequate income is
needed to sustain the business growth, cover the Bank’s balance sheet risks, repay
borrowings, cover administrative expenses and make transfers to development
initiatives. The quicker the Bank’s balance sheet expands the more dependent it will
become on its loan income for maintaining its strong financial position, especially in
meeting needs during times of financial stress and capital constraints. Equity, through
paid in capital, though important, takes years to materialize and is not intended to
address exogenous financial shocks.
1.4 Also, similar to all other MDBs, the key mechanism available to the Bank to
generate net income in response to rapidly changing market conditions is adjustment of
loan charges. However, borrowers understandably dislike loan charge volatility; the
more constant the loan charges the better. Consequently, loan charge adjustments,
their timing and amount, are a continued source of discussions between member
countries and Management. It requires consensus building taking into account the Bank’s
long term financial prospects and equally the need to provide attractive lending terms to
RMC borrowers.
1.5 Recently, the financial crisis and global economic down-turn brought another
dimension to the issue. The Bank played its counter cyclical role which has contributed to
stretching its balance sheet capacity at a rapid pace. Consequently, an increase in loan
charges was considered as a possible option to release the pressure on the Bank’s
prudential limits and build up future financial capacity. In 2009, the Board approved a
suspension of the 20 basis points waiver on the contractual lending spread and the
temporary suspension of fixed spread loans and subsequently the introduction of a single
product (the Enhanced Variable Spread Loans). At the time of these revisions of loan
charges, it was also agreed that the Board would periodically revisit loan pricing
decisions.

Page | 11
1.6 Furthermore, during the Board retreat held on 18-19 November 20093, there was
a consensus for an increase in loan charges if necessary, provided the Bank can
demonstrate that current charges were operationally unsustainable.
1.7 Management therefore, undertook a comprehensive review of the adequacy of its
sovereign4 operations’ loan pricing with the aim of making it more responsive to sustain
cost recovery and to strengthen the Bank’s future financial position without
compromising competitiveness, transparency and predictability. Therefore, the key
questions the document attempts to address are:
• Is the Bank’s pricing fully aligned with the cost pass through principle?
• Is the current pricing reflective of its operating cost? and
• In the long run, can the Bank afford to maintain the current pricing
structure to sustain its business growth?
1.8 This document is organized into 6 sections. Following this introduction, section 2
provides an overview of the Bank’s pricing structure and various changes while section 3
reviews recent market developments and their impact on MDBs loan pricing. Section 4
presents the key core guiding principles underpinning the Bank’s loan pricing. Section 5
assesses the adequacy of the Bank’s current pricing both in terms of framework and
charges and proposes adjustments in line with key core principles. Section 6 provides
the conclusions and recommendations. A number of Annexes are provided as
background reference materials.
II. THE BANK’S LOAN PRODUCTS AND PRICING STRUCTURE
2.1 In order to respond to the key issue of pricing: “Do the Bank’s loan charges
adequately cover its funding and lending operation costs?”, it is important to briefly
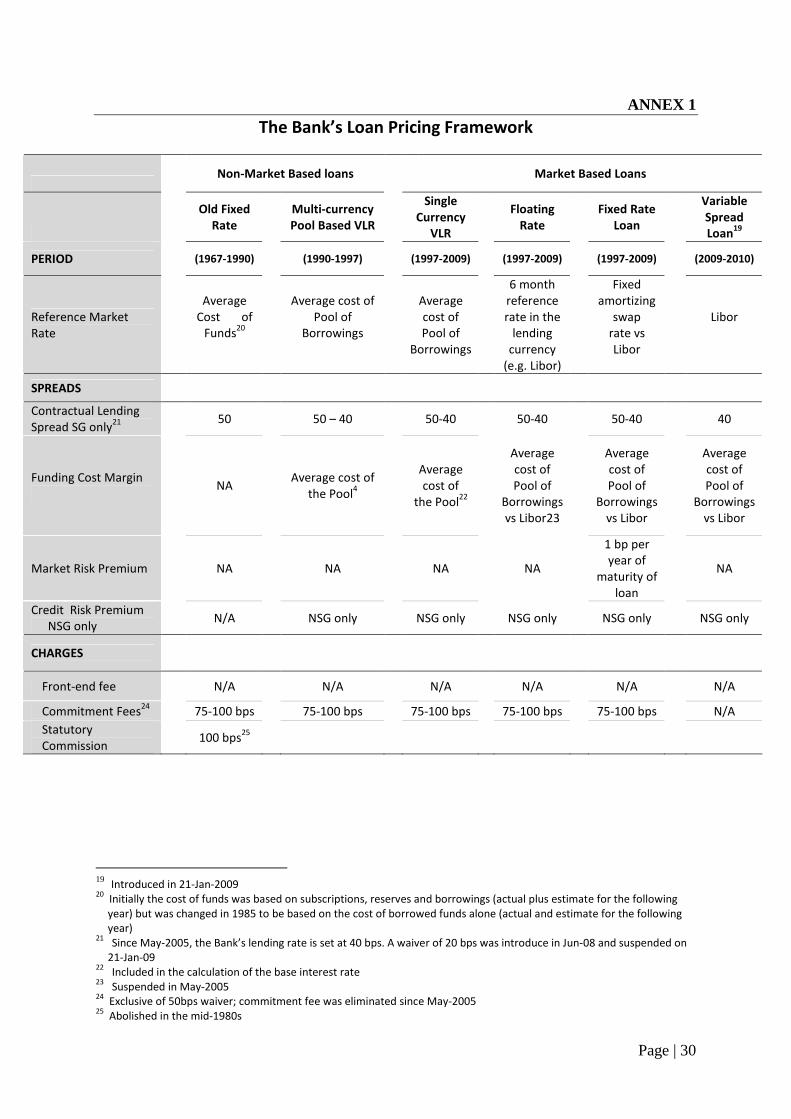
review the Bank’s loan pricing structure. Annex 1 presents the various cost components
of the Bank’s loan products.
The Bank’s Loan Pricing Structure
2.2 Like all multilateral development finance institutions, the Bank’s loan pricing
structure is closely linked to its role as a financing cooperative. It generally consists of
the following components:
• Reference or base rate corresponding broadly to a cost of funds. This has
evolved over time from an average cost of a pool of borrowings to the current
Libor based loans.
• A spread which integrates one or a combination of various factors: (i) a funding
margin, (ii) contractual lending spread, (iii) a credit risk premium; and (iv) a
market risk premium.
3 ADB/BD/WP/2009/235 4 The term “sovereign” is used broadly to refer lending directly to sovereign governments as well as to
operations guaranteed by the sovereign

Page | 12
• Fees comprising one or more of the following: front end fee, commitment fee and
other fees (statutory commission5, late service fee, etc…)
2.3 Funding margin - Depending on market conditions the Bank would raise funds
at a cost above or below LIBOR (i.e. sub-LIBOR funding cost margin). The actual funding
margin is usually passed-through to the borrower in the form of a rebate or surcharge.
2.4 The contractual lending spread is meant to achieve essentially two main
objectives: (i) cover administrative expenses; and (ii) meet net income objectives (build-
up a reserve cushion against potential impairment of the portfolio). A uniform spread is
applied which does not factor credit risk differences between RMCs borrowers.
Historically, spreads applied to the Bank’s sovereign guaranteed loans have ranged
between 20 bps to 50bps, and are currently at 40 bps.
2.5 Credit risk premium - In the case of sovereign loans, given the cooperative
nature of the Bank and its preferred creditor status, no credit risk premium is applied to
sovereign and sovereign guaranteed loans.
2.6 Under special circumstances and stress market conditions, market risk
premium could be charged to cover liquidity risks associated with some specific
structured loan products.
2.7 In this pricing framework, the key issue to address is: “should the spread ensure
partial or full coverage of all administrative expenses (both operational and non-
operational); and should it cover also provisions”?
Loan Product and Pricing Changes
2.8 As indicated in Annex 1, since the start of its lending operations in 1967, the
Bank’s lending products have evolved through three broad categories: (i) fixed rate
loans which were the Bank’s first lending instruments; (ii) Pool-based variable rate loans
introduced in 1990 in order to address the weaknesses of the fixed rate loan products;
and (iii) market based (LIBOR based) loan instruments introduced in 1997 to provide
much greater flexibility to borrowers and better risk management features for the Bank.
Annex 2 provides further details of the loan products through to 2009.
2.9 In 2005, and driven largely by competitiveness pressures and the need for
simplicity, the Bank suspended Variable Spread Loans by eliminating the funding margin.
It also eliminated the market risk premium and commitment fees and reduced the
lending spread to 40 bps. In response to the impacts of the global financial crisis, in
January 2009 the Bank revised the financial terms and conditions offered to its clients:
• Maintain the lending margin at 40 basis points;
• Temporary suspension of the interest rate waiver of 20 basis points
introduced in 2008;
• Maintain the zero front end and commitment fee decided in 2005;
• Temporary suspension of Fixed Spread Loan6 products for new commitments
given the uncertainty of the duration and the magnitude of the impact of the
crisis on the Bank’s funding conditions; and
5 This commission is no longer applicable to the Bank’s loans

Page | 13
• Re-introduction of a Variable Spread loan based on the Bank’s cost of funds
relative to Libor.
2.10 In December 2009 the Board decided to maintain the suspension of the Fixed
Spread Loan as well as the 20 bps waiver and to offer one single product for the Bank’s
sovereign lending operations: the Enhanced Variable Spread Loans made up of a floating
base rate including a free option for fixing the Libor rate.
2.11 While these changes achieved their intended objectives at the time, financial
considerations such as net income allocation, capital adequacy requirements and the
current discussions regarding a general capital increased (GCI), require that the Bank
revisits its loan pricing.
2.12 Mathematically, the Bank’s current loan pricing can be expressed as follows:
Loan price = (i) Base rate + (ii) funding margin + (iii) 40 basis points
Current product structure of the Bank’s lending portfolio and funding base
2.13 The Bank funds its lending operations on the basis of a portfolio approach rather
than on a transaction by transaction basis which is impractical except in the case of very
small portfolios.
2.14 The evolution of the Bank’s lending instruments as described resulted in a diverse
outstanding loan portfolio consisting of a mix of instruments of differing risk
characteristics and funding mechanisms. In addition, the effectiveness of the cost pass
through mechanism may not remain optimal over time due to changes in the loan
balances (new loans and disbursements, repayments and pre-payments) and the
underlying funding (maturing and new borrowings).
2.15 Table 01 below presents the breakdown of the outstanding loan balances as at
December 31st 2009 by type of instruments. Currently only about 42% of the Bank’s
outstanding portfolio is on a full cost pass through basis or 54% of the total disbursed
and undisbursed balances. These loans correspond to the single currency variable rate
loans, variable spread loans pending fixing and variable spread loans on floating base
rate basis.
2.16 Fixed spread loans for which the refinancing risk is more significant currently
represents 28% of the outstanding portfolio. This is because the Bank’s funding margin
(reflecting its own borrowing or credit spread in the markets) is not transferred to the
borrower with this instrument. These loans include market based loans with a fixed
spread approved between 2005 and 2008. Taking into account the undisbursed balances,
this percentage will increase marginally to 29%, still representing a sizeable exposure to
refinancing risk for the Bank.
2.17 A key assumption underpinning many of the Bank’s pricing considerations (as well
as those of most other MDBs) was that MDBs would always be able to achieve sub-
LIBOR funding levels. However the recent financial crisis has highlighted that this may
not always be true in times of systemic stress. Should borrowing costs increase and
6 The fixed spread loan refers to a loan which is priced as the base rate + fixed lending spread. No funding
margin is applied.

Page | 14
remain at levels observed during the first semester of 2009, the Bank’s net income
margin will be negatively impacted.
2.18 It is therefore imperative for the Bank to ensure that going forward all lending
instruments reflect an effective full cost pass through. At the same time the Bank may
consider charging for liquidity and refinancing risks.
Table 01: Public Sector Portfolio Structure by Product as at 31-Dec-2009
(UA Million)
Funding Margin
Applicable
Outstanding
Balance%
Undisbursed
Balance 1
%Cost Pass
Through
No 818 13% 2 0.0% No
No 542 9% 10 0.2% Yes
4 805 78% 4 699 99.8%
-Variable spread loans ( 50, 40 bps) 3 057 50% 3 264 69%
a) Fixed base rate
- Already fixed No 991 16% - 0% No
-Pending fixing 2
Yes 1 151 19% 3 148 67% Yes
b) Floating base rate Yes 915 15% 116 2% Yes
- Fixed Spread loans ( 40, 20 bps) 1 748 28% 1 436 30%
a) Fixed base rate
-Already fixed No 433 7% - 0% No
-Pending fixing 2
No 859 14% 1 184 25% No
b)Floating base rate 456 7% 252 5% No
TOTAL 6 165 100% 4 711 100%
3. Market Based (Libor)
1. Multi-Currency Fixed Rate Loans
2. Single Currency Variable Rate Loans (VLR)
III. RECENT MARKET DEVELOPMENTS AND THEIR IMPACT ON MDBs LOAN PRICING
3.1 MDBs by their very structure are closed financial systems, relying on equity (paid-
in capital) and guarantees (callable capital) provided by shareholders and net income
generated through loan charges. As a result of the financial crisis there is a drive
towards enhancing the net income generation capacity stemming primarily from
increased risk bearing requirements (for capital adequacy and transfers to soft windows
and development initiatives).
3.2 In periods of financial stress, a capital increase cannot serve effectively as a first
response, given the time required to propose, agree to and provide resources. Equally,
earning a positive return on conservatively managed liquid investments is not considered
a primary development bank objective in most MDBs; as such, even in the best of
circumstances, net returns on investments are not expected to be significant.
3.3 One of the most important mechanisms in enhancing net income generation
capacity is the level of loan charges. Therefore, most MDBs regularly review their loan
pricing for sovereign loans.
Recent changes by sister MDBs and rationale
3.4 Most MDBs have revised their pricing terms over the past few months and
continue to review their loan pricing policy generally. In August 2009, as part of the
annual loan pricing review and net income allocation exercise, the IBRD raised their
contractual lending spread on new commitments from 30 basis points to 50 basis points,
to maintain financial sustainability in a context of reduced capital.

Page | 15
3.5 Similarly, in June 2009, the Board of Directors of the Inter-American
Development Bank (IADB) approved an increase in loan charges applicable for a one
year period from 30 basis points to 95 basis points, in order to leverage their balance
sheet to address the needs of their borrowing countries and to maintain a strong
financial position vis à vis investors and rating agencies. It is worth noting that the loan
pricing structure of IADB adopted many years ago is such that the lending spread is not
fixed but is determined by the bank from time to time based on its financial position.
The effect is that changes to the loan charges are applicable to the entire pool of loans
outstanding and can therefore have a significant and immediate impact on income.
3.6 The Asian Development Bank (AsDB) has approved a revision of loan charges on
new Libor based loans and local currency loans to sovereign borrowers negotiated on or
after 1 July 2010. Under the new loan pricing structure, the effective contractual spread
will be gradually adjusted to 40 bps from the current charge of 20 bps per annum (30
bps for loans negotiated from 1 July 2010 to 30 June 2011, and 40 bps on or after, 1
July 2011).
Comparative MDB loan pricing levels
3.7 Lending terms for sovereign loans vary across MDBs and depend on the type of
loan offered. Two types of loans are available to sovereign and sovereign guaranteed
borrowers, the Variable Spread Loan (VSL) based on the cost of borrowing relative to
Libor plus a lending spread and the Fixed Spread Loan (FSL) priced with a fixed spread
over the Libor.
3.8 As is evident in Table 02, the IBRD is the sole MDB that offers both loan products;
other institutions offer solely VSL products. The VSL pricing methodology is similar for all
MDBs, consisting of a base rate plus funding margin plus contractual lending spread.
IBRD has the lowest (best) funding margin for USD, followed by AsDB, IADB and ADB.
Indeed, as a result of the recent financial crisis during which funding spreads generally
increased, some MDBs have not recorded significant changes in their funding margins
primarily for the following reasons (i) with a larger outstanding stock of borrowings, new
borrowings contracted at less competitive Libor levels, have had a very marginal impact
on the funding margins; (ii) Other MDBs borrowing strategy targeted the very short end
of the curve (including the ECP market) were sub-Libor funding levels could still be
achieved.
3.9 The current pricing methodology of FSLs provided by IBRD is maturity based and
compensates for two main risks (i) the expected future funding cost and (ii) the volatility
of future funding cost (Risk Premium). The current risk premium is 10 bps for average
maturity lower than 14 years and 15 bps for longer than 14 years.
3.10 Additional loan charges like Front End Fee or Commitment Fee are applied by
most institutions.

Page | 16
Table 02: Comparators benchmarking of lending terms to sovereign clients
(As at March 2010; in basis points)
3.11 Further changes are currently being envisaged by some MDBs in their pricing
terms.
Lessons learnt from pricing changes
3.12 As a result of the financial crisis, most MDBs have embarked on reviewing their
pricing with two objectives: to ensure effective cost recovery and to generate more net
income in order to sustain increased risk bearing requirements in a context of capital
constraints. They have also explored longer term options for a reasonable and flexible
pricing approach directly or indirectly linked to their capital adequacy framework.
3.13 The loan spread, is the key financial variable under the direct control of the
MDBs. However, unlike some other MDBs, the Bank has limited flexibility to adjust its
loan spread to meet specific financial objectives or address financial stress. Some MDBs
have the ability to apply an increase in their contractual spread to the whole loan
portfolio, such mechanism allowing them to address the risk capital constraint more
easily, a vital requirement giving them much needed flexibility.
7 For IBRD FSL, the maturity indicated is the maximum average maturity 8 For the AsDB, maturity and grace period are project specific
9 & 10
Spread-equivalent computations for commitment charge and front-end fee use average project
disbursement profile of 8 years. Repayment terms used are as follows: Final Maturity: 30 Years; Grace Period:
5 Years; Level repayment of principal. Disbursement profiles and payment terms vary across MDB's and hence
spread-equivalent charges would vary based on the disbursement profile and payment terms used
10
ADB IBRD IADB AsDB
Flexible Loan Loan Type Variable
Spread
(VSL) Variable
Spread
(VSL)
Fixed Spread (FSL)7
Single
Currency
Facility
Libor
Based
1- Maximum
Maturity (Years)
20 30 Less than
10 years
Between
10 and
14 years
More
than 14
years
25 NA8
2- Maximum Grace
period (Years)
5 8 8 8 8 5 NA
3- Base Interest rate
(a)
Libor(L) Libor(L) Libor (L) Libor(L) Libor(L)
4- Interest Charges:
- Contractual
spread
40 50 50 50 50 95 20
- Sub Libor Benefit 4 -26 0 20 40 3 -28
- Market risk
premium
- - 10 10 15 - -
Net Spread over the
Base rate (b)
44 24 60 80 105 98 -8
5- Charges:
- Commitment
Charge
- - - - - 25 -
Spread Equivalent of
Commitment fee(c)9
- - - - - 9 -
6- Front-end Fee:
- Contractual front
end fee
- 25 25 25 25 - 15
Spread Equivalent of
Front-end fee (d)10
- 5 5 5 5 - 5
Total Indicative Lending
Rate (a+b+c+d)
L +44
L +29
L +65
L +85
L +110
L +107
L -3
Page | 17
3.14 In terms of pricing structure only the African Development Bank does not apply a
front end or commitment fee. This has further limited the Bank’s income generation
capacity over the past few years.
IV. GUIDING PRINCIPLES FOR THE BANK’S LOAN PRICING FRAMEWORK
Pricing framework – Anchors to the Bank’s charter
4.1 It is worth recalling that the Bank’s pricing is anchored in its charter. The
principles for the pricing of the Bank’s loans and guarantees are indeed embodied in
Articles 17 (f and k) and 18 of the Agreement Establishing the African Development Bank
which stipulate that: (i) interest rates and charges should be reasonable; (ii) the Bank
shall receive suitable compensation for risk; (iii) terms and conditions shall take due
account of terms and conditions on which the corresponding funds were obtained by the
Bank (i.e. a cost of funds-plus basis); and (iv) the Bank should apply sound banking
principles.
4.2 Over time, the application of these principles have been adapted to reflect the
specific circumstances of the Bank’s evolving operating environment and portfolio as well
as the practices of other sister MDBs. Hence, the Bank regularly reviews its loan pricing
structure in order to take into account the requirements of borrowers, the need to
enhance its financial intermediation capacity, the conditions in the financial markets and
also to ensure the sustainability of its income.
Guiding principles for Sustainable Pricing Level
4.3 The continued success of the Bank to intermediate competitive borrowing terms
for its RMCs is largely dependent on its ability to maintain a sound financial standing in
the financial markets. To maintain such status, the Bank must strive at all times to
generate sufficient levels of net income to:
• Build much needed reserve capacity to sustain loan growth and absorb potential
portfolio losses as a normal cost of doing business;
• Strengthen its equity base and income generation capacity; and
• Support transfers of net income to mandatory recurrent undertakings, ADF and
other development related initiatives.
4.4 In this respect, active income management and an adequate loan pricing
framework are key elements in securing the financial integrity of the Bank needed to
maintain the AAA rating and increase the Bank’s relevance to MICs and LICs through
private sector operations.
4.5 To ensure that these objectives are met, a balanced loan pricing strategy is
paramount. For a multilateral development finance institution, not profit maximizing,
with a continental mandate and operating in an increasingly volatile environment such as
the Bank, the strategy is anchored on five core guiding principles:
• First, loan charges should be reflective of the true cost of funding;

Page | 18
• Second, they should be adequate to cover structural costs associated with the
Bank’s operations (i.e. lending related expenses), bearing in mind considerations
of efficiency in the management of expenses;
• Third, they must have embedded flexibility for absorbing average expected losses
over the lifetime of the loan and recover capital costs with due regard to
borrowers financial constraints;
• The fourth important feature is competitiveness with comparable institutions/or
the market and ability to support portfolio growth; and
• The fifth component is predictability and transparency.
Effective recovery of funding and lending costs - “cost recovery and cost pass
through principles”
Funding cost pass through
4.6 To the extent possible, lending products offered to clients should be based on a
“full cost pass through” of borrowing costs in order to ensure that refinancing risks are
limited and will not jeopardize the Bank’s financial integrity. Under the currently
available loan product, the Enhanced Variable Spread Loan (EVSL), the Bank passes the
full funding cost / benefit to the borrowers.
Recovery of operating cost of making loans
4.7 As a sound Management principle, the structural cost of operations (i.e. costs of
preparation, evaluation, implementing and monitoring of loans) should be covered
through the pricing of services. Therefore in setting its loan pricing the Bank should
ensure adequate coverage of administrative expenses associated with lending operations
through the lending spread. However, this also raises the question as to whether loan
charges should cover all administrative expenses or only a subset directly related to the
lending operations. In this respect, it is worth recalling that the Bank’s administrative
expenses are divided in two categories:
• operational expenses that include two groups of expenses; (i) direct lending
costs i.e. expenses directly linked to lending operations (direct financing of
project cycle activities having one-to- one relationship with lending); non-lending
services (Analytical works, ESW&CSP and activities to maintain relationships with
borrowing countries); and costs associated with cross cutting issues or provision
of global/regional public goods; and (ii) lending support costs that are associated
with legal, treasury, disbursements, billing, procurement and post evaluation etc;
• non-operational expenses that are the costs associated with institutional
programs not directly linked to lending operations.
4.8 The challenges of recovery of the full cost of making loans rely on the practicality
of unbundling the various services provided to borrowers, quantifying costs and
redistributing the charges appropriately. To address this challenge in line with cost
allocation principles in the absence of a simple and flexible Time Recording System

Page | 19
(TRS)11, the loan pricing should at a minimum cover the operational expenses. However,
recently concerns have been raised as to whether the pricing should not cover the full
administrative cost of making loans whether direct, direct support or indirectly related to
lending operations.
4.9 In line with the above concern, although it is true that to the extent possible,
lending products offered to clients should be based on a “full cost pass through” of all
costs directly associated to making loans, determining such an administrative cost
coverage could only be made after the implementation of the current UA budgeting and
its associated TRS. In the absence of such a system, this analysis focuses on operational
expenses that are more easily identifiable.
Embedded flexibility and recovery of capital charges
4.10 To maintain the Bank’s financial integrity, loan pricing should also serve to build a
cushion against potential shareholders’ capital impairment and to sustain risk bearing
capacity due to unexpected increases in loan approvals/disbursements or to cover
portfolio impairments or payment interruptions linked to loans in arrears. While a capital
increase will improve the Bank’s financial strength, it is not necessarily suitable for
situations requiring immediate responses.
4.11 Therefore, in order to respond quickly to negative events such as the default of
major borrower(s), the Bank should be in a position to quickly reinforce its reserves
through the generation of adequate net income and to provide coverage for expected
losses. Adequate loan income will also enable the Bank to respect, to the extent
possible, past and new undertakings for net income allocation to development initiatives.
Furthermore, the increased volatility in the external environment requires enhancing the
flexibility in loan charges to protect the financial capacity of the Bank.
4.12 These objectives can only be met if an increase in the lending spread results in a
meaningful and timely increase in loan income that strengthens equity with due regard
to borrowers financial constraints. The stress-tests below illustrate the potential risk
exposures that the current loan pricing policy might generate in the event of non-accrual
events. The tests are performed on a simulation of what-if-scenarios on the last five
years history of the Bank’s Balance sheet.
11 During the implementation of the UA budgeting system, the Bank also plans to implement a reliable TRS and
analytical cost accounting system. These new systems are expected to be fully tested by the year 2012 and
should permit the full review of the cost sharing methodology between the Bank Group institutions as well
as the establishment of a stronger linkage between direct expenses related to lending activities.

Page | 20
Table 03 - Reduction in Income transfers due to Portfolio Impairment (non-accrual shock)
Default Event 2004 2005 2006 2007 2008 2009
Impairment of 24% of the loan
portfolio
-34% -34% -49% -65% -35% -69%1/2/
Impairment of 43% of the portfolio
(correlated default events of
several borrowers)
-95% -82% -100%1/ -100%1/ -60% -100%1/2/
1/ At this point no net income is passed to Reserves, thus limiting future lending growth 2/Assumes Loan charges weighted average for year 2009 is the same as for year 2008.
Competitiveness and Predictability to borrowers
4.13 With respect to the guiding principles that are non-cost based, to the extent
possible, the lending rate should be predictable and competitive relative to the lending
rates of other Development Finance Institutions active in Africa and to funding
alternatives in the capital markets. Indeed, the Bank must be relevant for borrowers and
remain competitive in the market. However, these objectives may at times be
inconsistent with the objective of maintaining the financial integrity of the Bank, in which
case priority should be given to the Bank’s financial integrity.
4.14 It is important to note that some of these above guiding principles are embedded
in those initially established in 198612, and still remain largely valid despite the
significant changes that occurred in the Bank’s operating environment. The premise of
the balanced pricing guidelines for sovereign operations are equal risk (non risk based
pricing), cost pass through and sustainable income generation capacity to maintain the
Bank’s financial integrity, adequate recovery of structural cost of operations,
competitiveness and predictability.
V. FLEXIBLE AND FAIR ADJUSTMENT TO THE BANK’S LOAN PRICING FRAMEWORK
Adequacy of the Bank’s Loan Pricing
5.1 There are key issues to address in order to ascertain that the current pricing
structure is adequate and aligned with the requirements of a sustainable level of pricing:
(i) is the Bank’s pricing fully aligned with the cost pass through principle; (ii) is the
current pricing reflective of its operating cost; and (iii) in the long run can the Bank
afford to maintain the current pricing structure to sustain its business growth?
Funding cost past through
5.2 In the past, the Bank has not effectively achieved a full “cost pass through”
mechanism between its cost of funds and the loan charges to its borrowers, mainly due
to the creation of several new lending instruments in response to competitiveness
concerns. However, since the reintroduction of Variable Spread Loan and the suspension
of Fixed Spreads Loans in 2009, the Bank’s available lending products are aligned with
this first guiding principle. Should the Bank consider reintroducing Fixed Spreads Loans,
market risk and tenor risk premiums would have to be re-considered as a cost of
providing such loans.
12
See Board Document ADB/BD/WP/86/156 entitled “Search for a suitable Lending rate Methodology”

Page | 21
Recovery of operational costs13
5.3 Figure 1 which shows the evolution of the operational administrative expenses
cover ratio from 2000 to 2009 indicates that while the Bank used to fully cover total
operational
expenses,
the ratio
has fallen
below 1
and has
also been
on a
declining
trend for
the last five
years.
Since 2007,
the Bank
was not
even able to fully cover sector and country department expenses. This is due to a
combination of factors of which decreasing fees and increasing expenses form a large
part. Simulation of coverage requirements summarized in Annex 3 indicates that an
additional margin of 43 bps would have been required to cover operational expenses in
2009. Also, if the Bank has to cover at a minimum the costs incurred by only sector and
country departments, 24 bps would be required. Furthermore, the analysis of the Bank’s
income generation since 2000 shows a decrease in loan income by 47% mainly due to a
sharp decrease in fees (97%). It is important to note that fee income previously formed
a sizable portion of the Bank’s income and are currently no longer applicable.
Consequently, the Bank is no longer in a position to generate a cushion to absorb
average expected losses associated with its loans. Annex 3 provides more detailed
analysis on such an assessment.
Flexibility and Competitiveness
5.4 In the wake of the financial crisis, certain rating agencies have indicated that the
ability to quickly adjust the Bank’s pricing in response to stress events would constitute
favorable rating factors. While the Bank’s current structure presents the advantage of
simplicity, it offers little room for adjusting loan revenues by adapting its loan charges to
specific market conditions and new developments in the loan portfolio structure.
13
Operating expenses indicated in this report use the same terminology as the Budget and Cost sharing
formula of the Bank. Total Expenses are composed of operational expenses and non-operational expenses.
Operational expenses are made of the expenses of three groups of cost centers: sector, country and direct
support cost expenses. For the purpose of this analysis private sector cost centers related expenses are
subtracted from the operational expenses.
Figure 1- Historical Coverage of Operational Expenses (2000-2009)
0.00%
50.00%
100.00%
150.00%
200.00%
250.00%
300.00%
350.00%
400.00%
2000 2001 2002 2003 2004 2005 2006 2007 2008 2009
Coverage Operational Expenses Ratio (Country & Sector)Coverage Total Operational Expenses Ratio100% CoverageAverage 2000-2009 Operational Expenses Ratio

Page | 22
5.5 In the past competitiveness was a major argument against loan pricing structure
changes. While competitiveness is an important factor to monitor, the approval volume
of new loans was not significantly impacted by the various changes in the Bank’s lending
spread from 2005 to 2009 as indicated in Table 04. Furthermore, in addition to
competitiveness, the primary objective of the review is to protect the Bank’s financial
integrity and enhance in its intermediation capacity vis-à-vis the borrowers.
Table 04: ADB loan Approvals by Sector, 1964 - 30-Sept-2009 (UA million unless otherwise specified)
1 Jan 64 1Jan 90 1 Jan 98 4May05 2Jun08 21Jan09
Approvals 31Dec89 31Dec97 4May05 2-Jun-08 21Jan09 30Sep09
Fixed VRL VSL FSL VSL
50bps 50bps 50bps 40bps 20bps 40bps
Public Sector approval level
7,638
7,883
4,677
2,071
54
1,596
Private Sector approval level
89
1,077
1,730
86
650
Total approval
7,638
7,972
5,754
3,801
140
2,246
Period duration in years
26.0
8.0
7.3
3.1
0.6
0.7
Average volume of annual approval (Public sector)
294
996
784
1,233
220
3,254
Number of borrowing countries (Public sector)
26
22
20
16
3
7
Number of loan transactions (Public sector)
540
174
146
63
3
8
Long Term Sustainability of the Bank’s pricing level
5.6 A periodic review and adjustment whenever necessary is paramount to ensure
the shared objective of long term sustainability of pricing. The baseline financial
projections of the Bank illustrated by figure 2 shows that:
• Operational expenses will only be covered by loan income from 2016, despite
the assumptions of significant growth of outstanding loans14 and stable
administrative expenses.
• If loan loss provisions are also considered, the Bank will not recover its
operational expenses and provisions during the period 2010-2020.
Figure 2- Projected Operational Expenses & Provisions Coverage Ratio
(Sensibility Analysis)
0%
25%
50%
75%
100%
125%
2009 2010 2011 2012 2013 2014 2015 2016 2017 2018 2019 2020
Operational Expenses Coverage Ratio "Base Case"
Operational Expenses & Provisions Coverage Ratio "Base Case"
Operational Expenses with 10 bps Slippage Coverage Ratio (stress)
Operational Expenses with 10 bps shift in Provisions Coverage Ratio (stress)

Page | 23
5.7 Moreover, if the Bank continues to maintain its loan pricing structure and apply a
lending spread of 40 basis points irrespective of financial conditions it will not be in
position to quickly generate enough income to face a shift in the trend of expenses such
as a significant increase in cost resulting from: (i) an eventual change in cost sharing
formula and the share allocated to ADB, or (ii) an increase in loan loss provisions as a
result of potential deterioration of its asset quality. This is corroborated by the result of
the sensitivity analysis illustrated by figure 2.
5.8 If the Bank were to keep the same pricing going forward, a 200% Capital
Increase will only be sufficient to maintain its risk capital utilization below 99% until
2016 (Annex 4), raising concerns about the long term sustainability of the Bank’s
pricing. It is also important to underscore that the later the increase in pricing the higher
the additional margin required to generating sufficient additional income to maintain the
Bank’s financial strength.
5.9 Therefore, the sustainability of the Bank’s pricing level has to be considered over
different time horizons (short, medium and long term) factoring the need to lessen the
burden on borrowers and ensure competitiveness. Indeed, if the Bank were to adjust its
lending spread to ensure full coverage of operating expenses in the short term, the
increase required would be very costly for borrowers at +245 bps15 for 100% coverage
of operational expenses in 2011 or +100 bps for 2012. Thereafter, the coverage would
be high as illustrated by figure 3a. Targeting a full coverage of operational expenses
after the end of the MTS period (around 2014) and a reasonable coverage of provisions
from 2017, the spread would need to be adjusted upward by around 20 bps as shown in
figure 3b. These conclusions are valid under normal operating conditions, should the
portfolio quality deteriorate or the administrative expenses and ADB share in these
expenses increase after the MTS period, the coverage ratios will be much lower. Annex 3
provides the result of different scenarios.
14
Large balances of outstanding loans provide an important loan income basis.
Figure 3a- Projected Operational Expenses & Provisions Coverage Ratio
(Spread Analysis)
0%
50%
100%
150%
200%
250%
2009 2010 2011 2012 2013 2014 2015 2016 2017 2018 2019 2020
Operational Expenses Coverage Ratio "Base Case"
Operational Expenses & Provisions Coverage Ratio Base Case
Operational Expenses Coverage Ratio - Lending Spread 245bps
Operational Expenses & Provisions Coverage Ratio - Lending Spread 245bps
Figure 3b- Projected Operational Expenses & Provisions Coverage Ratio
(Spread Analysis)
0%
50%
100%
150%
200%
250%
2009 2010 2011 2012 2013 2014 2015 2016 2017 2018 2019 2020
Operational Expenses Coverage Ratio "Base Case"
Operational Expenses & Provisions Coverage Ratio Base Case
Operational Expenses Coverage Ratio - Lending Spread 20bps
Operational Expenses & Provisions Coverage Ratio - Lending Spread 20bps

Page | 24
5.10 In the light of the above assessment, several measures have been considered by
Management to address the issues of adequacy of charges and pricing structure. The
measures proposed could be classified into two broad categories: (i) measures to
address the principle of loan pricing flexibility; and, (ii) specific pricing adjustments to
address the current inadequacy of loan charges without jeopardizing competitiveness.
MEASURES TO ADDRESS THE PRINCIPLE OF LOAN PRICING FLEXIBILITY
Measure 1 – Periodic review of the adequacy of the lending spread for new
loans
5.11 The lending spread for new loans should be reviewed within the framework of the
Medium Term Financial Outlook of the Bank and subject to Board approval. Any
proposed changes in lending spread would only apply to those loans approved
after the annual adjustment thereby avoiding borrower concerns of retroactive
applicability. This would provide the Bank with a tool to effectively manage loan income
while protecting its intermediation capacity for the interest of the borrowers.
5.12 The review shall be based on a trigger mechanism. At this stage, one trigger
mechanism is proposed for the review of loan charges: the coverage of operating costs.
This trigger should be set at 100% minimum coverage of the operational expenses.
However, in line with the guiding principles, loan charges should cover operating as well
as capital cost and a trigger mechanism based on capital adequacy would have to be
considered in the future. This mechanism could be based on target threshold level RCUR
or equity to loan ratio.
Measure 2 - Revision of loan pricing for exceptional stress events
5.13 Lessons learned from the financial crisis, call for ensuring that stress events will
not create an undue burden on Bank’s borrowers and its limited resources. Coupled to
this factor is the recent consideration in the rating of MDBs of their flexibility to adjust
their pricing framework to unforeseen changes in their operating environment.
Furthermore, the rationale for the Bank to factor stress events in order to maintain its
long term financial sustainability is that a GCI is normally approved for longer term
period, typically an average of ten years. If at a certain point in that cycle net income
decreases significantly and becomes negative because of income losses (significant
impairments), pushing thereby RCUR to reach 100% (after passing the losses to
reserves) the Bank shall consider having a flexible and efficient tool, other than a capital
increase, to quickly respond to such crisis situations; requiring the strengthening of the
Bank’s financial position without a drastic reduction in lending operations.
5.14 Therefore, as part of the range of measures that Management and the Board may
take to protect the Bank’s balance sheet and financial integrity and to maintain its credit
AAA rating, in response to exceptional unforeseen stress events, an upward
adjustment of the price of loans signed after the date of the adoption of this policy could
15
Very sensitive to growth in outstanding and level of expenses. The increase compared to earlier projections
is attributable to a slower expected growth of outstanding balances and the projected evolution of expenses.

Page | 25
be considered for a limited time. The Board of Directors shall approve the qualification
of an event as exceptional, the related level of pricing adjustment and application period.
5.15 More importantly, such approach would reflect the strongest affirmation of
exceptionally strong shareholder commitment and support enshrined in the cooperative
nature of the Bank.
SPECIFIC MEASURES TO ADDRESS THE ADEQUACY OF LOAN CHARGE COVERAGE
Measure 3 - Upward adjustment of the lending spread for new loans
5.16 As demonstrated in the above assessment, a spread increase of 245 bps would
be required to cover operational expenses in 2011 or 100 bps in 2012. However, given
the Bank’s mandate to offer reasonable lending terms to borrowers, that are doable and
absorbable, such level would not be sustainable. Therefore, the impact of different levels
of loan charges on the Bank’s income and coverage ratios is assessed by simulating an
increase in the lending spread of 15, 20, 30 and 40 bps respectively for all new loans
approved from 2010, assuming that such increase does not impact the demand for the
Bank’s loans. Table 05 presents a summary of the results of the simulations for the
proposed measure while Table B in Annex 3 provides more details.
Table 05 – Coverage of Operational Expenses and Provisions - with an upward adjustment
of the lending spread by 20 basis points
Scenarios 2009 2010 2011 2012 2013 2014 2015 2016 2017 2018 2019 2020
Base Case Scenario
Operational
Expenses 52% 58% 68% 74% 82% 89% 94% 99% 103% 107% 111% 114%
Oper. Expenses
& Provisions 52% 48% 55% 59% 64% 69% 71% 74% 76% 78% 80% 82%
Management Proposal (20 bps increase in spread)
Operational
Expenses 52% 59% 71% 79% 91% 102% 112% 122% 131% 140% 149% 157%
Oper.Expenses
& Provisions 52% 49% 57% 63% 71% 78% 85% 91% 97% 102% 107% 112%
Sensitivity Analysis of Management Proposal
Increase in Operational Expenses 10%
Operational
Expenses 52% 54% 64% 72% 82% 93% 102% 111% 119% 128% 135% 142%
Oper. Expenses
& Provisions. 52% 45% 53% 59% 66% 73% 79% 85% 90% 95% 100% 104%
Increase in Provision 10%
Operational
Expenses 52% 59% 71% 79% 91% 102% 112% 122% 131% 140% 149% 157%
Oper. Expenses
& Provisions. 52% 44% 51% 56% 61% 67% 72% 77% 82% 86% 90% 93%

Page | 26
5.17 As shown in Table 05, an upward adjustment of 20 basis points (from 40bps to
60bps) only ensures partial coverage of the operational expenses until 2014. During this
period neither operating expenses nor provisions are covered. Full coverage of the
operational expenses will be achieved after the end of the MTS period (around 2014) and
the coverage of the expected level of provisions would only occur in the longer term
(2017). Therefore, it is important to begin to build in the recovery of provisions as the
profile of the portfolio is likely to change in the future.
5.18 Furthermore, an upward adjustment of 20 bps of the lending spread would
generate an additional cumulative net income of UA 144 million over the period 2010-
2020 (to be compared to a net income estimate of UA 150 million in 2010). The annual
incremental impact although low will slowly strengthen the Bank’s capacity to generate
internal capital resources or make prudent transfers of net income to development
initiatives while protecting the reserves. Moreover, the Bank would maintain the RCUR
below 99% until 2018 assuming a GCI of 200% with 6% Paid in Capital. More details of
this analysis are provided in Annex 4.
5.19 It can be argued that the proposed upward adjustment in lending spread would
make the Bank’s lending terms less competitive than other MDBs and the market. Table
06 shows that the Bank’s contractual spread remains in line with other MDBs16.
Table 06: Comparison of the Bank’s contractual spread with those of other MDBS after
the proposed 20 bps Adjustment
5.20 With respect to comparison vis-à-vis the market, while the cost of bond market
issuance for sovereigns has declined substantially since the peak of the crisis, they still
remain high compared to pre-financial crisis levels and compared to the Bank’s lending
margins. For example, South Africa has tapped the international capital market twice in
2009 (May and August) for 10 year funds at spreads of 370 and 215 basis points
respectively. These bonds are currently (January 2010) quoted at a spread of 170 basis
points over Libor. A commonly used market comparison is the Credit Default Swap rate
(CDS). Table 07 shows the evolution from 2003 to 2009 of the 5 year CDS spreads for
Egypt, Morocco, Tunisia and South Africa. Current spread levels are above the 60bps of
the Bank and, more importantly, the Bank offers longer maturities for its products (20
year final maturity).
16
Lending spread excluding funding margin and market risk.
ADB IBRD IADB AsDB
Flexible Loan Loan Type Variable
Spread
(VSL) Variable
Spread
(VSL)
Fixed Spread (FSL)1
Single
Currency
Facility
Libor
Based
Contractual Spread over the
Base rate 60 50 50 50 50 95 20->40

Page | 27
Table 07: 5 – year CDS of African Countries in bps
Country 2003 2004 Pre-crisis
June-2007
Crisis
March-2009
Post-Crisis
October-2009
Post-Crisis January 22,
2010
Egypt 348 166 75 650 209 254
Morocco 281 156 45 335 105 110
Tunisia 195 114 30 338 109 107
South Africa 149 105 25 524 124 149
Measure 4 - Introduction of a Graduated Commitment fee for fast disbursing
Policy Based Loans
5.21 Given the challenge of managing the Bank’s risk bearing capacity even after GCI-
VI, Management also proposes to introduce a graduated commitment fee on fast
disbursing policy based loans. The purpose of the graduated fee is to discourage
borrowers, without imposing an undue penalty, from delaying disbursements on loans
possibly contracted for precautionary purposes only, thereby using up risk capital that
could be available for other lending17. The fee would commence at 25 bps from the
scheduled disbursement date of each tranche and increase by 25 bps every six months
thereafter, to a maximum of 75 bps18, on any undrawn portion of each tranche.
In summary, these measures would translate mathematically into the loan
pricing structure presented in Table 08. The benefits of all measures proposed to
address structural issues in the Bank’s pricing framework and adequacy of loan charges
must inevitably be weighed against the impact it may have on the competitiveness of the
Bank’s lending instruments. However, priority should be given to the Bank’s financial
integrity.
Table 08: Summary of Proposed Price Adjustments
Loan
Price Measure Current Proposed
Base rate
None Libor Libor
Contractual Lending Spread
Measure 3 40 60
Funding Cost Margin
None
Based on
market
conditions
Based on
market
conditions
Commitment Fees
Measure 4 NA
25 to 75 bps
(PBLs only)
17
The average length of disbursement of Policy Based Loans in ADB’s Portfolio is 1.9 years. 18 75 bps was the fee applied before the cancellation of commitment fees. .

Page | 28
VI. CONCLUSION AND RECOMMENDATIONS
6.1 The Bank is better prepared than ever before to play a leading role in assisting
RMCs to achieve their development goals. Since 1999 there has been considerable
progress in enhancing the Bank’s loan products and intermediation capacity. Moving
forward, in order to strengthen the Bank’s financial capacity while responding to the
growing RMC needs, a flexible price recovery mechanism for the sovereign guaranteed
lending is paramount.
6.2 In this regard, Management has reviewed the current loan pricing structure and
makes the following recommendations:
MEASURES TO ADDRESS THE PRINCIPLE OF LOAN PRICING FLEXIBILITY
• Measure 1 - Review of the adequacy of the lending spread for new loans
A review of the adequacy of the lending spread for new loans should be
performed within the framework of the Medium Term Financial Outlook of the
Bank. If the lending spread does not cover 100% of operational expenses -which
will be a trigger mechanism-, Management will make a formal proposal of
adjustment to the Board if deemed necessary.
• Measure 2 - Revision of loan pricing for exceptional stress events
As part of the range of measures that Management and the Board may take to
protect the Bank’s balance sheet and financial integrity and to maintain its credit
AAA rating, in response to exceptional unforeseen stress events, an upward
adjustment of the price of loans signed after the date of the adoption of this
policy could be considered for a limited time. The Board of Directors shall
approve the qualification of an event as exceptional, the related level of pricing
adjustment and application period.
SPECIFIC MEASURES TO ADDRESS THE ADEQUACY OF LOAN CHARGE COVERAGE
• Measure 3 - Upward adjustment of the lending spread for new loans
Given that medium term income prospects indicate that the Bank is unlikely to
fully recover its operating costs and provisions, the current spread should be
adjusted upwards to protect the Bank’s balance sheet. Management proposes an
increase in the current spread by 20 basis points in 2010, which would bring the
contractual spread from 40 to 60 basis points.
Although this will only achieve partial coverage of operational expenses in the
short term, it would enable full coverage of operational expenses after the end of
the MTS period (around 2014) and coverage of the expected level of provisions
by 2017. If in future years the Bank’s financial condition improves a downward
adjustment could be considered by the Board to ease financial burden on
borrowers.

Page | 29
• Measure 4 - Introduction of a Graduated Commitment fee for fast
disbursing Policy Based Loans
Management proposes to introduce a graduated commitment fee ranging from 25
bps to 75 bps on fast disbursing policy based loans made for precautionary
lending that freeze risk capital if not disbursed.
Page | 30
ANNEX 1
The Bank’s Loan Pricing Framework
Non-Market Based loans Market Based Loans
Old Fixed
Rate
Multi-currency
Pool Based VLR
Single
Currency
VLR
Floating
Rate
Fixed Rate
Loan
Variable
Spread
Loan19
PERIOD (1967-1990) (1990-1997) (1997-2009) (1997-2009) (1997-2009) (2009-2010)
Reference Market
Rate
Average
Cost of
Funds20
Average cost of
Pool of
Borrowings
Average
cost of
Pool of
Borrowings
6 month
reference
rate in the
lending
currency
(e.g. Libor)
Fixed
amortizing
swap
rate vs
Libor
Libor
SPREADS
Contractual Lending
Spread SG only21
50 50 – 40 50-40 50-40 50-40 40
Funding Cost Margin
NA Average cost of
the Pool4
Average
cost of
the Pool22
Average
cost of
Pool of
Borrowings
vs Libor23
Average
cost of
Pool of
Borrowings
vs Libor
Average
cost of
Pool of
Borrowings
vs Libor
Market Risk Premium
NA NA NA NA
1 bp per
year of
maturity of
loan
NA
Credit Risk Premium
NSG only N/A NSG only NSG only NSG only NSG only NSG only
CHARGES
Front-end fee
N/A N/A N/A N/A N/A N/A
Commitment Fees24
75-100 bps 75-100 bps 75-100 bps 75-100 bps 75-100 bps N/A
Statutory
Commission 100 bps
25
19 Introduced in 21-Jan-2009 20
Initially the cost of funds was based on subscriptions, reserves and borrowings (actual plus estimate for the following
year) but was changed in 1985 to be based on the cost of borrowed funds alone (actual and estimate for the following
year) 21
Since May-2005, the Bank’s lending rate is set at 40 bps. A waiver of 20 bps was introduce in Jun-08 and suspended on
21-Jan-09 22
Included in the calculation of the base interest rate 23
Suspended in May-2005 24
Exclusive of 50bps waiver; commitment fee was eliminated since May-2005 25
Abolished in the mid-1980s

Page | 31
ANNEX 2
HISTORICAL PERSPECTIVE OF THE BANK’S LOAN PRODUCTS
Fixed Rate Loan Products to 1990
1 Until 1990, fixed rate loans were the only lending instruments offered by the
Bank and these were primarily funded from the available equity capital. The primary
objective of the lending rate was to fulfill development objectives while covering
operating expenses.
2 As lending operations expanded, the Bank depended more on borrowings and its
financial strength in the capital markets became important. A lending rate methodology
was therefore established in July 1982 when a borrowing cost-plus approach26 was
adopted for the determination of the lending rate. The Bank lending rate consisted of a
base rate27 plus a 50 basis points lending spread28 which was fixed for the entire life of
the loan. A commitment fee on undisbursed loans of 75 bps commencing from 90 days
after commitment was applied to account for the time lag between commitments and
disbursements. These were later adjusted to 100 bps and 45 days. The loan pricing
principle was both cost pass through and coverage of administrative expenses. The fixed
rate loan methodology achieved two objectives: competitiveness vis-à-vis the World
Bank and an adequate level of income.
3 While the fixed rate loan gave stability and predictability to borrowers it exposed
the Bank to increased interest rate risk at a time of increased reliance on borrowings to
fund lending operations, primarily due to: (i) lending rates were fixed from the time of
loan commitment; (ii) the substantial time lag between the loan commitment date and
the final disbursement; and (iii) the wide maturity mismatch between loans averaging 15
to 20 years and borrowings generally not exceeding 10 years.
4 Management therefore explored alternative options to the Bank’s lending rate
methodology, including the pool-based variable lending rate system that had just been
implemented by the IBRD.
Pool-Based Variable Rate Loan Products 1990 - 1997
5 Resulting from the weaknesses inherent to the fixed rate loans highlighted above,
in July 1990 the Bank introduced the multi currency pool based variable rate loan to
enable a better cost pass between borrowing costs and lending terms and to allow for
maximum funding flexibility.
26
ADB/BD/WP/87/136, Section 20. 27
The base lending rate is obtained by computing the borrowing costs as the average of actual borrowings for the
preceding 12 months and the projected future 12 months borrowings 28
The spread or recovery rate of 50 basis points was determined after establishing that there was a high degree of
correlation between the annual administrative expenditure and cumulative commitments. It is also important to note that
the 50 bps lending spread for the coverage of administrative expenses was implemented consistently by all MDBs, namely
IBRD, IADB and AsDB, in their lending rate methodology at that time.

Page | 32
6 The key feature of pool-based loans is that the lending rate is primarily based on
the average funding cost of a qualified29 pool of borrowings. The lending rate is obtained
by adding a fixed lending spread of 50 basis points to the average cost of the pool of
qualified borrowings (determined twice a year).
7 The main objectives achieved through the pool-based loans were: (i) stability of
lending rates, (ii) increased equity for borrowers and (iii) increased flexibility in the
funding strategy.
8 While the objectives of the pool based loan system were laudable, fundamental
practical weaknesses emerged over time: (i) Pool-based rates can sometimes differ
significantly from market rates, especially following a sharp decrease in interest rates
when pool-based rates remain high, while market rates are much lower; (ii) the multi
currency loan pooling system was intended to spread the exchange risk equally across
borrowers and improve the management of currency risk for borrowers, they were still
charged the same composite lending rate; (iii) the Bank tended to disburse low interest
rate currencies to borrowers and retained high interest rate currencies in the liquidity
portfolio which consequently increased the effective cost of borrowing from the Bank.
9 Given the weaknesses of the multi currency pool based loan product,
Management sought to identify solutions for this product and to broaden the menu of
loan products in order to enable borrowers to select currency and interest rate exposures
that were more suitable to their individual debt service capacities.
Table 01: Characteristics of Market Based Loan Products Introduced in October 1997
Loan Products Features of the Loan Products
Single Currency Variable Rate Loan
Single Currency Floating Rate Loan
Single Currency Fixed Rate loans
Base rate VLR Libor Libor/Swap rate
Funding Margin Included in the Base
Rate Applicable
Applicable
Lending Spread 50bps 50bps 50bps
Commitment Fees 75-100 bps (exclusive of waiver)
Front-end Fee Not Applicable
Reset Period 1-Jan; 1-Jul 1-Feb; 1-Aug 1-Feb; 1-Aug (before
rate fixing)
Type of borrowers targeted Sovereign guaranteed borrowers (Middle Income Countries)
The Bank’s current Market Based Loan Products 1997 To Date
10 In 1997 Management undertook a complete review of the Bank’s lending products
and proposed: (i) the replacement of the multi currency variable rate product with single
currency products with alternative interest rate bases (variable, floating and fixed) and
29
The calculation of the average cost of the pool of borrowings involves aggregating all accrued financial expenses, i.e.
interest and amortization of discount or premium and other issuances expenses, over the six month period and dividing
this figure by the average daily balance of outstanding borrowings in the pool during this period.

Page | 33
also authorized borrowers to convert their multi currency variable rate loans to the terms
of the new single currency variable loan; (ii) single currency LIBOR based loans and fixed
rate loans to ensure that borrowers can benefit from lending terms close to prevailing
market rates. The key features of these products are summarized in Table 01 above.
11 These products were designed to reflect market-based features providing
flexibility, a transparent comparative basis with those of other lenders operating in the
continent and to be amendable to efficient intermediation. The pricing structure of the
three new loan products remained unchanged from previous loan products as follows:
Lending Rate= Base Rate + Funding margin + Lending spread
12 The guiding principles in structuring the range of market based loan products
were: flexibility for the borrowers, low intermediation risk30 (avoiding interest rate and
currency risk), minimum cost recovery and predictability of loan charges. The financial
risks and the costs associated with borrowers’ choice should not affect other borrowers’
or the Bank’s net income position. Further, the traditional cost “pass through” pricing
was to be maintained so that the Bank can earn its basic lending spread and nothing
more under all circumstances.
13 It is important to note that the lending margin for sovereign guaranteed loans
(SG) is 50 basis points and is fixed in the loan agreement at the time of loan signing (or
disbursement), irrespective of the loan currency.
14 It is important to note that the lending margin itself does not take into account
the sub-libor funding cost margin (i.e. that because of the Bank’s high credit standing
and triple AAA rating it could fund itself at a cost lower than the six-month LIBOR). To
ensure a full cost pass through pricing, the Bank returns the sub-Libor funding cost to
the borrower through a funding margin which may result in a surcharge if the Bank’s
funding cost rises above six-month LIBOR.
Changes and simplification of the pricing structure in January 2005
15 In January 2005, in the face of declining lending volumes and lower credit
spreads in the financial markets, the Bank adjusted the pricing of market based loan
products for the first time since their introduction. This change arose from three sources:
(i) the large range of financing options offered by other multilateral institutions as well
as domestic and international capital markets; (ii) the internal constraints faced by the
Bank related to shortcomings in planning and programming, competitiveness of the
range of the Bank’s product offering and rigidity in lending processes and conditionality;
and (iii) the evolution in the needs and preferences of borrowers.
16 An over-riding rationale behind these changes was a call from borrowers for
simple, transparent and less rigid lending terms. In order to better understand the needs
of borrowers and qualitatively improve its support to their development efforts, the Bank
reviewed the entire set of products and processes of lending and non lending support to
30
The financial risks and the costs associated with borrowers’ choices should not affect other borrowers’ or the
Bank’s net income position.
Page | 34
respond to the issues outlined above. One of the main thrusts of this review was to
revise the Bank’s loan pricing through a set of measures:
• Simplify the pricing for sovereign borrowers with two actions: 1) eliminate the
Variable Spread Loan with the suppression of the funding margin for all new
sovereign loans and 2) decrease the lending spread from 50 bps to 40 bps
• Eliminate the market risk premium of one basis point per year of maturity of the
loan for all new fixed rate sovereign and non sovereign loans in order to make the
fixed rate loans more attractive to borrowers which relied with the Bank’s interest
rate strategy.
• Eliminate the commitment fee for all new sovereign guaranteed loans to reduce
its financial impact and expand the range of the commitment fees for non-
sovereign guaranteed operations from 0.5%-1% to 0%-1%.
17 This simplification of the loan pricing structure resulted in a single lending product
known as the Fixed Spread Loan with a simple pricing based on a fixed spread of 40
basis points over Libor and no other charges. The objective was to strike a balance
between simplicity and accuracy and to have a positive impact on client perceptions as
well as aligning sovereign and non-sovereign pricing structures. In addition, any
refinancing risks associated with the elimination of the funding margin would be borne
by the Bank and not the borrower.
Introduction of a 20 bps waiver on the lending spread in June 2008
18 The Bank still faced challenges to meet its development objectives in a large
portion of MICs. In 2008, MICs expressed their desire to see the Bank enhance its
support for growth, poverty reduction and development.
19 Given the Bank’s income prospects that allow some flexibility and following its
key objectives to provide better lending terms and financial products to MICs, the Board
approved the introduction of a lending margin waiver expected to be reviewed annually.
This lending margin waiver was set at 20 basis points or 0.2%, bringing the Bank’s
effective pricing for sovereign and sovereign guaranteed operations to Libor plus 20
basis points. The waiver was applicable as follows: (i) to all new sovereign guaranteed
loans approved by the Board and resulted in a reduction of the lending margin applicable
during their entire life; and (ii) Any future modification of the lending margin waiver will
only affect subsequent loan approvals.
Key changes in pricing and loan products in January 2009
20 In January 2009 the Bank revised the financial terms and conditions offered to its
clients. The increase in the refinancing risk associated with the FSL prompted a revision
of the current financial products and pricing conditions. Therefore, the Bank reviewed the
loan pricing in order to ensure full cost pass through to its clients guaranteeing the
Bank’s loan income.
• Maintain the lending margin at 40 basis points;

Page | 35
• Temporary suspension of the interest rate waiver of 20 basis points associated
with the floating and fixed rate loan with fixed lending spread.
• Maintain the zero front end and commitment fee policy decided in 2005.
• Temporary suspension of fixed spread loan products for new commitments given
the lack of visibility about the duration and the magnitude of the impact of the
crisis on the Bank’s funding conditions.
• Re-introduction of a Variable Spread loan
21 Currently, the only Bank’s standard loan product for the sovereign guaranteed
borrowers is the Enhanced Variable Spread Loan (EVSL) approved by the Board on
December 9th 2009.
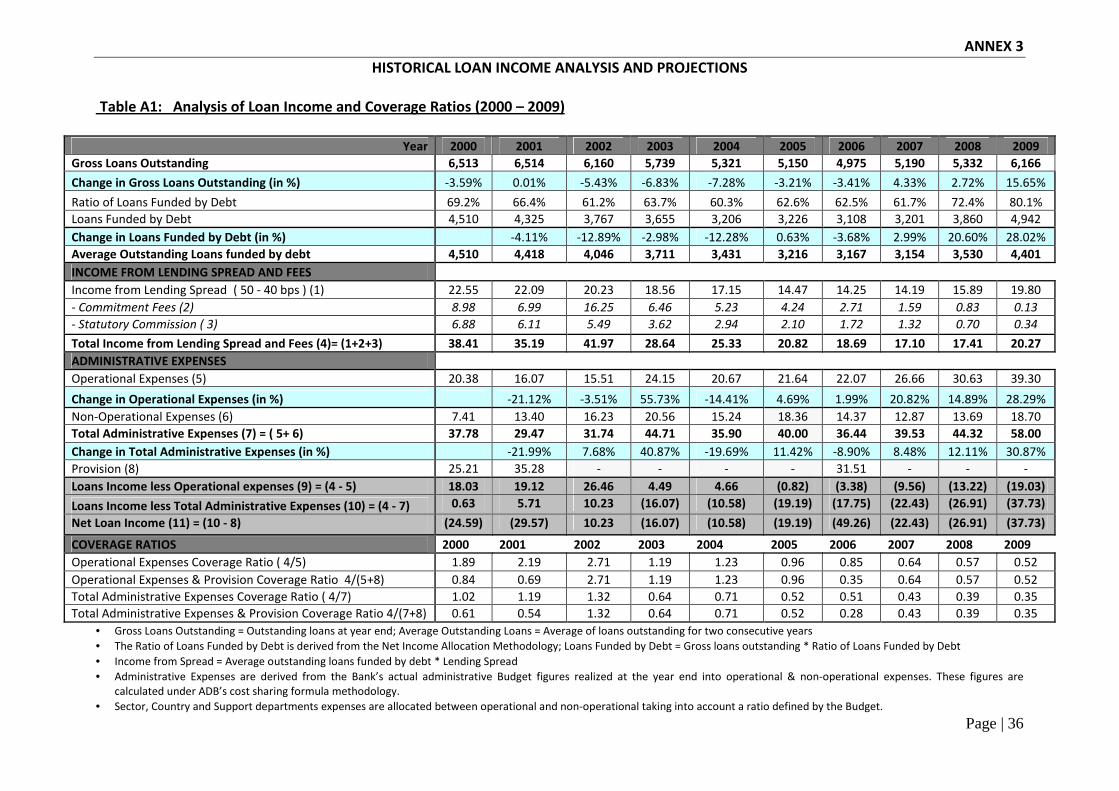
Page | 36
ANNEX 3
HISTORICAL LOAN INCOME ANALYSIS AND PROJECTIONS
Table A1: Analysis of Loan Income and Coverage Ratios (2000 – 2009)
Year 2000 2001 2002 2003 2004 2005 2006 2007 2008 2009
Gross Loans Outstanding 6,513 6,514 6,160 5,739 5,321 5,150 4,975 5,190 5,332 6,166
Change in Gross Loans Outstanding (in %) -3.59% 0.01% -5.43% -6.83% -7.28% -3.21% -3.41% 4.33% 2.72% 15.65%
Ratio of Loans Funded by Debt 69.2% 66.4% 61.2% 63.7% 60.3% 62.6% 62.5% 61.7% 72.4% 80.1%
Loans Funded by Debt 4,510 4,325 3,767 3,655 3,206 3,226 3,108 3,201 3,860 4,942
Change in Loans Funded by Debt (in %) -4.11% -12.89% -2.98% -12.28% 0.63% -3.68% 2.99% 20.60% 28.02%
Average Outstanding Loans funded by debt 4,510 4,418 4,046 3,711 3,431 3,216 3,167 3,154 3,530 4,401
INCOME FROM LENDING SPREAD AND FEES
Income from Lending Spread ( 50 - 40 bps ) (1) 22.55 22.09 20.23 18.56 17.15 14.47 14.25 14.19 15.89 19.80
- Commitment Fees (2) 8.98 6.99 16.25 6.46 5.23 4.24 2.71 1.59 0.83 0.13
- Statutory Commission ( 3) 6.88 6.11 5.49 3.62 2.94 2.10 1.72 1.32 0.70 0.34
Total Income from Lending Spread and Fees (4)= (1+2+3) 38.41 35.19 41.97 28.64 25.33 20.82 18.69 17.10 17.41 20.27
ADMINISTRATIVE EXPENSES
Operational Expenses (5) 20.38 16.07 15.51 24.15 20.67 21.64 22.07 26.66 30.63 39.30
Change in Operational Expenses (in %) -21.12% -3.51% 55.73% -14.41% 4.69% 1.99% 20.82% 14.89% 28.29%
Non-Operational Expenses (6) 7.41 13.40 16.23 20.56 15.24 18.36 14.37 12.87 13.69 18.70
Total Administrative Expenses (7) = ( 5+ 6) 37.78 29.47 31.74 44.71 35.90 40.00 36.44 39.53 44.32 58.00
Change in Total Administrative Expenses (in %) -21.99% 7.68% 40.87% -19.69% 11.42% -8.90% 8.48% 12.11% 30.87%
Provision (8) 25.21 35.28 - - - - 31.51 - - -
Loans Income less Operational expenses (9) = (4 - 5) 18.03 19.12 26.46 4.49 4.66 (0.82) (3.38) (9.56) (13.22) (19.03)
Loans Income less Total Administrative Expenses (10) = (4 - 7) 0.63 5.71 10.23 (16.07) (10.58) (19.19) (17.75) (22.43) (26.91) (37.73)
Net Loan Income (11) = (10 - 8) (24.59) (29.57) 10.23 (16.07) (10.58) (19.19) (49.26) (22.43) (26.91) (37.73)
COVERAGE RATIOS 2000 2001 2002 2003 2004 2005 2006 2007 2008 2009
Operational Expenses Coverage Ratio ( 4/5) 1.89 2.19 2.71 1.19 1.23 0.96 0.85 0.64 0.57 0.52
Operational Expenses & Provision Coverage Ratio 4/(5+8) 0.84 0.69 2.71 1.19 1.23 0.96 0.35 0.64 0.57 0.52
Total Administrative Expenses Coverage Ratio ( 4/7) 1.02 1.19 1.32 0.64 0.71 0.52 0.51 0.43 0.39 0.35
Total Administrative Expenses & Provision Coverage Ratio 4/(7+8) 0.61 0.54 1.32 0.64 0.71 0.52 0.28 0.43 0.39 0.35
• Gross Loans Outstanding = Outstanding loans at year end; Average Outstanding Loans = Average of loans outstanding for two consecutive years
• The Ratio of Loans Funded by Debt is derived from the Net Income Allocation Methodology; Loans Funded by Debt = Gross loans outstanding * Ratio of Loans Funded by Debt
• Income from Spread = Average outstanding loans funded by debt * Lending Spread
• Administrative Expenses are derived from the Bank’s actual administrative Budget figures realized at the year end into operational & non-operational expenses. These figures are
calculated under ADB’s cost sharing formula methodology.
• Sector, Country and Support departments expenses are allocated between operational and non-operational taking into account a ratio defined by the Budget.

Page | 37
Table A2: Analysis of Loan Income and Coverage Ratios (2010 – 2020)
Year 2010 2011 2012 2013 2014 2015 2016 2017 2018 2019 2020
Gross Loans Outstanding 8,117 9,399 10,472 11,892 12,849 14,005 15,207 16,420 17,692 18,970 20,276
Change in Gross Loans Outstanding (in %) 31.64% 15.80% 11.42% 13.56% 8.04% 9.00% 8.59% 7.97% 7.74% 7.23% 6.88%
Ratio of Loans Funded by Debt 83.5% 86.3% 88.9% 91.0% 92.4% 93.2% 93.7% 93.89% 93.93% 93.87% 93.89%
Loans Funded by Debt 6,779 8,114 9,306 10,821 11,867 13,056 14,246 15,417 16,617 17,808 19,036
Change in Loans Funded by Debt (in %) 37.17% 19.70% 14.70% 16.27% 9.67% 10.01% 9.12% 8.22% 7.79% 7.17% 6.90%
Average Outstanding Loans funded by debt 5,860 7,446 8,710 10,064 11,344 12,462 13,651 14,831 16,017 17,212 18,422
INCOME FROM LENDING SPREAD AND FEES
Income from Lending Spread ( 50 - 40 bps ) (1) 26.42 33.18 38.52 44.14 49.25 53.49 57.98 62.41 66.83 71.30 75.84
- Commitment Fees (2) 0.13 0.13 0.13 0.13 0.13 0.13 0.13 0.13 0.13 0.13 0.13
- Statutory Commission ( 3) 0.34 0.34 0.34 0.34 0.34 0.34 0.34 0.34 0.34 0.34 0.34
Total Income from Lending Spread and Fees (4)= (1+2+3) 26.89 33.65 38.99 44.61 49.72 53.96 58.45 62.88 67.30 71.77 76.31
ADMINISTRATIVE EXPENSES
Operational Expenses (5) 46.26 49.49 52.70 54.28 55.91 57.59 59.32 61.10 62.93 64.82 66.76
Change in Operational Expenses (in %) 17.70% 6.99% 6.49% 3.00% 3.00% 3.00% 3.00% 3.00% 3.00% 3.00% 3.00%
Non-Operational Expenses (6) 21.82 22.68 23.72 24.43 25.17 25.92 26.70 27.50 28.33 29.17 30.05
Total Administrative Expenses (7) = ( 5+ 6) 68.07 72.17 76.43 78.72 81.08 83.51 86.02 88.60 91.26 93.99 96.81
Change in Total Administrative Expenses (in %) 17.36% 6.02% 5.90% 3.00% 3.00% 3.00% 3.00% 3.00% 3.00% 3.00% 3.00%
Provision (8) 9.49 11.36 13.03 15.15 16.61 18.28 19.94 21.58 23.26 24.93 26.65
Loans Income less Operational expenses (9) = (4 - 5) (19.37) (15.84) (13.71) (9.68) (6.19) (3.63) (0.87) 1.78 4.37 6.95 9.55
Loans Income less Total Administrative Expenses (10) = (4 - 7) (41.19) (38.52) (37.44) (34.11) (31.36) (29.55) (27.56) (25.72) (23.95) (22.22) (20.50)
Net Loan Income (11) = (10 - 8) (50.68) (49.88) (50.47) (49.26) (47.98) (47.83) (47.51) (47.30) (47.22) (47.15) (47.15)
COVERAGE RATIOS
Operational Expenses Coverage Ratio ( 4/5) 0.58 0.68 0.74 0.82 0.89 0.94 0.99 1.03 1.07 1.11 1.14
Operational Expenses & Provision Coverage Ratio 4/(5+8) 0.48 0.55 0.59 0.64 0.69 0.71 0.74 0.76 0.78 0.80 0.82
Total Administrative Expenses Coverage Ratio ( 4/7) 0.39 0.47 0.51 0.57 0.61 0.65 0.68 0.71 0.74 0.76 0.79
Total Administrative Expenses & Provision Coverage Ratio 4/(7+8) 0.35 0.40 0.44 0.48 0.51 0.53 0.55 0.57 0.59 0.60 0.62
• Projected loan approvals are based on the MTS assumptions and thereafter 5% increase is assumed based on the expected economic growth in RMCs.
• Budgeted expenses are considered for 2010-2012 while a 3% increase due to the inflation effect has been taken into account for the remaining period.
• The projected provisioning level ( 14 bps of outstanding loans) is based on the historical provisioning (2000- 2006) excluding of write back.

Page | 38
Graph Annex 3- Total Administrative Expenses Coverage and Operational Expenses Coverage Ratios from 2000 to 2020
Coverage of Expenses 2000-2020
0.00%
50.00%
100.00%
150.00%
200.00%
250.00%
300.00%
2000 2001 2002 2003 2004 2005 2006 2007 2008 2009 2010 2011 2012 2013 2014 2015 2016 2017 2018 2019 2020
Income from Loans/ Operational ExpensesAverage Operational Expenses Coverage Ratio (2000-2020)100% CoverageAverage Total Admin Expenses Coverage Ratio (2000-2020)Income from Loans/Total Admin Expenses

Page | 39
Table B: Projected Net Loans Income Analysis – Operational expenses only (2010 – 2020)
Base Case Stress Test
Changes in Operational
Expenses
Changes in
Operational
Expenses with
Change in Cost
Sharing Formula
Changes in
Provisioning Year
Change in Leading
Spread
Net Loan Income
(Loan Income –
Operational Expenses
–Provisions)
+10% +18.5% +10%
+15bps (28.6) (33.2) (37.14) (35.4)
+20bps (28.5) (33.1) (37.04) (35.3)
+30bps (28.3) (32.9) (36.85) (35.1) 2010
+40bps (28.1) (32.7) (36.66) (34.9)
+15bps (26.2) (31.2) (35.38) (34.3)
+20bps (25.9) (30.9) (35.06) (34.0)
+30bps (25.3) (30.2) (34.41) (33.4) 2011
+40bps (24.6) (29.6) (33.77) (32.7)
+15bps (24.7) (30.0) (34.47) (32.2)
+20bps (24.0) (29.3) (33.79) (33.3)
+30bps (22.7) (28.0) (32.44) (32.0) 2012
+40bps (21.3) (26.6) (31.09) (30.6)
+15bps (21.4) (26.8) (31.42) (29.3)
+20bps (20.2) (25.7) (30.27) (31.0)
+30bps (15.6) (23.3) (27.96) (28.7) 2013
+40bps (15.6) (21.0) (25.66) (26.4)
+15bps (17.4) (23.0) (27.75) (27.2)
+20bps (15.6) (21.2) (25.95) (27.5)
+30bps (12.0) (17.6) (22.35) (23.9) 2014
+40bps (8.4) (14.0) (18.75) (20.3)
+15bps (14.1) (19.9) (24.80) (22.2)
+20bps (11.6) (17.3) (22.21) (24.6)
+30bps (6.4) (12.1) (17.04) (19.4) 2015
+40bps (1.2) (7.0) (11.86) (14.3)
+15bps (10.5) (16.4) (21.45) (19.8)
+20bps (7.0) (13.0) (18.00) (21.3)
+25bps (0.1) (6.1) (11.11) (14.4) 2016
+40bps 6.8 0.8 (4.22) (7.5)
+15bps (6.8) (12.9) (18.11) (17.3)
+20bps (2.5) (8.6) (13.78) (17.9)
+30bps 6.2 0.1 (5.12) (9.2) 2017
+40bps 14.8 8.7 3.54 (0.6)
+15bps (3.2) (9.5) (14.81) (35.3)
+20bps 2.1 (4.2) (9.57) (14.5)
+30bps 12.6 6.3 0.92 (4.1) 2018
+40bps 23.0 16.8 11.40 6.4
+15bps 0.5 (6.0) (11.51) (34.0)
+20bps 6.6 0.2 (5.35) (11.2)
+30bps 18.9 12.5 6.95 1.1 2019
+40bps 31.3 24.8 19.26 13.4
+15bps 4.1 (2.6) (8.29) (15.0)
+20bps 11.1 4.4 (1.23) (7.9)
+30bps 25.2 18.6 12.88 6.2 2020
+40bps 39.3 32.7 26.99 20.3
.

Page | 40
ANNEX 4
Lending Spread Adjustment- Impact on Net Income and RCUR Different simulations have been run to assess the impact of the increase in the Bank’s lending spread on the Risk Capital Utilization Rate (RCUR) and Net Income assuming a 200% capital increase with 6% paid in capital in 2011. As shown in Table C below, a minimum increase of 53 bps in the Bank’s lending spread is required to maintain the RCUR below the 100% limit up to the end of GCI-VI period in 2020. With an increase of 20 bps, the RCUR would be maintained below the 100% limit until 2018. Such increase would also improve the Bank’s risk bearing capacity by a cumulative amount of UA 144 million in 2020.
Table C – Projected Bank’s RCUR and Net Income from 2010-2020
RCUR - With GCI 2010 2011 2012 2013 2014 2015 2016 2017 2018 2019 2020
Base Case 68.2% 77.8% 85.1% 91.0% 95.1% 98.2% 99.8% 100.6% 100.2% 102.4% 103.9%
+20 bps 68.2% 77.8% 85.0% 90.9% 94.9% 97.8% 99.3% 99.8% 99.2% 101.2% 102.4%
+30 bps 68.2% 77.8% 85.0% 90.8% 94.7% 97.6% 99.0% 99.4% 98.8% 100.6% 101.6%
+53 bps 68% 78% 85% 91% 94% 97% 98.3% 98.6% 97.7% 99% 100%
Net Income 2010 2011 2012 2013 2014 2015 2016 2017 2018 2019 2020
Base Case 150 178 201 256 307 356 396 417 437 450 472
+20 bps 151 180 204 262 315 367 411 436 460 477 503
+30 bps 151 181 206 264 319 373 419 445 472 491 519
+53 bps 151 182 210 270 329 386 437 468 499 522 555
Cumulative increase of
+20bps +2 +5 +10 +18 +29 +44 +63 +86 +113 +144

Page | 41
Glossary Currencies: The Bank may finance a project in one or several currencies
approved as lending currencies - currently USD, EUR, JPY and ZAR. In
principle, the Bank can also consider lending in other currencies in which it
can fund itself efficiently and for which there is sufficient demand.
Disbursements, principal repayments and all loan charges are
denominated in the loan currency chosen by the borrower
Loan Maturity: The Bank provides long-term financing to suit the needs of its
borrowers; Sovereign Guaranteed Loans may have a maximum maturity
of up to 20 years, inclusive of the grace period. Maturity restrictions may
apply to certain currencies and product types, depending on market
conditions.
Grace period: Grace periods are dependent on the specific characteristics of the
project and the time required for its implementation, but should generally
not exceed 5 years. In exceptional cases, grace periods longer than 5
years may be considered subject to satisfactory justification of project
requirements by the borrower. The grace period starts from the date of
signature of the loan agreement.
Interest Rate terms: Interest rates on Bank loans are expressed as nominal rates.
Interest and any other charges are computed on the basis of the actual
number of days elapsed and a 365-day year.
The Bank provides several alternative interest rate mechanisms:
a-For Enhanced Variable Spread Loans, the applicable rate of interest is
the sum of three components – the chosen base rate with a free fixing
option plus a lending margin (or spread) plus a funding margin.
b-For Fixed Spread Loans31, the applicable rate of interest is the sum of
two components – the chosen base rate plus the lending margin.
Base Rate: To provide its borrowers with the flexibility to match the interest
rate structure of their loans with their individual financial needs, the Bank
offers three principal structures for the base lending rate: floating base
rate, fixed base rate, and variable base rate.
Floating Base Rate:The floating base rate is determined for each loan currency and
reset frequency based on the Bank’s selected reference interest rate in
each market. For USD and JPY, the Bank’s standard floating base rate is
6-month Libor, while for EUR 6-month Euribor is used; these rates reset
31 The Fixed Spread Loan product is currently temporarily suspended.

Page | 42
semi-annually (value February 1 and August 1). For ZAR, the Bank’s
standard floating base rate is 3-month Jibar; this rate resets quarterly
(value February 1, May 1, August 1 and November 1).
Fixed Base Rate: The principal feature of the fixed base rate is that it remains fixed
for the life of the loan. However, because loans are generally disbursed in
several tranches and the rate applicable to each loan tranche is fixed
independently, a loan with a fixed base rate is usually initially composed of
several tranches each with a different fixed base rate. The fixed base rate
for each loan tranche is computed by the Bank as the inter-bank swap
market rate corresponding to the principal amortization schedule of that
tranche. When the disbursement of a loan is complete, the Bank gives its
borrowers the option to consolidate multiple loan tranches into a single
equivalent structure to simplify the future administration of the loan.
Variable Base rate: The variable base rate uses the Bank’s historical average cost of
funding of designated pool of borrowings in each currency as its reference.
It is adjusted semiannually on January 1 and July 1. Unlike the floating
base rate, which closely follows market interest rates, the Bank’s variable
base rate adjusts very slowly to changes in market interest rates.
Funding Margin32: The funding margin is the semester weighted average of the
currency-specific cost spread relative to Libor/Euribor/ Jibar of the Bank
debt allocated to fund all single currency floating rate loans in the loan
currency. It is computed twice a year, for value 1 January, 1 July, based
on allocated borrowings in the semester ending 31 December and 30 June.
Lending Margin: The lending margin is a rate premium expressed as a nominal
interest, determined by the Bank and is independent of the base rate
chosen; it remains unchanged throughout the life of the loan.
Front-End Fee: The front-end fee is designed to partially compensate the
Bank for the costs associated with processing a loan request and
preparation of the documentation for loan approval. It is only charged on
an approved loan. It is not reimbursed if the loan is subsequently
cancelled. The front-end fee is a percentage of the loan amount. The fee is
payable before or at loan signature, however when market and/or
conditions warrant, the frontend fee may be paid up to thirty (30) days
after loan signature or as agreed among co financiers in co-financed
projects.
Commitment Fee: The commitment is a charge that the Bank’s applies to the
borrowers for holding a loan available. The commitment fee starts to
32
The funding margin is only applicable for variable spread loans products

Page | 43
accrue at future date after loan signature. The commitment fee is payable
on each payment date.
Premium: The premium is based on current market interest rates, loan
interest rate and repayment structure of the remaining term of the loan.
The premium will reflect the Bank’s cost of redeploying the prepaid funds
or unwinding the hedging transactions attached to the loan.
Credit Default Swap:A Credit Default Swap is a financial instrument used to transfer
the risk of default of a borrower to a third party entity. In the context of
the Bank’s activity, such product can be used not for an insurance purpose
but more to release the risk capital used by a country.
Risk Capital Utilization Rate (RCUR): The RCUR is the risk based limit which caps the
total risk assumed by the Bank through all its operations (lending, funding,
investment and other operational activities) to the total available risk
capital (Paid-in Capital plus Reserves).
Structure of the Bank’s operating costs: The bank’s operating costs comprise of
operational and non operational expenses.
Non-operational Expenses: The non operational expenses are the costs associated
with other institutional programs not directly linked to operations
Operational Expenses: The operational expenses are composed of two groups of
expenses; (i) direct lending cost i.e. expenses directly linked to lending
operations (direct financing of project cycle activities having one to one
relationship with lending); non-lending services (Analytical works,
ESW&CSP and activities to maintain relationships with borrowing
countries); and cost associated with cross cutting issues or provision of
global/regional public goods; (ii) lending support cost that are associated
with legal, treasury, disbursements, billing, procurement and post
evaluation etc.
Expected Losses: Expected losses are the statistically probable level of losses
associated with a given risk class. They represent a cost of doing business
and are generally expected to be absorbed by operating income.
Cost-Pass-Through: The cost-pass-through principle lead the Bank to adjust its
menu of products with a view to ensuring a full pass through of its
borrowing costs to its clients, thereby safeguarding its financial integrity
and its ability to remain a stable source of long term funding

Page | 44
Impairment: Under the IAS 39, a financial asset/group of financial assets is
impaired and impairment losses are incurred if, and only if: (i) there is
objective evidence of impairment as a result of one or more events that
occurred after the initial recognition of the asset (a “loss event”); and (ii)
the loss event/events has an impact on the estimated future cash flows of
the financial asset/group of financial assets that can be reliably estimated.