property & construction cost guide 2017 final.indd - …€¦ · offering global expertise and...
TRANSCRIPT

Offering global expertise and tailored local solutions in more than 150 countries
aecom.com @aecom
AFRICA PROPERTY & CONSTRUCTION COST GUIDE 2017

AFRICA PROPERTY & CONSTRUCTION COST GUIDE 2017
28th EDITION © 2017 ISBN 978-0-620-75735-5
© AECOM SA (Pty) Limited. All rights reserved.

To learn more about how AECOM is delivering a better world go to: www.aecom.com
Get our: Without Limits App
Also follow us on:
Twitter: @aecom


ContentsMessage by AECOM Project Cost Consulting Director 06
Section 01 Built to Deliver a Better World 08 Our Core Values 09 Safety First 10 Quality Excellence 11 Africa has Risen 12 Improving Lives 13 Global Unite 14 Building Information Modelling 16 Sustainability 19 Research Support 21 Section 02 Our Services 22 Quantity Surveying/Cost Management 22 Engineering Cost Management 25 Building Services Cost Management 26 Section 03 AECOM in South Africa 28 Broad-Based Black Economic Empowerment 28 Section 04 South African Cost Data 29 Key Factors Influencing Building Cost Rates 29 Approximate Inclusive Building Cost Rates 34 Section 05 Global Sentiment and Building Costs 43 Africa Outlook 43 Africa in Figures 45 Africa Building Costs 49 Global Building Costs 51 Section 06 International Prestigious Office Rental Comparison 53 Section 07 Building Cost Escalations 56 Section 08 Method for Measuring Rentable Areas 64 Section 09 Return on Investment 69 Residual Land Value 73 Section 10 Directory of Offices in Africa 75

6AECOM
Message from Dean Narainsamy
Director – Project Cost Consulting Africa, Buildings + Places, Africa
With six months into the year, I would like to share a few reflections of the progress we have made as a company. Following on from last year’s closing remarks, which highlighted adaptability and change management as critical success factors required to remain relevant in this market, we at AECOM have seen this sentiment resonate across our business. How so? As an industry, we are currently facing many challenges impacting economic growth and infrastructure development. This includes limited funding, tightening of credit terms and a lack of investment, as well as shifting demographics and political instability, which have all culminated in delayed project start dates. However, with this in mind, we have also seen great opportunities and a significant shift in our business towards leveraging and integrating new technologies, being more innovative in terms of solutions to our clients, and sharing knowledge and resources across our increasingly globalised markets. Investment in innovation is a trademark of being a global business, which, in turn, allows knowledge and systems to be shared and transferred. As AECOM, we are taking this even further, working on the development of a global project

7AECOM
tool that will enable each of our geographies to benefit from sharing global cost, programme, design and key project enablers. Our passion and commitment to Africa remains. We continue to develop opportunities in the continent across all sectors, with both local and multinational clients. We aim to entrench our role as a trusted advisor in Africa and help our clients unlock uncharted territories with passion, integrity and respect. The African continent remains a key enabler for sustainabilty and growth for the business sector. Further, our ability to retain, attract and recruit the best people remains a key focus for us. I am happy to announce that our AECOM Graduate Development / Mentoring 4 Success Programme was successfully launched earlier in the year. I have no doubt that this will go a long way in enhancing our vision of becoming the employer of choice. To our clients - technical and operational excellence remains our top priority. Our strategic and business plans are aligned to making our continent a better place. In the year ahead, we look forward to being of service to you in delivering your projects and turning your opportunities into a reality.
Best Regards, Dean Narainsamy

8AECOM
It’s one thing to imagine a better world. It’s another to deliver it.
AECOM was built to do just that. With a deep and experienced global team, we design and deliver infrastructure and services that unlock opportuni-ties for clients and communities andprotect our environment and improve people’s lives.
From urban centres to remote villages, our work is transformative. We make a positive and lasting impact by applying our global reach, connected expertise and delivery excellence to solve complex, evolving challenges.
The difference we help our clients make is felt in every region of the world. Clean water for developing communities, iconic skyscrapers that swell a nation’s pride, power and security to fuel economic prosperity, transportation that brings people together and thoughtful planning that sustains cities and natural resources.
Our clients face tough, interrelated challenges that can only be solved by a company like ours - one with deep roots, diverse perspectives and an innovative approach. One with the people, technology and vision to deliver what others can only imagine.
We are AECOM — built to deliver a better world.
Section01
Built to Deliver a Better World.

9AECOM
Our Core Values
At AECOM, we are guided by six core values that we all share and that underpin everything we do.
SAFEGUARD
COLLABORATE
INSPIRE
ANTICIPATE
DELIVER
DREAM
We operate ethically and with integrity, while prioritising safety and security in all that we do.
We build diverse teams that connect expertise to create innovative solutions.
We develop and celebrate our people, and elevate the communities we touch.
We understand the complexity of our clients’ challenges and help them see further.
We grow our business through operational excellence and flawless execution.
We transcend the industry by reimagining what is possible – and realising it.
10AECOM
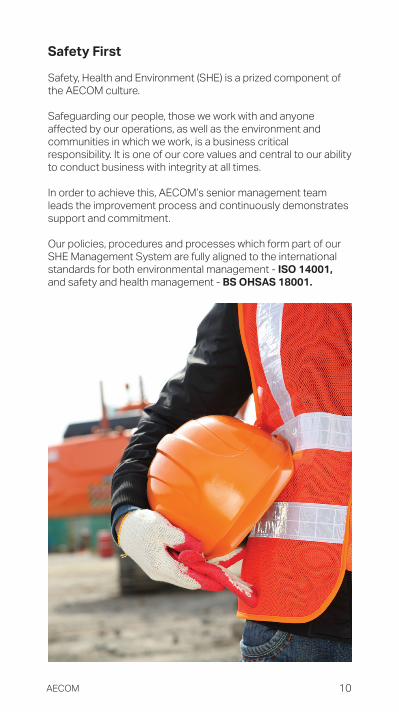
Safety First
Safety, Health and Environment (SHE) is a prized component of the AECOM culture.
Safeguarding our people, those we work with and anyone affected by our operations, as well as the environment and communities in which we work, is a business criticalresponsibility. It is one of our core values and central to our ability to conduct business with integrity at all times.
In order to achieve this, AECOM’s senior management team leads the improvement process and continuously demonstrates support and commitment.
Our policies, procedures and processes which form part of our SHE Management System are fully aligned to the international standards for both environmental management - ISO 14001, and safety and health management - BS OHSAS 18001.

11AECOM
Quality Excellence
AECOM is a global community of professionals – different in disciplines, backgrounds and perspectives – united by a common goal of solving our clients’ most complex challenges.
To achieve this, we have an Integrated Management System (IMS) that provides a consistent documented and auditable platform for operations with the capacity to manage risk and change.
We are committed to promoting a culture of continual improvement in the management of our business through:
— Promoting a workplace in which everyone is encouraged and expected to do the right thing.
— Preventing illness of and injury to our employees who may be affected by our activities.
— Compliance with all legal obligations and other requirements related to our business activities.
— Encouraging a proactive culture of safety, security and quality to keep our people safe, secure and consistently providing quality deliverables for enhanced client satisfaction.
— Providing a secure and resilient workplace for all of our employees and to meeting our obligations, if any, with respect to the protection of others affected by our activities.
— Continually improving all areas of our business while striving to improve the effectiveness of the IMS.
— Providing a Delivery Excellence framework for establishing and reviewing appropriate business objectives and targets.
— Supporting the professional development of our employees.
— Providing services in a manner that meets client requirements and enhances client satisfaction by using our expertise and experience to deliver a quality product.
— Implementing effective pollution prevention and waste reduction programmes.
Our IMS is certified to ISO 9001: 2008.
12AECOM
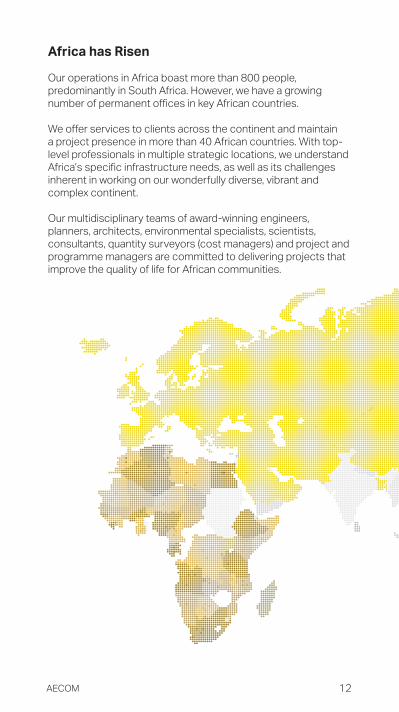
Africa has Risen
Our operations in Africa boast more than 800 people, predominantly in South Africa. However, we have a growing number of permanent offices in key African countries.
We offer services to clients across the continent and maintain a project presence in more than 40 African countries. With top-level professionals in multiple strategic locations, we understand Africa’s specific infrastructure needs, as well as its challenges inherent in working on our wonderfully diverse, vibrant and complex continent.
Our multidisciplinary teams of award-winning engineers, planners, architects, environmental specialists, scientists, consultants, quantity surveyors (cost managers) and project and programme managers are committed to delivering projects that improve the quality of life for African communities.

13AECOM
Improving Lives
AECOM is committed to the principles of good governance and corporate citizenship. As an industry leader with a range of built environment professionals, we strongly believe in investing our resources into improving the quality of life for all.
AECOM works in harmony with the communities from areas in which it operates. As a good corporate citizen, our corporate social investment (CSI) initiatives focus on uplifting disadvantaged communities.
Accepting that sustainable development begins with satisfying basic human needs, we support a range of charitable causes such as shelters for the homeless; homes for the disabled, orphaned and elderly citizens.
Growing the pipeline of engineers and technicians for a skills-scarce Africa
Many people in Africa face development challenges, such as a lack of water and energy security; insufficient and inadequate housing; and a lack of safe and reliable modes of transportation. Solutions to these challenges call for both financial resources and sufficient engineering expertise to plan, design, programme and build the required infrastructure.
As part of this, we have set up the AECOM SA Bursary Scheme, where we annually award merit bursaries to fund full-time undergraduate students in engineering-related studies at accredited universities.

14AECOM
Global Unite
Global Unite is AECOM’s international benchmarking and project performance indicator database. Large amounts of data of many different formats ranging from estimates, bills of quantities and reports are captured in a central server and analysed on a global scale. It gives us the ability to provide evidence-based, early stage construction cost and design advice based on benchmarks of similar projects – via our interactive GUIDE (Global Unite Indicative Design Estimator) tool.
Collaboration amongst various software platforms allows GUIDE to draw on project information in the Global Unite data warehouse which, given the size, scale and reach of the information library, means we are able to predict early stage construction costs in almost all regions of the world.
We can now instantly analyse parameters that define how effective or efficient an asset is (or is not) against local or global standards for all asset types. This includes:
— Benchmarking against specific sector and asset types — Comparing cost by element and sub-elements — Parametric modelling — Conducting on-site project analysis in real-time — Benchmark ratios — Various filtering drivers such as area, functional units and
other metrics
Information obtained from GUIDE can be presented in various formats and reports can be personalised to suit our clients’ requirements.
Each region in AECOM’s Global Unite network has subtle variations that reflect the elemental breakdown structure to ensure the capture of cost and quantity data is appropriate for local projects, as well as being comparable in terms of international benchmarking.
Although construction cost information is specific to a particular location, design benchmarks can be extracted and analysed for the benefit of driving efficiency across different project types globally.
15AECOM
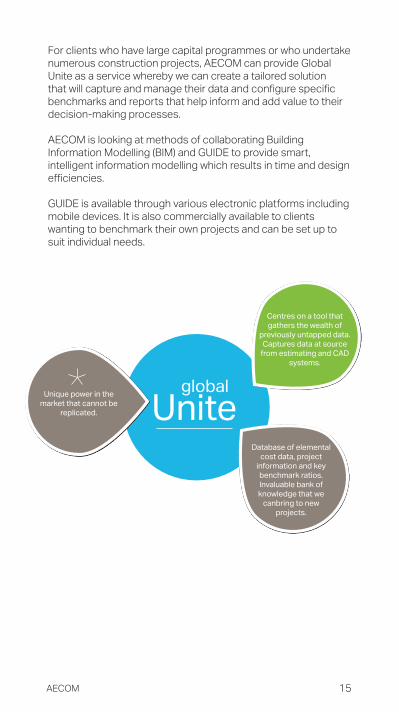
For clients who have large capital programmes or who undertake numerous construction projects, AECOM can provide Global Unite as a service whereby we can create a tailored solution that will capture and manage their data and configure specific benchmarks and reports that help inform and add value to their decision-making processes.
AECOM is looking at methods of collaborating Building Information Modelling (BIM) and GUIDE to provide smart, intelligent information modelling which results in time and design efficiencies.
GUIDE is available through various electronic platforms including mobile devices. It is also commercially available to clients wanting to benchmark their own projects and can be set up to suit individual needs.
globalUnite
Centres on a tool that gathers the wealth of
previously untapped data.Captures data at source
from estimating and CAD systems.
Unique power in themarket that cannot be
replicated.
Database of elementalcost data, project
information and keybenchmark ratios.Invaluable bank of knowledge that we
canbring to new projects.

16AECOM
Building Information Modelling
BIM Defined
Building Information Modelling (BIM) is used to describe the process of designing and managing a building (or other design asset) in collaboration with the entire team, throughout the asset’s life-cycle, by using the same system or model as compared to using separate sets of conventional drawings and information sets. BIM software is used in order to plan, design, construct, operate and maintain diverse physical infrastructures.
Whether we are designing or constructing bridges, towers, roads, pipelines, factories or schools, an information model or a database, can be created that contains information about what will be built, how it will be built and how it will perform. Enabled by technology, we can create a synchronised, collaborative, digital representation of assets to virtually construct and test a project before we do so in reality.
A BIM model usually includes the 3D shape of the objects, but can also include things such as their cost, installation date, or operating parameters. We can attach practically infinite additional data to any object or category of objects in a BIM database, and use that data to manage information flow across multiple life-cycle phases and between multiple parties.
By creating a single source of truth and making project information available across the design, construction and operation teams, we increase our accuracy and efficiency, and can realise significant savings on the life-cycle cost of operation for an asset.

17AECOM
Benefits of the BIM Process
— Improved visualisation — Improved coordination and collaboration — Improved conflict detection and risk mitigation — Improved productivity due to easy retrieval of information — Embedding and linking vital information for tendering
scheduling and estimating
— Reduced costs and improved efficiency — Enhanced performance and increased speed of delivery — Easy maintenance of building life-cycle
The BIM Process
5D BIM
For the Cost Management team, our focus is on 5D BIM, which refers to the linking of cost information to a 3D model. The letter D in connection with BIM relates to the information associated with the model. It refers to other dimensions, such as time (4D) or cost (5D) that is linked to a model. 2D and 3D essentially refer to 2D and 3D CAD designs. 5D BIM entails the intelligent linking of individual 3D CAD components with schedule (time - 4D BIM) constraints and then with cost-related information.
Understanding the Process
Moving over to the 5D BIM process is an enhancement to our current systems and the implementation thereof will offer a number of benefits. The system aims to automate the measuring, estimating and bill production stages. The value lies in the fact that it will enable us to be more proactive and to rather spend time on cost engineering and management as compared to measurement and cost reporting only.
In brief, shifting our focus towards the 5D BIM process requires the following:
— Involvement with design team prior to the start of design work to communicate our cost extraction design requirements
— Base our measures on both 2D and 3D design information
— Create a unified link between the design information, our measures and our costs
— Adopt automated estimating, bill production and cost management tools

18AECOM
Possible benefits of BIM from a cost management perspective
— Fast, reliable and accurate quantity take-off and cost estimation
— Auto computation of calculations, hence reduced calculation mistakes
— Categorised cost reporting and estimation via the use of zones/locations
— Improved visualisation of the elements for measurement and costing purposes
— Easy project handover between quantity surveyors
— Enhanced communication and collaboration amongst team
— Improved cost database management
— Facilitated change management
— Enables a more proactive outlook from a quantity surveying perspective with regard to cost management, contract management and cost engineering

19AECOM
Sustainability
AECOM is a company with a vision to build a better world. Our projects transform communities, improve lives and power growth by designing, building, financing and operating infrastructure assets globally.
From our on-site practices to initiatives in our offices, we are committed to implementing sustainability in everything we do. Our purpose is to enhance and sustain the world’s built, natural and social environments. Our key goals at the heart of our commitment are:
— Embedding sustainability into all aspects of our work with our clients
— Building our capability to provide sustainable solutions for our clients in creative and innovative ways
— Conducting our business in a way that is consistent with sustainability principles
By embracing sustainability, we aim to produce sustainable outcomes across every aspect of our work including planning, design, development, production, delivery and review.

20AECOM
Sustainability is also at the core of how we manage our company globally. We take our responsibilities seriously, and continue to deliver improvements in our environmental performance across key performance indicators including greenhouse gas emissions, water, waste, energy and preparedness for the impacts of climate change.
For example, AECOM was a “Silver” founding member of the Green Building Council of South Africa (GBCSA), demonstrating our commitment to building sustainably. We maintain this membership each year. We have also assisted the GBCSA on its technical working groups to launch the Green Star South Africa Office rating tool in 2008 and the Green Star South Africa Retail Centre rating tool in 2010. Employees from across our South African business have completed the Green Star South Africa accredited professional course and are available to help clients and colleagues to achieve their environmental responsibilities, as well as their financial objectives in terms of infrastructure and building development. Green building ratings currently undertaken by our team of sustainability consultants include: Green Star Office, Green Star Interiors, Green Star Existing Building Performance, LEED Design and Construction and LEED Interior ratings.

21AECOM
Research Support
Research is a key part of AECOM’s aspirations to embrace complex challenges and deliver transformational outcomes.
Through our research and knowledge creation activities, we aim to stimulate beneficial cultural and business changes, resolve industry-specific problems, support our knowledge database and deliver cost-effective, high-quality and relevant services. We also undertake contract research on assignment for clients.
Globally we have a tradition of supporting research collaborations, and in South Africa we are currently pursuing a wide range of research studies with local academic andresearch institutions, professional bodies and the government.Current research nationally and internationally centres around:
— Local, regional and international influences on construction costs and prices
— BIM cost models
— Sustainability and green buildings - drivers of green design, construction and operations within different building types
— Improving infrastructure project delivery in South Africa
— Tall, large and complex buildings – efficiencies in construction and life-cycle costing
— The triple bottom line in construction and property development
— The soft landings process for buildings We also have an on-going collaboration with our international offices with specific regard to global infrastructure sentiment surveys, sector-specific research and developing global project-cost databases.
Finally, we aim to work closer with industry on continuing educational workshops and in developing relevant industry reports and publications.

22AECOM
Section02
Our Services
Quantity Surveying/Cost Management
AECOM provides comprehensive cost-management services from project initiation to completion through all six stages of the project cycle as identified by The South African Council for the Quantity Surveying Profession, Tariff of Professional Fees, Quantity Surveying Profession Act 2000 (Act 49 of 2000), which is summarised as follows:
Stage 1
— Assisting in developing a clear project brief
— Advising on the procurement policy for the project
— Advising on other professional consultants and services required
— Advising on economic factors affecting the project
— Advising on appropriate financial design criteria
— Providing necessary information within the agreed scope of the project to the other professional consultants
Stage 2
— Agreeing on the documentation programme with the principal consultant and other professional consultants
— Reviewing and evaluating design concepts and advising on viability in conjunction with the other professional consultants

23AECOM
— Preparing preliminary and elemental or equivalent estimates of construction cost
— Assisting the client in preparing a financial viability report — Auditing space allocation against the initial brief — Providing services for which the following deliverables are
applicable:• Preliminary estimates of construction cost• Elemental or equivalent estimates of
construction cost• Space allocation audit for the project
Stage 3 — Reviewing the documentation programme with the
principal consultant and other professional consultants
— Reviewing and evaluating design and outline specifications, as well as exercising cost control in conjunction with the other professional consultants
— Preparing detailed estimates of construction cost — Assisting the client in reviewing the financial viability
report
— Commenting on space and accommodation allowances, and preparing an area schedule
— Providing services for which the following deliverables are applicable:
• Detailed estimates of construction cost• Area schedule
Stage 4 — Assisting the principal consultant in the formulation of the
procurement strategy for contractors, sub- contractors and suppliers
— Reviewing working drawings for compliance with the approved budget of construction cost and/or financial viability
— Preparing documentation for both principal and sub- contract procurement
— Assisting the principal consultant with calling of tenders and/or negotiation of prices
— Assisting with financial evaluation of tenders — Assisting with preparation of contract documentation for
signature

24AECOM
— Providing services for which the following deliverables are applicable:
• Budget of construction cost• Tender documentation• Financial evaluation of tenders• Priced contract documentation
Stage 5 — Preparing schedules of predicted cash flow — Preparing proactive estimates for proposed variations for
client decision-making
— Adjudicating and resolving financial claims by contractors — Assisting in the resolution of contractual claims by
contractors
— Establishing and maintaining a financial control system — Preparing valuations for payment certificates to be issued
by the principal agent
— Preparing final accounts for the works on a progressive basis
— Providing services for which the following deliverables are applicable:
• Schedules of predicted cash flow• Estimates for proposed variations• Financial control reports• Valuations for payment certificates• Progressive and draft final accounts
Stage 6
— Preparing valuations for payment certificates to be issued by the principal agent
— Concluding final accounts — Providing services for which the following deliverables are
applicable:• Valuations for payment certificates• Final accounts

25AECOM
Engineering Cost Management
Mining and engineering cost management operates as a specialist service within AECOM. It comprises specialist skills and applications that enhance the risk and value management techniques required by the mining, infrastructure, minerals, metallurgical and petro-chemical sectors.
Our mining and engineering cost management group includes dedicated independent teams specialising in and responsible for the estimation, procurement, cost management and contract administration activities relating to the abovementioned sectors.
The mining and engineering cost management team operates throughout Africa using infrastructure support from our other local offices in all major centres in South Africa, Mozambique and Botswana. Our group employs professionally-qualified quantity surveyors, cost managers, cost engineers, contract administrators, construction programmers and building surveyors.
Mining, infrastructure, minerals, metallurgical and petro-chemical projects are generally of a high monetary value. It therefore is most beneficial to involve the mining and engineering cost management team at an early stage in the project cycle. Imposing robust financial discipline from a very early stage of a project will result in accurate and structured estimating, timely and cost-effective procurement, accurate and up-to-date maintenance of costs to completion, including the cost management of design changes and the prompt close-out of contracts. The implementation of these principles of financial management will thereby deliver maximum shareholder value and it is in this area that the engineering cost management team strives to significantly influence project outcomes to benefit all stakeholders.
Our mining and engineering cost management group provides a depth of experience, expertise and independence which will contribute to and complement the client’s team. This is critical, particularly in the early stages of a project, when the opportunity to add value, as well as recognise and define cost, is established. Simultaneously, formalising project principles is equally critical throughout the project, with cost management continuing through to the post–contract period and final closeout.

26AECOM
Building Services Cost Management
Every client wants rigorous control of overall building costs and to ensure that every Rand spent is optimised. Building services such as electrical, air-conditioning, fire protection and the various electronic installations are part of every building project, and usually comprise 25 to 40 per cent of the total construction cost. It therefore follows that effective cost management of the building services is just as essential as for any other part of the construction costs.
Our building services cost management team draws upon its unique expertise to provide financial management and contract administration of building services. These services include:
— Electrical installation — Heating, ventilating and air-conditioning (HVAC)
installations
— Fire protection systems — Fire detection and evacuation systems — Access control — Closed circuit television (CCTV) — Lifts, escalators and travellators — Communication systems — Building management systems — Security systems — Data systems
We have offered cost advice and quantity surveying services for all building services for many years, with a record that includes many major projects. Meticulous procurement and cost management practices are part of our standard methodology. Independent cost management ensures transparency of costs and a dedicated service not linked to the specific design consultant.

27AECOM
Working in close conjunction with the appointed mechanical, electrical and fire protection consultants, our building services team provides a comprehensive service encompassing the following:
— Cost planning at an early stage prior to detailed design — Cost studies to compare alternative materials and
designs in terms of capital, operating, maintenance and depreciation costs
— Monitoring and evaluating design as it evolves to ensure compatibility with the approved cost plan
— Advising on contractual arrangements and preparing tender procurement documents
— Adjudicating tenders in conjunction with the consultant team
— Cash-flow predictions — Cost management and reporting — Valuation of work done during construction — Determining final costs — Settling final costs with the contractor and sub-
contractors

28AECOM
AECOM in South Africa
Broad-Based Black Economic Empowerment (B-BBEE)
AECOM recognises and fully endorses B-BBEE as an integral part of our contribution to a better South Africa. As a responsible business and a leader in the built environment industry, AECOM acknowledges that to be a good corporate citizen we need to embrace fully the principles of transformation.
We strive to advance on our status level through a B-BBEE strategy that sets continuous improvement targets on all the B-BBEE scorecard criteria in order to maintain a leading role in the built environment and our positive impact on society.
AECOM’s most recent B-BBEE assessment is indicated hereunder:
B-BBEE Level Status: Level 3Procurement Recognition Level 110%
Black Ownership 30% Black-Owned
Black Woman Ownership 10% Black Woman-Owned
Scorecard Information:• Ownership• Management Control• Skills Development• Enterprise & Supplier Development• Socio-Economic Development
25 points12.78 points16.39 points33.80 points5 points
Total 92.97 points
Empowering Supplier YES
Designated Group Supplier NO
Scorecard Generic – B-BBEE Codes of Good Practice (Gazette no 36928 of 11 October 2013)
Section03

29AECOM
South African Cost Data
Key Factors Influencing Building Cost Rates
Inherent difficulties and pitfalls
This section highlights the inherent difficulties and pitfalls that may occur when inclusive or single rates are used to establish the estimated cost of a particular building.
Construction cost estimation is complex. Comprehensive exercises based on detailed and accurate information are required to achieve reliable levels of comfort. For various reasons, however, decisions are often based on inclusive rate estimates, i.e. rate per square metres (m²) of construction area or rate per unit in number.
The most widely-used method of quick approximate estimating to obtain an indication of the construction cost of a building is by the rate/m²-on-plan method. This is often also referred to as the “order of magnitude” method of cost estimation. It certainly is both quick and convenient, but it can be very misleading if used indiscriminately and without taking care when calculating the construction area and selecting the rate.
Cost comparisons of various buildings are often made by comparing the individual rates/m² without due consideration of a number of factors that can affect the rate/m² to a substantial degree.
Very often the cost of a building is expressed in R/m² and the unit cost is ignored, if calculated at all. This rate/m² is then used as the sole yardstick
Section04

30AECOM
for what the building costs. For example, a security guard’s shelter measuring 2m x 2m consisting of brick walls with windows, one door and a simple roof construction may cost R9,000/m². This rate, when compared with the rate for a 200m² house containing plumbing, carpets, etc. at R7,000/m² would seem very expensive. However, the unit cost of the shelter is R36,000 compared with R1,4 million for the house. Below are a few criteria to be taken into account when considering rates/m² :
Specification
Two buildings of the same shape and with identical accommodation can have vastly different R/m² rates should the one building have finishes of a differing standard. For example, expensive carpets in lieu of vinyl floor tiles can increase the rate by R150/m².
Wall-to-floor ratio — plan shape
The most economical shape for a building is square. This shape requires the minimum wall length to enclose a given floor area, e.g.
Case A
Area 1,600m²Wall length 160mWall height 3mWall area 480m²Wall floor ratio 480/1,600Cost of external façade interms of R/m² of floor areato each R/m² of façade area 30.0%
40m
40m

31AECOM
100m
16m
Case B
Area 1,600m²Wall length 232mWall height 3mWall area 696m²Wall floor ratio 696/1,600
Cost of external façade interms of R/m² of floor areato each R/m² of façade area 43.5%
The rate/m² on plan of a façade costing R800/m² on elevation in each case is:
Case A R800 x 30.0% = R240/m² Case B R800 x 43.5% = R348/m²
The reader with a good knowledge of mathematics will fault the above argument correctly by stating that a circle is the geometric shape requiring the minimum wall length to enclose a given floor area. In very few cases, however, is this the most economical plan shape of a building as, due to various reasons, the cost of constructing a circular as opposed to a straight external envelope, is generally greater than the saving in terms of the quantities required by the envelope.
Floor-to-ceiling heights
Two buildings of an identical plan, shape and area but with different floor-to-ceiling heights will have different rates/m² due to the additional cost of walling, finishes, etc. in the building with the greater floor-to-ceiling height.
Plumbing, mechanical and electrical installations
The concentration of plumbing installations has a marked effect on the rate/m² of the building. The cost of a toilet block per m² is much greater than that of a house containing one bathroom as the high cost of the bathroom area is spread over the less expensive remaining areas of the house.

32AECOM
Similarly, in office blocks, factories, etc., the rate/m² will depend greatly on whether air-conditioning, security systems, sprinklers, smoke-detection systems, specialised electrical installations, acoustic treatment or other specialised installations are incorporated into the design.
Construction areas
The rate/m² for a building with large balconies or access corridors included in the construction area cannot be compared with the rate/m² for a building without similar low cost areas.
Internal subdivisions
The rate/m² for open plan offices should not be compared directly with the rate/m² for offices with internal partitions without the relevant adjustments being made. The inclusion of partitions can increase the overall rate/m² by up to R300/m² of office area.
Parking
Should the building in question contain certain parking areas, the average rate/m² will be less than for a building withidentical accommodation but with parking outside the building structure. See the following example:
Case A
Building with parking in the building area
OFFICESOFFICESOFFICESOFFICES
PARKING (600m²)
Cost of building
Offices 2,400m² @ R15,000 = R 36,000,000Parking 600m² @ R6,000 = R 3,600,000Total R 39,600,000 Average rate/m² R 13,200
Plan area 600m²/floorConstruction area 3,000m²
Basement

33AECOM
Case B
Building having parking outside the building structure and on grade
OFFICESOFFICESOFFICESOFFICES PARKING (600m²)
Cost of building Offices 2,400m² @ R15,000 = R 36,000,000Parking 600m² @ R 800 = R 480,000Total R 36,480,000Average rate/m² R 15,200
Under Case B, the parking area is not included as part of the construction area for the purposes of calculating the rate/m². Similarly, the rate/m² for supermarket/hypermarket shopping centres should be qualified as to whether the cost of on-site parking and ancillary site development has been included, said cost which could be in the region of R800/m² of construction area.
There are numerous further points of consideration in addition to those given above. Amongst these are site works particular to each specific contract, the number of storeys, floor loadings, column spans, concentration of joinery and other fittings, overall height of building, open-atrium upper volumes, etc.
In conclusion, rates/m² must be used with circumspection. The degree of accuracy of the answers provided must be in direct proportion to the research and surveys undertaken to establish the rate for the building in question.
Plan area 600m²/floorConstruction area 2,400m²

34AECOM
Approximate Inclusive Building Cost Rates
Building cost rates
This section provides a list of approximate inclusive building cost rates for various building types in South Africa.
Rates are current to 1 July 2017, and therefore represent the average expected building cost rates for 2017. It must be emphasised that these rates are indicative only, and should be used circumspectly, as they are dependent upon a number of assumptions. See inclusive rate estimates herein.
The area of the building expressed in m² is equivalent to the construction area where appropriate, as defined in Method for Measuring Floor Areas in Buildings, Second Edition (effective from 7 November 2007), published by the South African Property Owners’ Association (SAPOA). Regional Variations
Construction costs normally vary between the different provinces of South Africa. Costs in parts of the Western Cape and KwaZulu-Natal, specifically upper class residential, for example, are generally significantly higher than Gauteng due to the demand for this type of accommodation. Rates have therefore been based on data received from Gauteng, where possible. Be mindful, however, that cost differences between provinces at a given point in time are not constant, and may vary over time due to differences in supply and demand or other factors. Specific costs for any region can be provided upon request by any AECOM office in that region.

35AECOM
Building Rates
Rates include the cost of appropriate building services, e.g. air-conditioning, electrical, etc., but exclude costs of site infrastructure development, parking, any future escalation, loss of interest, professional fees and value-added tax (VAT).
Offices Rate per m² (excl. VAT)Low-rise office park development with standard specification R 7,300 - R 9,000 Low-rise prestigious office parkdevelopment R 9,500 - R 14,100High-rise tower block withstandard specification R 10,500 - R 14,100 High-rise prestigious towerblock R 14,100 - R 17,700
Office rates exclude parking and include appropriate tenant allowances incorporating carpets, wallpaper, louvre drapes, partitions, lighting, air-conditioning and electrical reticulation.
Parking Rate per m² (excl. VAT)Parking on grade, includingintegral landscaping R 500 - R 600Structured parking R 3,600 - R 3,900Parking in semi-basement R 3,900 - R 5,300Parking in basement R 4,200 - R 6,500
Retail Rate per m² (excl. VAT)Local convenience centres(Not exceeding 5,000m²) R 7,200 - R 9,500 Neighbourhood centres(5,000 – 12,000m²) R 7,800 - R 10,000Community centres(12,000 – 25,000m²) R 8,500 - R 11,000Minor regional centres(25,000 – 50,000m²) R 9,500 - R 11,700Regional centres(50,000 – 100,000m²) R 10,000 - R 12,200Super regional centres(exceeding 100,000m²) R 10,500 - R 13,700
Super regional centres and regional centres are generally inward trading with internal malls, whereas convenient, neighbourhood and community centres are generally outward trading with no internal malls.
Retail rates include the cost of tenant requirements and specifications of national chain stores.
Retail costs vary considerably depending on the tenant mix and sizing of the various stores.

36AECOM
Industrial Rate per m² (excl. VAT)Industrial warehouse, including office and change facilities within structure area (architect/engineer designed):
— Steel frame, steel cladding and roof sheeting (light-duty) R 3,600 - R 5,300
— Steel frame, brickwork to ceiling, steel cladding above and roof sheeting (heavy-duty) R 4,200 - R 6,000
— Administration offices, ablution and change room block R 6,800 - R 8,600
— Cold storage facilities R 12,600 - R 18,000
Residential Rate per site (excl. VAT)Site services to low-cost housingstand (250 - 350m²) R 31,000 - R 48,000 Rate per m² (excl. VAT)
RDP housing R 1,800 - R 2,100Low-cost housing R 2,800 - R 4,600Simple low-rise apartment block R 6,700 - R 9,300Duplex townhouse
— Economic R 6,700 - R 9,600
Prestige apartment block R12,700 - R19,800

37AECOM
Residential Rate per m² (excl. VAT)
Private dwelling houses:
— Economic R 4,600 — Standard R 6,000 — Middle-class R 7,200 — Luxury R 10,300 — Exclusive R 15,900 — Exceptional (‘super luxury’) R 25,000 - R 51,000
Outbuildings R 3,400 - R 4,800 Rate per no. (excl. VAT)
Carport (shaded) - single R 4,100 - double R 7,900Carport (covered) - single R 6,500 - double R 11,800
Rate per no. (excl. VAT)Swimming pool
— Not exceeding 50 kl R 86,000 — Exceeding 50 kl and not
exceeding 100 kl R 80,000 - R 141,000 Tennis court
— Standard R 350,000 - R 475,000 — Floodlit R 420,000 - R 600,000
Hotels Rate per key (excl. VAT)
Budget R 973,300 - R 1,378,300Mid-scale (3 star) R 2,034,200 - R 2,515,900Luxury (5 star) R 3,516,700 - R 4,479,900
Hotel rates include allowances for furniture, fittings and equipment (FF&E).
Studios Rate per m² (excl. VAT)
Studios - dancing, artexhibitions, etc. R 12,600 - R 18,000

38AECOM
Conference centres Rate per m² (excl. VAT)
Conference centre toInternational standards R 22,700 - R 29,400
Retirement centres Rate per m² (excl. VAT)
Dwelling houses — Middle-class R 7,500 — Luxury R 10,500
Apartment block — Middle-class R 7,700 — Luxury R 12,000
Community centre — Middle-class R 10,100 — Luxury R 14,800
Frail care R 12,000
Schools Rate per m² (excl. VAT)
Primary school R 6,000 - R 6,900Secondary school R 7,100 - R 7,600
Hospitals Rate per m² (excl. VAT)
District hospital R 25,000
Hospital rates exclude allowances for furniture, fittings and equipment (FF&E).
Stadiums Rate per seat (excl. VAT)
Stadium to PSL standards R 31,000 - R 48,000Stadium to FIFA standards R71,000 - R 95,000
Rate per pitch (excl. VAT)Stadium pitch to FIFA Standards R 20,000,000 - R 24,000,000

39AECOM
Prisons Rate per inmate (excl. VAT)
1,000 Inmate prison R 535,000 - R 569,000500 Inmate prison R 569,000 - R 636,000High/maximum security prison R 849,000 - R 1,137,000
Infrastructure airport development costs
Rates exclude any future escalation, loss of interest, professional fees, VAT and ACSA direct costs.
Apron stands (incl. associated Rate per m² (excl. VAT)infrastructure)
Code F Stand (85m long x 80m wide = 6,800m²) R 4,600Code E Stand (80m long x 65m wide = 5,200m²) R 4,800Code C Stand (56m long x 40m wide = 2,240m²) R 6,100 Taxi lanes (incl. associated Rate per m (excl. VAT)infrastructure)
Code F taxi lane (101m wide) R 151,000Code E taxi lane (85m wide) R 128,000Code C taxi lane (49m wide) R 74,000
Service Roads Rate per m (excl. VAT)
Service road (10m wide) R 15,700Dual carriage service road (15m wide) R 20,000

40AECOM
Taxi ways (incl. associated Rate per m (excl. VAT)infrastructure)
Code F taxi way (70m wide) R 108,000
Runways (incl. associated Rate per m (excl. VAT)infrastructure)
Code F Runway (3,885m long x 60m wide = 233,100m²) R 252,000 Parking (excluding bulk Rate per bay (excl. VAT)earthworks)
Structured parking R 166,000Basement parking R 254,000
Perimeter fencing / Rate per m (excl. VAT)Security gates
Perimeter walls with perimeter intrusion detection (PIDS), etc. R 7,700
Rate per no. (excl. VAT)Security gate R 14,500Super security gate R 43,500
Terminal & other buildings Rate per m² (excl. VAT)(excl. bulk earthworks, external site & services works)
Terminal building (excl. terminal building baggage & X-ray) R 25,700Pier terminal building (excl. telescopic air bridges, seating & aircraft docking system) R 27,000
Rate per unit (excl.VAT)Telescopic air bridges R 9,872,000Aircraft docking system R1,448,000

41AECOM
Building services
The following rates are for building services (mechanical and electrical), which are applicable to typical building types in the categories indicated. Rates are dependent on various factors related to the design of the building and the requirements of the system.
In particular, the design, and therefore the cost of air-conditioning, can vary appreciably depending on the orientation, shading, extent and type of glazing, external wall and roof construction, etc.
Electrical installation Rate per m² (excl. VAT)
Offices — Standard installation R 470 - R 760 — Sophisticated installation R610- R 1,050 — UPS, substations, standby
generators to office buildings R 340 - R 550
Residential R 500 - R 840Shopping centres R 710 - R 950Hotels R 840 - R1,320Hospitals R 1,110 - R 1,530
Electronic installation Rate per m² (excl. VAT)
Offices — Standard installation R 500 - R 660 — Sophisticated installation R 580 - R 900
Residential R 260 - R 420Shopping centres R 580 - R 840Hotels R 530 - R 710Hospitals R 530 - R 790
Electronic installation includes access control, CCTV, public address, fire detection, data installation, WiFi , CATV, PABX (Private Automatic Branch Exchange) and Building Management System (BMS).

42AECOM
Fire protection installation Rate per m² (excl. VAT)(offices)
Sprinkler system, including hydrants and hose reels(excluding void sprinklers) R 210 - R 340
Air-conditioning installation Rate per m² (excl. VAT)
Ventilation to parking/serviceareas R 290 - R 530
Offices — Console units R 630 - R 970 — Console/split units R 630 - R 1,110 — Package units R 1,000 - R 1,680 — Central plant R 1,420 - R 2,630 — Variable refrigerant flow (VRF) R 1,260 - R 2,630
Residential - split units R 1,000 - R 1,680
Shopping centres — Split units R 1,000 - R 1,320 — Package units R 1,110 - R 1,790 — Evaporative cooling R 500 - R1,000
Hotels - public areas R 1,470 - R 2,530 Hospitals central plant R 2,110 - R 3,370
Hotels Rate per key (excl. VAT)
— Console units R 18,000 - R 24,000 — Split units R 29,000 - R 42,000 — Central plant R 51,000 - R 78,000
Rate per theatre (excl. VAT)Hospitals - operating theatres R420,000 - R1,160,000
For guidance with regard to the cost of buildings rated under the Green Star South Africa rating tool system, see the latest edition of the AECOM publication entitled “Quick Guide to Green Design Attributes.”

43AECOM
Section05
Global Sentiment and Building Costs
Africa Outlook
Africa generally continues to maintain its economic growth compared to the slow recovery of Western economies. Africa’s growth is expected to remain moderate in 2017 due to delays in a number of countries achieving their economic growth, particularly in East Africa. Growth is expected on the continent from 2018.
However, growth in Africa is the result of domestic factors, including private consumption, public infrastructure development and private investment. In the medium term, continued improvement in the business environment and fast expanding regional markets may increasingly become new sources of growth for the continent.
Further, stability of commodity and oil prices, stable macro-economic environments, a growing middle class and rising internal consumer spending will continue to drive growth. GDP growth rates for the continent are forecast to be between 4.5% and 6.0% in 2017 as a result. This will maintain a number of African countries in the list of top-ten fastest-growing economies globally between 2013 and 2018. This will be contingent on continuing strong foreign investment flows, investment in natural resources and infrastructure, increasingly sound macroeconomic policies and good governance.
44AECOM
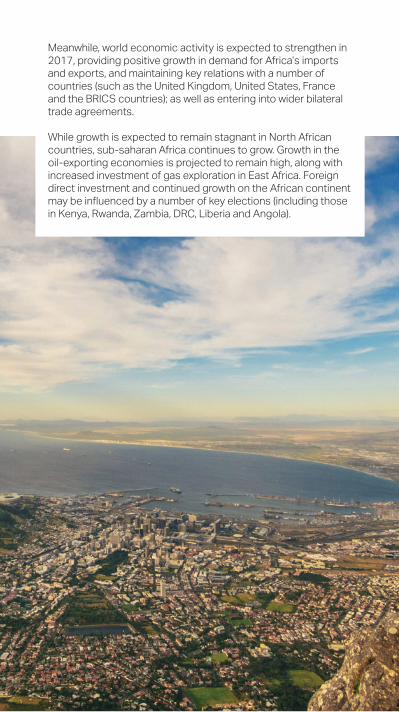
Meanwhile, world economic activity is expected to strengthen in 2017, providing positive growth in demand for Africa’s imports and exports, and maintaining key relations with a number of countries (such as the United Kingdom, United States, France and the BRICS countries); as well as entering into wider bilateral trade agreements.
While growth is expected to remain stagnant in North African countries, sub-saharan Africa continues to grow. Growth in the oil-exporting economies is projected to remain high, along with increased investment of gas exploration in East Africa. Foreign direct investment and continued growth on the African continent may be influenced by a number of key elections (including those in Kenya, Rwanda, Zambia, DRC, Liberia and Angola).
45AECOM
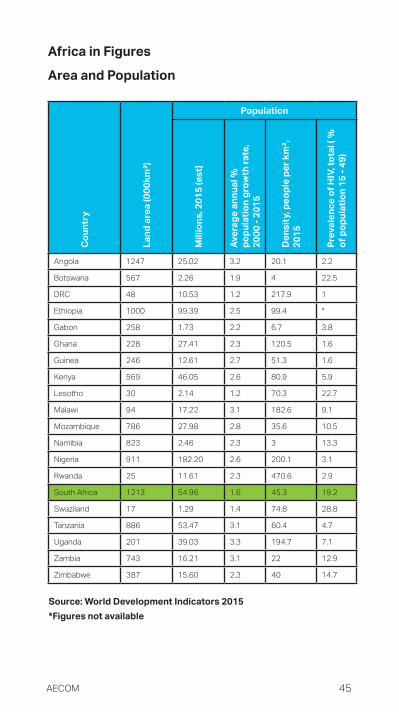
Africa in Figures
Area and PopulationCo
untr
y
Land
are
a (0
00km
²)
Population
Mill
ions
, 201
5 (e
st)
Aver
age
annu
al %
po
pula
tion
grow
th ra
te,
2000
- 20
15
Den
sity
, peo
ple
per k
m²,
2015
Prev
alen
ce o
f HIV
, tot
al (
%
of p
opul
atio
n 15
- 49
)
Angola 1247 25.02 3.2 20.1 2.2
Botswana 567 2.26 1.9 4 22.5
DRC 48 10.53 1.2 217.9 1
Ethiopia 1000 99.39 2.5 99.4 *
Gabon 258 1.73 2.2 6.7 3.8
Ghana 228 27.41 2.3 120.5 1.6
Guinea 246 12.61 2.7 51.3 1.6
Kenya 569 46.05 2.6 80.9 5.9
Lesotho 30 2.14 1.2 70.3 22.7
Malawi 94 17.22 3.1 182.6 9.1
Mozambique 786 27.98 2.8 35.6 10.5
Namibia 823 2.46 2.3 3 13.3
Nigeria 911 182.20 2.6 200.1 3.1
Rwanda 25 11.61 2.3 470.6 2.9
South Africa 1213 54.96 1.6 45.3 19.2
Swaziland 17 1.29 1.4 74.8 28.8
Tanzania 886 53.47 3.1 60.4 4.7
Uganda 201 39.03 3.3 194.7 7.1
Zambia 743 16.21 3.1 22 12.9
Zimbabwe 387 15.60 2.3 40 14.7
Source: World Development Indicators 2015*Figures not available

46AECOM
Population 2015
200
180
160
140
120
Ango
la
Popu
latio
n M
illion
s
Botw
sana
DRC
Ethi
opia
Gab
onG
hana
Gui
nea
Keny
aLe
soth
oM
alaw
iM
ozam
biqu
eNa
mib
iaNi
geria
Rwan
daSo
uth
Afric
aSw
azila
ndTa
nzan
iaUg
anda
Zam
bia
Zim
babw
e
100
80
60
40
20
0
Source: World Development Indicators 2015
47AECOM
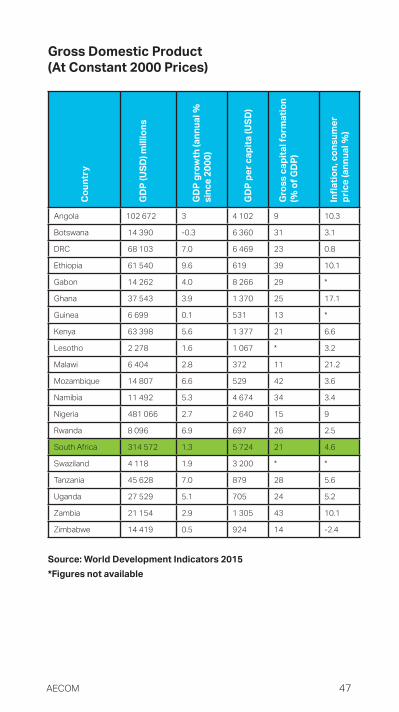
Gross Domestic Product (At Constant 2000 Prices)
Coun
try
GD
P (U
SD) m
illio
ns
GD
P gr
owth
(ann
ual %
si
nce
2000
)
GD
P pe
r cap
ita (U
SD)
Gro
ss c
apita
l for
mat
ion
(% o
f GD
P) In
flatio
n , c
onsu
mer
pr
ice
(ann
ual %
)
Angola 102 672 3 4 102 9 10.3
Botswana 14 390 -0.3 6 360 31 3.1
DRC 68 103 7.0 6 469 23 0.8
Ethiopia 61 540 9.6 619 39 10.1
Gabon 14 262 4.0 8 266 29 *
Ghana 37 543 3.9 1 370 25 17.1
Guinea 6 699 0.1 531 13 *
Kenya 63 398 5.6 1 377 21 6.6
Lesotho 2 278 1.6 1 067 * 3.2
Malawi 6 404 2.8 372 11 21.2
Mozambique 14 807 6.6 529 42 3.6
Namibia 11 492 5.3 4 674 34 3.4
Nigeria 481 066 2.7 2 640 15 9
Rwanda 8 096 6.9 697 26 2.5
South Africa 314 572 1.3 5 724 21 4.6
Swaziland 4 118 1.9 3 200 * *
Tanzania 45 628 7.0 879 28 5.6
Uganda 27 529 5.1 705 24 5.2
Zambia 21 154 2.9 1 305 43 10.1
Zimbabwe 14 419 0.5 924 14 -2.4
Source: World Development Indicators 2015*Figures not available

48AECOM
Gross Domestic Product 2015
600 000
500 000
400 000
300 000
200 000
100 000
Ango
laBo
twsa
naDR
CEt
hiop
iaG
abon
Gha
naG
uine
aKe
nya
Leso
tho
Mal
awi
Moz
ambi
que
Nam
ibia
Nige
riaRw
anda
Sout
h Af
rica
Swaz
iland
Tanz
ania
Ugan
daZa
mbi
aZi
mba
bwe
1 000
2 000
3 000
4 000
5 000
6 000
7 000
8 000
9 000
GDP (USD) millions GDP per capita (USD) millions
Source: World Development Indicators 2015

49AECOM
Africa Building Costs
This section makes provision for comparisons of African building costs, international building costs and international rental rates.
The Africa Building Cost Comparison table (page 50), summarises the approximate estimated building costs for different types of buildings in various locations inAfrica. Rates are based on projected 1 July 2017 costs and provide an indicator for the expected building cost rates over 2017. Exchange rates are as at 1 April 2017.
Rates include the cost of appropriate building services, e.g. air-conditioning, electrical, etc. but exclude costs of site infrastructure development, parking, any future escalation, loss of interest, professional fees and VAT. These rates are of an indicative nature and therefore the qualifications dealt with elsewhere in this publication would apply.
These are estimated costs only and should be considered in the context of acceptable building standards in each relevant country. These standards, both at a technical level and pertaining to quality, do vary from country-to-country. Therefore the building costs must be seen as being for the normal standards prevailing in each particular region. This being the case, these costs must be used circumspectly.

50AECOM
Pric
es e
xclu
de l
and,
site
wor
ks,
prof
essi
onal
fee
s, t
enan
t fito
ut a
nd e
quip
men
t. R
ates
exc
lude
GS
T/V
AT.
Hot
el r
ates
incl
ude
FF&
E
AFR
ICA
PR
OPE
RTY
& C
ON
STR
UC
TIO
N C
OST
GU
IDE
C
OST
S B
ASE
D O
N 1
JU
LY 2
017
Afr
ica
Bui
ldin
g C
ost
Com
paris
on
EXC
HA
NG
E R
ATE
S T
O U
SD A
S A
T 1
APR
IL 2
017
41
Build
ing
Type
Ango
la
Luan
daBo
tsw
ana
Gabo
rone
Ghan
a
Ac
cra
Keny
a
Na
irobi
Moz
ambi
que
Map
uto
Nige
ria
La
gos
Rwan
da
Ki
gali
Sene
gal
Da
kar
Sout
h Af
rica
Joha
nnes
burg
Tanz
ania
Dar e
s Sa
laam
Ugan
da
Kam
pala
Zam
bia
Lu
saka
Resi
dent
ial
(US$
/ m
²)
Aver
age
Mul
ti U
nit H
igh
Ris
e1
540
918
1 85
074
01
100
2 10
01
185
1 24
082
178
081
51
100
Luxu
ry U
nit H
igh
Ris
e2
500
1 29
72
200
1 10
01
400
2 91
01
580
1 94
51
213
1 04
01
305
1 62
5In
divid
ual P
rest
ige
Hou
ses
4 65
01
952
2 10
01
350
1 50
02
560
1 70
02
970
1 18
71
120
1 54
01
590
Com
mer
cial
/Ret
ail
(US$
/ m
²)
Aver
age
Sta
ndar
d O
ffice
s H
igh
Ris
e1
700
970
1 70
01
000
1 05
02
100
1 45
51
265
918
955
1 15
51
230
Pre
stig
e O
ffice
s H
igh
Ris
e2
600
1 62
52
500
1 73
51
250
2 91
01
840
2 06
51
187
1 21
01
955
1 59
0M
ajor
Sho
ppin
g C
entre
(CB
D)
2 45
01
350
1 40
084
01
250
2 91
01
350
1 66
090
389
096
51
210
Indu
stria
l(U
S$ /
m²)
Ligh
t Dut
y Fa
ctor
y1
550
865
1 05
072
595
01
165
1 09
01
135
396
715
805
530
Hea
vy D
uty
Fact
ory
2 53
51
329
1 25
01
150
1 10
01
570
1 94
01
820
448
1 28
01
295
600
Hote
l(U
S$ /
key)
3 S
tar B
udge
t 21
5 00
013
8 40
032
5 00
036
4 00
012
5 00
029
0 00
020
1 32
516
6 20
020
3 80
013
5 52
043
0 00
027
3 09
25
Sta
r Lux
ury
413
000
446
800
455
000
630
000
230
000
525
000
481
500
392
175
358
100
319
750
750
000
479
854
Res
ort S
tyle
595
000
499
000
570
000
750
000
450
000
640
000
642
390
495
000
Not
ava
ilabl
e42
2 50
090
9 50
0N
ot a
vaila
ble
Oth
er(U
S$ /
m²)
Mul
ti S
tore
y C
ar P
ark
1 41
567
585
047
585
01
515
865
1 07
028
057
056
037
5D
istri
ct H
ospi
tal
Not
ava
ilabl
eN
ot a
vaila
ble
1 25
01
000
2 50
02
095
Not
ava
ilabl
eN
ot a
vaila
ble
1 86
6N
ot a
vaila
ble
1 28
52
500
Prim
ary &
Sec
onda
ry S
choo
lsN
ot a
vaila
ble
Not
ava
ilabl
e1
250
875
1 05
0N
ot a
vaila
ble
Not
ava
ilabl
eN
ot a
vaila
ble
507
Not
ava
ilabl
e1
020
680
(As
at 1
Apr
il 20
17)
AOA
BW
PG
HS
KE
SM
ZNN
GN
RW
FXO
FZA
RTZ
SU
GX
ZMW
US
$1 =
165.
9010
.30
4.31
101.
1070
.39
309.
1082
2.01
611.
2413
.40
2193
.02
3584
.13
9.61
US D
OLL
AR
Afric
a Pr
oper
ty &
Con
stru
ctio
n Co
st G
uide
Cost
s ba
sed
on 1
Jul
y 20
17Af
rica
Build
ing
Cost
Com
paris
on
Exch
ange
Rat
es to
US$
as
at 1
Apr
il 201
7
Pric
es e
xclu
de la
nd, s
ite w
orks
, pro
fess
iona
l fees
, ten
ant fi
tout
and
equ
ipm
ent.
Rate
s ex
clud
e G
ST/V
AT. H
otel
rate
s in
clud
e FF
&E
Mul
ti-st
orey

51AECOM
Global Building Costs
The cost data under the heading International Building Cost Rate Comparison (see page 52) was made available through a survey by the relevant AECOM offices based in these locations. Their assistance in this regard is acknowledged with thanks.

52AECOM
Pric
es e
xclu
de la
nd, s
ite w
orks
, pro
fess
iona
l fee
s, te
nant
fito
ut a
nd e
quip
men
t. R
ates
exc
lude
GS
T/V
AT.
Hot
el ra
tes
incl
ude
FF&
E
AFR
ICA
PRO
PER
TY &
CO
NSTR
UCTI
ON
CO
ST G
UIDE
C
OST
S BA
SED
ON
1 J
ULY
2017
In
tern
atio
nal B
uild
ing
Cos
t Com
paris
on
EXC
HANG
E R
ATES
TO
USD
AS
AT 1
APR
IL 2
017
43
Build
ing
Type
Aust
ralia
Sy
dney
Chin
a
Hong
Kon
gCh
ina
Beiji
ngCh
ina
Sh
angh
ai
Mal
aysi
a
Ku
ala
Lum
pur
Sing
apor
eSo
uth
Afric
a
JH
BTh
aila
nd
Bang
kok
UAE
Duba
iUS
A
Lo
s An
gele
s
USA
San
Fran
cisc
o
USA
New
Yor
k
Unite
d Ki
ngdo
m
Lond
on
Viet
nam
Ho C
hi M
inh
Resi
dent
ial
(US$
/ m
²)
Ave
rage
Mul
ti U
nit H
igh
Ris
e3
420
3 20
073
572
548
33
074
821
1 05
71
957
3 60
03
900
4 55
03
771
848
Luxu
ry U
nit H
igh
Ris
e3
996
4 50
01
600
1 50
082
44
440
1 21
31
572
2 37
34
600
5 00
05
900
5 28
71
028
Indi
vidua
l Pre
stig
e H
ouse
s4
651
6 30
088
087
070
55
074
1 18
71
649
Not
ava
ilabl
e4
300
5 10
05
500
5 24
669
4
Com
mer
cial
/Ret
ail
(US$
/ m
²)
Ave
rage
Sta
ndar
d O
ffice
s H
igh
Ris
e4
258
3 20
01
000
1 00
078
42
976
918
954
1 53
94
000
4 40
04
960
4 21
81
028
Pre
stig
e O
ffice
s H
igh
Ris
e4
979
4 00
01
450
1 50
01
210
3 95
21
187
1 13
41
993
4 30
04
700
5 20
05
213
1 23
4M
ajor
Sho
ppin
g C
entre
(CB
D)
3 57
74
600
1 50
01
450
1 27
33
806
903
825
1 67
93
300
3 79
53
960
4 59
772
0
Indu
stria
l(U
S$ /
m²)
Ligh
t Dut
y Fa
ctor
y76
02
500
520
500
472
1 04
939
656
784
21
400
1 50
02
800
1 72
936
0H
eavy
Dut
y Fa
ctor
y95
6N
ot a
vaila
ble
Not
ava
ilabl
e N
ot a
vaila
ble
517
1 29
344
890
298
11
800
1 95
03
600
2 96
746
3
Hote
l(U
S$ /
key)
3 S
tar B
udge
t 34
7 19
923
0 00
012
7 00
0N
ot a
vaila
ble
151
500
97 5
8620
3 80
061
856
52 3
0075
000
79 0
0084
000
89 0
00N
ot a
vaila
ble
5 S
tar L
uxur
y 70
6 18
948
0 00
027
6 00
028
7 00
028
1 25
043
9 13
635
8 10
024
2 27
016
6 41
143
4 00
045
0 00
050
0 00
053
9 68
119
2 77
7R
esor
t Sty
le
Not
ava
ilabl
eN
ot a
vaila
ble
386
000
Not
ava
ilabl
e24
8 30
043
9 13
6N
ot a
vaila
ble
270
621
196
057
271
000
282
000
298
000
331
383
231
333
Oth
er(U
S$ /
m²)
Mul
ti S
tore
y C
ar P
ark
983
1 65
0N
ot a
vaila
ble
Not
ava
ilabl
e 31
487
828
059
360
11
230
1 55
01
530
847
360
Dis
trict
Hos
pita
l6
125
6 00
0N
ot a
vaila
ble
1 45
093
24
245
1 86
6N
ot a
vaila
ble
2 93
86
100
6 70
08
300
4 26
0N
ot a
vaila
ble
Prim
ary
& S
econ
dary
Sch
ools
2 51
62
800
Not
ava
ilabl
e N
ot a
vaila
ble
330
1 29
350
7N
ot a
vaila
ble
1 51
03
900
4 01
04
520
2 73
0N
ot a
vaila
ble
AU
DH
KD
CN
YC
NY
MY
RS
GD
ZAR
THB
AE
DU
SD
US
DU
SD
GB
PV
ND
1.31
7.77
6.89
6.89
4.44
1.40
13.4
034
.29
3.68
1.00
1.00
1.00
0.70
2274
9.00
US D
OLL
AR
(As
at 1
Apr
il 20
17)
U
S$1
=
Afric
a Pr
oper
ty &
Con
stru
ctio
n Co
st G
uide
Cost
s ba
sed
on 1
Jul
y 20
17In
tern
atio
nal B
uild
ing
Cost
Com
paris
on
Exch
ange
Rat
es to
US$
as
at 1
Apr
il 201
7
Pric
es e
xclu
de la
nd, s
ite w
orks
, pro
fess
iona
l fees
, ten
ant fi
tout
and
equ
ipm
ent.
Rate
s ex
clud
e G
ST/V
AT. H
otel
rate
s in
clud
e FF
&E
Mul
ti-st
orey
53AECOM
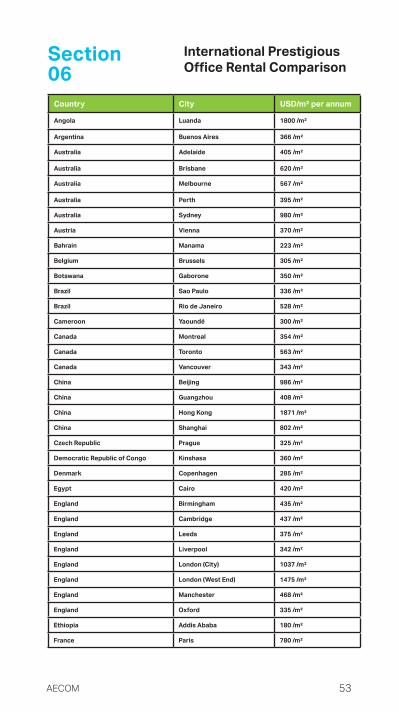
International Prestigious Office Rental Comparison
Country City USD/m² per annum
Angola Luanda 1800 /m²
Argentina Buenos Aires 366 /m²
Australia Adelaide 405 /m²
Australia Brisbane 620 /m²
Australia Melbourne 567 /m²
Australia Perth 395 /m²
Australia Sydney 980 /m²
Austria Vienna 370 /m²
Bahrain Manama 223 /m²
Belgium Brussels 305 /m²
Botswana Gaborone 350 /m²
Brazil Sao Paulo 336 /m²
Brazil Rio de Janeiro 528 /m²
Cameroon Yaoundé 300 /m²
Canada Montreal 354 /m²
Canada Toronto 563 /m²
Canada Vancouver 343 /m²
China Beijing 986 /m²
China Guangzhou 408 /m²
China Hong Kong 1871 /m²
China Shanghai 802 /m²
Czech Republic Prague 325 /m²
Democratic Republic of Congo Kinshasa 360 /m²
Denmark Copenhagen 285 /m²
Egypt Cairo 420 /m²
England Birmingham 435 /m²
England Cambridge 437 /m²
England Leeds 375 /m²
England Liverpool 342 /m²
England London (City) 1037 /m²
England London (West End) 1475 /m²
England Manchester 468 /m²
England Oxford 335 /m²
Ethiopia Addis Ababa 180 /m²
France Paris 780 /m²
Section06

54AECOM
Country City USD/m² per annum
Germany Berlin 385 /m²
Germany Frankfurt 450 /m²
Germany Hamburg 385 /m²
Germany Munich 410 /m²
Ghana Accra 431 /m²
Greece Athens 220 /m²
Hungary Budapest 280 /m²
India Bangalore 171 /m²
India Chennai 126 /m²
India Mumbai 479 /m²
Indonesia Jakarta 286 /m²
Ireland Dublin 570 /m²
Italy Rome 480 /m²
Italy Milan 600 /m²
Japan Tokyo 783 /m²
Kenya Nairobi 216 /m²
Lebanon Beirut 388 /m²
Malaysia Kuala Lumpur 121 /m²
Mexico Mexico City 593 /m²
Mozambique Maputo 341 /m²
Namibia Windhoek 178 /m²
Netherlands Amsterdam 475 /m²
New Zealand Auckland 345 /m²
New Zealand Christchurch 314 /m²
New Zealand Wellington 273 /m²
Nigeria Abuja 240 /m²
Nigeria Lagos 960 /m²
Norway Oslo 560 /m²
Oman Muscat 187 /m²
Philippines Manila 236 /m²
Poland Warsaw 335 /m²
Portugal Lisbon 225 /m²
Qatar Doha 538 /m²
Romania Bucharest 255 /m²
Russia Moscow 565 /m²
Russia St Petersburg 355 /m²
Rwanda Kigali 189 /m²
Saudi Arabia Riyadh 390 /m²
Saudi Arabia Jeddah 334 /m²
International Prestigious Office Rental Comparison

55AECOM
Country City USD/m² per annum
Scotland Edinburgh 468 /m²
Scotland Glasgow 401 /m²
Singapore Singapore 603 /m²
South Africa Cape Town 148 /m²
South Africa Durban 162 /m²
South Africa Johannesburg 208 /m²
South Africa Port Elizabeth 134 /m²
South Africa Pretoria 189 /m²
South Korea Seoul 486 /m²
Spain Barcelona 250 /m²
Spain Madrid 350 /m²
Sweden Stockholm 615 /m²
Switzerland Zurich 780 /m²
Tanzania Dar Es Salaam 288 /m²
Thailand Bangkok 213 /m²
Turkey Istanbul 249 /m²
Uganda Kampala 240 /m²
United Arab Emirates Dubai (Central Dubai) 673 /m²
United Arab Emirates Dubai (New Dubai) 498 /m²
United Arab Emirates Dubai (Old Dubai) 439 /m²
United Arab Emirates Abu Dhabi 479 /m²
United States of America America Atlanta 308 /m²
United States of America Boston 893 /m²
United States of America Chicago 492 /m²
United States of America Houston 480 /m²
United States of America Los Angeles 493 /m²
United States of America Miami 561 /m²
United States of America New York (Manhattan) 1401 /m²
United States of America Philadelphia 442 /m²
United States of America Sacramento 366 /m²
United States of America San Francisco 803 /m²
United States of America Seattle 545 /m²
United States of America Washington DC 728 /m²
Zambia Lusaka 271 /m²
Rates are applicable as at 1 January 2017 and exclude VAT, but include GST where applicable. Above are gross rentals and include operating cost and municipal cost, but exclude VAT and electricity/water consumption.
International Prestigious Office Rental Comparison

56AECOM
Section07
Building Cost Escalations
Building cost
The meaning of “building cost” depends on the application and context. A building contractor, for example, may refer to the cost of labour, material, plant, fuel and supervision. In contrast, a developer may refer to either the tender price from the contractor or the ultimate cost of the project, which could include professional fees, plan approval fees, escalation, loss of interest, etc.
For the purposes of this document, building cost shall be deemed to mean the tender price (or negotiated price) submitted by the building contractor.
Escalation rate
There seems to be two popular methods of calculating and expressing percentage annual increases, namely the average rate and the year-on-year rate. The average rate is of no real use in calculating escalation and is of general interest only. The year-on-year rate should be used in escalation calculations, taking cognizance of actual project programmes.

57AECOM
The average rate compares the indices for each month (or quarter) of the year with those of the corresponding months (or quarters) of the preceding year and calculates the average of these, which is then quoted as the average annual increase for that particular year.
The year-on-year rate compares the January (or December) index with the index for the corresponding month of the previous year, and reflects the increase over that year.
There could be a significant difference in the two rates in question. For example, in 2013 the year-on-year rate (January 2013 to January 2014) of building cost inflation in SouthAfrica was only 4.6% while the average annual rate (comparing monthly indices) was 7.3%.
Calculation of estimated escalation of construction contracts
Pre-contract
Construction cost changes on an ongoing basis for various reasons. Provision should therefore be made for changes in tender prices during the period from the date of the estimate to the expected tender date. Adding the estimated current building cost to the total equals the anticipated tender amount.
This is calculated by multiplying the estimated current building cost by the average estimated monthly percentage increase and by the number of months from date of estimate to tender date.
Contract price adjustment
Provision is made for escalation in building cost during the contract period. The Contract Price Adjustment Provisions (CPAP) formula provides for 85% of the contract amount to be subject to escalation adjustment with the remaining 15% fixed. Furthermore, a factor must be introduced to take account of the cash flow of payments during the construction period.0.6 is usually acceptable if a short method of calculation is employed.
The total escalation during the contract period is therefore calculated by multiplying the anticipated tender amount by0.85 and 0.6 and then by the estimated monthly percentage increase as indicated by the relevant indices in the CPAP formula and by the contract period expressed in months.

58AECOM
Tender price escalation
The annual year-on-year increase in building costs (i.e. tender prices) based on the indices published by the Bureau for Economic Research (BER), University of Stellenbosch (January- to-January of each year) and for CPAP formula (Work Group 181 Commercial/Industrial buildings) published by Statistics South Africa (P0151), are as follows:
Cost Indices applicable to the building industry
YEAR BER CPAP TMIIndex
(Jan=100)
Year on Year increase
Index
(Jan=100)
Year on Year increase
2012 100.0 100.0 1.00
2013 109.4 +9.4% 105.4 +5.4% 1.04
2014 114.4 +4.6% 112.3 +6.5% 1.02
2015 127.5 +11.4% 117.9 +5.0% 1.08
2016 126.7 -0.6% 121.3 +2.9% 1.04
2017 134.8 +6.4% 131.2 +8.2% 1.03
2018 147.2 +9.2% 137.8 +5.0% 1.07
2019 161.9 +10.0% 145.5 +5.6% 1.11
2020 176.4 +8.9% 153.8 +5.7% 1.15
2021 197.5 +12.0% 162.9 +5.9% 1.21
The average annual increases indicated by the BER in its publications are the average of the quarterly increases for that particular year and will not correspond to the above year-on-year increase.
The difference between tender price escalation and escalation according to the indices incorporated in the CPAP formula for any one period may be attributed to the market factor, which incorporates the contractors mark-up, productivity, availability of materials, etc.
* Forecast based on information provided by Medium-Term Forecasting Associates Building Economists, Stellenbosch.

59AECOM
Tender climate
The column marked Tender Market Indicator (TMI) gives an indication of the tender climate. The building cost index, as published by the BER, based on tender prices, has been deflated by the index for CPAP Work Group 181, based on the cost of labour and material. The result is the movement of tender prices excluding the influence of market costs of labour and material, giving an indication of competitiveness of tendering. It represents a comparison or rate of change of BER and CPAP indices.
When the TMI (see graph on page 61) shows a downward gradient, this indicates a favourable tender market, i.e. the next point is numerically less, resulting from the calculation of BER divided by CPAP indicating that the increase in BER (tender index) is less than the increase in the CPAP index. Therefore, there is a favourable tender market from the viewpoint of the employer.
Conversely, if the graph has an upward gradient, the increase in BER is greater than the increase in CPAP indices, indicating an unfavourable tender market from the viewpoint of the employer. Thus it would be prudent to recommend negotiation as opposed to tendering.
This tendency is also apparent on the cost indices graph (see page 62). When the two lines (CPAP and BER) converge, i.e. CPAP is dropping and BER is rising, you should negotiate. When the two lines diverge, i.e. CPAP is rising and BER is dropping, proceed to tender instead.
Base dates: To allow for comparison of indices, a factor has been introduced resulting in an equal base for both BER and CPAP indices (i.e. January 2012 = 100).

60AECOM
Unique large-scale projects
Building cost estimation seems to become more complex when unique circumstances prevail. For example, when a FIFA World Cup, Olympic Games or similar event takes place in a particular country, many new construction works and associated infrastructure projects are awarded.
Projects of such magnitude can only be constructed by major contractors possessing the required expertise and resources. It is often experienced that the unit costs of these projects are significantly higher than anticipated originally. Selected contractors at this level have little competition. Based on a favourable supply and demand, they price costs accordingly, resulting in client cost overruns and severe pressure on budgets.
Value-added tax
As the majority of developers are registered vendors in the property industry, any VAT on commercial property development is fully recoverable. Therefore, to reflect the net development cost, VAT should be excluded. Should the gross cost (i.e. after VAT inclusion) be required, then VAT at the ruling rate (currently 14%) should be added.
Cognizance should be taken, however, of the effect of VAT on cash flow over a period of time. This will vary according to the payment period of the individual vendor. In all cases, however, it will add to the capital cost of the project to the extent of interest on outstanding VAT for the VAT cycle of the particular vendor.

61AECOM
GRAPHS: BER AND CPAP
January to January Building cost % change
52
GRAPHS: BER AND CPAP January to January Building cost % change
-2%
0%
2%
4%
6%
8%
10%
12%
14%20
12
2013
2014
2015
2016
2017
2018
2019
2020
% In
crea
se
Year
Bureau for Economic Research
Contract Price Adjustment Provisions(CPAP)

62AECOM
January building cost indices
Bureau for Economic Research
Contract Price Adjustment Provisions (CPAP)
2012
2013
2014
2015
2016
2017
2018
2019
2020
Year
0
50
100
150
200
250
Cost
Inde
x

63AECOM
Tender market indicator
BER deflated by CPAP
This graph gives an indication of the tender climate. It is the result of the relationship between BER and CPAP. Refer section on tender climate, page 59.
Year
1.25
1.20
1.15
1.10
1.05
1.00
0.95
0.90
Indi
cato
r
2012
2013
2014
2015
2016
2017
2018
2019
2020
Tender Market Indicator
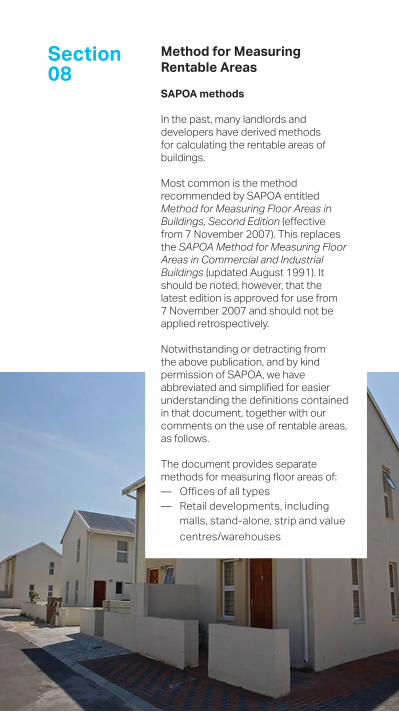
64AECOM
Section08
Method for Measuring Rentable Areas
SAPOA methods
In the past, many landlords and developers have derived methods for calculating the rentable areas of buildings.
Most common is the method recommended by SAPOA entitled Method for Measuring Floor Areas in Buildings, Second Edition (effective from 7 November 2007). This replaces the SAPOA Method for Measuring Floor Areas in Commercial and Industrial Buildings (updated August 1991). It should be noted, however, that the latest edition is approved for use from 7 November 2007 and should not be applied retrospectively.
Notwithstanding or detracting from the above publication, and by kind permission of SAPOA, we have abbreviated and simplified for easier understanding the definitions contained in that document, together with our comments on the use of rentable areas, as follows.
The document provides separate methods for measuring floor areas of:
— Offices of all types — Retail developments, including
malls, stand-alone, strip and value centres/warehouses

65AECOM
— Industrial developments, including factories, warehouses, mini-units and trading warehouses, multi-storey and the like
— Residential buildings, including houses, flats/apartments, townhouses, cluster houses, etc.
For offices of all types, the following definitions and explanations are applicable:
The basis
The basis used in calculating the rentable area is the measurement of usable area, together with common and supplementary area, as determined at each level. Unless otherwise indicated, the unit of measurement is square metres (m²).
Area definitions
Construction area
The construction area is the entire covered built area. This is the sum of the areas measured at each floor level over any external walls to the external finished surface.
Only the lowest levels of atria are included, and all openings on other levels to form atria are to be excluded.
Rentable area
The rentable area is the total area of the building enclosed by the dominant face, adjusted by deducting major vertical penetrations. No deduction is made for columns.
Its intended use is in determining the revenue-producing area of a building, which comprises rentable area, supplementary area and parking. It is also used by those analysing the economic potential of a building.
Rentable area has a minimum floor-to-ceiling height of 1.5 metres.
Rentable area comprises useable area plus common area.
Rentable area excludes supplementary area, which may produce additional revenue.
66AECOM
Usable area
The usable area is the area capable of exclusive occupation by the tenant i.e. the total area of the building enclosed by the dominant face, adjusted by deducting all common area and major vertical penetrations. No deduction is made for columns.
Its intended use is to be the essential part of rentable area and the basis for apportioning common area.
Common area
Common area is an area to which the tenant has access and/or use, and is part of the rentable area. The primary common area of the building is apportioned to tenancies pro-rata to the usable area of that tenancy. The secondary common area is apportioned only to tenancies that it services.
The common area has two components: — The primary common area comprises all rentable area on
a given floor that is not useable area, together with remote common area, which comprises entrance foyers, plant and service rooms, or any other portion of rentable area not located on the given floor.
— The secondary common area comprises areas beyond primary common area giving access to multiple tenancies. Accordingly, this may vary over the life of a multiple tenancy building.g.
Supplementary area
Supplementary area is any additional revenue-producing component that falls outside of the definition of rentable area. Supplementary area need not be weatherproof. For example, it includes storerooms, balconies, terraces, patios, access/service passages and signage/advertising areas and parking areas demarcated for tenant use. Parking bays shall be given in number.

67AECOM
General Definitions
Atrium
An atrium is a weatherproof interior space, accessible and capable of use by the tenant at the lowest level. Voids in floors above the atrium space are not included in the rentable area.
Entrance foyer
The entrance foyer is a portion of remote common area, including associated adjacent rooms and lobby.Lift lobby and entrance foyers that occur together with parking floors (not adjacent to office areas) comprise remote common area.
Major vertical penetrations
Major vertical penetrations, stairs and landings, lift shafts, flues, pipe shafts, vertical ducts, and the like, and their enclosing walls, exceeding 0.5m² in area, are deducted from the rentable area.
Remote service areas and plant rooms
Remote refuse rooms, electrical sub-stations, transformer rooms, central air-conditioning plant rooms and lift motor rooms are included in the primary common area.
Storage areas
Dedicated storage areas within the useable area are included as usable area.
Dedicated storage areas are listed separately as supplementary areas.

68AECOM
Retail, Industrial, Residential and other developments
Similar provisions have been made for measuring the floor areas of retail, industrial and residential buildings referred to on page 66. For detailed information, it is suggested that the relevant sections of the said document be studied carefully.
The above method is designed to accommodate the measurement, as far as practical, of most building types. However, certain building types such as hotels, leisure and sport centres, petrol stations, hospitals, law courts, retirement villages and others may only utilise the underlying principles of this method.
In General
Developers and financiers are constantly attempting to either reduce building costs or increase rental levels to achieve higher returns. When these parameters are exhausted, it becomes incumbent on the architects and designers to design more efficiently. One must therefore understand the complete SAPOA Method for Measuring Floor Areas in Buildings, First Edition, and implement the various facets of the definitions to achieve higher efficiencies between the various areas.
The initial return is more sensitive to an increase in rental income (which can be affected by increasing the rental area) than the corresponding percentage reduction in construction costs.
Once again, the above has been published as a quick guideline only, and should not be used in preference to the SAPOA publication, which is far more comprehensive and detailed.We acknowledge and thank SAPOA for its permission to use extracts from this publication.

69AECOM
Section09
Return on Investment
Criteria to be employed
There are two distinct criteria generally used for evaluating thefinancial viability of a property investment, namely:
— The initial return, and — The cash flow analysis.
The initial return
The initial return is based on the net income during the first year of operation of the development. The return is expressed as a percentage per annum of the anticipated capital investment. Escalation in construction cost and cost of capital are both taken into account in an effort to incorporate the time value of money.
The major advantage of employing the initial return method is that expenses and income do not have to be escalated too far into the future. Therefore these are relatively accurate and easily understood in today’s monetary terms. The fact that the first year of operation may have a higher vacancy factor than subsequent years should be ignored when the initial return is calculated in order to reflect long-term potential more accurately. The initial return should be qualified as follows:
— All expenses and income have been escalated to the construction completion date
— Interim income received prior to the construction completion date has been deducted from the capital investment after adjusting for operating expenses and cost of capital

70AECOM
— The returns are expressed as percentages of the escalated capital investment and do not take into account loans, loan repayments or interest charges on loans
— The calculated returns are for the first complete year of operation only and do not cater for the following:
• When the project may not reach full maturity during the first year of operation
• Vacancies• Recoupment of capital during the income-
bearing period of the investment or realisation value of the investment at the end of the investment period
• Income tax Cash flow analysis over a predetermined period
In the cash flow method, the income and expenditure cash flow over the economic lifespan of the investment is taken into account. Usually an Internal Rate of Return (IRR) and/or a Net Present Value (NPV) is employed to evaluate the financial viability.
The NPV (discounted cash flow) method works as follows:Determine the sum of all cash flows (inflows, outflows and initial investment) and discount to present values at the project’s cost of capital. With a positive NPV the project can be accepted and it should be rejected if the NPV is negative.
The IRR is the rate of interest that equates the present value of the expected future net income with the present valueof the cost of the investment. The NPV would therefore be exactly zero if the IRR is used as the discount rate. The IRR of an investment is generally used by institutional investors, as it is a comparative indication of the profitability of alternative investment options.
A weakness of the IRR calculation is the fact that an implicit assumption is made that cash flows are reinvested at the project’s own IRR. The Modified Internal Rate of Return (MIRR) overcomes this by assuming that cash flows are reinvested at the cost of capital rate (or any other given rate), and may be calculated in addition. As the cost of capital rate is normally determined at a lower rate than the IRR, it can be assumed that the MIRR calculation will always render a lower result.

71AECOM
The assumptions on which the cash flow return is based must be listed. These should include the assumed investment period (e.g. 20 years after the construction completion date), that income has been taken into account at the beginning of each month and expenditure at the end of each month, the terminal value, and escalation in rental and operating expenses over the investment period, etc.
It is suggested that, where applicable, a comprehensive financial viability analysis should incorporate both the initial return and the cash flow method of evaluation. It is significant to note that there is a close relationship between the initial return and the IRR. However, this is to be applied with care by an experienced analyst.
Example
Total capital expenditure(investment) R 100,000,000Rental in first year (net income) R 10,500,000 Initial return in first year 10.50% Escalation in net rental income 9.00% per annum
Net cash flow
Year 0 -100,000,000Year 1 10,500,000Year 2 11,445,000Year 3 12,475,050Year 4 13,597,805Year 5 14,821,607Year 6 16,155,552Year 7 17,609,551Year 8 19,194,411Year 9 20,921,908Year 10 22,804,879Year 11 24,857,319Year 12 27,094,477Year 13 29,532,980Year 14 32,190,948Year 15 35,088,134Year 16 38,246,066Year 17 41,688,212Year 18 45,440,151Year 19 49,529,764Year 20 53,987,443 (+ terminal value) 560,441,075 614,428,518
The IRR with a 9.00% annual escalation in rental is 19.50%.

72AECOM
The terminal value is subjective and in this example has been assumed as the capitalised value of the anticipated rental in Year 21 (i.e. R53,987,443 + 9.00% = R58,846,313) capitalised at the initial yield, i.e. 10.50%.
Should the terminal value be assumed to be nil (this is unlikely as the land parcel will always have a value), the IRR drops to 16.92%.
A rule of thumb for the calculation of the approximate IRR of an investment is that it is equal to the sum of the initial return plus the escalation rate (assumed to be constant over the investment period), provided that the terminal value is calculated as in the given example, i.e. the capitalised value of the anticipated rental in the year after disposal, assuming a capitalisation rate equal to the initial return.
Thus, in the given example, the initial return is 10.50%, the escalation rate is 9.00%, and the approximate IRR is the sum of the two, i.e. 19.50%.
Where Green Star South Africa ratings are a requirement, cash flow analyses over longer time periods have become essential. Capital expenses are normally higher due to investment in “green” technology and more expensive methods employed. Therefore, the long-term effect on the operation and maintenance of buildings due to better energy efficiency and the like should be demonstrated to building owners and tenants in order to determine the viability scientifically.
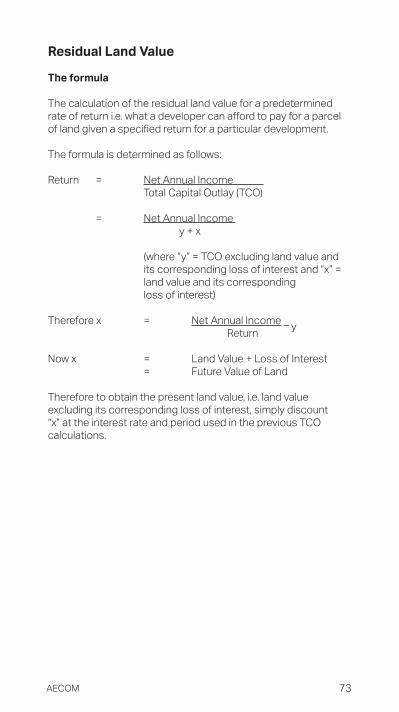
73AECOM
Residual Land Value
The formula
The calculation of the residual land value for a predetermined rate of return i.e. what a developer can afford to pay for a parcel of land given a specified return for a particular development.
The formula is determined as follows:
Return = Net Annual Income Total Capital Outlay (TCO)
= Net Annual Income y + x
(where “y” = TCO excluding land value and its corresponding loss of interest and “x” = land value and its corresponding loss of interest)
Therefore x = Net Annual Income _ y Return Now x = Land Value + Loss of Interest = Future Value of Land
Therefore to obtain the present land value, i.e. land value excluding its corresponding loss of interest, simply discount “x” at the interest rate and period used in the previous TCO calculations.

74AECOM
Example
What price should be paid for land to obtain a return of 10.00%p.a. with a net annual income of R6 million and the following capital outlay?
Estimated escalated building cost R 38,150,000Professional fees 5,725,000Legal and plan approval fees 45,000 Interim rates on ground during construction period 265,000Loss of interest and/or bond interest at 10.5% p.a. compounded monthly over a 15 month construction period 3,180,000
Total capital outlay excluding land cost (y) R 47,365,000
x = Net Annual Income _ y Return
= R6,000,000 - R47,365,000 0.10
= R12,635,000
Therefore land value is R12,635,000 discounted at 10.5% p.a. over15 months = R11,087,204 (say) R11 million
The above residual value is very sensitive to changes of the required rate of return, otherwise known as the capitalisation rate (CAP rate), and careful consideration should be considered carefully, taking into account the risk profile of the proposed development.

75AECOM
Section10
SOUTH AFRICAN OFFICES:
BloemfonteinT +27 51 448 2721
Bellville, Cape Town T +27 21 950 7500 V&A Waterfront, Cape TownT +27 21 418 1405 Umhlanga Ridge, DurbanT +27 31 204 3800
GeorgeT +27 44 873 5070
Sandton, Johannesburg T +27 11 666 2000
Centurion, Pretoria T +27 12 421 3500
Gaborone, BotswanaT +267 39 007 11
Accra, GhanaT +233 575 444 554
Nairobi, KenyaT +254 205 137 054
Maputo, MozambiqueT +258 21 498 797
Lagos, NigeriaT +234 802 417 4152
Kampala, UgandaT +256 313 673 217
Directory of Offices in Africa
Africa Corporate Head Office Centurion, Pretoria South Africa T +27 12 421 3500

76AECOM
Principal AuthorDr. Gerhard Brümmer
Marketing and Design Rashree Maharaj
AECOM would like to thank all clients, partners and project teams for their contribution in producing this publication.
Every effort has been made to ensure accuracy, give credits, and trace copyright holders where appropriate. If any have been overlooked inadvertently, the necessary arrangements will be made at the first opportunity to amend the publication.

77AECOM
Africa Property & Construction Cost Guide 2017
28th EDITION © 2017
ISBN 978-0-620-75735-5
©AECOM South Africa (Pty) Limited. All rights reserved.
AECOM has prepared this document for the sole use either for a client and/or for a specific professional purpose, each as expressly stated within this document. No other partyshould rely on this document without the prior written consent of AECOM. AECOM undertakes no duty, nor accepts any responsibility, to any third party who may rely upon or usethis document. This document has been prepared based on the client’s description of its requirements and AECOM’sexperience, having regards to assumptions that AECOM can reasonably be expected to make in accordance with sound professional principles. AECOM may also have relied upon information provided by the client and other third parties to prepare this document, some of which may not have been verified. Subject to the above conditions, this document may be transmitted, reproduced or disseminated only in its entirety.

78AECOM
This book has been printed on uncoated, environmentally friendly paper.

About AECOM
AECOM is built to deliver a better world. We design, build, finance and operate infrastructure assets for governments, businesses and organisations in more than 150 countries. As a fully integrated firm, we connect knowledge and experience across our global network of experts to help clients solve their most complex challenges. From high-performance buildings and infrastructure, to resilient communities and environments, to stable and secure nations, our work is transformative, differentiated and vital. A Fortune 500 firm, AECOM had revenue of approximately $17.4 billion during fiscal year 2016. See how we deliver what others can only imagine at aecom.com and @AECOM.
aecom.com©2017 AECOM.
All Rights Reserved.