prompt oil price ($/bbl) $51.49 $0.04 0.1% prompt gas price … · 2018-12-10 · 3 december 10,...
TRANSCRIPT

1
December 10, 2018
IndicatorCurrent
Value
Week's
Change
%
Change Direction
Prompt Oil Price ($/bbl) $51.49 $0.04 0.1%
Prompt Gas Price ($/mmbtu) $4.33 ($0.32) (6.9%)
Wkly Trans. Value ($mm) $14 $14 nmf
Wkly Trans. Count 5 4 nmf
US Rig Count 1,075 (1) (0.1%)
US Oil Prod'n (mmbbl/d) 11.7 -- --
US Gas Prod'n (bcf/d)(1) 104.5 1.9 1.9%
US Oil Storage (mmbbl) 443.2 (7.3) (1.6%)
US Gas Storage (tcf) 3.0 (0.1) (2.1%)
$2.2
$8.0
$9.9 $10.7
$4.9
$15.8
$21.2 $21.9 $24.1
$17.0
$9.1 $9.2
$20.8
$8.0
$31.6
$21.5
--
50
100
150
200
250
300
350
400
450
500
--
$5
$10
$15
$20
$25
$30
$35
$40
1Q15 2Q15 3Q15 4Q15 1Q16 2Q16 3Q16 4Q16 1Q17 2Q17 3Q17 4Q17 1Q18 2Q18 3Q18 4Q18
61% 83% 74% 79% 39% 52% 62% 71% 93% 24% 68% 82% 91% 64% 46% 94%
Nu
mb
er
of
Tra
nsacti
on
s
Tra
nsacti
on
Valu
e (
$b
n)
Asset Corporate Number of Transactions
% Oil
Debt
Markets
No issuers priced this week
U.S. high yield funds reported an outflow of $829 million
ETFs reported an outflow of $218 million, while mutual funds reported an outflow of $611 million
High yield index yield was 7.38%; high yield energy index yield was 8.63%
OPEC+ reached a modest deal to cut production, stabilizing
oil prices
Berry Petroleum divested non-core East Texas natural gas
assets
Eagle Resources Corporation entered into a joint venture
agreement with Freedom Energy Resources to explore and
develop conventional oil drilling prospects in the Lodgepole
Reef Formation in North Dakota
The December issue of BMO Calgary’s A&D (Canadian)
Market Monitor went live last week – read more here
Top 10 Toys for the Season – from BMO toy analyst Gerrick
Johnson – watch here
Source: BMO Transaction Database, Baker Hughes, BMO Commodity Products Group, Bloomberg, EIA, PLS
Note: Current quarter’s data is through the week covered by this issue.
1. EIA U.S. natural gas gross withdrawals and production reported monthly as of September 2018.
2. S&P E&P = S&P Oil & Gas E&P Select Industry, SPX = S&P 500 Index.
Key Industry Indicators
Quarterly Deal Activity
S&P E&P(2) underperformed last week (4.7)% vs. SPX(2) (1.5)%
The major U.S. equity indexes finished lower last week. Sector performance was mixed with consumer
discretionary, consumer staples, financials, health care, industrials, materials, and tech all finishing lower.
Real estate finished up 2.8%
Equity
Markets
Oil ended last week up as uncertainty surrounded the level of OPEC production cuts. Russian and Saudi
energy ministers met at the G20 summit, and the OPEC Economic Commission Board stated that output
needed to be trimmed. Alberta announced that it will cut oil production next year, which caused WCS
pricing to rally. A tariff truce was announced between China and the United States. Enbridge had to shut
down pipelines after a power outage in Saskatchewan. U.S. crude oil inventories were significantly lower.
The near-term contract closed up $0.04, or 0.1%, at $51.49
Natural gas ended last week down despite a colder weather forecast. The near-term contract closed
down $0.32, or 6.9%, at $4.33
Commodities
Week in Review
In Commodities, ECM and DCM, let’s go to journalism standards, even
though that’s not how we get the text from those groups. Main change is
that any number below 10 is spelled out (one instead of 1). This does not
apply to statistical analyses, percentages, or money, of course.
Let’s follow these guidelines when sorting articles:
• First priority: Domestic A&D, ranked by size
• Next: Domestic M&A
• Then: US companies doing international deals (like
Noble’s Tamar)
• Then: Others (Cabot’s Lackawanna)
• Then: Prices, rig count, completions, etc.
To paste the arrows with colors,
• FactSet
• Settings
• Presentation Linking and Formatting
• Import
• Colors
• Change Color Font
For the primary Commodities bullet points on oil and gas
prices, please start with “The near-term contract opened the
week at $___” and end that same bullet point with “The
near-term contract closed the week at $____, down(up)
$___, or ___%.” You don’t have to use exactly those words
as long as the opening and closing prices are included . For
example, you could write, “Opening the week at $45.21, the
near-term oil contract declined steadily based on …” – you
know, think like a journalist, be creative.
Covering the Week of November 30 to December 6, 2018
The October issue of BMO Calgary’s A&D (Canadian)
Market Monitor went live last week – read more here
[TBU]
[TBU]
[TBU]
[TBU]
[TBU] [TBU]

2
December 10, 2018
Permian41%
Rockies (ex. Bakken)
8%
Bakken3%
Appalachia3%
Mid-Con17%
Eagle Ford5%
Ark-La-Tex4%
Gulf of Mexico3%
Other16%
LTM By Region
y = 31.242e-0.064x
R² = 0.3156
--
$10.00
$20.00
$30.00
$40.00
$50.00
$60.00
-- 5.0x 10.0x 15.0x 20.0x 25.0x 30.0x
Sale
s P
rice /
Pro
ved
R
eserv
es (
$/b
oe @
15:1
)
R / P
R / P
Sales Value /
Proved Reserves
(15:1)
(ratio) ($ / boe) ($ / mcfe)
8x $18.68 $1.25
10x $16.42 $1.09
15x $11.91 $0.79
20x $8.63 $0.58
Oil67%
Gas33%
LTM By Commodity
Public Company
33%
PE / PE-Backed
30%
Private23%
Other14%
LTM By Buyer Type
Ann'd
Date Buyer Seller Area Asset Description Value (1)
Proved
Multiple
Prod.
Multiple Net Acres
($mm) ($/boe) ($/boe/d) ($/acre)
21-Nov-18 Kimbell Royalty Partners Undisclosed Seller Multi-Region 16,700 net royalty acres $108 n.a. $90,588 nmf
19-Nov-18 Lonestar Resources Inc Sabine Oil & Gas Corp Eagle Ford 2,706 net acres in Eagle Ford $39 $2.98 $48,375 $14,302
19-Nov-18 Aethon III QEP Resources Inc Ark-La-Tex 49,700 net acres in Haynesville $735 $4.60 $14,848 $14,789
07-Nov-18 Vantage Energy Acq. Corp QEP Resources Inc Bakken 102,800 net acres in Williston Basin $1,725 n.a. $37,500 $16,780
07-Nov-18 Undisclosed Buyer Devon Energy Barnett 100,000 net acres in Barnett Shale $50 n.a. $12,500 $500
06-Nov-18 Diamondback Energy ExL Pet.; EnergyQuest Permian 3,646 net acres in Midland Basin $313 n.a. $89,286 $85,710
05-Nov-18 Centennial Resource Dev. Undisclosed Seller Permian 820 net acres in Delaw are Basin $26 n.a. n.a. $31,707
02-Nov-18 SandRidge Energy Undisclosed Seller Mid-Continent Mississippi Lime and NW STACK assets $25 n.a. $6,649 n.a.
01-Nov-18 Undisclosed Buyer Parsley Energy LP Permian 11,850 net acres in Midland Basin $170 n.a. $141,667 $14,346
31-Oct-18 Undisclosed Buyer New pek Other 725 net acres in Live Oak Co., TX $33 n.a. $42,581 $45,517
Blue = BM O provided transaction advisory services Green = BM O provided acquisit ion f inancing or related services
Purple = BM O provided both transaction advisory services and acquisit ion f inancing or related services
The 10 Most Recent Asset Transactions Over $20 Million
A&D Valuation Trends(3)
Source: BMO Transaction Database, Baker Hughes, BMO Commodity Products Group, Bloomberg, PLS
1. Represents total enterprise value.
2. Calculated as percentage of total LTM transaction count (number of transactions, not dollar value).
3. 62 transactions from January 2015 to 2018YTD with transaction value >$20mm. Adjusted for changes in price outlooks. Recalculated boe reserves are on a 15:1
(gas:oil) basis. Acreage transactions excluded by using deals with PDP of >= 40% of total proved.
Asset descriptions are all hard-coded and need to be
adjusted if new deals are added
(2) (2) (2)
Confirm number of transactions weekly --->
[TBU]
[TBU]
[TBU]

3
December 10, 2018
12/4/2018
Appalachia 3
Ark-La-Tex 6
Bakken 6
Eagle Ford 5
Mid-Con 7
Other 20
Permian 20
Rockies 10
77
Select Significant Deals on the Market
Disclaimer: The foregoing links are for convenience only and relate to materials that were not prepared or reviewed by BMO Capital Markets. BMO Capital Markets takes
no responsibility for and makes no representations with respect to the contents thereof. These materials may be inconsistent with the views of BMO Capital Markets.
Source of Select Significant Deals on the Market: BMO Transaction Database
Industry Headlines
Appalachia
3 Deals
Mid-Con
7 Deals
Eagle Ford
5 Deals
Permian
20 Deals
Other
20 Deals
Rockies
10 Deals
(Click headline to link to the full article)
A&D Headlines
Bakken
6 Deals
Ark-La-Tex
6 Deals
Oil's Price Slide Threatens U.S. Shale Production
The U.S. Pipeline Industry Is Booming
Permian Basin Gas Flaring Has Nearly Doubled in a
Year
Meet the New Permian, It's Double the Size of the Old
One
U.S. Becomes Net Oil Exporter for First Time in 75
Years
OPEC+ Reaches Modest Deal to Cut Production,
Stabalize Oil Prices
Mexico's New President Throws Down Gauntlet to Oil
Majors
Berry Petroleum Sells Non-Core East Texas Natural
Gas Assets
Eagle Resources, Freedom Energy Have Entered into
North Dakota Drilling JV
BMO Deals (Status)
Wishbone CBP (In Market) – Pg. 4
[TBU]
[TBU] [TBU]
BMO Deals (Status)
Wishbone CBP (In Market) – Pg. 4

4
December 10, 2018
Opportunity to acquire ~37,206 net contiguous acres in the core of
the San Andres horizontal play in Northern Central Basin Platform
Operated average WI/NRI of 77%/58%
Approaching 50% HBP with minimal annual drilling
commitments
96% operated by production
Net production of ~8,100 boe/d (November 2018E)
80% oil, 13% NGL
100%+ ROR oil play in the highly coveted Permian Basin
Future drilling opportunities have reserve models of 385 to
700 Mboe (80% oil)
Position has largely been de-risked through active development by
Wishbone and offset operators
Extensive inventory of high return drilling remains with over 344
San Andres horizontal drilling locations
5,000’ laterals – 323 locations
7,500’ laterals – 21 locations
Controlled surface lands/water infrastructure creates high margins
and empowers the buyer to be a play consolidator
WTS barrels and crude pipeline infrastructure in place with no
takeaway issues
VDR available now
Source: Wishbone CBP Divestiture announcement
Integrated
Water
Infrastructure
Owned and operated SWD system and fresh water source wells keep operating expenses low and enhance well
economics
Water infrastructure generates additional income
Infrastructure provides flow assurance for disposal and source water
1,385 acres of owned surface acreage allows buyer to expand system
Ample existing disposal capacity of 178,000 bw/d with excess available for third-party or commercialization
Improved
Horizontal
San Andres
Performance
Highly oil-saturated, oil-wet, dolomite reservoir located in the core area of very active development in the horizontal San
Andres play
Over the last four years, operators have developed a significant understanding of the reservoir and operational
characteristics defining the play
Recent drilling activity has yielded improved well performance
Time to peak production is less than 60 days
Initial peak 30-day rates of 400-700 bo/d
Operators continue to commit significant capital to the play with multiple active drilling rigs and 54 horizontal San Andres
permits
Wishbone’s
Premier
Position
Contiguous leasehold, adjacent to the prolific Wasson and Brahaney fields offering the best combination of reservoir
quality, quantity, and oil saturations in the core of the horizontal San Andres play
Position has largely been de-risked through active development by Wishbone and offset operators
Most recent quarter (2Q18) annualized cash flow of $60 MM can easily support a one rig drilling program
Acreage is approaching 50% HBP with minimal annual drilling commitments
High
Return
Inventory
Extensive inventory of high return drilling remains with over 344 San Andres horizontal drilling locations
Well economics of greater than 100% ROR compete with other top Permian plays
Future drilling opportunities have reserve models of 385 to 700 Mboe (80% oil)
Spacing of 4 to 8 wells per section supported by volumetrics with a recovery factor of 12-15% of OOIP; further supported
by an independent Von Gonten report
Stacked potential in San Andres could add additional drilling locations
Successful step-out completion helps prove play continuity in northern area
Currently on the Market from CIBC and BMO: Wishbone CBP Divestiture
ASSET HIGHLIGHTS
ASSET OVERVIEW PROCESS OVERVIEW

5
December 10, 2018
NYMEX Gas Futures as of 06-Dec-18 Close ($/mmbtu)
Period(1) Current Last Wk. 6 Mo. Ago 1 Yr. Ago
12 Mo. Strip $3.22 $3.24 $2.89 $2.91
2019 $3.22 $3.22 $2.78 $2.84
2020 $2.69 $2.66 $2.69 $2.81
2021 $2.64 $2.64 $2.66 $2.83
2022 $2.81 $2.81 $2.81 $2.98
2023 $2.81 $2.81 $2.81 $2.98
NYMEX WTI Futures as of 06-Dec-18 Close ($/bbl) NYMEX Gas Futures as of 06-Dec-18 Close ($/mmbtu)
Period(1) Current Last Wk. 6 Mo. Ago 1 Yr. Ago
12 Mo. Strip $52.68 $52.20 $63.71 $55.20
2019 $52.68 $52.20 $62.18 $53.20
2020 $53.50 $53.15 $59.22 $51.79
2021 $53.35 $53.49 $56.89 $50.94
2022 $53.12 $53.67 $55.20 $50.54
2023 $53.14 $53.97 $53.97 $50.53
25%
35%
45%
55%
65%
Jan-15 Jun-15 Nov-15 Apr-16 Sep-16Feb-17 Jul-17 Dec-17May-18 Oct-18
% o
f W
TI
NGL as % of WTI
$1
$2
$3
$4
$5
Dec-17 Jun-18 Dec-18 Jun-19 Dec-19
($/m
mb
tu)
$20
$30
$40
$50
$60
$70
$80
Dec-17 Jun-18 Dec-18 Jun-19 Dec-19
($/b
bl)
Historical Prices as of 06-Dec-18 Close ($/gal)
NGLs Current Last Wk. 6 Mo. Ago 1 Yr. Ago
Ethane $0.31 $0.34 $0.32 $0.22
Propane $0.72 $0.69 $0.87 $0.98
Butane $0.70 $0.68 $0.91 $1.00
Iso-butane $0.90 $0.87 $1.35 $1.03
Pentane+ $1.03 $0.98 $1.49 $1.31
NGL PRICING(2)
HENRY HUB NATURAL GAS (HISTORICAL / FORECAST)
Commodity Prices
Source: BMO Commodity Products Group, Bloomberg, FactSet
1. Future prices are calendar year average unless stated otherwise.
2. Assumes typical Gulf Coast barrel composition.
WTI OIL (HISTORICAL / FORECAST)
Links:
http://www.nasdaq.com/markets/crude-oil.aspx
http://www.bloomberg.com/quote/CL1:COM
http://www.nasdaq.com/markets/natural-gas.aspx
http://www.bloomberg.com/quote/NG1:COM
Link to Detailed
Futures Data
Link to Detailed
Historical Graph
Link to Detailed
Futures Data
Link to Detailed
Historical Graph
[TBU]
[TBU]
[TBU]

6
December 10, 2018
AECO
Northern
California
Sumas
Southern
California
El Paso - SJ
Waha
HSC
Henry Hub
Panhandle
CIG Chicago
Dominion
Transco
Clearbrook
Midland
Cushing
St. James
(LLS)
East Coast
U.S. (Brent)
Midland Sweet-
Sour Spread
EMS
NATURAL GAS PRICING & DIFFERENTIALS TO HENRY HUB ($ / MMBTU) – AS OF 06-DEC-18
Commodity Prices (cont’d)
OIL PRICING & DIFFERENTIALS TO CUSHING WTI ($ / BBL) – AS OF 06-DEC-18
Legend
Price
Diff.
Legend
Price
Diff.
Source: BMO Commodity Products Group, Bloomberg
Note: Prices and differentials are for prompt month futures except for Clearbrook which is based on spot prices.
MAPS IN
MASTER VIEW
TBU
[TBU]
[TBU]
$60.06
$8.57
$39.42
($12.07)
$43.38
($8.11)
$51.49
($0.19)
$49.49
($2.00)
$57.83
$6.34
$3.93
($0.40)
$4.41
$0.08
$4.33
$4.08
($0.25)
$4.39
$0.06
$1.35
($2.98)
$3.95
($0.38)$3.86
($0.47)$5.63
$1.30
$5.11
$0.78
$7.33
$3.00
$1.17
($3.16)
$3.85
($0.48)

7
December 10, 2018
0%
10%
20%
30%
40%
50%
--
100
200
300
400
500
Jan-14 Jan-15 Jan-16 Jan-17 Jan-18
H V+D % of Total Rigs
Item Value Wkly Change Last Week Item Value Wkly Change Last Week
Rig Count 489 (4) 493 Oil Differential ($8.10) ($0.50) ($7.60)
Permitting Activity 305 82 223 Gas Differential ($2.93) $1.64 ($4.56)
805
1,053990
1,1781,156
1,297
1,0921,154
1,225
993
1,233
1,071
192
Dec-17 Feb-18 Apr-18 Jun-18 Aug-18 Oct-18 Dec-18
H V+D
-$4.80
-$3.20
-$1.60
$0.00
$1.60
Jan-15 Nov-15 Sep-16 Jul-17 May-18
-$18.00
-$12.00
-$6.00
$0.00
$6.00
$ /
mm
btu
$ /
bb
l
Midland Waha
5,000
6,000
7,000
8,000
9,000
10,000
1,000
1,500
2,000
2,500
3,000
Jan-14 Jul-14 Jan-15 Jul-15 Jan-16 Jul-16 Jan-17 Jul-17
mm
cf/
d
mb
bl/
d
Oil Gas2,874
9,328
--
$50,000
$100,000
$150,000
$200,000
1Q
14
2Q
14
3Q
14
4Q
14
1Q
15
2Q
15
3Q
15
4Q
15
1Q
16
2Q
16
3Q
16
4Q
16
1Q
17
2Q
17
3Q
17
4Q
17
1Q
18
2Q
18
3Q
18
4Q
18
3 7 9 5 1 2 6 9 5 7 11 9 9 6 1 0 7 1 5 4
$ /
bo
e/d
# Deals
$119,953
--$10,000$20,000$30,000$40,000$50,000$60,000
1Q
14
2Q
14
3Q
14
4Q
14
1Q
15
2Q
15
3Q
15
4Q
15
1Q
16
2Q
16
3Q
16
4Q
16
1Q
17
2Q
17
3Q
17
4Q
17
1Q
18
2Q
18
3Q
18
4Q
18
3 6 8 5 1 2 8 8 6 6 12 13 15 7 3 2 7 1 5 4
$ /
acre
# Deals
$21,133
Ann'd
Date Buyer Seller Asset Description Value(1)
Proved
Multiple
Prod.
Multiple Net Acres
($mm) ($/boe) ($/boe/d) ($/acre)(2)
06-Nov-18 Diamondback Energy ExL Pet.; EnergyQuest 3,646 net acres in Midland Basin $313 n.a. $89,286 $85,710
05-Nov-18 Centennial Resource Dev. Undisclosed Seller 820 net acres in Delaware Basin $26 n.a. n.a. $31,707
01-Nov-18 Undisclosed Buyer Parsley Energy LP 11,850 net acres in Midland Basin $170 n.a. $141,667 $14,346
17-Oct-18 Earthstone Energy Inc Sabalo Energy 20,800 net acres in Midland Basin $976 $10.73 $87,143 $46,923
25-Sep-18 Undisclosed Buyer W&T Offshore Royalty interests in 25,493 net acres $57 n.a. n.a. nmf
Mean $308 $10.73 $106,032 $44,672
Median $170 $10.73 $89,286 $39,315
Blue = BMO provided transaction advisory services Green = BMO provided acquisition financing or related services
Purple = BMO provided both transaction advisory services and acquisition financing or related services
GROSS PRODUCTION
TRANSACTION ACTIVITY (EXCLUDES CORPORATE DEALS)
TRANSACTION PRODUCTION MULTIPLES(3) TRANSACTION ADJUSTED NET ACRE MULTIPLES(3,4)
PERMITTING ACTIVITY BY MONTH
DIFFERENTIALS
Permian Snapshot
RIG COUNT
Source: BMO Transaction Database, Baker Hughes, BMO Commodity Products Group, Bloomberg, Drilling Info, PLS
Note: Current quarter’s data is through the week covered by this issue.
1. Represents total enterprise value. Excludes transactions with deal value <$20 million. 2. $/acre multiple not adjusted for value associated with production.
3. Red line denotes average since 10-Jan-15. Calculated as the weighted average of each quarter’s transactions.
4. Production valued at $45,000/boepd in 2014, $30,000/boepd in 2015, $35,000/boepd in 2016 & 2017, and $40,000/boepd in 2018.
[TBU]
[TBU]
[TBU] [TBU]
[TBU] [TBU]
[TBU]

8
December 10, 2018
0%
5%
10%
15%
20%
--
100
200
300
Jan-14 Jan-15 Jan-16 Jan-17 Jan-18
H V+D % of Total Rigs
Item Value Wkly Change Last Week Item Value Wkly Change Last Week
Rig Count 96 2 94 Oil Differential $6.80 $0.15 $6.65
Permitting Activity 63 (16) 79 Gas Differential $0.08 $0.08 $0.00
-$0.30
-$0.20
-$0.10
$0.00
$0.10
$0.20
$0.30
$0.40
$0.50
Jan-15 Nov-15 Sep-16 Jul-17 May-18
-$6.00
-$4.00
-$2.00
$0.00
$2.00
$4.00
$6.00
$8.00
$10.00
$ /
mm
btu
$ /
bb
l
LLS HSC
6,000
6,500
7,000
7,500
8,000
8,500
9,000
9,500
10,000
10,500
1,000
1,200
1,400
1,600
1,800
2,000
2,200
Jan-14 Jul-14 Jan-15 Jul-15 Jan-16 Jul-16 Jan-17 Jul-17
mm
cf/
d
mb
bl/
d
Oil Gas
1,500
8,440
386419
449377
425472
436
376
453
321
396338
57
Dec-17 Feb-18 Apr-18 Jun-18 Aug-18 Oct-18 Dec-18
H V+D
--
$50,000
$100,000
$150,000
1Q
14
2Q
14
3Q
14
4Q
14
1Q
15
2Q
15
3Q
15
4Q
15
1Q
16
2Q
16
3Q
16
4Q
16
1Q
17
2Q
17
3Q
17
4Q
17
1Q
18
2Q
18
3Q
18
4Q
18
3 6 3 2 1 1 3 1 2 2 2 4 4 3 1 2 7 2 0 3
$ /
bo
e/d
# Deals
$64,749
--$10,000$20,000$30,000$40,000$50,000$60,000
1Q
14
2Q
14
3Q
14
4Q
14
1Q
15
2Q
15
3Q
15
4Q
15
1Q
16
2Q
16
3Q
16
4Q
16
1Q
17
2Q
17
3Q
17
4Q
17
1Q
18
2Q
18
3Q
18
4Q
18
2 4 3 2 0 1 2 1 2 2 0 4 2 3 1 2 4 2 1 3
$ /
acre
# Deals
$10,076
Ann'd
Date Buyer Seller Asset Description Value(1)
Proved
Multiple
Prod.
Multiple Net Acres
($mm) ($/boe) ($/boe/d) ($/acre)(2)
19-Nov-18 Lonestar Resources Inc Sabine Oil & Gas Corp 2,706 net acres in Eagle Ford $39 $2.98 $48,375 $14,302
20-Sep-18 WildHorse Undisclosed Seller 20,305 net Eagle Ford/Austin Chalk acres $35 n.a. n.a. $1,743
07-Sep-18 Undisclosed Buyer Viking Minerals LLC 1,191 net royalty acres in Eagle Ford $28 n.a. n.a. nmf
31-Jul-18 EP Energy Corp Undisclosed Seller Additional working interests in Eagle Ford $31 n.a. n.a. n.a.
26-Jul-18 BP BHP Billiton Permian, Eagle Ford, and Haynesville $10,500 n.a. n.a. n.a.
Mean $2,127 $2.98 $48,375 $8,022
Median $35 $2.98 $48,375 $8,022
Blue = BMO provided transaction advisory services Green = BMO provided acquisition financing or related services
Purple = BMO provided both transaction advisory services and acquisition financing or related services
Eagle Ford Snapshot
TRANSACTION ACTIVITY (EXCLUDES CORPORATE DEALS)
PERMITTING ACTIVITY BY MONTH
DIFFERENTIALS RIG COUNT
Source: BMO Transaction Database, Baker Hughes, BMO Commodity Products Group, Bloomberg, Drilling Info, PLS
Note: Current quarter’s data is through the week covered by this issue.
1. Represents total enterprise value. Excludes transactions with deal value <$20 million. 2. $/acre multiple not adjusted for value associated with production.
3. Red line denotes average since 01-Jan-15. Calculated as the weighted average of each quarter’s transactions.
4. Production valued at $45,000/boepd in 2014, $30,000/boepd in 2015, $35,000/boepd in 2016 & 2017, and $40,000/boepd in 2018.
TRANSACTION PRODUCTION MULTIPLES(3) TRANSACTION ADJUSTED NET ACRE MULTIPLES(3,4)
GROSS PRODUCTION

9
December 10, 2018
Item Value Wkly Change Last Week Item Value Wkly Change Last Week
Rig Count 62 1 61 Oil Differential $6.80 $0.15 $6.65
Permitting Activity 18 9 9 Gas Differential -- -- --
0%
5%
10%
15%
20%
--
20
40
60
80
Jan-14 Jan-15 Jan-16 Jan-17 Jan-18
H V+D % of Total Rigs
--
$2.00
$4.00
$6.00
$8.00
$10.00
Jan-15 Nov-15 Sep-16 Jul-17 May-18
--
$2.00
$4.00
$6.00
$8.00
$10.00
$ /
mm
btu
$ /
bb
l
LLS Henry Hub
5,000
6,000
7,000
8,000
9,000
10,000
11,000
80
90
100
110
120
130
140
Jan-14 Jul-14 Jan-15 Jul-15 Jan-16 Jul-16 Jan-17 Jul-17
mm
cf/
d
mb
bl/
d
Oil Gas
103
9,850
120
164180
240
153162
149155 149
126143
103
17
Dec-17 Feb-18 Apr-18 Jun-18 Aug-18 Oct-18 Dec-18
H V+D
--
$5,000
$10,000
$15,000
$20,000
1Q
14
2Q
14
3Q
14
4Q
14
1Q
15
2Q
15
3Q
15
4Q
15
1Q
16
2Q
16
3Q
16
4Q
16
1Q
17
2Q
17
3Q
17
4Q
17
1Q
18
2Q
18
3Q
18
4Q
18
0 1 2 2 0 0 3 1 1 2 1 3 0 1 2 0 1 1 1 1
$ /
acre
# Deals
$4,772
--
$5,000
$10,000
$15,000
1Q
14
2Q
14
3Q
14
4Q
14
1Q
15
2Q
15
3Q
15
4Q
15
1Q
16
2Q
16
3Q
16
4Q
16
1Q
17
2Q
17
3Q
17
4Q
17
1Q
18
2Q
18
3Q
18
4Q
18
1 3 2 3 0 0 5 1 1 3 2 3 0 2 2 0 1 1 2 1
$ /
mcfe
/d
# Deals
$5,758
Ann'd
Date Buyer Seller Asset Description Value(1)
Proved
Multiple
Prod.
Multiple Net Acres
($mm) ($/mcfe) ($/mcfe/d) ($/acre)(2)
19-Nov-18 Aethon III QEP Resources Inc 49,700 net acres in Haynesville $735 $0.77 $2,475 $14,789
05-Sep-18 Viking Energy Group Multiple Sellers Texas and Louisiana assets $100 n.a. n.a. n.a.
05-Sep-18 Equinor Texegy LLC 60,000 net acres in Austin Chalk $75 n.a. n.a. $1,250
06-Aug-18 Mission Creek Resources Bonanza Creek Energy Inc 11,132 net acres in the Cotton Valley $117 $1.69 $6,500 $10,510
26-Jul-18 BP BHP Billiton Permian, Eagle Ford, and Haynesville $10,500 n.a. n.a. n.a.
Mean $2,305 $1.23 $4,487 $8,850
Median $117 $1.23 $4,487 $10,510
Blue = BMO provided transaction advisory services Green = BMO provided acquisition financing or related services
Purple = BMO provided both transaction advisory services and acquisition financing or related services
Ark-La-Tex Snapshot
TRANSACTION ACTIVITY (EXCLUDES CORPORATE DEALS)
PERMITTING ACTIVITY BY MONTH
DIFFERENTIALS RIG COUNT
Source: BMO Transaction Database, Baker Hughes, BMO Commodity Products Group, Bloomberg, Drilling Info, PLS
Note: Current quarter’s data is through the week covered by this issue.
1. Represents total enterprise value. Excludes transactions with deal value <$20 million. 2. $/acre multiple not adjusted for value associated with production.
3. Red line denotes average since 01-Jan-15. Calculated as the weighted average of each quarter’s transactions.
4. Production valued at $3,000/mcfepd in 2014, and $2,000/mcfepd in 2015, 2016, 2017, and 2018.
TRANSACTION PRODUCTION MULTIPLES(3) TRANSACTION ADJUSTED NET ACRE MULTIPLES(3,4)
GROSS PRODUCTION

10
December 10, 2018
Item Value Wkly Change Last Week Item Value Wkly Change Last Week
Rig Count 73 -- 73 Oil Differential $8.57 $0.51 $8.06
Permitting Activity 23 (67) 90 Gas Differential ($0.15) $0.33 ($0.48)
0%
5%
10%
15%
20%
--
50
100
150
Jan-14 Jan-15 Jan-16 Jan-17 Jan-18
H V+D % of Total Rigs
-$3.00
-$2.00
-$1.00
$0.00
$1.00
$2.00
$3.00
Jan-15 Nov-15 Sep-16 Jul-17 May-18
-$15.00
-$10.00
-$5.00
$0.00
$5.00
$10.00
$15.00
$ /
mm
btu
$ /
bb
l
Brent Dominion
12,000
14,000
16,000
18,000
20,000
22,000
24,000
26,000
28,000
30,000
50
70
90
110
130
150
Jan-14 Jul-14 Jan-15 Jul-15 Jan-16 Jul-16 Jan-17 Jul-17
mm
cf/
d
mb
bl/
d
Oil Gas
115
27,304
347390 367
454
282328 299 269
493
373 373318
11
Dec-17 Feb-18 Apr-18 Jun-18 Aug-18 Oct-18 Dec-18
H V+D
--
$10,000
$20,000
$30,000
$40,000
1Q
14
2Q
14
3Q
14
4Q
14
1Q
15
2Q
15
3Q
15
4Q
15
1Q
16
2Q
16
3Q
16
4Q
16
1Q
17
2Q
17
3Q
17
4Q
17
1Q
18
2Q
18
3Q
18
4Q
18
1 2 4 3 0 1 0 0 1 2 2 3 2 5 1 4 3 4 3 1
$ /
mcfe
/d
# Deals
$5,999
--
$5,000
$10,000
$15,000
$20,000
$25,000
1Q
14
2Q
14
3Q
14
4Q
14
1Q
15
2Q
15
3Q
15
4Q
15
1Q
16
2Q
16
3Q
16
4Q
16
1Q
17
2Q
17
3Q
17
4Q
17
1Q
18
2Q
18
3Q
18
4Q
18
1 2 4 3 0 1 0 0 1 2 2 4 2 4 1 3 1 3 2 0
$ /
acre
# Deals
$3,707
Ann'd
Date Buyer Seller Asset Description Value(1)
Proved
Multiple
Prod.
Multiple Net Acres
($mm) ($/mcfe) ($/mcfe/d) ($/acre)(2)
15-Oct-18 Undisclosed Buyer Range Resources Corp Overriding royalty interests in Appalachia $300 n.a. $17,649 nmf
27-Aug-18 PennEnergy Resources Rex Energy Corp 141,026 net acres in PA and OH $601 $0.58 $2,781 $4,258
26-Jul-18 Encino Acquisition Partners Chesapeake 938,000 net acres in the Utica $1,900 $0.66 $2,960 $2,026
29-Jun-18 Ascent Resources LLC Utica Minerals; Undisclosed 35,400 acres in the Utica $700 n.a. $15,217 $19,774
29-Jun-18 Ascent Resources LLC CNX Resources; Hess 78,000 acres in the Utica $800 n.a. $4,762 $10,256
Mean $860 $0.62 $8,674 $9,079
Median $700 $0.62 $4,762 $7,257
Blue = BMO provided transaction advisory services Green = BMO provided acquisition financing or related services
Purple = BMO provided both transaction advisory services and acquisition financing or related services
Appalachia Snapshot
TRANSACTION ACTIVITY (EXCLUDES CORPORATE DEALS)
PERMITTING ACTIVITY BY MONTH
DIFFERENTIALS RIG COUNT
Source: BMO Transaction Database, Baker Hughes, BMO Commodity Products Group, Bloomberg, Drilling Info, PLS
Note: Current quarter’s data is through the week covered by this issue.
1. Represents total enterprise value. Excludes transactions with deal value <$20 million. 2. $/acre multiple not adjusted for value associated with production.
3. Red line denotes average since 01-Jan-15. Calculated as the weighted average of each quarter’s transactions.
4. Production valued at $3,000/mcfepd in 2014, and $2,000/mcfepd in 2015, 2016, 2017, and 2018.
TRANSACTION PRODUCTION MULTIPLES(3) TRANSACTION ADJUSTED NET ACRE MULTIPLES(3,4)
GROSS PRODUCTION

11
December 10, 2018
0%
5%
10%
15%
20%
--
50
100
150
200
Jan-14 Jan-15 Jan-16 Jan-17 Jan-18
H V+D % of Total Rigs
Item Value Wkly Change Last Week Item Value Wkly Change Last Week
Rig Count 56 -- 56 Oil Differential ($2.00) $9.50 ($11.50)
Permitting Activity 7 (21) 28 Gas Differential ($0.47) $0.05 ($0.52)
-$1.00
-$0.50
$0.00
$0.50
Jan-15 Nov-15 Sep-16 Jul-17 May-18
-$20.00
-$10.00
$0.00
$10.00
$ /
mm
btu
$ /
bb
l
Clearbrook CIG
1,100
1,300
1,500
1,700
1,900
2,100
2,300
800
900
1,000
1,100
1,200
1,300
1,400
Jan-14 Jul-14 Jan-15 Jul-15 Jan-16 Jul-16 Jan-17 Jul-17
mm
cf/
d
mb
bl/
d
Oil Gas
1,212
2,175
92111 104
125108
138 126
171 164
127
201
125
5
Dec-17 Feb-18 Apr-18 Jun-18 Aug-18 Oct-18 Dec-18
H V+D
--
$5,000
$10,000
$15,000
$20,000
$25,000
1Q
14
2Q
14
3Q
14
4Q
14
1Q
15
2Q
15
3Q
15
4Q
15
1Q
16
2Q
16
3Q
16
4Q
16
1Q
17
2Q
17
3Q
17
4Q
17
1Q
18
2Q
18
3Q
18
4Q
18
4 2 6 2 0 0 1 2 0 0 2 3 1 0 3 2 0 5 2 0
$ /
acre
# Deals
$3,992
--
$50,000
$100,000
$150,000
$200,000
1Q
14
2Q
14
3Q
14
4Q
14
1Q
15
2Q
15
3Q
15
4Q
15
1Q
16
2Q
16
3Q
16
4Q
16
1Q
17
2Q
17
3Q
17
4Q
17
1Q
18
2Q
18
3Q
18
4Q
18
4 2 5 2 0 1 1 4 0 2 3 3 0 1 3 3 0 6 3 1
$ /
bo
e/d
# Deals
$44,336
Ann'd
Date Buyer Seller Asset Description Value(1)
Proved
Multiple
Prod.
Multiple Net Acres
($mm) ($/boe) ($/boe/d) ($/acre)(2)
07-Nov-18 Vantage Energy Acq. Corp QEP Resources Inc 102,800 net acres in Williston Basin $1,725 n.a. $37,500 $16,780
31-Jul-18 Northern Oil and Gas W Energy Partners 10,600 net acres in Williston Basin $288 n.a. $42,708 $27,196
18-Jul-18 Northern Oil and Gas Pivotal Petroleum Partners LP Producing assets in Williston Basin $152 n.a. $37,032 n.a.
12-Jul-18 PetroShale Inc Slawson Exploration Co 1,981 net acres in Williston Basin $55 $6.04 $100,000 $27,764
06-Jul-18 Energy Resources 12 LP Bruin E&P Partners LLC 2.8% non-operated WI in Bakken assets $83 n.a. n.a. n.a.
Mean $461 $6.04 $54,310 $23,913
Median $152 $6.04 $40,104 $27,196
Blue = BMO provided transaction advisory services Green = BMO provided acquisition financing or related services
Purple = BMO provided both transaction advisory services and acquisition financing or related services
Bakken Snapshot
TRANSACTION ACTIVITY (EXCLUDES CORPORATE DEALS)
PERMITTING ACTIVITY BY MONTH
DIFFERENTIALS RIG COUNT
Source: BMO Transaction Database, Baker Hughes, BMO Commodity Products Group, Bloomberg, Drilling Info, PLS
Note: Current quarter’s data is through the week covered by this issue.
1. Represents total enterprise value. Excludes transactions with deal value <$20 million. 2. $/acre multiple not adjusted for value associated with production.
3. Red line denotes average since 01-Jan-15. Calculated as the weighted average of each quarter’s transactions.
4. Production valued at $45,000/boepd in 2014, $30,000/boepd in 2015, $35,000/boepd in 2016 & 2017, and $40,000/boepd in 2018.
TRANSACTION PRODUCTION MULTIPLES(3) TRANSACTION ADJUSTED NET ACRE MULTIPLES(3,4)
GROSS PRODUCTION

12
December 10, 2018
0%
5%
10%
15%
20%
--
50
100
150
Jan-14 Jan-15 Jan-16 Jan-17 Jan-18
H V+D % of Total Rigs
Item Value Wkly Change Last Week Item Value Wkly Change Last Week
Rig Count 72 1 71 Oil Differential ($2.00) $9.50 ($11.50)
Permitting Activity 172 17 155 Gas Differential ($0.47) $0.05 ($0.52)
-$1.00
-$0.50
$0.00
$0.50
Jan-15 Nov-15 Sep-16 Jul-17 May-18
-$20.00
-$10.00
$0.00
$10.00
$ /
mm
btu
$ /
bb
l
Clearbrook CIG
11,500
12,000
12,500
13,000
13,500
14,000
400
450
500
550
600
650
700
750
800
Jan-14 Jul-14 Jan-15 Jul-15 Jan-16 Jul-16 Jan-17 Jul-17
mm
cf/
d
mb
bl/
d
Oil Gas749
13,133
653
435 460
650
327456
551665
523 510
681
824
96
Dec-17 Feb-18 Apr-18 Jun-18 Aug-18 Oct-18 Dec-18
H V+D
--$20,000$40,000$60,000$80,000
$100,000$120,000
1Q
14
2Q
14
3Q
14
4Q
14
1Q
15
2Q
15
3Q
15
4Q
15
1Q
16
2Q
16
3Q
16
4Q
16
1Q
17
2Q
17
3Q
17
4Q
17
1Q
18
2Q
18
3Q
18
4Q
18
4 7 3 4 2 0 4 4 1 6 2 0 1 6 3 9 3 1 3 1
$ /
bo
e/d
# Deals
$40,251
--
$5,000
$10,000
$15,000
$20,000
1Q
14
2Q
14
3Q
14
4Q
14
1Q
15
2Q
15
3Q
15
4Q
15
1Q
16
2Q
16
3Q
16
4Q
16
1Q
17
2Q
17
3Q
17
4Q
17
1Q
18
2Q
18
3Q
18
4Q
18
3 7 2 2 0 0 3 3 0 1 1 0 1 0 1 5 2 0 2 1
$ /
acre
# Deals
$4,226
Ann'd
Date Buyer Seller Asset Description Value(1)
Proved
Multiple
Prod.
Multiple Net Acres
($mm) ($/boe) ($/boe/d) ($/acre)(2)
01-Oct-18 DJR Energy LLC EnCana 182,000 net acres in San Juan Basin $480 n.a. $88,889 $2,637
28-Aug-18 Vermilion Energy Inc Massif Oil & Gas LLC 55,000 acres in Powder River Basin $150 n.a. $56,604 $2,727
28-Aug-18 Rebellion Energy II LLC Liberty Resources II LLC 19,000 net acres in Powder River Basin $100 n.a. n.a. $5,263
09-Aug-18 Undisclosed Buyer Ultra Petroleum ~8,000 net acres in the Uinta $75 n.a. $37,500 $9,375
10-Jul-18 Middle Fork Energy Part. QEP Resources Inc ~230,000 net acres in the Uinta $155 $1.54 $17,222 $674
Mean $192 $1.54 $50,054 $4,135
Median $150 $1.54 $47,052 $2,727
Blue = BMO provided transaction advisory services Green = BMO provided acquisition financing or related services
Purple = BMO provided both transaction advisory services and acquisition financing or related services
TRANSACTION ACTIVITY (EXCLUDES CORPORATE DEALS)
PERMITTING ACTIVITY BY MONTH
DIFFERENTIALS
Rockies (excl. Bakken) Snapshot
RIG COUNT
Source: BMO Transaction Database, Baker Hughes, BMO Commodity Products Group, Bloomberg, Drilling Info, PLS
Note: Current quarter’s data is through the week covered by this issue.
1. Represents total enterprise value. Excludes transactions with deal value <$20 million. 2. $/acre multiple not adjusted for value associated with production.
3. Red line denotes average since 01-Jan-15. Calculated as the weighted average of each quarter’s transactions.
4. Production valued at $45,000/boepd in 2014, $30,000/boepd in 2015, $35,000/boepd in 2016 & 2017, and $40,000/boepd in 2018.
TRANSACTION PRODUCTION MULTIPLES(3) TRANSACTION ADJUSTED NET ACRE MULTIPLES(3,4)
GROSS PRODUCTION

13
December 10, 2018
0%
5%
10%
15%
20%
--
100
200
300
400
Jan-14 Jan-15 Jan-16 Jan-17 Jan-18
H V+D % of Total Rigs
Item Value Wkly Change Last Week Item Value Wkly Change Last Week
Rig Count 152 (3) 155 Oil Differential -- -- --
Permitting Activity 68 12 56 Gas Differential ($0.38) ($0.06) ($0.33)
-$1.00
-$0.75
-$0.50
-$0.25
$0.00
$0.25
Jan-15 Nov-15 Sep-16 Jul-17 May-18
-$1.00
-$0.75
-$0.50
-$0.25
$0.00
$0.25
$ /
mm
btu
$ /
bb
l
Cushing Panhandle
6,000
7,000
8,000
9,000
10,000
11,000
12,000
13,000
400
450
500
550
600
650
700
Jan-14 Jul-14 Jan-15 Jul-15 Jan-16 Jul-16 Jan-17 Jul-17
mm
cf/
d
mb
bl/
d
Oil Gas
580
9,867
347392
351 355 365 353
427
370
416377
321 314
52
Dec-17 Feb-18 Apr-18 Jun-18 Aug-18 Oct-18 Dec-18
H V+D
--
$5,000
$10,000
$15,000
$20,000
1Q
14
2Q
14
3Q
14
4Q
14
1Q
15
2Q
15
3Q
15
4Q
15
1Q
16
2Q
16
3Q
16
4Q
16
1Q
17
2Q
17
3Q
17
4Q
17
1Q
18
2Q
18
3Q
18
4Q
18
0 1 3 3 1 3 1 2 0 3 3 2 4 1 2 1 0 0 0 1
$ /
acre
# Deals
$6,734
--
$50,000
$100,000
$150,000
$200,000
1Q
14
2Q
14
3Q
14
4Q
14
1Q
15
2Q
15
3Q
15
4Q
15
1Q
16
2Q
16
3Q
16
4Q
16
1Q
17
2Q
17
3Q
17
4Q
17
1Q
18
2Q
18
3Q
18
4Q
18
3 2 6 4 1 4 1 3 1 6 3 1 4 2 4 5 2 1 5 3
$ /
bo
e/d
# Deals
$52,842
Ann'd
Date Buyer Seller Asset Description Value(1)
Proved
Multiple
Prod.
Multiple Net Acres
($mm) ($/boe) ($/boe/d) ($/acre)(2)
02-Nov-18 SandRidge Energy Undisclosed Seller Mississippi Lime and NW STACK assets $25 n.a. $6,649 n.a.
31-Oct-18 Casillas Petroleum Corp Sheridan Production Partners 29,600 net acres in SCOOP assets $260 n.a. $78,078 $8,784
04-Sep-18 Flywheel Energy LLC Southwestern Energy 915,000 net acres in Fayetteville Shale $1,865 $3.04 $15,629 $2,038
06-Aug-18 Franco Nevada Corp Continental Resources Inc Mineral rights JV in the SCOOP/STACK $220 n.a. n.a. nmf
02-Aug-18 Sanguine Gas Exploration Vanguard Natural Res. 9,530 net acres in the Arkoma Basin $23 $4.79 $24,981 $2,403
Mean $479 $3.91 $31,334 $4,408
Median $220 $3.91 $20,305 $2,403
Blue = BMO provided transaction advisory services Green = BMO provided acquisition financing or related services
Purple = BMO provided both transaction advisory services and acquisition financing or related services
Mid-Continent Snapshot
TRANSACTION ACTIVITY (EXCLUDES CORPORATE DEALS)
PERMITTING ACTIVITY BY MONTH
DIFFERENTIALS RIG COUNT
Source: BMO Transaction Database, Baker Hughes, BMO Commodity Products Group, Bloomberg, Drilling Info, PLS
Note: Current quarter’s data is through the week covered by this issue.
1. Represents total enterprise value. Excludes transactions with deal value <$20 million. 2. $/acre multiple not adjusted for value associated with production.
3. Red line denotes average since 01-Jan-15. Calculated as the weighted average of each quarter’s transactions.
4. Production valued at $45,000/boepd in 2014, $30,000/boepd in 2015, $35,000/boepd in 2016 & 2017, and $40,000/boepd in 2018.
TRANSACTION PRODUCTION MULTIPLES(3) TRANSACTION ADJUSTED NET ACRE MULTIPLES(3,4)
GROSS PRODUCTION

14
December 10, 2018
Item Value Wkly Change Last Week Item Value Wkly Change Last Week
Rig Count 23 -- 23 Oil Differential $6.80 $0.15 $6.65
Permitting Activity 0 -- 0 Gas Differential -- -- --
0%
5%
10%
15%
20%
--
10
20
30
40
Jan-14 Jan-15 Jan-16 Jan-17 Jan-18
Deep Water Shelf % of Total Rigs
2124
13
19
27
3329 29
32 33
24
0 0
Dec-17 Feb-18 Apr-18 Jun-18 Aug-18 Oct-18 Dec-18
--
$2.00
$4.00
$6.00
$8.00
$10.00
Jan-15 Nov-15 Sep-16 Jul-17 May-18
--
$2.00
$4.00
$6.00
$8.00
$10.00
$ /
mm
btu
$ /
bb
l
LLS Henry Hub
2,000
2,500
3,000
3,500
4,000
4,500
1,000
1,100
1,200
1,300
1,400
1,500
1,600
1,700
1,800
1,900
Jan-14 Jul-14 Jan-15 Jul-15 Jan-16 Jul-16 Jan-17 Jul-17
mm
cf/
d
mb
bl/
d
Oil Gas1,567
2,467
--
$20,000
$40,000
$60,000
$80,000
1Q
14
2Q
14
3Q
14
4Q
14
1Q
15
2Q
15
3Q
15
4Q
15
1Q
16
2Q
16
3Q
16
4Q
16
1Q
17
2Q
17
3Q
17
4Q
17
1Q
18
2Q
18
3Q
18
4Q
18
5 2 0 0 0 0 1 1 0 0 2 0 0 0 0 1 2 2 2 1
$ /
bo
e/d
# Deals
$29,039
--
$10
$20
$30
$40
1Q
14
2Q
14
3Q
14
4Q
14
1Q
15
2Q
15
3Q
15
4Q
15
1Q
16
2Q
16
3Q
16
4Q
16
1Q
17
2Q
17
3Q
17
4Q
17
1Q
18
2Q
18
3Q
18
3Q
18
5 2 0 0 0 0 1 0 0 0 2 1 0 0 0 1 2 1 0 1
$ /
bo
e
# Deals
$15.40
Ann'd
Date Buyer Seller Asset Description Value(2)
Proved
Multiple
Prod.
Multiple Net Acres
($mm) ($/boe) ($/boe/d) ($/acre)(3)
10-Oct-18 Murphy Petrobras Gulf of Mexico joint venture $900 $15.00 $21,951 n.a.
04-Sep-18 Talos Energy Inc Whistler Energy II LLC Leases in Green Canyon federal waters $91 n.a. $60,667 n.a.
27-Apr-18 Stone Energy Shell; ExxonMobil; Anadarko GOM Ram Powell assets $234 n.a. $38,361 n.a.
28-Mar-18 W&T Offshore Cobalt International Energy 9.375% non-op WI in the Heidelberg unit $31 $23.92 $9,345 n.a.
12-Mar-18 Total Cobalt International Energy Non-op interest in 13 blocks $25 n.a. n.a. n.a.
Mean $256 $19.46 $32,581 n.a.
Median $91 $19.46 $30,156 n.a.
Blue = BMO provided transaction advisory services Green = BMO provided acquisition financing or related services
Purple = BMO provided both transaction advisory services and acquisition financing or related services
Gulf of Mexico Snapshot
PERMITTING ACTIVITY BY MONTH(1)
DIFFERENTIALS RIG COUNT
Source: BMO Transaction Database, Baker Hughes, BMO Commodity Products Group, Bloomberg, Drilling Info, PLS
Note: Current quarter’s data is through the week covered by this issue.
1. Permits include directional and unidentified drilling permits. 2. Represents total enterprise value. Excludes transactions with deal value <$20 million.
3. $/acre multiple not adjusted for value associated with production.
4. Red line denotes average since 01-Jan-15. Calculated as the weighted average of each quarter’s transactions.
GROSS PRODUCTION
TRANSACTION ACTIVITY (EXCLUDES CORPORATE DEALS)
TRANSACTION PRODUCTION MULTIPLES(4) TRANSACTION PROVED RESERVE MULTIPLES(4)
15
December 10, 2018
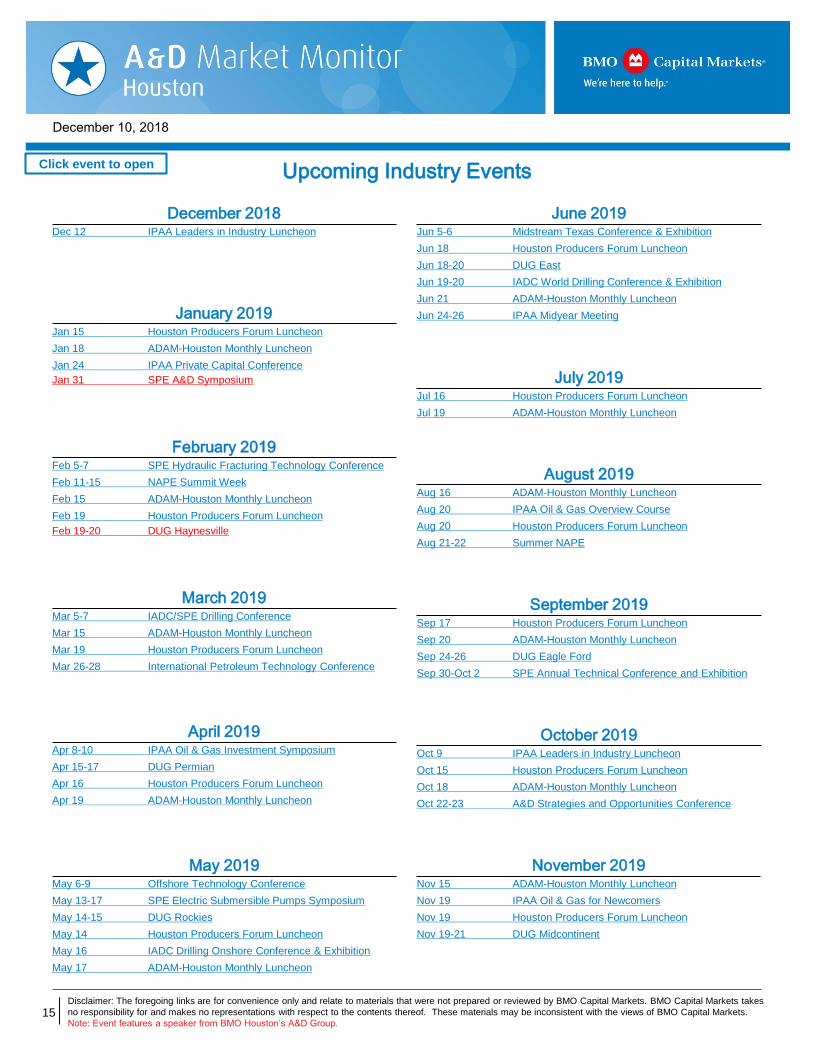
Upcoming Industry Events
Disclaimer: The foregoing links are for convenience only and relate to materials that were not prepared or reviewed by BMO Capital Markets. BMO Capital Markets takes
no responsibility for and makes no representations with respect to the contents thereof. These materials may be inconsistent with the views of BMO Capital Markets.
Note: Event features a speaker from BMO Houston’s A&D Group.
Click event to open
July 2019 Jul 16 Houston Producers Forum Luncheon
Jul 19 ADAM-Houston Monthly Luncheon
December 2018 Dec 12 IPAA Leaders in Industry Luncheon
March 2019 Mar 5-7 IADC/SPE Drilling Conference
Mar 15 ADAM-Houston Monthly Luncheon
Mar 19 Houston Producers Forum Luncheon
Mar 26-28 International Petroleum Technology Conference
April 2019 Apr 8-10 IPAA Oil & Gas Investment Symposium
Apr 15-17 DUG Permian
Apr 16 Houston Producers Forum Luncheon
Apr 19 ADAM-Houston Monthly Luncheon
ADAM-Houston Monthly Luncheon – 3rd Friday
Houston Producers Forum Luncheon – 3rd Tuesday
May 2019 May 6-9 Offshore Technology Conference
May 13-17 SPE Electric Submersible Pumps Symposium
May 14-15 DUG Rockies
May 14 Houston Producers Forum Luncheon
May 16 IADC Drilling Onshore Conference & Exhibition
May 17 ADAM-Houston Monthly Luncheon
June 2019 Jun 5-6 Midstream Texas Conference & Exhibition
Jun 18 Houston Producers Forum Luncheon
Jun 18-20 DUG East
Jun 19-20 IADC World Drilling Conference & Exhibition
Jun 21 ADAM-Houston Monthly Luncheon
Jun 24-26 IPAA Midyear Meeting
August 2019 Aug 16 ADAM-Houston Monthly Luncheon
Aug 20 IPAA Oil & Gas Overview Course
Aug 20 Houston Producers Forum Luncheon
Aug 21-22 Summer NAPE
September 2019 Sep 17 Houston Producers Forum Luncheon
Sep 20 ADAM-Houston Monthly Luncheon
Sep 24-26 DUG Eagle Ford
Sep 30-Oct 2 SPE Annual Technical Conference and Exhibition
January 2019 Jan 15 Houston Producers Forum Luncheon
Jan 18 ADAM-Houston Monthly Luncheon
Jan 24 IPAA Private Capital Conference
Jan 31 SPE A&D Symposium
February 2019 Feb 5-7 SPE Hydraulic Fracturing Technology Conference
Feb 11-15 NAPE Summit Week
Feb 15 ADAM-Houston Monthly Luncheon
Feb 19 Houston Producers Forum Luncheon
Feb 19-20 DUG Haynesville
October 2019 Oct 9 IPAA Leaders in Industry Luncheon
Oct 15 Houston Producers Forum Luncheon
Oct 18 ADAM-Houston Monthly Luncheon
Oct 22-23 A&D Strategies and Opportunities Conference
2020
Jul 22-24 SPE Unconventional Resources Technology
Aug 11-14 Enercom Oil & Gas Conference
November 2019 Nov 15 ADAM-Houston Monthly Luncheon
Nov 19 IPAA Oil & Gas for Newcomers
Nov 19 Houston Producers Forum Luncheon
Nov 19-21 DUG Midcontinent
December 2019 Dec 17 Houston Producers Forum Luncheon
Dec 20 ADAM-Houston Monthly Luncheon

16
December 10, 2018
SCOOP/STACK/Merge
DJ-Niobrara
Eagle Ford
Haynesville
Granite Wash
GOM
Permian
Marcellus
Utica
Williston
Gulf Coast Onshore
Piceance
Powder River Green River
Legend
Current
Change
This material is prepared by the BMO Capital Markets’ Investment and Corporate Banking Department, for distribution to BMO Capital Markets’ clientele. It is not a product of
BMO Capital Markets’ Research Department. The views of the Investment and Corporate Banking Department may differ from those of the Research Department.
BMO Capital Markets is a trade name used by BMO Financial Group for the wholesale banking businesses of Bank of Montreal, BMO Harris Bank N.A. (member FDIC), Bank of Montreal
Ireland p.l.c, and Bank of Montreal (China) Co. Ltd and the institutional broker dealer businesses of BMO Capital Markets Corp. (Member FINRA and SIPC) in the U.S., BMO Nesbitt
Burns Inc. (Member Investment Industry Regulatory Organization of Canada and Member Canadian Investor Protection Fund) in Canada and Asia and BMO Capital Markets Limited
(authorised and regulated by the Financial Conduct Authority) in Europe and Australia. “Nesbitt Burns” is a registered trademark of BMO Nesbitt Burns Inc., used under license. “BMO
Capital Markets” is a trademark of Bank of Montreal, used under license. "BMO (M-Bar roundel symbol)" is a registered trademark of Bank of Montreal, used under license. ® Registered
trademark of Bank of Montreal in the United States, Canada and elsewhere. ™ Trademark of Bank of Montreal in the United States and Canada.
Bank of Montreal or its subsidiaries (“BMO Financial Group”) has lending arrangements with, or provide other remunerated services to, many issuers covered by BMO Capital Markets.
The opinions, estimates and projections contained in this report are those of BMO Capital Markets as of the date of this report and are subject to change without notice. BMO Capital
Markets endeavors to ensure that the contents have been compiled or derived from sources that we believe are reliable and contain information and opinions that are accurate and
complete. However, BMO Capital Markets makes no representation or warranty, express or implied, in respect thereof, takes no responsibility for any errors and omissions contained
herein and accepts no liability whatsoever for any loss arising from any use of, or reliance on, this report or its contents. Information may be available to BMO Capital Markets or its
affiliates that is not reflected in this report. The information in this report is not intended to be used as the primary basis of investment decisions, and because of individual client
objectives, should not be construed as advice designed to meet the particular investment needs of any investor. This material is for information purposes only and is not an offer to sell or
the solicitation of an offer to buy any security. BMO Capital Markets or its affiliates will buy from or sell to customers the securities of issuers mentioned in this report on a principal basis.
BMO Capital Markets or its affiliates, officers, directors or employees have a long or short position in many of the securities discussed herein, related securities or in options, futures or
other derivative instruments based thereon. BMO Capital Markets may act as financial advisor and/or underwriter for the issuers mentioned herein and may receive remuneration for
same. The reader should assume that BMO Capital Markets or its affiliates may have a conflict of interest and should not rely solely on this report in evaluating whether or not to buy or
sell securities of issuers discussed herein.
All values in this document are in US$ unless otherwise specified.
Source of rig count stats: Baker Hughes
Rig Count Summary
MAPS IN
MASTER VIEW
Contacts
Disclaimer
Geoff Roberts
MD & Co-Head of U.S. A&D
713-518-1268
Jason Martinez
MD & Co-Head of U.S. A&D
713-546-9771
Howard Barnwell
MD & Transactions Mgr.
713-546-9767
Rob Priske
Director & Transactions Mgr.
713-546-9727
Elliott Finch
Analyst
Aaron Moeller
Analyst
Jennifer Boudreaux
Analyst
BMO uses updated basin outlines, and the resulting rig counts, to more accurately represent current basin knowledge. The data below reflect these changes
and is different than those shown by Baker Hughes. The totals are the same.
489
(4)
56
--
16
(1)
57
128
(1)
23
--
22
(3)112
--
62
1
96
2
27
1
7
1
15
--19
1
[TBU]
Chelsea Neville
Transactions Coordinator
This
Week Change
Last
Week
Last
Year
Total Rigs 1,075 (1) 1,076 931
Oil 877 (10) 887 751
Gas 198 9 189 180
Miscellaneous -- -- -- --
Directional 72 4 68 71
Horizontal 933 (1) 934 796
Vertical 70 (4) 74 64
Basin
Permian 489 (4) 493 400
SCOOP/STACK/Merge 112 -- 112 100
Granite Wash 22 (3) 25 17
Eagle Ford 96 2 94 84
Haynesville 62 1 61 58
Marcellus 57 1 56 45
Utica 16 (1) 17 27
Williston 56 -- 56 47
DJ-Niobrara 28 (1) 29 23
Green River 19 1 18 23
Powder River 15 -- 15 13
Piceance 7 1 6 8
Gulf Coast Onshore 27 1 26 18
GOM 23 -- 23 20
Alaska 7 1 6 5
Other 39 -- 39 43
Mid-Con 18 -- 18 21
Rockies 3 -- 3 5
Western 15 -- 15 14
Eastern 3 -- 3 3
[TBU]