prompt oil price ($/bbl) $63.58 $1.48 2.4% prompt gas ... · 4/15/2019 · 1q15 2q15 3q15 4q15...
TRANSCRIPT

1
April 15, 2019
$2.2
$8.0
$9.9 $10.7
$4.9
$15.8
$21.2 $21.9 $24.1
$17.0
$9.1 $9.2
$20.8
$8.2
$31.6
$19.5
$1.4 $1.3
--
50
100
150
200
250
300
350
400
450
500
--
$10
$20
$30
$40
$50
1Q15 2Q15 3Q15 4Q15 1Q16 2Q16 3Q16 4Q16 1Q17 2Q17 3Q17 4Q17 1Q18 2Q18 3Q18 4Q18 1Q19 2Q19
61% 83% 74% 79% 39% 52% 62% 71% 93% 24% 68% 82% 91% 64% 46% 93% 51% 100%
Nu
mb
er
of
Tra
ns
acti
on
s
Tra
ns
acti
on
Valu
e (
$b
n)
Asset Corporate Number of Transactions
% Oil
IndicatorCurrent
Value
Week's
Change
%
Change Direction
Prompt Oil Price ($/bbl) $63.58 $1.48 2.4%
Prompt Gas Price ($/mmbtu) $2.66 $0.02 0.8%
Wkly Trans. Value ($mm) $1,225 $1,178 nmf
Wkly Trans. Count 2 (2) (50%)
US Rig Count 1,022 (3) (0.3%)
US Oil Prod'n (mmbbl/d) 12.2 -- --
US Gas Prod'n (bcf/d)(1) 108.1 -- --
US Oil Storage (mmbbl) 456.6 7.0 1.6%
US Gas Storage (tcf) 1.2 0.0 2.2%
Debt
Markets
Five issuers priced six tranches for $5 billion in proceeds
Year-to-date U.S. volume is down 2% year-on-year
U.S. high yield funds reported an inflow of $655 million
ETFs reported an inflow of $210 million, while mutual funds reported an inflow of $445 million
High yield index yield was 6.28%; high yield energy index yield was 7.82%
Source: BMO Transaction Database, Baker Hughes, BMO Commodity Products Group, Bloomberg, EIA, PLS
Note: Current quarter’s data is through the week covered by this issue.
1. EIA U.S. natural gas gross withdrawals and production reported monthly as of January 2019.
2. S&P E&P = S&P Oil & Gas E&P Select Industry, SPX = S&P 500 Index.
3. Does not reflect Chevron / Anadarko transaction. This transaction will be reflected in next week’s newsletter.
Key Industry Indicators
Quarterly Deal Activity(3)
S&P E&P(2) outperformed last week 2.2% vs. SPX(2) 0.3%
The major U.S. equity indexes finished mixed last week. Consumer discretionary, consumer staples,
financials, real estate, and tech finished higher. Health care, industrials, and materials finished lower
Equity
Markets
Oil ended last week up. With stress in Venezuela and Iran causing tightening of the global oil markets,
supply has been continually decreasing. President Trump designated Iran’s Revolutionary Guard Corps
as a foreign terrorist organization. Fighting erupted in Libya near Tripoli. Oil output from Libya had
increased in recent months as peace fragilely took hold but it is apparent that crude flows cannot resume
until peace talks are underway. The expectation is that with a tightening of supply, prices will continue to
climb as demand increases going into the summer. Crude exports hit the lowest level since January
mainly due to the partial closure of the Houston Ship Channel because of the ITC terminal fire and some
recent bad weather which caused a decrease in crude outflows. The near-term contract closed up $1.48,
or 2.4%, at $63.58
Natural gas ended last week up. SoCal basis markets were well offered throughout the next year as
SoCal storage increased in an effort to stockpile before a potentially volatile summer. Fundamentals
remain bearish short-term. The near-term contract closed up $0.02, or 0.8%, at $2.66
Commodities
Week in Review
In Commodities, ECM and DCM, let’s go to journalism standards, even
though that’s not how we get the text from those groups. Main change is
that any number below 10 is spelled out (one instead of 1). This does not
apply to statistical analyses, percentages, or money, of course.
Let’s follow these guidelines when sorting articles:
• First priority: Domestic A&D, ranked by size
• Next: Domestic M&A
• Then: US companies doing international deals (like
Noble’s Tamar)
• Then: Others (Cabot’s Lackawanna)
• Then: Prices, rig count, completions, etc.
To paste the arrows with colors,
• FactSet
• Settings
• Presentation Linking and Formatting
• Import
• Colors
• Change Color Font
For the primary Commodities bullet points on oil and gas
prices, please start with “The near-term contract opened the
week at $___” and end that same bullet point with “The
near-term contract closed the week at $____, down(up)
$___, or ___%.” You don’t have to use exactly those words
as long as the opening and closing prices are included . For
example, you could write, “Opening the week at $45.21, the
near-term oil contract declined steadily based on …” – you
know, think like a journalist, be creative.
Covering the Week of April 5 to April 11, 2019
The October issue of BMO Calgary’s A&D (Canadian)
Market Monitor went live last week – read more here
[TBU]
[TBU]
[TBU]
[TBU]
[TBU] [TBU]
This is the final issue for 2018. The Market Monitor will
return on Monday, January 7th. Happy Holidays from the
BMO Capital Markets team!
On Friday, April 12th, Chevron announced an agreement to
acquire Anadarko Petroleum for ~$50 billion (see page 4 for
more detail)
Shell signed an agreement to sell its 22.45% non-operated
interest in the Caesar-Tonga asset in the Gulf of Mexico to
Delek CT Investment for $965 million (see page 5 for more
detail)
Callon Petroleum Company announced it entered into a
definitive agreement to divest non-core assets in the Midland
Basin for $260 million
Maverick Natural Resources announced that it has closed an
acquisition of producing properties in the Overton Field in East
Texas
All references to last week in the comments below are through Thursday
(3)
(3)

2
April 15, 2019
y = 36.369e-0.07x
R² = 0.3547
--
$10
$20
$30
$40
$50
$60
-- 5.0x 10.0x 15.0x 20.0x 25.0x 30.0x
Sa
les
Pri
ce
/ P
rove
d R
es
erv
es
($
/bo
e @
15
:1)
R / P
Ann'd Date Buyer Seller Area Asset Description Value(1)
Proved Multiple
Prod.Multiple Net Acres
($mm) ($/boe) ($/boe/d) ($/acre)
11-Apr-19 Delek Group Shell Gulf of Mexico 22.45% WI in Caesar-Tonga Field $965 n.a. $60,540 n.a.
08-Apr-19 Sequitur Energy Resources Callon Permian 9,850 net acres in Reagan & Upton, TX $260 n.a. $65,000 $26,396
02-Apr-19 Dorchester Minerals, L.P. H. Huffman & Co. Multi-Region Mineral & royalty assets across the U.S. $44 n.a. $139,419 nmf
27-Mar-19 Undisclosed Buyer Rosehill Resources Permian ~880 net acres in Lea Co., NM $22 n.a. n.a. $25,000
27-Mar-19 Diversified Gas & Oil HG Energy II LLC Marcellus/Utica Huckleberry assets in Appalachia $400 n.a. $19,364 n.a.
26-Feb-19 Ring Energy Inc Wishbone Energy Partners Permian 37,206 net Central Basin Platform acres $300 $8.75 $50,000 $8,063
19-Feb-19 Scout Energy Partners Mid-Con Energy Partners Other North Texas assets $60 $8.22 n.a. n.a.
19-Feb-19 Mid-Con Energy Partners Scout Energy Partners Mid-Continent Caddo, Grady, and Osage cos., OK $28 n.a. $20,960 n.a.
19-Feb-19 Undisclosed Buyer Noble Energy Permian Non-core acreage in the Delaware Basin $63 n.a. n.a. n.a.
19-Feb-19 Undisclosed Buyer Noble Energy Permian 13,000 net acres in Reeves Co., TX $132 n.a. n.a. $10,154
Blue = BMO provided transaction advisory services Green = BMO provided acquisition financing or related services
Purple = BMO provided both transaction advisory services and acquisition financing or related services
R / PSales Value /
Proved Reserves (15:1)
(ratio) ($ / boe) ($ / mcfe)
8x $20.71 $1.38
10x $17.99 $1.20
15x $12.65 $0.84
20x $8.90 $0.59
Permian38%
Rockies (ex. Bakken)
10%Bakken
4%
Appalachia3%
Mid-Con16%
Eagle Ford6%
Ark-La-Tex5%
Gulf of Mexico3%
Other17%
LTM By Region
Oil69%
Gas31%
LTM By Commodity
Public Company
37%
PE / PE-Backed
24%
Private18%
Other21%
LTM By Buyer Type
The 10 Most Recent Asset Transactions Over $20 Million
A&D Valuation Trends(3)
Source: BMO Transaction Database, Baker Hughes, BMO Commodity Products Group, Bloomberg, PLS1. Represents total enterprise value. 2. Calculated as percentage of total LTM transaction count (number of transactions, not dollar value).3. 64 transactions from January 2015 to 2019 with transaction value >$20mm. Adjusted for changes in price outlooks. Recalculated boe reserves are on a 15:1
(gas:oil) basis. Acreage transactions excluded by using deals with PDP of >= 40% of total proved. 4. Year-to-date data is through this week’s date for each respective year. Does not reflect Chevron / Anadarko transaction. This transaction will be reflected in next week’s newsletter.
(2) (2) (2)
YTD Deal Activity ($bn)(4)
$15.4 $12.6
$8.8 $9.6
$6.2
$24.2 $22.2
$2.7
2016 2017 2018 2019
249 483 399 61
Asset Corporate
Deal Count

3
April 15, 2019
4/11/2019
Appalachia 1
Ark-La-Tex 8
Bakken 6
Eagle Ford 5
Mid-Con 8
Other 16
Permian 20
Rockies 5
69
Select Significant Deals on the Market
Disclaimer: The foregoing links are for convenience only and relate to materials that were not prepared or reviewed by BMO Capital Markets. BMO Capital Markets takes
no responsibility for and makes no representations with respect to the contents thereof. These materials may be inconsistent with the views of BMO Capital Markets.
Source of Select Significant Deals on the Market: BMO Transaction Database
Industry Headlines
Appalachia
1 Deals
Mid-Con
8 Deals
Eagle Ford
5 Deals
Permian
20 Deals
Other
16 Deals
Rockies
5 Deals
(Click headline to link to the full article)
A&D Headlines
Bakken
6 Deals
Ark-La-Tex
8 Deals
BMO Deals (Status)
Enerplus Elm Coulee (In Market) – See page 6
Juno Permian (In Market) – See page 7
Rio Glasscock County (In Market) – See page 8
Crude Has Surged >35% in 2018 as OPEC+ Limit
Output
IEA Says Oil Market Tightening, But Global Demand
May Falter
As Conflict Escalates in Libya, So Do Global Oil Prices
Trump's Keystone XL Pipeline Permit Back in Court as
Indigenous Group Files Complaint
Donald Trump's Executive Action Speeds Critical
Energy Infrastructure
Permian Basin's Future Depends on the Reservoir
Study Group, or "Really Smart Guys"
Permian's Flaring Rises by 85% as Oil Boom
Continues
Chevron Announces Agreement to Acquire Anadarko
Shell Sells Stake in Caesar-Tonga Field in Gulf of
Mexico to Delek Group for $965 Mln
Callon Petroleum Sells Permian Assets After Houston
HQ Move
Maverick Natural Resources Announces Acquisition of
Producing Properties in East Texas
[TBU]
[TBU] [TBU]
[TBU]
Talos Energy Announces Full Year 2019 Operating
and Financial Guidance (includes A&D
announcement)
BMO Deals (Status)
Juno Permian (In Market) – See page 4
Rio Glasscock County (In Market) – See page 5

4
April 15, 2019
On April 12, 2019, Chevron Corporation (NYSE: CVX)
(“Chevron”) announced it entered into an agreement to
acquire all of the outstanding shares of Anadarko
Petroleum Corporation (NYSE: APC) (“Anadarko”) for
a total transaction value of ~$50 billion, including the
assumption of $15 billion of net debt
Chevron will issue approximately 200 million
shares of stock and pay approximately $8 billion in
cash
Based on Chevron’s closing price on April 11,
2019, Anadarko shareholders will receive 0.3869
shares of Chevron and $16.25 in cash for each
Anadarko share
Anadarko valued at $65 per share
Transaction is expected to achieve run-rate cost
synergies of $1 billion before tax and capital spending
reductions of $1 billion within a year of closing
Transaction is expected to close in 2H 2019
Upon closing, Chevron will remain headquartered in
San Ramon, California
TRANSACTION SUMMARY
Source: Press releases, company presentations
1. Cash includes assumption of 2018YE net debt of $15 billion and based on 499.58 million APC shares as of 01-Feb-19. Stock consideration based on 200 million
CVX shares issued and closing CVX share price on 11-Apr-19.
ASSET SUMMARY
U.S. assets in the Permian Basin, DJ Basin, Powder
River Basin, Greater Natural Buttes, and Gulf of
Mexico
240,000 net acres in the Permian Basin
400,000 net acres in the DJ Basin
Interest in 231 blocks in the Gulf of Mexico
Other assets in Mozambique, Algeria, and Ghana
77.8% limited partner interest and entire general
partner interest in Western Gas Partners LP
2018YE proved reserves of 1,473 mmboe
~45% oil, ~90% U.S.
Q4 2018 net production of 701 mboe/d
Interesting Deal of the Week #1:
Chevron Acquires Anadarko Petroleum for ~$50 Billion
ACQUIRED ASSETS TRANSACTION METRICS
Anadarko Assets
Rockies
Permian
Gulf of Mexico
Algeria
Ghana
Purchase Price (US$ mm)(1)
Cash $23,240
Stock $25,198
Total Consideration $48,438
Metrics
Net Production (boe/d) 701,000
Net Reserves (mmboe) 1,473
Multiples
TEV / Net Production ($/boe/d) $69,099
TEV / Net Reserves ($/boe) $32.88Mozambique
OBSERVATIONS
Strengthens Chevron’s Delaware Basin position,
creating a 75-mile-wide corridor across the basin
Enhances Chevron’s high-margin position in the Gulf
of Mexico
Chevron plans to divest $15 to $20 billion of assets
between 2020 and 2022
CVX Share Price 4/11 $125.99
Shares mm 200.0
Total Stock $25,198
APC Shares mm 2/1 499.58
Cash $16.25
Total Cash $8,118
ST Debt $919
ST Debt $28
LT Debt $15,470
Cash $1,295
Net Debt $15,122

5
April 15, 2019
On April 11, 2019, Delek Group (OTCMKT: DGRLY)
(“Delek”) announced it signed an agreement to
acquire 22.45% interest in the Caesar-Tonga oil field
in the Gulf of Mexico from Royal Dutch Shell for $965
million
Acquisition will be financed by non-recourse loans
from international banks, along with Delek Group
funds
Delek also signed a long-term off-take agreement with
Shell to purchase oil produced from the field for 30
years at market prices or prices matched to third party
offers
Delek will co-own the asset with three other operators
Anadarko Petroleum (33.75% operated interest)
Equinor (23.5% non-op interest)
Chevron (20.25% non-op interest)
TRANSACTION SUMMARY
Source: Press releases, company presentations
ASSET SUMMARY
Located in the Gulf of Mexico 300 kilometers south of
Louisiana, the Caesar-Tonga oil field is one of the top
ten largest deepwater resources in the Gulf of Mexico
Depth of 1,500 meters
Production horizon spanning tens of years
Currently contains eight wells connected by undersea
pipeline network to a production platform owned by
Anadarko
Gross production of 71,000 boe/d (90% oil)
Net production ~16,000 boe/d
Net 2P reserves of 78 mmboe
Annual EBITDA of $230 million
Interesting Deal of the Week #2:
Delek Group Acquires Non-Operated Interest in Gulf of Mexico Assets for $965 Million
ACQUIRED ASSETS TRANSACTION METRICS
Purchase Price (US$ mm)
Cash $965
Total Consideration $965
Metrics
Net Production (boe/d) 16,000
Net 2P Reserves (mmboe) 78
Annual EBITDA ($mm) $230
Multiples
TEV / Net Production ($/boe/d) $60,313
TEV / Net 2P Reserves ($/boe) $12.37
TEV / Annual EBITDA 4.2x
Shell Assets

6
April 15, 2019
Opportunity to acquire a largely contiguous, ~54,000 net acre
position in the heart of the prolific Elm Coulee Field in Montana’s
Williston Basin (>90% HBP)
PDP net production of 2,684 boe/d, 72% oil (June 2019E)
Low decline rate of ~10%
Strong PDP cash flow of ~$30 mm/yr (June 2019E annualized)
from 329 gross PDP wells(1)
Substantial OOIP, with additional recovery potential from infill wells,
refracs, and EOR
Proven potential for improvement in Bakken well performance
driven by completion optimization and longer laterals
Significant refrac potential with modern completion designs;
wells historically completed with ~150 lbs/ft
Cost reduction potential from additional field automation
Company owned SWD infrastructure helps reduce water disposal
costs and can support additional volumes from future development
or third parties
Data rooms open now
Contact Chelsea Neville at [email protected] or 713-
546-9703 for a Confidentiality Agreement, access to the VDR,
and/or to request a data room presentation
Source: Enerplus Elm Coulee Divestiture announcement
1. Does not include SWD well.
Stable Production
and Cash Flow
PDP net production of 2,684 boe/d (72% oil) from 329 wells (June 2019E)
Strong, predictable PDP cash flow of ~$30 mm/yr (June 2019E annualized) with high netbacks supports exploitation and
financing activities
~95% of operated oil production is gathered by pipe with direct access to Dakota Access Pipeline and legacy pipeline
capacity out of the basin; nearly all gas gathered via pipeline
Large,
Contiguous
Position in the
Heart of the
Prolific Elm
Coulee Field
~54,000 contiguous net acre position in the Bakken’s Elm Coulee Field provides significant recoverable resources and
allows for full efficiency of surface operations and LOE optimization
Assets provide high degree of operational control as >90% of acreage HBP
Average WI of ~89% (83% 8/8th NRI) on operated wells
Tremendous
Resource
Potential
Bakken reservoir properties and boundaries are very well understood and highly homogenous across the field, which
supports low risk drilling and predictable outcomes with low capital costs
Upper and Middle Bakken exhibit rock properties equal to or better than the core of the Williston Basin in North Dakota
Middle Bakken average porosity of 8% and water saturation under 10%
Upper Bakken average TOC of 9.3% and maturation temperature of 444° C
Enerplus’ position is the core of the field and offers the highest average net pay in Elm Coulee
Oil in place benefits from high oil saturation of 68-92% across the majority of the Enerplus position
Original, understimulated completions achieved a very low recovery factor, providing substantial upside for refracs and infill
drilling opportunities
Extensive and
Highly Economic
Upside
Opportunity
Many of the best early Bakken wells in the Williston Basin were drilled at Elm Coulee in the early 2000s
Significant refrac potential as majority of wells were completed before 2011 with ~150 lbs/ft of proppant
67 economic infill locations in the core of the Elm Coulee Field
Currently on the Market from BMO: Enerplus Elm Coulee Divestiture
ASSET HIGHLIGHTS
ASSET OVERVIEW PROCESS OVERVIEW
Area Exit for
Company
Full exit of Montana (all rights, all depths)
Assets have not been a recent core focus area for Enerplus and likely have significant unquantified opportunities remaining

7
April 15, 2019
Long-life, shallow decline oil assets located in the prolific Clearfork
Trend of the Permian Basin
Largely contiguous 10,250 net acre position located in the Hoople
Field in Crosby and Lubbock Counties, Texas
100% operated with high WI (100%) and NRI (>75%)
Favorable leasehold position with little-to-no drilling
obligations until 2021; >50% of acreage position under two
leases from one landowner
Current production of ~300 net bopd (100% oil) with significant
remaining drilling inventory consisting of ~200+ low-risk Clearfork
locations
Asset provides substantial, economic running room for organic and
acquisitive growth
Existing Clearfork acreage only ~15% developed based on
10-acre development plan
– Additional upside through 5-acre development,
secondary recovery and Glorieta development, all of
which have been demonstrated in offsetting acreage;
CO2 EOR and Wolfcamp potential
Multiple bolt-on acquisition opportunities and new leasing
opportunities
Acreage position delineated through existing and offset
development; full-scale development plan in place with drill-ready
infrastructure
Data rooms open now
Contact Chelsea Neville at [email protected] or 713-546-
9703 for a Confidentiality Agreement, access to the VDR, and/or to
request a data room presentation
Source: Juno Permian Divestiture announcement
Substantial
Unquantified
Upside
Potential for additional improvement in well performance through further enhanced completions
Near-term development potential by exploiting the Glorieta across Juno’s acreage position
Glorieta present on Juno position and position on trend with offset Glorieta development
Potential development opportunity to commingle Clearfork and Glorieta production, yielding twice the reserves with
little incremental D&C capex
Additional reserve recovery from waterflood operations and 5-acre development; future tertiary recovery
Offset operator testing horizontal Wolfcamp potential in the area
Large,
Contiguous
Acreage Position
in the Prolific
Clearfork Oil
Trend
High quality anchor asset in the heart of the Midland Basin’s Eastern Shelf with multiple stacked pay potential
Acreage situated in the Hoople Field, the most active Clearfork development area since 2015
Majority of Juno’s acreage is situated in the core of the field with vertical Clearfork EURs of ~60 Mbo
Primary recovery economics provide attractive IRRs with low development costs
Secondary recovery provides an incremental increase of 150% of primary EUR based on analog fields
Clearfork “A” STOOIP of up to 13 Mmbo per section based on core and log analysis
Minimal drilling obligations until 2021; moderate thereafter
Increased Oil
Cuts and
Improved
Economics from
Enhanced
Completions
Targeted, more optimized (“Gen II”) fracs demonstrate robust EURs and lower WOR vs. offset results
Fracture growth limited to ~40 feet from perf
Oil cuts have improved by three-fold using selective completions
Prior generation completions took the entirety of the pay zone, thereby increasing communication with higher water
saturation intervals
Asset Ready for
Full-Scale
Development
Significant inventory of 200+ economic Clearfork locations remaining (at 10-acre spacing)
Fast cycle times and favorable land position provides the ability to accelerate development within the first year
Juno II in the Hoople Field grew production by over 25x in less than 3 years
Juno III assets positioned to grow similarly
Inexpensive access to water sources and disposal provides for low-cost waterflood and frac’ing operations
Significant existing investment in infrastructure, including electrical, roads, pipelines and facilities, enable quick ramp to full-
scale development
No deferred maintenance or P&A issues
Currently on the Market from BMO: Juno Permian Divestiture
ASSET HIGHLIGHTS
ASSET OVERVIEW PROCESS OVERVIEW
LOCATOR MAP

8
April 15, 2019
Opportunity to acquire highly economic and
contiguous 1,645 gross acre position in the Midland
Basin located in west-central Glasscock County,
Texas
WI package provides high degree of operational
control with 98% operated, 74% HBP, and 67%
average WI
Ten active vertical wells hold the majority of acreage
Proven development opportunities targeting the Lower
Spraberry, Wolfcamp A, and Wolfcamp D formations
Active development by Parsley, Oxy, Diamondback,
and others highlights robust returns and de-risked
drilling locations
Continued improvement in well performance driven by
completion optimization
WI and ORRI packages available
Data rooms open now
Contact Chelsea Neville ([email protected] or 713-546-
9703) for a Confidentiality Agreement, access to the VDR, and/or
to request a data room presentation
Source: Rio Oil and Gas II Glasscock County Divestiture announcement
Active
Development By
Offset Operators
Producing Robust
Returns
Outstanding position in one of the most active basins in the U.S. with 181 rigs in the Midland Basin and 14 in Glasscock
County
~3,500 feet of porous, brittle, hydrocarbon rich pay available from the top of the Spraberry to the base of the Wolfcamp
Active offsetting development in the Lower Spraberry, Wolfcamp A, Wolfcamp B, and Wolfcamp D by Parsley, OXY,
Crownquest, Cinnabar, Encana, SM, Callon, Diamondback, Hunt, and others
Parsley is actively developing with strong results its directly offsetting Calverley assets in the LS, WCA, and WCB
– Parsley brought 17 wells online in 2018; outperformed historical results with peak rates up to
2,000 boepd (84% oil)
– Parsley acquired Calverley position through BTA acquisition ($40,000+/net acre)
OXY recently completed five wells (offsetting Rio) targeting the WCA and has two additional permits ready to drill
IP and EURs continue to increase through optimization of completion techniques: predominantly slickwater fracs with
proppant loading at ~1,900 lbs/ft
Over 30 potential stacked locations with additional unquantified upside in the Wolfcamp D
Operated Asset
Set Up For
Efficient, Stacked-
Pay, Long Lateral
Development
Contiguous 1,064 net acres in west-central Glasscock County; an additional 134 net overriding royalty acres also available
to further increase NRIs
75% effective (8/8ths) net revenue interest for WI package, excluding ORRI package
74% of net acres HBP from vertical producers with remaining acreage in primary term with 2+ years remaining
Leasehold primed for efficient cube development with 100% of locations expected to support 7,500’+ laterals; 100% of
acreage owns Spraberry through WCA rights and select ownership of WCD
No long term oil and gas sales dedications offer the purchaser marketing flexibility
Full Area Exit
Full area exit for Rio
Rio’s investments have been focused on assembling the position, perfecting subsurface interpretation, and readying the
asset for full-field development
Currently on the Market from BMO: Rio Oil & Gas II Glasscock County Divestiture
ASSET HIGHLIGHTS
ASSET OVERVIEW PROCESS OVERVIEW
LOCATOR MAP

9
April 15, 2019
25%
35%
45%
55%
65%
Feb-16 Aug-16 Feb-17 Aug-17 Feb-18 Aug-18 Feb-19
% o
f W
TI
NGL as % of WTI
$1
$2
$3
$4
$5
Apr-18 Oct-18 Apr-19 Oct-19 Apr-20
($/m
mb
tu)
$20
$30
$40
$50
$60
$70
$80
Apr-18 Oct-18 Apr-19 Oct-19 Apr-20
($/b
bl)
Historical Prices as of 11-Apr-19 Close ($/gal)
NGLs Current Last Wk. 6 Mo. Ago 1 Yr. Ago
Ethane $0.25 $0.22 $0.38 $0.28
Propane $0.67 $0.62 $0.96 $0.81
Butane $0.68 $0.66 $1.07 $0.81
Iso-butane $0.78 $0.74 $1.11 $0.91
Pentane+ $1.31 $1.27 $1.54 $1.56
NYMEX Gas Futures as of 11-Apr-19 Close ($/mmbtu)
Period(1) Current Last Wk. 6 Mo. Ago 1 Yr. Ago
12 Mo. Strip $2.85 $2.82 $2.96 $2.83
2019 $2.80 $2.78 $2.89 $2.79
2020 $2.77 $2.74 $2.69 $2.77
2021 $2.68 $2.67 $2.62 $2.81
2022 $2.85 $2.84 $2.75 $2.96
2023 $2.85 $2.84 $2.75 $2.96
NYMEX WTI Futures as of 11-Apr-19 Close ($/bbl) NYMEX Gas Futures as of 11-Apr-19 Close ($/mmbtu)
Period(1) Current Last Wk. 6 Mo. Ago 1 Yr. Ago
12 Mo. Strip $62.96 $61.73 $70.36 $63.99
2019 $63.45 $62.12 $70.05 $60.52
2020 $60.66 $59.77 $66.87 $56.18
2021 $57.34 $56.72 $63.38 $53.34
2022 $55.15 $54.63 $60.32 $51.72
2023 $54.10 $53.69 $58.12 $51.15
NGL PRICING(2)
HENRY HUB NATURAL GAS (HISTORICAL / FORECAST)
Commodity Prices
Source: BMO Commodity Products Group, Bloomberg, FactSet
1. Future prices are calendar year average unless stated otherwise.
2. Assumes typical Gulf Coast barrel composition.
WTI OIL (HISTORICAL / FORECAST)
Links:
http://www.nasdaq.com/markets/crude-oil.aspx
http://www.bloomberg.com/quote/CL1:COM
http://www.nasdaq.com/markets/natural-gas.aspx
http://www.bloomberg.com/quote/NG1:COM
Link to Detailed
Futures Data
Link to Detailed
Historical Graph
Link to Detailed
Futures Data
Link to Detailed
Historical Graph
[TBU]
[TBU]
[TBU]

10
April 15, 2019
Clearbrook
Midland
Cushing
St. James
(LLS)
East Coast
U.S. (Brent)
Midland Sweet-
Sour Spread
EMS
AECO
Northern
California
Sumas
Southern
California
El Paso - SJ
Waha
HSC
Henry Hub
Panhandle
CIG Chicago
Dominion
Transco
NATURAL GAS PRICING & DIFFERENTIALS TO HENRY HUB ($ / MMBTU) – AS OF 11-APR-19
Commodity Prices (cont’d)
OIL PRICING & DIFFERENTIALS TO CUSHING WTI ($ / BBL) – AS OF 11-APR-19
Legend
Price
Diff.
Legend
Price
Diff.
Source: BMO Commodity Products Group, Bloomberg
Note: Prices and differentials are for prompt month futures except for Clearbrook which is based on spot prices.
MAPS IN
MASTER VIEW
TBU
[TBU]
[TBU]
$63.58
$0.45 $65.95
$2.37
$2.31
($0.35)
$1.93
($0.73)
$2.66
$2.49
($0.17)
$58.73
($4.85)
$70.83
$7.25
$62.33
($1.25)
$59.83
($3.75)
$2.43
($0.23)
$2.69
$0.03
($0.42)
($3.08)
$1.94
($0.72)$1.34
($1.32)$1.97
($0.69)
$0.97
($1.69)$2.05
($0.61)
$3.16
$0.50

11
April 15, 2019
1,1561,294
1,0911,1491,223
9931,212
1,014868
1,2491,090
1,254
271
Apr-18 Jun-18 Aug-18 Oct-18 Dec-18 Feb-19 Apr-19
H V+D
Item Value Wkly Change Last Week Item Value Wkly Change Last Week
Rig Count 464 2 462 Oil Differential ($4.40) ($3.15) ($1.25)
Permitting Activity 71 (205) 276 Gas Differential ($3.04) $0.03 ($3.07)
0%
10%
20%
30%
40%
50%
--
100
200
300
400
500
Jan-15 Jan-16 Jan-17 Jan-18 Jan-19
H V+D % of Total Rigs
-$4.80
-$3.20
-$1.60
$0.00
$1.60
Jan-15 Jan-16 Jan-17 Jan-18 Jan-19
-$18.00
-$12.00
-$6.00
$0.00
$6.00
$ /
mm
btu
$ /
bb
l
Midland Waha
5,000
6,000
7,000
8,000
9,000
10,000
11,000
12,000
13,000
1,000
1,500
2,000
2,500
3,000
3,500
4,000
Jan-15 Jul-15 Jan-16 Jul-16 Jan-17 Jul-17 Jan-18 Jul-18
mm
cf/
d
mb
bl/
d
Oil Gas3,789
12,169
--$10,000$20,000$30,000$40,000$50,000$60,000
1Q
15
2Q
15
3Q
15
4Q
15
1Q
16
2Q
16
3Q
16
4Q
16
1Q
17
2Q
17
3Q
17
4Q
17
1Q
18
2Q
18
3Q
18
4Q
18
1Q
19
2Q
19
1 2 8 8 6 6 12 13 15 7 3 2 7 2 5 4 1 1
$ /
acre
# Deals
$26,459
--
$50,000
$100,000
$150,000
$200,000
1Q
15
2Q
15
3Q
15
4Q
15
1Q
16
2Q
16
3Q
16
4Q
16
1Q
17
2Q
17
3Q
17
4Q
17
1Q
18
2Q
18
3Q
18
4Q
18
1Q
19
2Q
19
1 2 6 9 5 7 11 9 9 6 1 0 7 2 5 4 1 1
$ /
bo
e/d
# Deals
$119,543
Ann'd
Date Buyer Seller Asset Description Value(1)
Proved
Multiple
Prod.
Multiple Net Acres
($mm) ($/boe) ($/boe/d) ($/acre)(2)
08-Apr-19 Sequitur Energy Resources LLCCallon 9,850 net acres in Reagan & Upton, TX $260 n.a. $65,000 $26,396
27-Mar-19 Undisclosed Buyer Rosehill Resources ~880 net acres in Lea Co., NM $22 n.a. n.a. $25,000
26-Feb-19 Ring Energy Inc Wishbone Energy Partners 37,206 net Central Basin Platform acres $300 $8.75 $50,000 $8,063
19-Feb-19 Undisclosed Buyer Noble Energy Non-core acreage in the Delaware Basin $63 n.a. n.a. n.a.
19-Feb-19 Undisclosed Buyer Noble Energy 13,000 net acres in Reeves Co., TX $132 n.a. n.a. $10,154
Mean $155 $8.75 $57,500 $17,403
Median $132 $8.75 $57,500 $17,577
Blue = BMO provided transaction advisory services Green = BMO provided acquisition financing or related services
Purple = BMO provided both transaction advisory services and acquisition financing or related services
GROSS PRODUCTION
TRANSACTION ACTIVITY (EXCLUDES CORPORATE DEALS)
TRANSACTION PRODUCTION MULTIPLES(3) TRANSACTION ADJUSTED NET ACRE MULTIPLES(3,4)
PERMITTING ACTIVITY BY MONTH
DIFFERENTIALS
Permian Snapshot
RIG COUNT
Source: BMO Transaction Database, Baker Hughes, BMO Commodity Products Group, Bloomberg, Drilling Info, PLS
Note: Current quarter’s data is through the week covered by this issue.
1. Represents total enterprise value. Excludes transactions with deal value <$20 million. 2. $/acre multiple not adjusted for value associated with production.
3. Red line denotes average since 01-Jan-17. Calculated as the weighted average of each quarter’s transactions.
4. Production valued at $45,000/boepd in 2014, $30,000/boepd in 2015, $35,000/boepd in 2016 & 2017, and $40,000/boepd in 2018 & 2019.
[TBU]
[TBU]
[TBU] [TBU]
[TBU] [TBU]
[TBU]

12
April 15, 2019
426474
438379
455
329402
344 312
396354
466
96
Apr-18 Jun-18 Aug-18 Oct-18 Dec-18 Feb-19 Apr-19
H V+D
Item Value Wkly Change Last Week Item Value Wkly Change Last Week
Rig Count 93 (1) 94 Oil Differential $6.50 ($0.05) $6.55
Permitting Activity 36 (41) 77 Gas Differential $0.03 $0.01 $0.02
0%
5%
10%
15%
20%
--
100
200
300
Jan-15 Jan-16 Jan-17 Jan-18 Jan-19
H V+D % of Total Rigs
-$0.30
-$0.20
-$0.10
$0.00
$0.10
$0.20
$0.30
$0.40
$0.50
Jan-15 Jan-16 Jan-17 Jan-18 Jan-19
-$6.00
-$4.00
-$2.00
$0.00
$2.00
$4.00
$6.00
$8.00
$10.00
$ /
mm
btu
$ /
bb
l
LLS HSC
6,000
6,500
7,000
7,500
8,000
8,500
9,000
9,500
10,000
10,500
1,000
1,200
1,400
1,600
1,800
2,000
2,200
Jan-15 Jul-15 Jan-16 Jul-16 Jan-17 Jul-17 Jan-18 Jul-18
mm
cf/
d
mb
bl/
d
Oil Gas
1,494
8,295
--$10,000$20,000$30,000$40,000$50,000$60,000
1Q
15
2Q
15
3Q
15
4Q
15
1Q
16
2Q
16
3Q
16
4Q
16
1Q
17
2Q
17
3Q
17
4Q
17
1Q
18
2Q
18
3Q
18
4Q
18
1Q
19
2Q
19
0 1 2 1 2 2 0 4 2 3 1 2 4 2 1 3 0 0
$ /
acre
# Deals
$6,130
--
$50,000
$100,000
$150,000
1Q
15
2Q
15
3Q
15
4Q
15
1Q
16
2Q
16
3Q
16
4Q
16
1Q
17
2Q
17
3Q
17
4Q
17
1Q
18
2Q
18
3Q
18
4Q
18
1Q
19
2Q
19
1 1 3 1 2 2 2 4 4 3 1 2 7 2 0 3 0 0
$ /
bo
e/d
# Deals
$70,217
Ann'd
Date Buyer Seller Asset Description Value(1)
Proved
Multiple
Prod.
Multiple Net Acres
($mm) ($/boe) ($/boe/d) ($/acre)(2)
19-Nov-18 Lonestar Resources Inc Sabine Oil & Gas Corp 2,706 net acres in Eagle Ford $39 $2.98 $48,375 $14,302
20-Sep-18 WildHorse Undisclosed Seller 20,305 net Eagle Ford/Austin Chalk acres $35 n.a. n.a. $1,743
07-Sep-18 Undisclosed Buyer Viking Minerals LLC 1,191 net royalty acres in Eagle Ford $28 n.a. n.a. nmf
31-Jul-18 EP Energy Corp Undisclosed Seller Additional working interests in Eagle Ford $31 n.a. n.a. n.a.
26-Jul-18 BP BHP Billiton Permian, Eagle Ford, and Haynesville $10,500 n.a. n.a. n.a.
Mean $2,127 $2.98 $48,375 $8,022
Median $35 $2.98 $48,375 $8,022
Blue = BMO provided transaction advisory services Green = BMO provided acquisition financing or related services
Purple = BMO provided both transaction advisory services and acquisition financing or related services
Eagle Ford Snapshot
TRANSACTION ACTIVITY (EXCLUDES CORPORATE DEALS)
PERMITTING ACTIVITY BY MONTH
DIFFERENTIALS RIG COUNT
Source: BMO Transaction Database, Baker Hughes, BMO Commodity Products Group, Bloomberg, Drilling Info, PLS
Note: Current quarter’s data is through the week covered by this issue.
1. Represents total enterprise value. Excludes transactions with deal value <$20 million. 2. $/acre multiple not adjusted for value associated with production.
3. Red line denotes average since 01-Jan-17. Calculated as the weighted average of each quarter’s transactions.
4. Production valued at $45,000/boepd in 2014, $30,000/boepd in 2015, $35,000/boepd in 2016 & 2017, and $40,000/boepd in 2018 & 2019.
TRANSACTION PRODUCTION MULTIPLES(3) TRANSACTION ADJUSTED NET ACRE MULTIPLES(3,4)
GROSS PRODUCTION

13
April 15, 2019
157168
154 163 167 177 179
111 104
165
108122
32
Apr-18 Jun-18 Aug-18 Oct-18 Dec-18 Feb-19 Apr-19
H V+D
Item Value Wkly Change Last Week Item Value Wkly Change Last Week
Rig Count 66 (2) 68 Oil Differential $6.50 ($0.05) $6.55
Permitting Activity 6 (25) 31 Gas Differential -- -- --
0%
5%
10%
15%
20%
--
20
40
60
80
Jan-15 Jan-16 Jan-17 Jan-18 Jan-19
H V+D % of Total Rigs
--
$2.00
$4.00
$6.00
$8.00
$10.00
Jan-15 Jan-16 Jan-17 Jan-18 Jan-19
--
$2.00
$4.00
$6.00
$8.00
$10.00
$ /
mm
btu
$ /
bb
l
LLS Henry Hub
5,000
6,000
7,000
8,000
9,000
10,000
11,000
12,000
80
90
100
110
120
130
140
Jan-15 Jul-15 Jan-16 Jul-16 Jan-17 Jul-17 Jan-18 Jul-18
mm
cf/
d
mb
bl/
d
Oil Gas
95
10,967
--$2,000$4,000$6,000$8,000
$10,000$12,000
1Q
15
2Q
15
3Q
15
4Q
15
1Q
16
2Q
16
3Q
16
4Q
16
1Q
17
2Q
17
3Q
17
4Q
17
1Q
18
2Q
18
3Q
18
4Q
18
1Q
19
2Q
19
0 0 5 1 1 3 2 3 0 2 2 0 1 1 2 1 0 0
$ /
mcfe
/d
# Deals
$5,209
--
$5,000
$10,000
$15,000
$20,000
1Q
15
2Q
15
3Q
15
4Q
15
1Q
16
2Q
16
3Q
16
4Q
16
1Q
17
2Q
17
3Q
17
4Q
17
1Q
18
2Q
18
3Q
18
4Q
18
1Q
19
2Q
19
0 0 3 1 1 2 1 3 0 1 2 0 1 1 1 1 0 0
$ /
acre
# Deals
$3,349
Ann'd
Date Buyer Seller Asset Description Value(1)
Proved
Multiple
Prod.
Multiple Net Acres
($mm) ($/mcfe) ($/mcfe/d) ($/acre)(2)
19-Dec-18 Comstock Shelby Shale LLC 6,023 net acres in Haynesville $21 n.a. n.a. $3,404
19-Nov-18 Aethon III QEP Resources Inc 49,700 net acres in Haynesville $735 $0.77 $2,475 $14,789
05-Sep-18 Viking Energy Group Multiple Sellers Texas and Louisiana assets $100 n.a. n.a. n.a.
05-Sep-18 Equinor Texegy LLC 60,000 net acres in Austin Chalk $75 n.a. n.a. $1,250
06-Aug-18 Mission Creek Resources Bonanza Creek Energy Inc 11,132 net acres in the Cotton Valley $117 $1.69 $6,500 $10,510
Mean $210 $1.23 $4,487 $7,488
Median $100 $1.23 $4,487 $6,957
Blue = BMO provided transaction advisory services Green = BMO provided acquisition financing or related services
Purple = BMO provided both transaction advisory services and acquisition financing or related services
Ark-La-Tex Snapshot
TRANSACTION ACTIVITY (EXCLUDES CORPORATE DEALS)
PERMITTING ACTIVITY BY MONTH
DIFFERENTIALS RIG COUNT
Source: BMO Transaction Database, Baker Hughes, BMO Commodity Products Group, Bloomberg, Drilling Info, PLS
Note: Current quarter’s data is through the week covered by this issue.
1. Represents total enterprise value. Excludes transactions with deal value <$20 million. 2. $/acre multiple not adjusted for value associated with production.
3. Red line denotes average since 01-Jan-17. Calculated as the weighted average of each quarter’s transactions.
4. Production valued at $3,000/mcfepd in 2014, and $2,000/mcfepd in 2015, 2016, 2017, 2018, and 2019.
TRANSACTION PRODUCTION MULTIPLES(3) TRANSACTION ADJUSTED NET ACRE MULTIPLES(3,4)
GROSS PRODUCTION
14
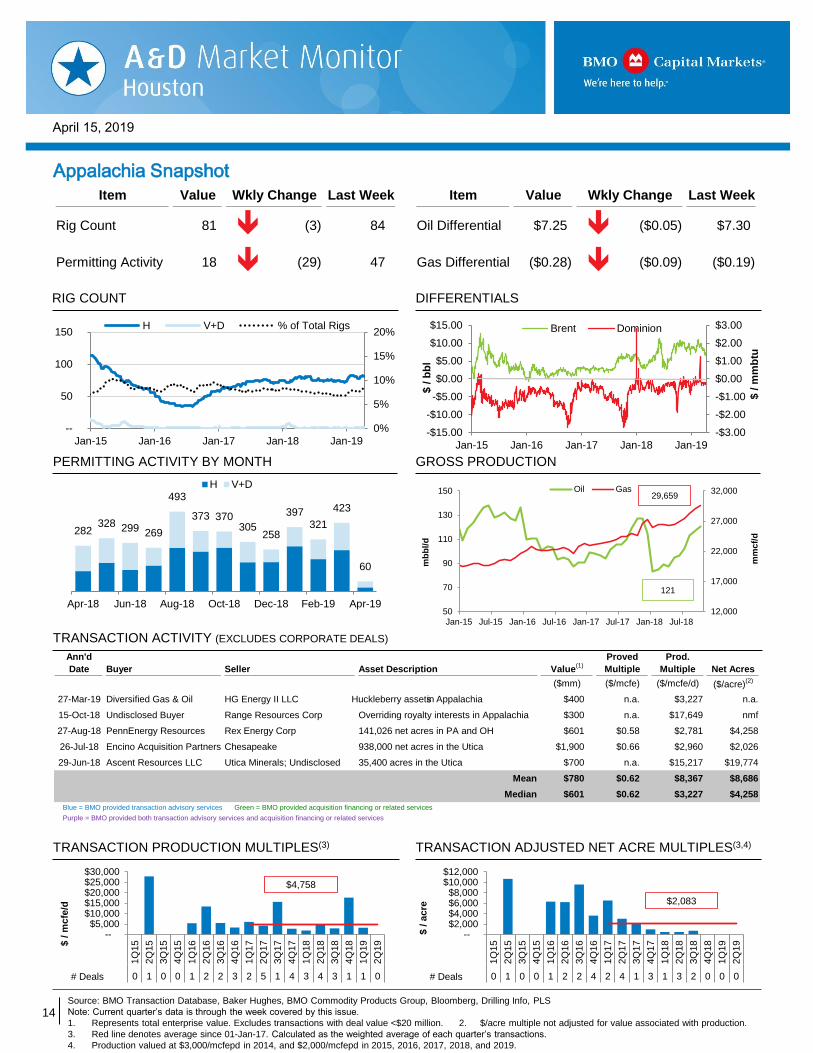
April 15, 2019
282328 299 269
493
373 370305
258
397321
423
60
Apr-18 Jun-18 Aug-18 Oct-18 Dec-18 Feb-19 Apr-19
H V+D
Item Value Wkly Change Last Week Item Value Wkly Change Last Week
Rig Count 81 (3) 84 Oil Differential $7.25 ($0.05) $7.30
Permitting Activity 18 (29) 47 Gas Differential ($0.28) ($0.09) ($0.19)
0%
5%
10%
15%
20%
--
50
100
150
Jan-15 Jan-16 Jan-17 Jan-18 Jan-19
H V+D % of Total Rigs
-$3.00
-$2.00
-$1.00
$0.00
$1.00
$2.00
$3.00
Jan-15 Jan-16 Jan-17 Jan-18 Jan-19
-$15.00
-$10.00
-$5.00
$0.00
$5.00
$10.00
$15.00
$ /
mm
btu
$ /
bb
l
Brent Dominion
12,000
17,000
22,000
27,000
32,000
50
70
90
110
130
150
Jan-15 Jul-15 Jan-16 Jul-16 Jan-17 Jul-17 Jan-18 Jul-18
mm
cf/
d
mb
bl/
d
Oil Gas
121
29,659
--$5,000
$10,000$15,000$20,000$25,000$30,000
1Q
15
2Q
15
3Q
15
4Q
15
1Q
16
2Q
16
3Q
16
4Q
16
1Q
17
2Q
17
3Q
17
4Q
17
1Q
18
2Q
18
3Q
18
4Q
18
1Q
19
2Q
19
0 1 0 0 1 2 2 3 2 5 1 4 3 4 3 1 1 0
$ /
mcfe
/d
# Deals
$4,758
--$2,000$4,000$6,000$8,000
$10,000$12,000
1Q
15
2Q
15
3Q
15
4Q
15
1Q
16
2Q
16
3Q
16
4Q
16
1Q
17
2Q
17
3Q
17
4Q
17
1Q
18
2Q
18
3Q
18
4Q
18
1Q
19
2Q
19
0 1 0 0 1 2 2 4 2 4 1 3 1 3 2 0 0 0
$ /
acre
# Deals
$2,083
Ann'd
Date Buyer Seller Asset Description Value(1)
Proved
Multiple
Prod.
Multiple Net Acres
($mm) ($/mcfe) ($/mcfe/d) ($/acre)(2)
27-Mar-19 Diversified Gas & Oil HG Energy II LLC Huckleberry assets in Appalachia $400 n.a. $3,227 n.a.
15-Oct-18 Undisclosed Buyer Range Resources Corp Overriding royalty interests in Appalachia $300 n.a. $17,649 nmf
27-Aug-18 PennEnergy Resources Rex Energy Corp 141,026 net acres in PA and OH $601 $0.58 $2,781 $4,258
26-Jul-18 Encino Acquisition Partners Chesapeake 938,000 net acres in the Utica $1,900 $0.66 $2,960 $2,026
29-Jun-18 Ascent Resources LLC Utica Minerals; Undisclosed 35,400 acres in the Utica $700 n.a. $15,217 $19,774
Mean $780 $0.62 $8,367 $8,686
Median $601 $0.62 $3,227 $4,258
Blue = BMO provided transaction advisory services Green = BMO provided acquisition financing or related services
Purple = BMO provided both transaction advisory services and acquisition financing or related services
Appalachia Snapshot
TRANSACTION ACTIVITY (EXCLUDES CORPORATE DEALS)
PERMITTING ACTIVITY BY MONTH
DIFFERENTIALS RIG COUNT
Source: BMO Transaction Database, Baker Hughes, BMO Commodity Products Group, Bloomberg, Drilling Info, PLS
Note: Current quarter’s data is through the week covered by this issue.
1. Represents total enterprise value. Excludes transactions with deal value <$20 million. 2. $/acre multiple not adjusted for value associated with production.
3. Red line denotes average since 01-Jan-17. Calculated as the weighted average of each quarter’s transactions.
4. Production valued at $3,000/mcfepd in 2014, and $2,000/mcfepd in 2015, 2016, 2017, 2018, and 2019.
TRANSACTION PRODUCTION MULTIPLES(3) TRANSACTION ADJUSTED NET ACRE MULTIPLES(3,4)
GROSS PRODUCTION

15
April 15, 2019
108138 126
171 164
127
201
12896
133114
138
41
Apr-18 Jun-18 Aug-18 Oct-18 Dec-18 Feb-19 Apr-19
H V+D
Item Value Wkly Change Last Week Item Value Wkly Change Last Week
Rig Count 61 -- 61 Oil Differential ($1.25) ($0.75) ($0.50)
Permitting Activity 8 (31) 39 Gas Differential ($0.73) ($0.11) ($0.61)
0%
5%
10%
15%
20%
--
50
100
150
200
Jan-15 Jan-16 Jan-17 Jan-18 Jan-19
H V+D % of Total Rigs
-$1.00
-$0.50
$0.00
$0.50
Jan-15 Jan-16 Jan-17 Jan-18 Jan-19
-$20.00
-$10.00
$0.00
$10.00
$ /
mm
btu
$ /
bb
l
Clearbrook CIG
1,100
1,300
1,500
1,700
1,900
2,100
2,300
2,500
2,700
800
900
1,000
1,100
1,200
1,300
1,400
1,500
Jan-15 Jul-15 Jan-16 Jul-16 Jan-17 Jul-17 Jan-18 Jul-18
mm
cf/
d
mb
bl/
d
Oil Gas
1,427
2,635
--
$5,000
$10,000
$15,000
$20,000
$25,000
1Q
15
2Q
15
3Q
15
4Q
15
1Q
16
2Q
16
3Q
16
4Q
16
1Q
17
2Q
17
3Q
17
4Q
17
1Q
18
2Q
18
3Q
18
4Q
18
1Q
19
2Q
19
0 0 1 2 0 0 2 3 1 0 3 2 0 5 2 0 0 0
$ /
acre
# Deals
$2,712
--
$20,000
$40,000
$60,000
$80,000
1Q
15
2Q
15
3Q
15
4Q
15
1Q
16
2Q
16
3Q
16
4Q
16
1Q
17
2Q
17
3Q
17
4Q
17
1Q
18
2Q
18
3Q
18
4Q
18
1Q
19
2Q
19
0 1 1 4 0 2 3 3 0 1 3 3 0 6 3 0 0 0
$ /
bo
e/d
# Deals
$43,532
Ann'd
Date Buyer Seller Asset Description Value(1)
Proved
Multiple
Prod.
Multiple Net Acres
($mm) ($/boe) ($/boe/d) ($/acre)(2)
31-Jul-18 Northern Oil and Gas W Energy Partners 10,600 net acres in Williston Basin $288 n.a. $42,708 $27,196
18-Jul-18 Northern Oil and Gas Pivotal Petroleum Partners LP Producing assets in Williston Basin $152 n.a. $37,032 n.a.
12-Jul-18 PetroShale Inc Slawson Exploration Co 1,981 net acres in Williston Basin $55 $6.04 $100,000 $27,764
06-Jul-18 Energy Resources 12 LP Bruin E&P Partners LLC 2.8% non-operated WI in Bakken assets $83 n.a. n.a. n.a.
25-Jun-18 Riverbend Oil & Gas LLC Oasis Petroleum 10,167 net acres in Williston Basin $153 n.a. $49,196 $15,049
Mean $146 $6.04 $57,234 $23,336
Median $152 $6.04 $45,952 $27,196
Blue = BMO provided transaction advisory services Green = BMO provided acquisition financing or related services
Purple = BMO provided both transaction advisory services and acquisition financing or related services
Bakken Snapshot
TRANSACTION ACTIVITY (EXCLUDES CORPORATE DEALS)
PERMITTING ACTIVITY BY MONTH
DIFFERENTIALS RIG COUNT
Source: BMO Transaction Database, Baker Hughes, BMO Commodity Products Group, Bloomberg, Drilling Info, PLS
Note: Current quarter’s data is through the week covered by this issue.
1. Represents total enterprise value. Excludes transactions with deal value <$20 million. 2. $/acre multiple not adjusted for value associated with production.
3. Red line denotes average since 01-Jan-17. Calculated as the weighted average of each quarter’s transactions.
4. Production valued at $45,000/boepd in 2014, $30,000/boepd in 2015, $35,000/boepd in 2016 & 2017, and $40,000/boepd in 2018 & 2019.
TRANSACTION PRODUCTION MULTIPLES(3) TRANSACTION ADJUSTED NET ACRE MULTIPLES(3,4)
GROSS PRODUCTION

16
April 15, 2019
328456
551666
523 510
681
824 807
346 394478
108
Apr-18 Jun-18 Aug-18 Oct-18 Dec-18 Feb-19 Apr-19
H V+D
Item Value Wkly Change Last Week Item Value Wkly Change Last Week
Rig Count 77 (1) 78 Oil Differential ($1.25) ($0.75) ($0.50)
Permitting Activity 12 (139) 151 Gas Differential ($0.73) ($0.11) ($0.61)
0%
5%
10%
15%
20%
--
50
100
150
Jan-15 Jan-16 Jan-17 Jan-18 Jan-19
H V+D % of Total Rigs
-$1.00
-$0.50
$0.00
$0.50
Jan-15 Jan-16 Jan-17 Jan-18 Jan-19
-$20.00
-$10.00
$0.00
$10.00
$ /
mm
btu
$ /
bb
l
Clearbrook CIG
11,500
12,000
12,500
13,000
13,500
14,000
400
500
600
700
800
900
Jan-15 Jul-15 Jan-16 Jul-16 Jan-17 Jul-17 Jan-18 Jul-18
mm
cf/
d
mb
bl/
d
Oil Gas
841
13,150
--$20,000$40,000$60,000$80,000
$100,000$120,000
1Q
15
2Q
15
3Q
15
4Q
15
1Q
16
2Q
16
3Q
16
4Q
16
1Q
17
2Q
17
3Q
17
4Q
17
1Q
18
2Q
18
3Q
18
4Q
18
1Q
19
2Q
19
2 0 4 4 1 6 2 0 1 6 3 9 3 1 3 1 1 0
$ /
bo
e/d
# Deals
$37,548
--
$5,000
$10,000
$15,000
$20,000
1Q
15
2Q
15
3Q
15
4Q
15
1Q
16
2Q
16
3Q
16
4Q
16
1Q
17
2Q
17
3Q
17
4Q
17
1Q
18
2Q
18
3Q
18
4Q
18
1Q
19
2Q
19
0 0 3 3 0 1 1 0 1 0 1 5 2 0 2 1 0 0
$ /
acre
# Deals
$4,655
Ann'd
Date Buyer Seller Asset Description Value(1)
Proved
Multiple
Prod.
Multiple Net Acres
($mm) ($/boe) ($/boe/d) ($/acre)(2)
14-Feb-19 Undisclosed Buyer Harvest Oil & Gas Corp San Juan Basin assets $43 $1.57 $10,835 n.a.
31-Jan-19 Undisclosed Buyer Extraction Oil & Gas 5,000 net acres in Powder River $22 n.a. n.a. $4,480
01-Oct-18 DJR Energy LLC Encana 182,000 net acres in San Juan Basin $480 n.a. $88,889 $2,637
28-Aug-18 Vermilion Energy Inc Massif Oil & Gas LLC 55,000 acres in Powder River Basin $150 n.a. $56,604 $2,727
28-Aug-18 Rebellion Energy II LLC Liberty Resources II LLC 19,000 net acres in Powder River Basin $100 n.a. n.a. $5,263
Mean $159 $1.57 $52,109 $3,777
Median $100 $1.57 $56,604 $3,604
Blue = BMO provided transaction advisory services Green = BMO provided acquisition financing or related services
Purple = BMO provided both transaction advisory services and acquisition financing or related services
TRANSACTION ACTIVITY (EXCLUDES CORPORATE DEALS)
PERMITTING ACTIVITY BY MONTH
DIFFERENTIALS
Rockies (excl. Bakken) Snapshot
RIG COUNT
Source: BMO Transaction Database, Baker Hughes, BMO Commodity Products Group, Bloomberg, Drilling Info, PLS
Note: Current quarter’s data is through the week covered by this issue.
1. Represents total enterprise value. Excludes transactions with deal value <$20 million. 2. $/acre multiple not adjusted for value associated with production.
3. Red line denotes average since 01-Jan-17. Calculated as the weighted average of each quarter’s transactions.
4. Production valued at $45,000/boepd in 2014, $30,000/boepd in 2015, $35,000/boepd in 2016 & 2017, and $40,000/boepd in 2018 & 2019.
TRANSACTION PRODUCTION MULTIPLES(3) TRANSACTION ADJUSTED NET ACRE MULTIPLES(3,4)
GROSS PRODUCTION

17
April 15, 2019
366 355
438380
426388
335327 303
339288
341
98
Apr-18 Jun-18 Aug-18 Oct-18 Dec-18 Feb-19 Apr-19
H V+D
Item Value Wkly Change Last Week Item Value Wkly Change Last Week
Rig Count 115 (2) 117 Oil Differential -- -- --
Permitting Activity 22 (70) 92 Gas Differential ($0.72) ($0.07) ($0.65)
0%
5%
10%
15%
20%
--
100
200
300
400
Jan-15 Jan-16 Jan-17 Jan-18 Jan-19
H V+D % of Total Rigs
-$1.00
-$0.75
-$0.50
-$0.25
$0.00
$0.25
Jan-15 Jan-16 Jan-17 Jan-18 Jan-19
-$1.00
-$0.75
-$0.50
-$0.25
$0.00
$0.25
$ /
mm
btu
$ /
bb
l
Cushing Panhandle
6,000
7,000
8,000
9,000
10,000
11,000
12,000
13,000
400
450
500
550
600
650
700
Jan-15 Jul-15 Jan-16 Jul-16 Jan-17 Jul-17 Jan-18 Jul-18
mm
cf/
d
mb
bl/
d
Oil Gas
598
8,670
--
$5,000
$10,000
$15,000
$20,000
1Q
15
2Q
15
3Q
15
4Q
15
1Q
16
2Q
16
3Q
16
4Q
16
1Q
17
2Q
17
3Q
17
4Q
17
1Q
18
2Q
18
3Q
18
4Q
18
1Q
19
2Q
19
1 3 1 2 0 3 3 2 4 1 2 1 0 0 0 1 0 0
$ /
acre
# Deals
$5,760
--
$50,000
$100,000
$150,000
$200,000
1Q
15
2Q
15
3Q
15
4Q
15
1Q
16
2Q
16
3Q
16
4Q
16
1Q
17
2Q
17
3Q
17
4Q
17
1Q
18
2Q
18
3Q
18
4Q
18
1Q
19
2Q
19
1 4 1 3 1 6 3 1 4 2 4 5 2 2 5 4 1 0
$ /
bo
e/d
# Deals
$44,453
Ann'd
Date Buyer Seller Asset Description Value(1)
Proved
Multiple
Prod.
Multiple Net Acres
($mm) ($/boe) ($/boe/d) ($/acre)(2)
19-Feb-19 Mid-Con Energy Partners Scout Energy Partners Caddo, Grady, and Osage cos., OK $28 n.a. $20,960 n.a.
31-Dec-18 Unit Corp Undisclosed Seller ~8,700 net acres in Western OK $30 $11.38 n.a. $3,402
11-Dec-18 Undisclosed Buyer Riviera Resources Inc 37,000 net acres in the Arkoma Basin $68 n.a. $17,000 $1,838
02-Nov-18 SandRidge Energy Undisclosed Seller Mississippi Lime and NW STACK assets $25 n.a. $6,649 n.a.
31-Oct-18 Casillas Petroleum Corp Sheridan Production Partners 29,600 net acres in SCOOP assets $260 n.a. $78,078 $8,784
Mean $82 $11.38 $30,672 $4,675
Median $30 $11.38 $18,980 $3,402
Blue = BMO provided transaction advisory services Green = BMO provided acquisition financing or related services
Purple = BMO provided both transaction advisory services and acquisition financing or related services
Mid-Continent Snapshot
TRANSACTION ACTIVITY (EXCLUDES CORPORATE DEALS)
PERMITTING ACTIVITY BY MONTH
DIFFERENTIALS RIG COUNT
Source: BMO Transaction Database, Baker Hughes, BMO Commodity Products Group, Bloomberg, Drilling Info, PLS
Note: Current quarter’s data is through the week covered by this issue.
1. Represents total enterprise value. Excludes transactions with deal value <$20 million. 2. $/acre multiple not adjusted for value associated with production.
3. Red line denotes average since 01-Jan-17. Calculated as the weighted average of each quarter’s transactions.
4. Production valued at $45,000/boepd in 2014, $30,000/boepd in 2015, $35,000/boepd in 2016 & 2017, and $40,000/boepd in 2018 & 2019.
TRANSACTION PRODUCTION MULTIPLES(3) TRANSACTION ADJUSTED NET ACRE MULTIPLES(3,4)
GROSS PRODUCTION

18
April 15, 2019
2733
29 2932 33
39
32 30 32 33
26
9
Apr-18 Jun-18 Aug-18 Oct-18 Dec-18 Feb-19 Apr-19
Item Value Wkly Change Last Week Item Value Wkly Change Last Week
Rig Count 23 1 22 Oil Differential $6.50 ($0.05) $6.55
Permitting Activity 2 (7) 9 Gas Differential -- -- --
0%
5%
10%
15%
20%
--
10
20
30
40
Jan-15 Jan-16 Jan-17 Jan-18 Jan-19
Deep Water Shelf % of Total Rigs
--
$2.00
$4.00
$6.00
$8.00
$10.00
Jan-15 Jan-16 Jan-17 Jan-18 Jan-19
--
$2.00
$4.00
$6.00
$8.00
$10.00
$ /
mm
btu
$ /
bb
l
LLS Henry Hub
2,000
2,500
3,000
3,500
4,000
4,500
1,000
1,200
1,400
1,600
1,800
2,000
2,200
Jan-15 Jul-15 Jan-16 Jul-16 Jan-17 Jul-17 Jan-18 Jul-18
mm
cf/
d
mb
bl/
d
Oil Gas
1,744
2,708
--
$10
$20
$30
$40
1Q
15
2Q
15
3Q
15
4Q
15
1Q
16
2Q
16
3Q
16
4Q
16
1Q
17
2Q
17
3Q
17
4Q
17
1Q
18
2Q
18
3Q
18
4Q
18
1Q
19
2Q
19
0 0 1 0 0 0 2 1 0 0 0 1 2 1 0 1 1 0
$ /
bo
e
# Deals
$18.10
--
$15,000
$30,000
$45,000
$60,000
$75,000
1Q
15
2Q
15
3Q
15
4Q
15
1Q
16
2Q
16
3Q
16
4Q
16
1Q
17
2Q
17
3Q
17
4Q
17
1Q
18
2Q
18
3Q
18
4Q
18
1Q
19
2Q
19
0 0 1 1 0 0 2 0 0 0 0 1 2 2 2 1 1 1
$ /
bo
e/d
# Deals
$35,001
Ann'd
Date Buyer Seller Asset Description Value(2)
Proved
Multiple
Prod.
Multiple Net Acres
($mm) ($/boe) ($/boe/d) ($/acre)(3)
11-Apr-19 Delek Group Shell 22.45% WI in Caesar-Tonga Field $965 n.a. $60,540 n.a.
16-Jan-19 Talos Energy Inc Samson Energy Co LLC Non-op Gulf of Mexico working interest $30 $13.45 $17,939 n.a.
10-Oct-18 Murphy Petrobras Gulf of Mexico joint venture $900 $15.00 $21,951 n.a.
04-Sep-18 Talos Energy Inc Whistler Energy II LLC Leases in Green Canyon federal waters $91 n.a. $60,667 n.a.
27-Apr-18 Stone Energy Shell; ExxonMobil; Anadarko GOM Ram Powell assets $234 n.a. $38,361 n.a.
Mean $444 $14.23 $39,891 n.a.
Median $234 $14.23 $38,361 n.a.
Blue = BMO provided transaction advisory services Green = BMO provided acquisition financing or related services
Purple = BMO provided both transaction advisory services and acquisition financing or related services
Gulf of Mexico Snapshot
PERMITTING ACTIVITY BY MONTH(1)
DIFFERENTIALS RIG COUNT
Source: BMO Transaction Database, Baker Hughes, BMO Commodity Products Group, Bloomberg, Drilling Info, PLS
Note: Current quarter’s data is through the week covered by this issue.
1. Permits include directional and unidentified drilling permits. 2. Represents total enterprise value. Excludes transactions with deal value <$20 million.
3. $/acre multiple not adjusted for value associated with production.
4. Red line denotes average since 01-Jan-17. Calculated as the weighted average of each quarter’s transactions.
GROSS PRODUCTION
TRANSACTION ACTIVITY (EXCLUDES CORPORATE DEALS)
TRANSACTION PRODUCTION MULTIPLES(4) TRANSACTION PROVED RESERVE MULTIPLES(4)

19
April 15, 2019
Upcoming Industry Events
Disclaimer: The foregoing links are for convenience only and relate to materials that were not prepared or reviewed by BMO Capital Markets. BMO Capital Markets takes
no responsibility for and makes no representations with respect to the contents thereof. These materials may be inconsistent with the views of BMO Capital Markets.
Click event to open
July 2019 Jul 10 Houston Producers Forum Luncheon
Jul 19 ADAM-Houston Monthly Luncheon
April 2019 Apr 15 DUG Sand (Fort Worth)
Apr 15 DUG Water (Fort Worth)
Apr 15-17 DUG Permian (Fort Worth)
Apr 16 Houston Producers Forum Luncheon
Apr 17 SPE Business Development Event
Apr 22-23 Mineral & Royalty Conference
ADAM-Houston Monthly Luncheon – 3rd Friday
Houston Producers Forum Luncheon – 3rd Tuesday
Note: Event features a speaker from BMO
Houston’s A&D Group.
May 2019 May 1 HPF/SPE YP Crawfish Boil
May 6-9 Offshore Technology Conference
May 10 Petroleum Resources Economics Conference
May 13-17 SPE Electric Submersible Pumps Symposium
May 14-15 DUG Rockies (Denver)
May 16 IADC Drilling Onshore Conference & Exhibition
May 17 ADAM-Houston Monthly Luncheon
May 21 Houston Producers Forum Luncheon
June 2019 Jun 5-6 Midstream Texas Conference & Exhibition
Jun 18 Houston Producers Forum Luncheon
Jun 18-20 DUG East (Pittsburgh)
Jun 19-20 IADC World Drilling Conference & Exhibition
Jun 21 ADAM-Houston Monthly Luncheon
Jun 24-26 IPAA Midyear Meeting
Jun 25 176th OPEC Meeting
August 2019 Aug 16 ADAM-Houston Monthly Luncheon
Aug 20 IPAA Oil & Gas Overview Course
Aug 20 Houston Producers Forum Luncheon
Aug 21-22 Summer NAPE
September 2019 Sep 17 Houston Producers Forum Luncheon
Sep 20 ADAM-Houston Monthly Luncheon
Sep 24-26 DUG Eagle Ford (San Antonio)
Sep 30-Oct 2 SPE Annual Technical Conference and Exhibition
January 2019 Jan 31 SPE A&D Symposium
October 2019 Oct 9 IPAA Leaders in Industry Luncheon
Oct 15 Houston Producers Forum Luncheon
Oct 18 ADAM-Houston Monthly Luncheon
Oct 22-23 A&D Strategies and Opportunities Conference
2020
Apr 20-22 OGIS New York
Jul 22-24 SPE Unconventional Resources Technology
Aug 11-14 Enercom Oil & Gas Conference
November 2019 Nov 4-6 Executive Oil Conference & Exhibition
Nov 15 ADAM-Houston Monthly Luncheon
Nov 19 IPAA Oil & Gas for Newcomers
Nov 19 Houston Producers Forum Luncheon
Nov 19-21 DUG Midcontinent (Oklahoma City)
December 2019 Dec 17 Houston Producers Forum Luncheon
Dec 20 ADAM-Houston Monthly Luncheon
January 2019 Jan 15 Houston Producers Forum Luncheon
Jan 25 ADAM-Houston Monthly Luncheon
Jan 24 IPAA Private Capital Conference
Jan 31 SPE A&D Symposium
March 2019 Mar 26-28 International Petroleum Technology Conference
January 2020 Jan 23 IPAA Private Capital Conference
Jan 17 ADAM-Houston Monthly Luncheon
Jan 21 Houston Producers Forum Luncheon
February 2020 Feb 19 Houston Producers Forum Luncheon
Feb 25-26 DUG Haynesville (Shreveport)

20
April 15, 2019
SCOOP/STACK/Merge
DJ-Niobrara
Eagle Ford
Haynesville
Granite Wash
GOM
Permian
Marcellus
Utica
Williston
Gulf Coast Onshore
Piceance
Powder River Green River
Legend
Current
Change
This material is prepared by the BMO Capital Markets’ Investment and Corporate Banking Department, for distribution to BMO Capital Markets’ clientele. It is not a product of
BMO Capital Markets’ Research Department. The views of the Investment and Corporate Banking Department may differ from those of the Research Department.
BMO Capital Markets is a trade name used by BMO Financial Group for the wholesale banking businesses of Bank of Montreal, BMO Harris Bank N.A. (member FDIC), Bank of Montreal
Ireland p.l.c, and Bank of Montreal (China) Co. Ltd and the institutional broker dealer businesses of BMO Capital Markets Corp. (Member FINRA and SIPC) in the U.S., BMO Nesbitt
Burns Inc. (Member Investment Industry Regulatory Organization of Canada and Member Canadian Investor Protection Fund) in Canada and Asia and BMO Capital Markets Limited
(authorised and regulated by the Financial Conduct Authority) in Europe and Australia. “Nesbitt Burns” is a registered trademark of BMO Nesbitt Burns Inc., used under license. “BMO
Capital Markets” is a trademark of Bank of Montreal, used under license. "BMO (M-Bar roundel symbol)" is a registered trademark of Bank of Montreal, used under license. ® Registered
trademark of Bank of Montreal in the United States, Canada and elsewhere. ™ Trademark of Bank of Montreal in the United States and Canada.
Bank of Montreal or its subsidiaries (“BMO Financial Group”) has lending arrangements with, or provide other remunerated services to, many issuers covered by BMO Capital Markets.
The opinions, estimates and projections contained in this report are those of BMO Capital Markets as of the date of this report and are subject to change without notice. BMO Capital
Markets endeavors to ensure that the contents have been compiled or derived from sources that we believe are reliable and contain information and opinions that are accurate and
complete. However, BMO Capital Markets makes no representation or warranty, express or implied, in respect thereof, takes no responsibility for any errors and omissions contained
herein and accepts no liability whatsoever for any loss arising from any use of, or reliance on, this report or its contents. Information may be available to BMO Capital Markets or its
affiliates that is not reflected in this report. The information in this report is not intended to be used as the primary basis of investment decisions, and because of individual client
objectives, should not be construed as advice designed to meet the particular investment needs of any investor. This material is for information purposes only and is not an offer to sell or
the solicitation of an offer to buy any security. BMO Capital Markets or its affiliates will buy from or sell to customers the securities of issuers mentioned in this report on a principal basis.
BMO Capital Markets or its affiliates, officers, directors or employees have a long or short position in many of the securities discussed herein, related securities or in options, futures or
other derivative instruments based thereon. BMO Capital Markets may act as financial advisor and/or underwriter for the issuers mentioned herein and may receive remuneration for
same. The reader should assume that BMO Capital Markets or its affiliates may have a conflict of interest and should not rely solely on this report in evaluating whether or not to buy or
sell securities of issuers discussed herein.
All values in this document are in US$ unless otherwise specified.
Source of rig count stats: Baker Hughes
Rig Count Summary
MAPS IN
MASTER VIEW
Contacts
Disclaimer
Geoff Roberts
MD & Co-Head of U.S. A&D
713-518-1268
Jason Martinez
MD & Co-Head of U.S. A&D
713-546-9771
Howard Barnwell
MD & Transactions Mgr.
713-546-9767
Rob Priske
MD & Transactions Mgr.
713-546-9727
Marian Yu
Associate
Aaron Moeller
Associate
Chelsea Neville
Transactions Coordinator
BMO uses updated basin outlines, and the resulting rig counts, to more accurately represent current basin knowledge. The data below reflect these changes
and is different than those shown by Baker Hughes. The totals are the same.
464
2
61
--
18
3
63
(6)30
(1)
23
1
14
184
(3)
66
(2)
93
(1)
20
3
4
--
23
--18
--
[TBU]
This
Week Change
Last
Week
Last
Year
Total Rigs 1,022 (3) 1,025 1,008
Oil 833 2 831 815
Gas 189 (5) 194 192
Miscellaneous -- -- -- 1
Directional 78 8 70 70
Horizontal 889 (12) 901 883
Vertical 55 1 54 55
Basin
Permian 464 2 462 445
SCOOP/STACK/Merge 84 (3) 87 107
Granite Wash 14 1 13 19
Eagle Ford 93 (1) 94 93
Haynesville 66 (2) 68 61
Marcellus 63 (6) 69 55
Utica 18 3 15 25
Williston 61 -- 61 55
DJ-Niobrara 30 (1) 31 24
Green River 18 -- 18 20
Powder River 23 -- 23 15
Piceance 4 -- 4 7
Gulf Coast Onshore 20 3 17 22
GOM 23 1 22 16
Alaska 8 -- 8 8
Other 33 -- 33 36
Mid-Con 17 -- 17 18
Rockies 2 -- 2 3
Western 13 -- 13 15
Eastern 1 -- 1 --