projected changes in drought occurrence under future global warming...
TRANSCRIPT
Projected changes in drought occurrence under future globalwarming from multi-model, multi-scenario, IPCC AR4simulations
Justin Sheffield Æ Eric F. Wood
Received: 24 July 2007 / Accepted: 5 November 2007 / Published online: 27 November 2007
� Springer-Verlag 2007
Abstract Recent and potential future increases in global
temperatures are likely to be associated with impacts on the
hydrologic cycle, including changes to precipitation and
increases in extreme events such as droughts. We analyze
changes in drought occurrence using soil moisture data for
the SRES B1, A1B and A2 future climate scenarios relative
to the PICNTRL pre-industrial control and 20C3M twen-
tieth century simulations from eight AOGCMs that
participated in the IPCC AR4. Comparison with observa-
tion forced land surface model estimates indicates that the
models do reasonably well at replicating our best estimates
of twentieth century, large scale drought occurrence,
although the frequency of long-term (more than 12-month
duration) droughts are over-estimated. Under the future
projections, the models show decreases in soil moisture
globally for all scenarios with a corresponding doubling of
the spatial extent of severe soil moisture deficits and fre-
quency of short-term (4–6-month duration) droughts from
the mid-twentieth century to the end of the twenty-first.
Long-term droughts become three times more common.
Regionally, the Mediterranean, west African, central Asian
and central American regions show large increases most
notably for long-term frequencies as do mid-latitude North
American regions but with larger variation between sce-
narios. In general, changes under the higher emission
scenarios, A1B and A2 are the greatest, and despite fol-
lowing a reduced emissions pathway relative to the present
day, the B1 scenario shows smaller but still substantial
increases in drought, globally and for most regions.
Increases in drought are driven primarily by reductions in
precipitation with increased evaporation from higher tem-
peratures modulating the changes. In some regions,
increases in precipitation are offset by increased evapora-
tion. Although the predicted future changes in drought
occurrence are essentially monotonic increasing globally
and in many regions, they are generally not statistically
different from contemporary climate (as estimated from the
1961–1990 period of the 20C3M simulations) or natural
variability (as estimated from the PICNTRL simulations)
for multiple decades, in contrast to primary climate vari-
ables, such as global mean surface air temperature and
precipitation. On the other hand, changes in annual and
seasonal means of terrestrial hydrologic variables, such as
evaporation and soil moisture, are essentially undetectable
within the twenty-first century. Changes in the extremes of
climate and their hydrological impacts may therefore be
more detectable than changes in their means.
1 Introduction
The climate varies naturally in response to external forcings,
such as solar radiation (Christensen and Lassen 1991) and
atmospheric aerosols (Robock and Mao 1995), and because
of internal interactions between components of the climate
system (Trenberth and Hurrell 1994). The extremes of these
variations have consequences on the terrestrial water cycle
that impact human activities in terms of changes to the
availability or absence of water, e.g., flooding or drought
(Higgins et al. 2000; Dai et al. 1998). When coupled with
potential climate change, which may impact regionally and
exaggerate the influence of natural variability, the extremes
of climate may become more pronounced (Easterling et al.
2000; Palmer and Raisanen 2002). To design and implement
J. Sheffield (&) � E. F. Wood
Department of Civil and Environmental Engineering,
Princeton University, Princeton, NJ 08544, USA
e-mail: [email protected]
123
Clim Dyn (2008) 31:79–105
DOI 10.1007/s00382-007-0340-z
strategies to minimize climate change or mitigate against the
detrimental impacts (Hasselmann et al. 2003), it is essential
to be able to detect whether climate change is actually
occurring and to what extent. This is problematic because the
climate change signal may be small relative to the natural
variability of the climate system (Hulme et al. 1999) and may
thus be undetectable, at least over the short term. The pos-
sibility then arises that by the time the signal becomes
detectable, adverse impacts may have already occurred and it
may be too late to reverse the change or even adapt to it
(Pittock 1999; King 2004).
Climate change is often measured by changes in primary
climate variables such as global surface air temperature and
precipitation. These variables are first order drivers of
climate impacts, inducing changes in weather extremes, sea
ice thinning and glacier retreat, and thus are appropriate for
studying the broader issues in climate change. They are
also the best-observed variables over large scales with
relatively long historical records. Recent changes in cli-
mate may be large enough to be detectable now, although
this will depend on the climate variable and our level of
confidence in detecting change (Hegerl et al. 2006).
Analysis of the instrumental record indicates that recent
increases in global annual temperature are anomalous and
more rapid compared to the long-term record (e.g., Jones
et al. 1999; Hansen et al. 1999; Brohan et al. 2006) and
model results suggest that this cannot be due to natural
variability alone (Jansen et al. 2007). However, changes in
global variables may bear little relation to regional chan-
ges, especially for precipitation (Giorgi and Bi 2005) and
thus changes in, for example, droughts and floods that may
have serious impacts on human and environmental welfare.
The potential acceleration of the hydrologic cycle under
recent and future global warming is of considerable interest
(Huntington 2006), especially in terms of changes in
regional variability and extremes. Of all natural disasters,
the economic and environmental consequences of drought
are among the highest, due primarily to the longevity and
widespread spatial extent of many droughts (Wilhite 2000).
Thus the potential impacts of climate change on drought
are most pertinent. As temperatures rise, the capacity of the
atmosphere to hold moisture would increase as governed
by the Clausius–Clapeyron equation (Held and Soden
2000), with potential for increased evaporation and/or
precipitation (Trenberth 1999), although these may be
limited by other factors such as available energy and aer-
osol concentration. Climate model studies have shown that
variability is likely to increase under plausible future cli-
mate scenarios (Wetherald and Manabe 2002), dependent
upon climate sensitivity, with large regional changes in the
water cycle. The potential for more droughts and of greater
severity is a worrisome possibility (Gregory et al. 1997;
Wetherald and Manabe 1999; Wang 2005), compounded
by positive feedbacks, such as increases in the frequency of
heat waves (Seneviratne et al. 2006a, b) and decreased
carbon uptake by vegetation (Ciais et al. 2005).
Several studies using climate models have suggested
that the interior of the northern hemisphere continents will
become drier over the next century, especially in the
summer (Rind et al 1990; Gregory et al. 1997; Wetherald
and Manabe 1995, 1999, 2002). Gregory et al. (1997)
analyzed summer drought over southern Europe and cen-
tral North America in terms of precipitation and soil
moisture from a single integration of the Hadley climate
model forced by 1% year-1 increasing CO2 concentrations.
They found increases in multivariate drought statistics that
were driven primarily by evaporation through increased
temperatures but also decreased precipitation in the form of
fewer events. Wetherald and Manabe (1999) analyzed soil
moisture from the GFDL climate model for three scenarios:
increasing greenhouse gases, increasing sulphate–aerosol
and combination of both. They similarly found summer
dryness and winter wetness in North America and southern
Europe as well as other semi-arid regions, although high
latitudes showed increasing wetness. Based on a threshold
of one standard deviation, changes in soil moisture did not
become detectable for several decades. In summarizing
such studies, the third Intergovernmental Panel on Climate
Change (IPCC) report (IPCC 2001) concluded that
increased drought risk over these regions was ‘‘likely’’.
More recently, Giorgi (2006) analyzed a set of IPCC 4th
Assessment Report (AR4) simulations and calculated a
climate change index based on changes in precipitation and
temperatures means and variability. He found major cli-
mate change ‘‘hot-spots’’ in the Mediterranean and
Northern Europe, followed by high northern latitudes and
Central America. Other hot-spots occur in Southern
Equatorial Africa, the Sahara and eastern North America.
Wang (2005) analyzed a large set of IPCC AR4 models in
terms of consensus changes in precipitation, temperature
and soil moisture and found inter-model consistency in
some regions of northern mid- and high-latitudes in pre-
dicting summer dryness and winter wetness. In terms of
drought, Burke et al. (2006) calculated the Palmer Drought
Severity Index (PDSI), a commonly used drought index,
from the latest version for the Hadley centre climate model
for the SRES A2 scenario and found regionally strong
wetting and drying, but a net global drying trend resulting
in an increase in the area of extreme drought from 1 to 30%
by end of this century. The conclusion of the latest IPCC
report (IPCC 2007, Chap. 10, p. 783) was that ‘‘In a war-
mer future climate, most Atmosphere–Ocean General
Circulation Models project increased summer dryness and
winter wetness in most parts of the northern middle and
high latitudes. Summer dryness indicates a greater risk of
drought.’’
80 J. Sheffield, E. F. Wood: Projected changes in drought occurrence under future global warming
123
The consensus from these and other studies into the
hydrologic impacts of future warming and the synthesis
conclusions of the past two IPCC reports point towards a
greater risk of drought during the twenty-first century. In
this paper we investigate how drought is expected to change
in the future by analyzing soil moisture and drought char-
acteristics over global land areas, excluding Antarctica,
from a suite of climate model simulations carried out under
the auspices of the IPCC AR4. We quantify the change in
global and regional drought occurrence relative to both the
present day and the pre-industrial era, as represented by
twentieth century and pre-industrial control simulations,
respectively. We take into account the uncertainty in
regional climate change by using data from multiple climate
models and for three future climate scenarios that represent
a range of plausible emission pathways.
Although global warming is expected to accelerate the
hydrologic cycle and thus the occurrence and severity of
drought, the changes may not become detectable for several
decades (Wetherald and Manabe 1999). The detectability of
climate change can be quantified by how long we have to
monitor for to detect significant changes against the back-
ground of natural variability, which is basically a signal to
noise problem (McCabe and Wolock 1997; Zheng and
Basher 1999; Ziegler et al. 2003). The greater the variability,
the harder it is to detect a signal. We use this concept to
evaluate the detectability of potential future changes by
applying statistical analyzes to time series of drought
occurrence to determine when and where changes will
become detectable. Detectability is a function of the natural
variability of the system, the magnitude of the change we are
interested in and the level of risk we are prepared to accept in
statistical testing, among others factors, and we carry out a
set of sensitivity experiments to evaluate their impact.
This study is the first that we are aware of that analyzes
potential changes in drought under future global warming,
as characterized by persistence in severe soil moisture
deficits, from multiple models and scenarios. Previous
studies have assessed predicted changes in mean climate
and specifically soil moisture (Wetherald and Manabe
2002; Wang 2005) that will likely (but not necessarily)
induce changes in drought. Here, we take into consider-
ation changes in the full distribution of pertinent variables
and not just the mean or some other tendency measure.
Furthermore, we analyze actual model output as opposed to
derived products such as the PDSI that may suffer from
inadequacies, which will enhance uncertainty in the results.
In terms of models and scenarios analyzed, previous
studies have focused on single models and/or single sce-
narios (e.g., Wetherald and Manabe 2002; Wang 2005;
Burke et al. 2006). To instil confidence in the robustness of
assessment of future change, it must take into account the
uncertainty in future climates because of model differences
as well as the diversity of possible emission pathways as
represented by the different scenarios. Nevertheless,
uncertainties are inherent in this study, such as biases
induced by the specific models and approaches we take and
we highlight these where relevant.
The paper is laid out as follows. After presenting the
datasets and methods we briefly evaluate how well the
models represent drought during the twentieth century
against off-line estimates. This is critical to our confidence in
the models to project future changes. We then show how
drought is expected to change over the twenty-first century
for the three future climate scenarios, globally and region-
ally, and where these changes are statistically significant
relative to contemporary climate variability as derived from
twentieth century simulations. Mechanisms for the expected
changes are presented next, that show how changes in
evaporation, as forced by increasing temperatures, modify
the primary impacts of precipitation changes and how this
can be altered by changes in snow at higher latitudes. In Sect.
4 we investigate the detectability of these changes and how
this depends on the time period, drought characteristic, level
of significance and background variability against which the
change is quantified. This section also looks at how drought
detectability compares to that for other hydro-climatic
variables and whether we are likely to detect changes in
extremes, such as drought, earlier than changes in the mean
of primary climate variables, such as annual precipitation.
2 Datasets and methods
2.1 Climate model simulations
To estimate potential future climate change we use data
from the IPCC AR4 General Circulation Model (GCM)
simulations. The range of future climates predicted by
GCMs is large and regionally dependent (NRC 2003;
Giorgi and Bi 2005) and we therefore use data from mul-
tiple GCMs and three scenarios: the Special Report on
Emissions Scenarios (SRES) A2, A1B and B1
(Nakicenovic et al. 2000). Each scenario represents dif-
ferent mixes of changes in population, economic output,
land use, and energy and technology use, among others, but
can be generally characterized by maximum atmospheric
CO2 concentrations. B1 represents relatively slow popula-
tion growth and an emphasis on environmental protection,
with CO2 concentrations stabilized at 550 ppm by the end
of the century. A1B describes a future of very rapid eco-
nomic growth, global population that peaks in mid-century
and declines thereafter, and the rapid introduction of new
and more efficient technologies with a balance between
fossil and non-fossil energy sources and is characterized by
maximum concentrations of 720 ppm. A2 describes a
J. Sheffield, E. F. Wood: Projected changes in drought occurrence under future global warming 81
123
heterogeneous world with continuously increasing global
population and regionally orientated economic develop-
ment and fragmented technological change and is generally
regarded as a worst-case scenario that sees a four to five-
fold increase in CO2 emissions over 2000–2099 during
which CO2 concentrations increase from about 350 to
850 ppm. We also use data from the corresponding pre-
industrial control (PICNTRL) and twentieth century sim-
ulations (20C3M), which were also run in coupled mode,
i.e., with a free-running ocean component. The 20C3M
simulations are driven by prescribed historical greenhouse
gas concentrations, sulphate-aerosol loadings and other
forcings since the start of the industrial revolution. We use
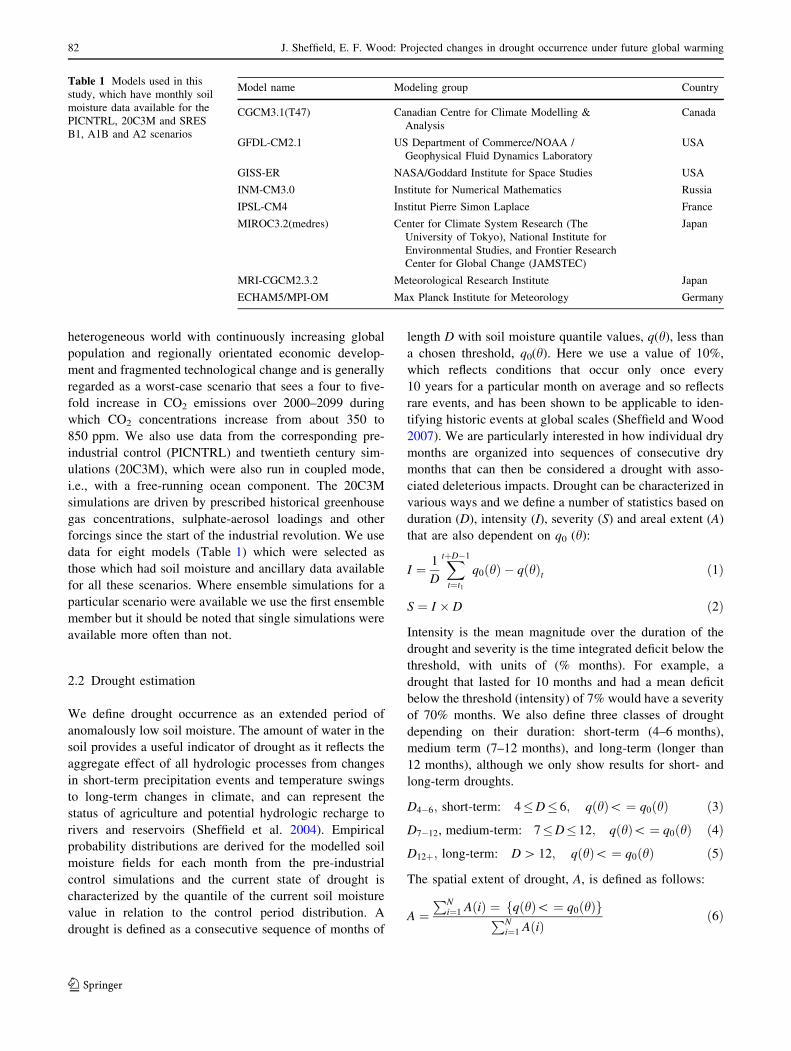
data for eight models (Table 1) which were selected as
those which had soil moisture and ancillary data available
for all these scenarios. Where ensemble simulations for a
particular scenario were available we use the first ensemble
member but it should be noted that single simulations were
available more often than not.
2.2 Drought estimation
We define drought occurrence as an extended period of
anomalously low soil moisture. The amount of water in the
soil provides a useful indicator of drought as it reflects the
aggregate effect of all hydrologic processes from changes
in short-term precipitation events and temperature swings
to long-term changes in climate, and can represent the
status of agriculture and potential hydrologic recharge to
rivers and reservoirs (Sheffield et al. 2004). Empirical
probability distributions are derived for the modelled soil
moisture fields for each month from the pre-industrial
control simulations and the current state of drought is
characterized by the quantile of the current soil moisture
value in relation to the control period distribution. A
drought is defined as a consecutive sequence of months of
length D with soil moisture quantile values, q(h), less than
a chosen threshold, q0(h). Here we use a value of 10%,
which reflects conditions that occur only once every
10 years for a particular month on average and so reflects
rare events, and has been shown to be applicable to iden-
tifying historic events at global scales (Sheffield and Wood
2007). We are particularly interested in how individual dry
months are organized into sequences of consecutive dry
months that can then be considered a drought with asso-
ciated deleterious impacts. Drought can be characterized in
various ways and we define a number of statistics based on
duration (D), intensity (I), severity (S) and areal extent (A)
that are also dependent on q0 (h):
I ¼ 1
D
XtþD�1
t¼t1
q0ðhÞ � qðhÞt ð1Þ
S ¼ I � D ð2Þ
Intensity is the mean magnitude over the duration of the
drought and severity is the time integrated deficit below the
threshold, with units of (% months). For example, a
drought that lasted for 10 months and had a mean deficit
below the threshold (intensity) of 7% would have a severity
of 70% months. We also define three classes of drought
depending on their duration: short-term (4–6 months),
medium term (7–12 months), and long-term (longer than
12 months), although we only show results for short- and
long-term droughts.
D4�6; short-term: 4�D� 6; qðhÞ\ ¼ q0ðhÞ ð3ÞD7�12, medium-term: 7�D� 12; qðhÞ\ ¼ q0ðhÞ ð4ÞD12þ; long-term: D [ 12; qðhÞ\ ¼ q0ðhÞ ð5Þ
The spatial extent of drought, A, is defined as follows:
A ¼PN
i¼1 AðiÞ ¼ qðhÞ\ ¼ q0ðhÞgfPN
i¼1 AðiÞð6Þ
Table 1 Models used in this
study, which have monthly soil
moisture data available for the
PICNTRL, 20C3M and SRES
B1, A1B and A2 scenarios
Model name Modeling group Country
CGCM3.1(T47) Canadian Centre for Climate Modelling &
Analysis
Canada
GFDL-CM2.1 US Department of Commerce/NOAA /
Geophysical Fluid Dynamics Laboratory
USA
GISS-ER NASA/Goddard Institute for Space Studies USA
INM-CM3.0 Institute for Numerical Mathematics Russia
IPSL-CM4 Institut Pierre Simon Laplace France
MIROC3.2(medres) Center for Climate System Research (The
University of Tokyo), National Institute for
Environmental Studies, and Frontier Research
Center for Global Change (JAMSTEC)
Japan
MRI-CGCM2.3.2 Meteorological Research Institute Japan
ECHAM5/MPI-OM Max Planck Institute for Meteorology Germany
82 J. Sheffield, E. F. Wood: Projected changes in drought occurrence under future global warming
123
where A(i) is the area of grid cell i weighted by the cosine
of the grid cell latitude and N is the total number of grid
cells in the region of interest.
2.3 Statistical methods
Changes in the occurrence of drought are calculated
between the PICNTRL and 20C3M and future climate
simulations, although we focus mainly on changes relative
to the 20C3M data. The pre-industrial PICNTRL simula-
tions are used to represent natural variability; the 20C3M
simulations are used to represent present day drought
conditions under contemporary climate. Changes are esti-
mated for the ensemble of climate models to take into
account the uncertainty due to model differences. We also
investigate changes for a single model in Sect. 4.5 using
multiple ensemble members from the same model, where
uncertainty in the representation of climate is based on
intra-ensemble differences rather than inter-model differ-
ences. In both cases, for each model or ensemble member,
we calculated the frequency of drought and other statistics
in 30-year periods. For the 20C3M simulation this was
done for the period 1961–1990, assuming this to be rep-
resentative of contemporary climate. For the future climate
simulations we calculated statistics over a 30-year moving
window. For the PICNTRL simulation, statistics were
calculated for each non-overlapping, consecutive 30-year
period. To account for the differences in the PICNTRL
simulation length among models, which would bias the
results of the multi-model assessment towards a model
with a longer simulation, we simply averaged the values in
each 30-year period over the whole simulation for each
model.
Changes in drought are identified by testing the null
hypothesis that the distribution of a drought statistic across
all models has the same mean as the distribution across all
models during a future time period. Student’s t test statistic,
which is a measure of the ratio of the difference in means to
the combined variance of the two distributions, is calculated
at each grid cell and the null hypothesis is rejected for t-test
values greater than the critical value at confidence level a(usually taken as 0.05 or 95%). In this case we conclude that
a statistically significant change has occurred. Application
of the test assumes that the means of the two samples do not
deviate substantially from a normal distribution.
2.4 Data preparation
We focus on monthly values for all calculations, which is
the smallest time scale for which data are available for the
complete period of each simulation from the IPCC data-
base. Monthly values of soil moisture for each model are
available as depths of water and are normalized to volu-
metric values by dividing by the field capacity, which is
given for each model as a fixed field. This ensures that the
soil moisture data for each model are analyzed with respect
to their dynamic range as governed by soil characteristics
and meteorological conditions, and are thus inter-compa-
rable. The volumetric data are then interpolated from each
model’s native grid to a 2.0-deg regular grid, which is a
representative scale across the set of models. Ancillary
variables (e.g., precipitation) that are used in subsequent
analysis of drought forcing are interpolated in the same
manner.
3 Results
First, we evaluate the representation of drought in the cli-
mate models by considering (1) the natural occurrence of
drought as derived from the control simulations and (2)
drought under contemporary climate from the twentieth
century simulations. In Sect. 3.2 we compare the twentieth
century results with observation-based data to determine
whether the models are capable of reproducing our best
estimates of large-scale contemporary drought occurrence.
Sections 3.3–3.5 present the projected future changes in
drought, their statistical significance relative to contem-
porary climate (as estimated from 1961 to 1990 of the
20C3M data) and natural variability (as estimated from the
PICNTRL data), and the driving mechanisms of change.
3.1 Natural variability of drought from GCM control
simulations
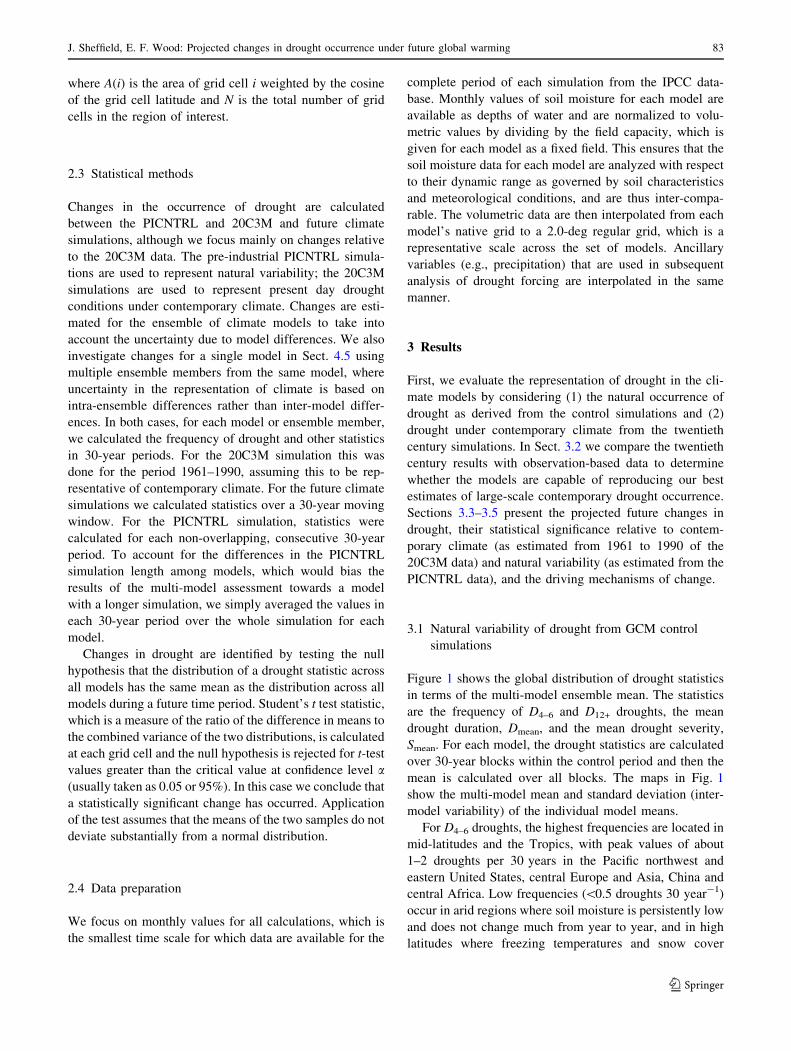
Figure 1 shows the global distribution of drought statistics
in terms of the multi-model ensemble mean. The statistics
are the frequency of D4–6 and D12+ droughts, the mean
drought duration, Dmean, and the mean drought severity,
Smean. For each model, the drought statistics are calculated
over 30-year blocks within the control period and then the
mean is calculated over all blocks. The maps in Fig. 1
show the multi-model mean and standard deviation (inter-
model variability) of the individual model means.
For D4–6 droughts, the highest frequencies are located in
mid-latitudes and the Tropics, with peak values of about
1–2 droughts per 30 years in the Pacific northwest and
eastern United States, central Europe and Asia, China and
central Africa. Low frequencies (\0.5 droughts 30 year-1)
occur in arid regions where soil moisture is persistently low
and does not change much from year to year, and in high
latitudes where freezing temperatures and snow cover
J. Sheffield, E. F. Wood: Projected changes in drought occurrence under future global warming 83
123
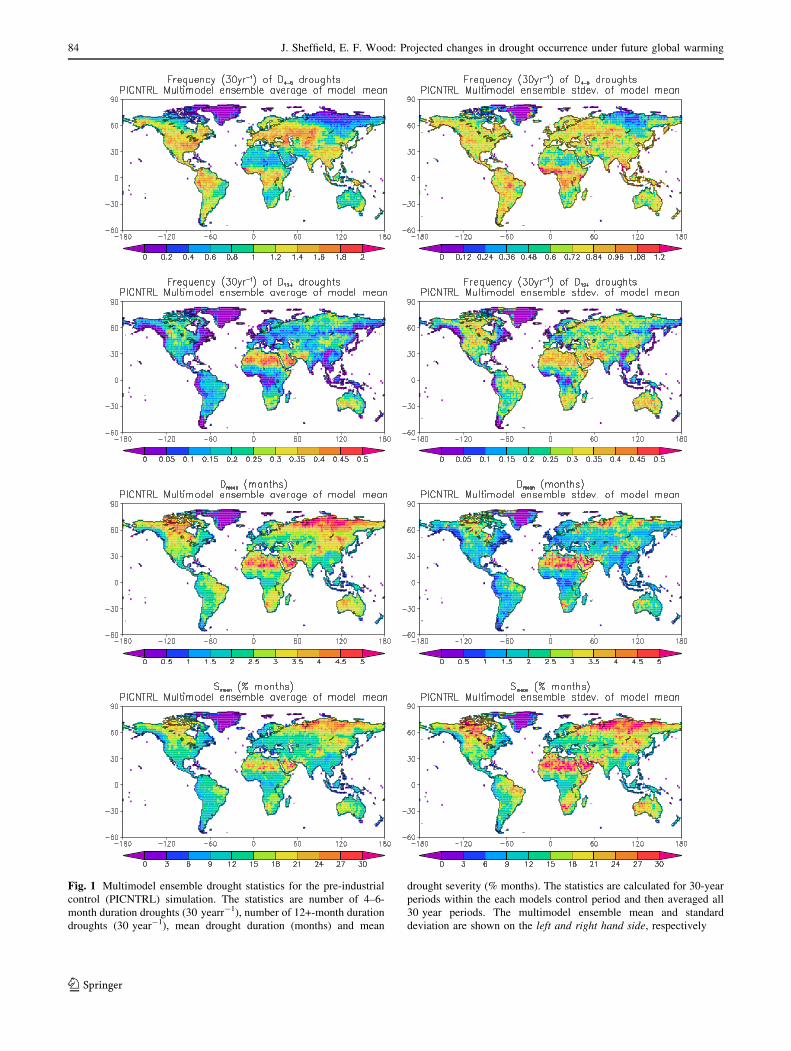
Fig. 1 Multimodel ensemble drought statistics for the pre-industrial
control (PICNTRL) simulation. The statistics are number of 4–6-
month duration droughts (30 yearr-1), number of 12+-month duration
droughts (30 year-1), mean drought duration (months) and mean
drought severity (% months). The statistics are calculated for 30-year
periods within the each models control period and then averaged all
30 year periods. The multimodel ensemble mean and standard
deviation are shown on the left and right hand side, respectively
84 J. Sheffield, E. F. Wood: Projected changes in drought occurrence under future global warming
123
prolong soil moisture anomalies (Wang 2005; Sheffield and
Wood 2007). The standard deviation or inter-model vari-
ability is largest in regions of high seasonality, such as the
edges of the footprint of the Inter Tropical Convergence
Zone (ITCZ) in Africa and lowest in dry regions and high
latitudes.
The distribution of D12+ frequencies is generally the
opposite of that for short-term droughts, with maxima in
central and northern North America, eastern south Amer-
ica, Siberia, and eastern Asia among others. High values
are also prevalent in dry regions although as the range in
soil moisture is so small, the absolute magnitude of drought
is also very small. Minima are mostly located in regions
with more seasonally uniform climates such as central
tropical Africa, parts of southeast Asia and the eastern and
Pacific northwest coasts of North America. The standard
deviation values are also at a maximum in high latitudes
and globally are relatively high compared with the mean,
possibly indicating a lack of consensus across models in
how drought varies on longer time scales. Mean drought
duration and severity are similarly distributed being that
severity is dominated by drought duration at low threshold
values. Mean drought duration is at a maximum in high
latitudes, central North America, Brazil, southern Africa
and Australia.
3.2 Twentieth century drought and comparison with
off-line modeling
Comparison of soil moisture data from the IPCC AR4
20C3M simulations with field measurements have been
carried out by Li et al. (2007) over small regions in the
Northern Hemisphere based on the database of Robock
et al. (2000). They found that the models simulated the
seasonal cycles for Ukraine, Russia, and Illinois ade-
quately, but were generally poor for Mongolia and China.
Importantly, all models failed to replicate observed sum-
mer drying in Russia and the Ukraine during the latter part
of the twentieth century. Here we are interested in the
large-scale, long-term statistics of drought as characterized
by persistent soil moisture deficits. A comparison of glo-
bal and regional averaged drought characteristics from the
20C3M simulations with observation-based estimates is
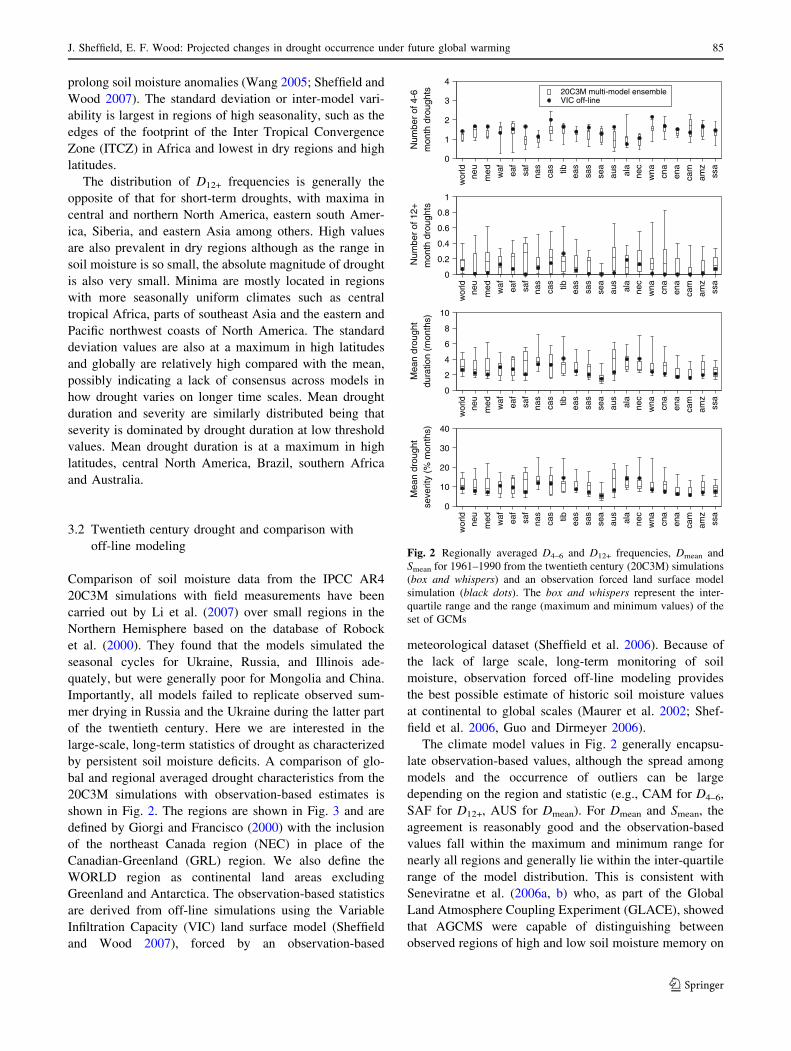
shown in Fig. 2. The regions are shown in Fig. 3 and are
defined by Giorgi and Francisco (2000) with the inclusion
of the northeast Canada region (NEC) in place of the
Canadian-Greenland (GRL) region. We also define the
WORLD region as continental land areas excluding
Greenland and Antarctica. The observation-based statistics
are derived from off-line simulations using the Variable
Infiltration Capacity (VIC) land surface model (Sheffield
and Wood 2007), forced by an observation-based
meteorological dataset (Sheffield et al. 2006). Because of
the lack of large scale, long-term monitoring of soil
moisture, observation forced off-line modeling provides
the best possible estimate of historic soil moisture values
at continental to global scales (Maurer et al. 2002; Shef-
field et al. 2006, Guo and Dirmeyer 2006).
The climate model values in Fig. 2 generally encapsu-
late observation-based values, although the spread among
models and the occurrence of outliers can be large
depending on the region and statistic (e.g., CAM for D4–6,
SAF for D12+, AUS for Dmean). For Dmean and Smean, the
agreement is reasonably good and the observation-based
values fall within the maximum and minimum range for
nearly all regions and generally lie within the inter-quartile
range of the model distribution. This is consistent with
Seneviratne et al. (2006a, b) who, as part of the Global
Land Atmosphere Coupling Experiment (GLACE), showed
that AGCMS were capable of distinguishing between
observed regions of high and low soil moisture memory on
wor
ldne
u
med waf eaf
saf
nas
cas tib eas
sas
sea
aus
ala
nec
wna cna
ena
cam
amz
ssa
0
1
2
3
4
Num
ber
of 4
-6m
onth
dro
ught
s 20C3M multi-model ensembleVIC off-line
wor
ldne
u
med waf ea
f
saf
nas
cas tib eas
sas
sea
aus
ala
nec
wna cna
ena
cam
amz
ssa
0
0.2
0.4
0.6
0.8
1
Num
ber
of 1
2+m
onth
dro
ught
s
wor
ldne
u
med waf eaf
saf
nas
cas tib eas
sas
sea
aus
ala
nec
wna cna
ena
cam
amz
ssa
0
2
4
6
8
10
M
ean
drou
ght
dura
tion
(mon
ths)
wor
ldne
u
med waf eaf
saf
nas
cas tib eas
sas
sea
aus
ala
nec
wna cna
ena
cam
amz
ssa
0
10
20
30
40
M
ean
drou
ght
seve
rity
(% m
onth
s)
Fig. 2 Regionally averaged D4–6 and D12+ frequencies, Dmean and
Smean for 1961–1990 from the twentieth century (20C3M) simulations
(box and whispers) and an observation forced land surface model
simulation (black dots). The box and whispers represent the inter-
quartile range and the range (maximum and minimum values) of the
set of GCMs
J. Sheffield, E. F. Wood: Projected changes in drought occurrence under future global warming 85
123
monthly time scales. For the most part, the climate model
values tend to be higher, most notably for D12+ frequencies,
Dmean and Smean, although for the former this is a result, in
part, of the zero lower bound in most regions. The general
overestimation by the models of long-term drought fre-
quencies and mean drought duration points to an
underestimation of climate variability that has been noted
previously (e.g., Collins et al. 2002; Hunt 2006).
3.3 Global and regional drought under future climate
scenarios
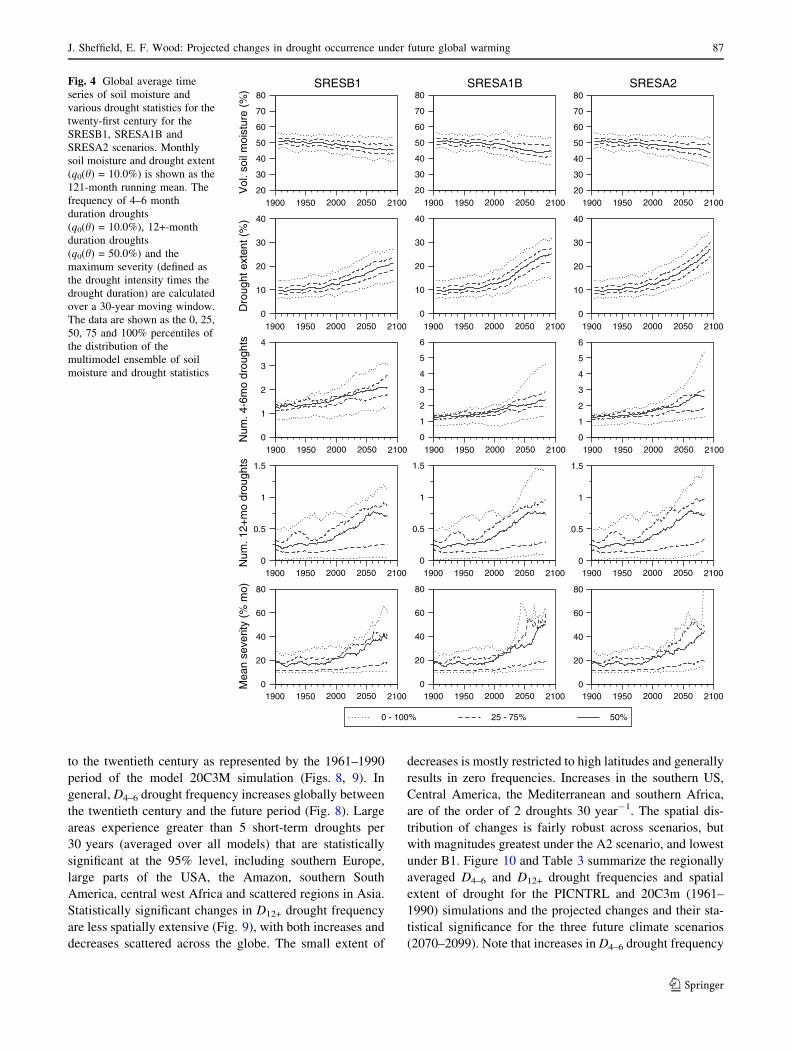
Next we investigate how soil moisture and drought are
predicted to change under future climates. Global aver-
aged time series of monthly mean soil moisture and
drought characteristics for the three future climate sce-
narios are shown in Fig. 4. For these models, the future
climate simulations were initialized from the end of the
20C3M simulation and we prepend these data (in terms of
the multi-model distribution) to the future scenario time
series. Globally, soil moisture decreases under all sce-
narios, with corresponding increases in drought spatial
extent. Note that the spatial extent of drought may not be
contiguous which is more likely for larger regions. Cor-
responding changes in drought statistics (frequency of D4–
6 and D12+ droughts and Smean) are all increasing. In
general, the increases in drought statistics are greatest
under the higher emissions scenario, A2, and least under
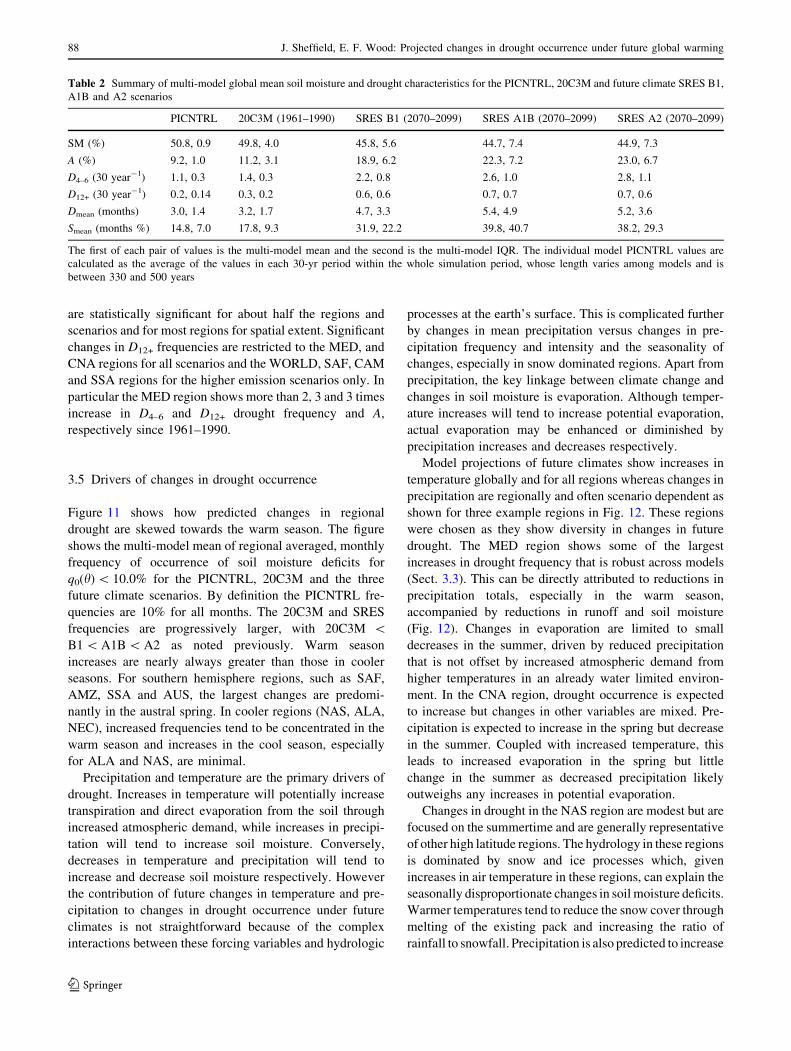
the lower emissions scenario, B1 (Table 2). The global
spatial extent of drought across all models roughly dou-
bles by 2070–2099 under all scenarios relative to the
PICNTRL and 20C3M scenarios. The frequency of D4–6
droughts also doubles and D12+ droughts become two and
three times more frequent relative to the PICNTRL and
20C3M scenarios, respectively. The spread in model
projections as quantified by the inter-quartile range (IQR)
is, however, fairly large, even at the beginning of the
twenty-first century (also noted previously in the twenti-
eth century comparisons in Sect. 3.2) and this increases
by the end of the century, such that the lower bound on
projections shows little change over the century, although
these are invariably increases.
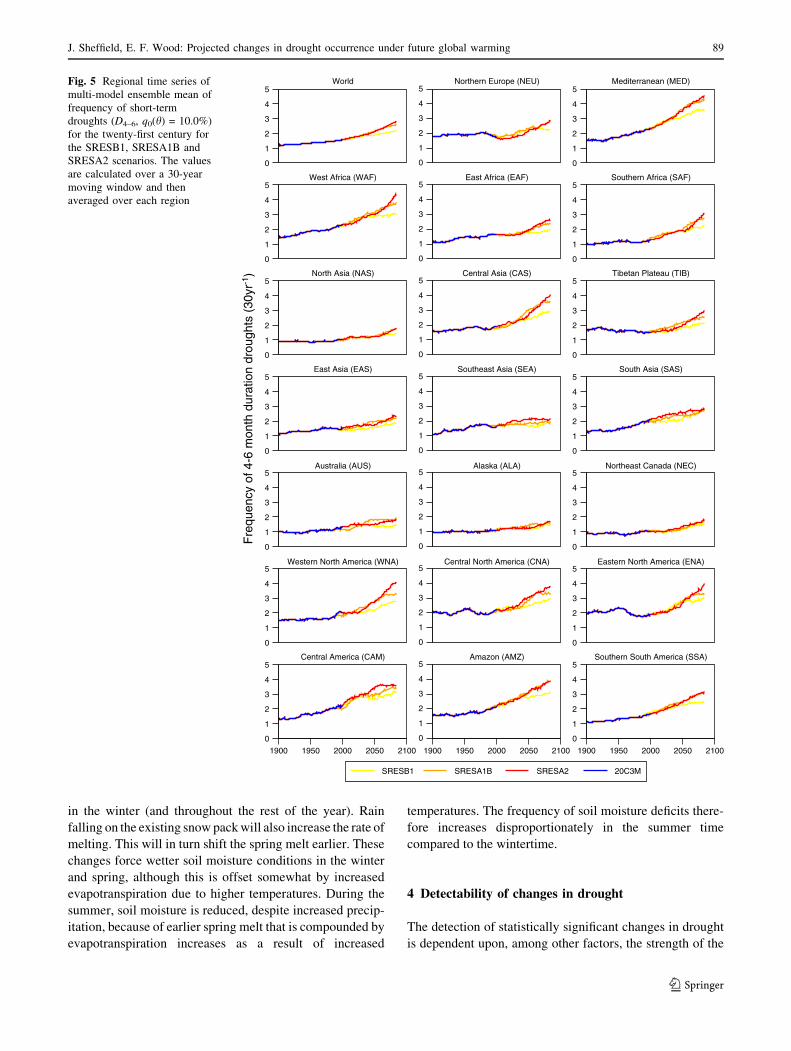
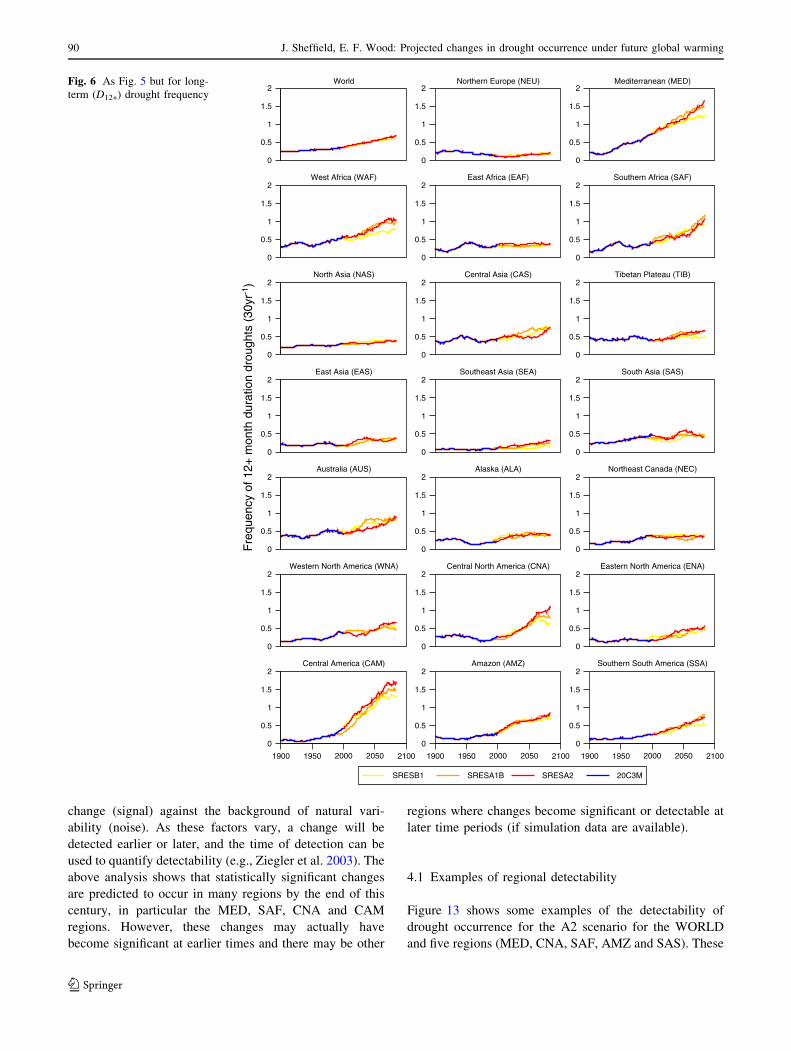
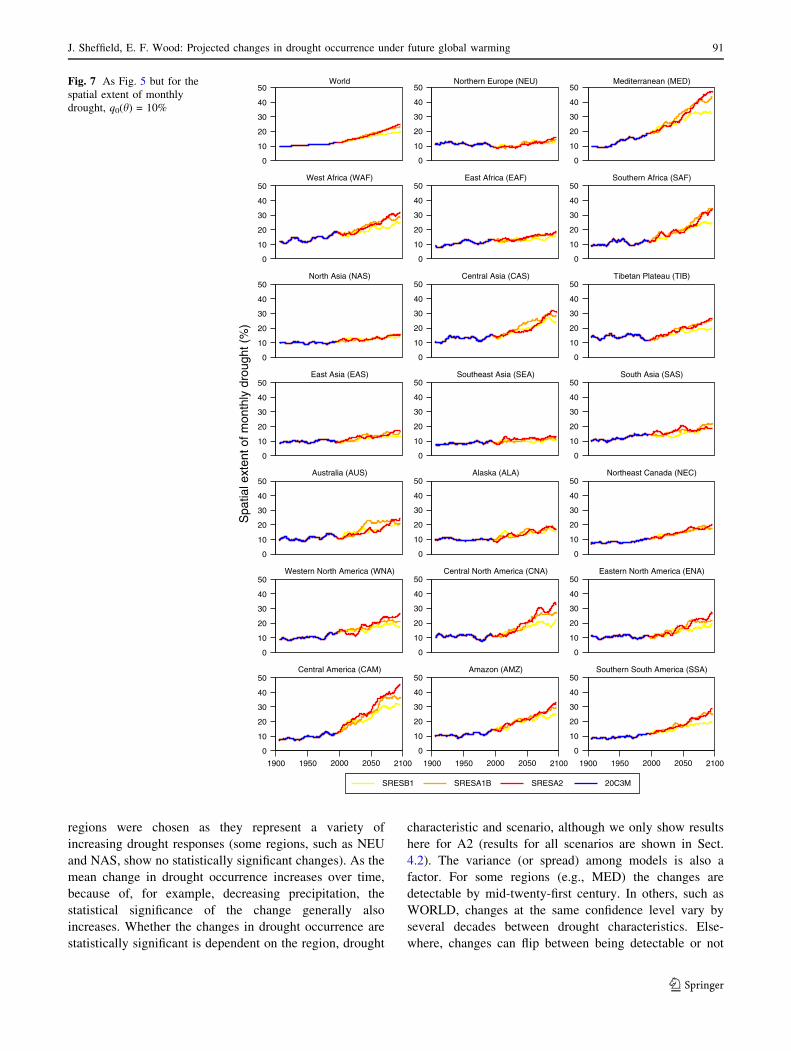
Figures 5, 6 and 7 show the multi-model mean,
regionally averaged time series of D4–6 and D12+ frequen-
cies and A. Similar to the global results, most regions show
increases in drought statistics, but with large variation
between regions and across scenarios. In particular, the
MED, WAF, CAS and CAM regions show large increases,
most notably for D12+ frequencies. The mid-latitude North
American regions (WNA, CNA, ENA) also show increases
but with larger variation between scenarios. Changes over
high latitudes (ALA, NEC, NEU, NAS), eastern mid-
latitude Asia (EAS, TIB) and regions bordering the Indian
Ocean (EAF, SAS, SEA) are relatively small. The fre-
quency of D12+ droughts actually decreases in NEU. Again,
changes under the B1 scenario are the least and the A1B
and A2 results are similar.
3.4 Statistical significance of changes
We next evaluated the statistical significance of changes in
drought by the end of the twenty-first century with respect
Fig. 3 Map of regions used in the analysis as defined by Giorgi and Francisco (2000). The original GRL region is split into northeastern Canada
(NEC) and Greenland for this study
86 J. Sheffield, E. F. Wood: Projected changes in drought occurrence under future global warming
123
to the twentieth century as represented by the 1961–1990
period of the model 20C3M simulation (Figs. 8, 9). In
general, D4–6 drought frequency increases globally between
the twentieth century and the future period (Fig. 8). Large
areas experience greater than 5 short-term droughts per
30 years (averaged over all models) that are statistically
significant at the 95% level, including southern Europe,
large parts of the USA, the Amazon, southern South
America, central west Africa and scattered regions in Asia.
Statistically significant changes in D12+ drought frequency
are less spatially extensive (Fig. 9), with both increases and
decreases scattered across the globe. The small extent of
decreases is mostly restricted to high latitudes and generally
results in zero frequencies. Increases in the southern US,
Central America, the Mediterranean and southern Africa,
are of the order of 2 droughts 30 year-1. The spatial dis-
tribution of changes is fairly robust across scenarios, but
with magnitudes greatest under the A2 scenario, and lowest
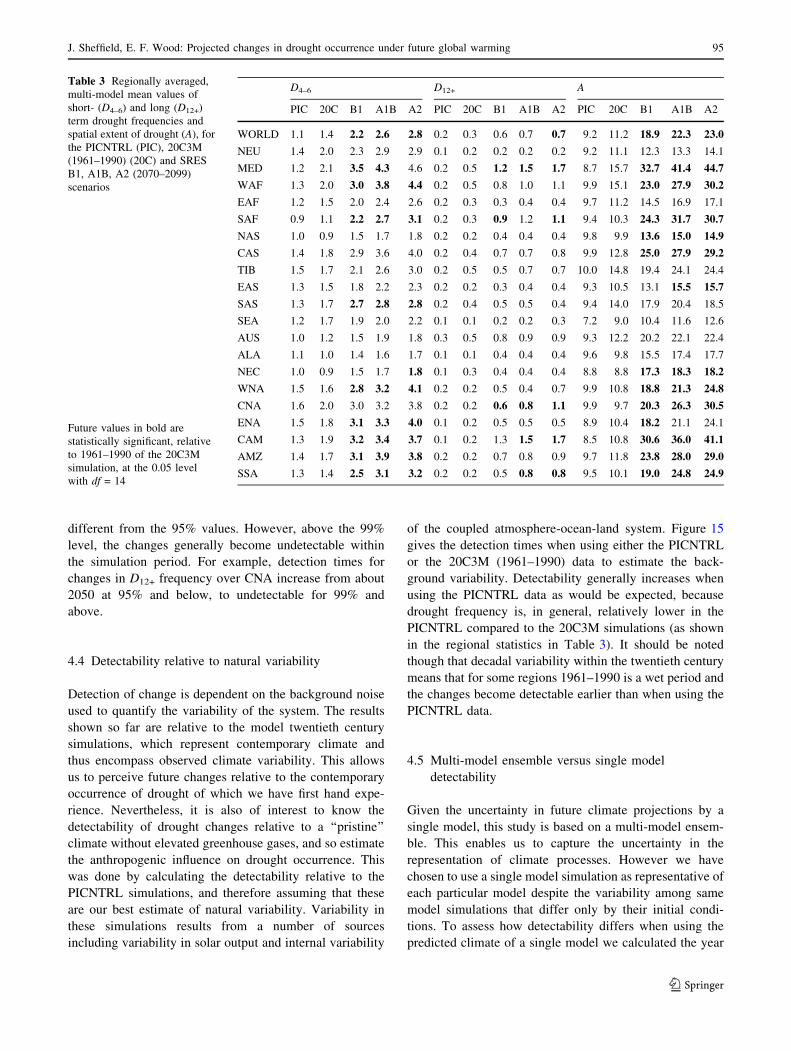
under B1. Figure 10 and Table 3 summarize the regionally
averaged D4–6 and D12+ drought frequencies and spatial
extent of drought for the PICNTRL and 20C3m (1961–
1990) simulations and the projected changes and their sta-
tistical significance for the three future climate scenarios
(2070–2099). Note that increases in D4–6 drought frequency
1900 1950 2000 2050 210020
30
40
50
60
70
80
Vol
. soi
l moi
stur
e (%
)
SRESB1
1900 1950 2000 2050 210020
30
40
50
60
70
80SRESA1B
1900 1950 2000 2050 210020
30
40
50
60
70
80SRESA2
1900 1950 2000 2050 2100
0
10
20
30
40
Dro
ught
ext
ent (
%)
1900 1950 2000 2050 2100
0
10
20
30
40
1900 1950 2000 2050 21000
10
20
30
40
1900 1950 2000 2050 21000
1
2
3
4
Num
. 4-6
mo
drou
ghts
1900 1950 2000 2050 2100
0
1
2
3
4
5
6
1900 1950 2000 2050 21000
1
2
3
4
5
6
1900 1950 2000 2050 21000
0.5
1
1.5
Num
. 12+
mo
drou
ghts
1900 1950 2000 2050 21000
0.5
1
1.5
1900 1950 2000 2050 21000
0.5
1
1.5
1900 1950 2000 2050 21000
20
40
60
80
Mea
n se
verit
y (%
mo)
1900 1950 2000 2050 21000
20
40
60
80
1900 1950 2000 2050 21000
20
40
60
80
0 - 100% 25 - 75% 50%
Fig. 4 Global average time
series of soil moisture and
various drought statistics for the
twenty-first century for the
SRESB1, SRESA1B and
SRESA2 scenarios. Monthly
soil moisture and drought extent
(q0(h) = 10.0%) is shown as the
121-month running mean. The
frequency of 4–6 month
duration droughts
(q0(h) = 10.0%), 12+-month
duration droughts
(q0(h) = 50.0%) and the
maximum severity (defined as
the drought intensity times the
drought duration) are calculated
over a 30-year moving window.
The data are shown as the 0, 25,
50, 75 and 100% percentiles of
the distribution of the
multimodel ensemble of soil
moisture and drought statistics
J. Sheffield, E. F. Wood: Projected changes in drought occurrence under future global warming 87
123
are statistically significant for about half the regions and
scenarios and for most regions for spatial extent. Significant
changes in D12+ frequencies are restricted to the MED, and
CNA regions for all scenarios and the WORLD, SAF, CAM
and SSA regions for the higher emission scenarios only. In
particular the MED region shows more than 2, 3 and 3 times
increase in D4–6 and D12+ drought frequency and A,
respectively since 1961–1990.
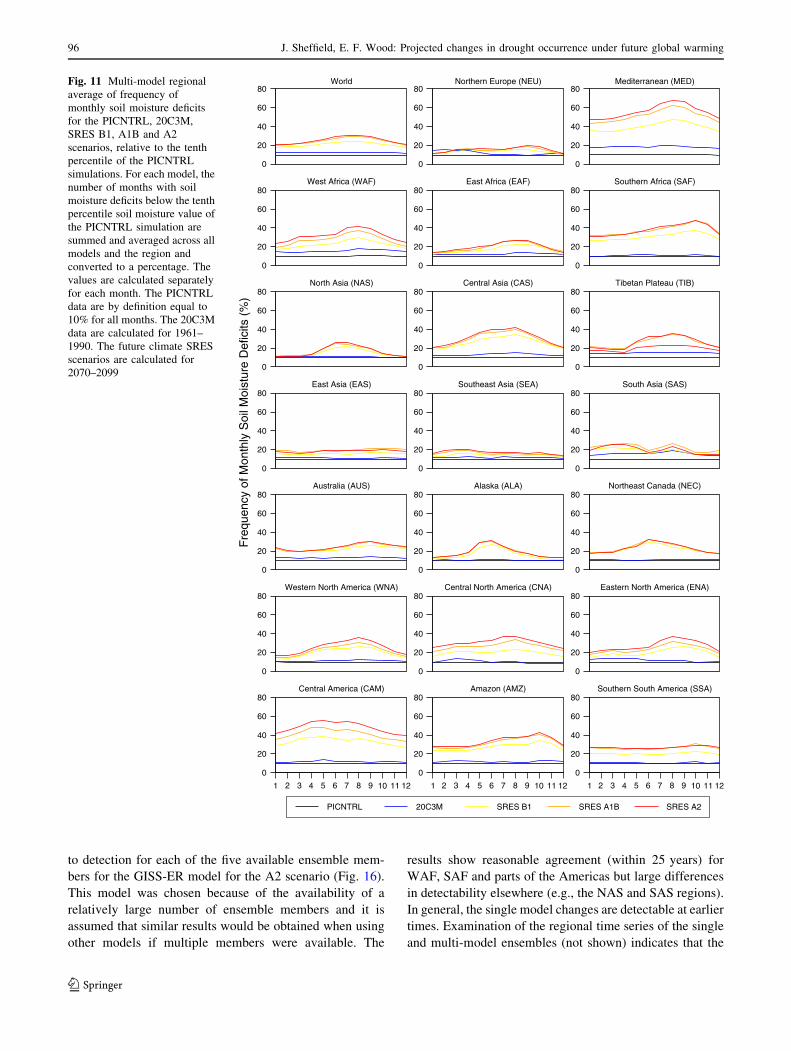
3.5 Drivers of changes in drought occurrence
Figure 11 shows how predicted changes in regional
drought are skewed towards the warm season. The figure
shows the multi-model mean of regional averaged, monthly
frequency of occurrence of soil moisture deficits for
q0(h) \ 10.0% for the PICNTRL, 20C3M and the three
future climate scenarios. By definition the PICNTRL fre-
quencies are 10% for all months. The 20C3M and SRES
frequencies are progressively larger, with 20C3M \B1 \ A1B \ A2 as noted previously. Warm season
increases are nearly always greater than those in cooler
seasons. For southern hemisphere regions, such as SAF,
AMZ, SSA and AUS, the largest changes are predomi-
nantly in the austral spring. In cooler regions (NAS, ALA,
NEC), increased frequencies tend to be concentrated in the
warm season and increases in the cool season, especially
for ALA and NAS, are minimal.
Precipitation and temperature are the primary drivers of
drought. Increases in temperature will potentially increase
transpiration and direct evaporation from the soil through
increased atmospheric demand, while increases in precipi-
tation will tend to increase soil moisture. Conversely,
decreases in temperature and precipitation will tend to
increase and decrease soil moisture respectively. However
the contribution of future changes in temperature and pre-
cipitation to changes in drought occurrence under future
climates is not straightforward because of the complex
interactions between these forcing variables and hydrologic
processes at the earth’s surface. This is complicated further
by changes in mean precipitation versus changes in pre-
cipitation frequency and intensity and the seasonality of
changes, especially in snow dominated regions. Apart from
precipitation, the key linkage between climate change and
changes in soil moisture is evaporation. Although temper-
ature increases will tend to increase potential evaporation,
actual evaporation may be enhanced or diminished by
precipitation increases and decreases respectively.
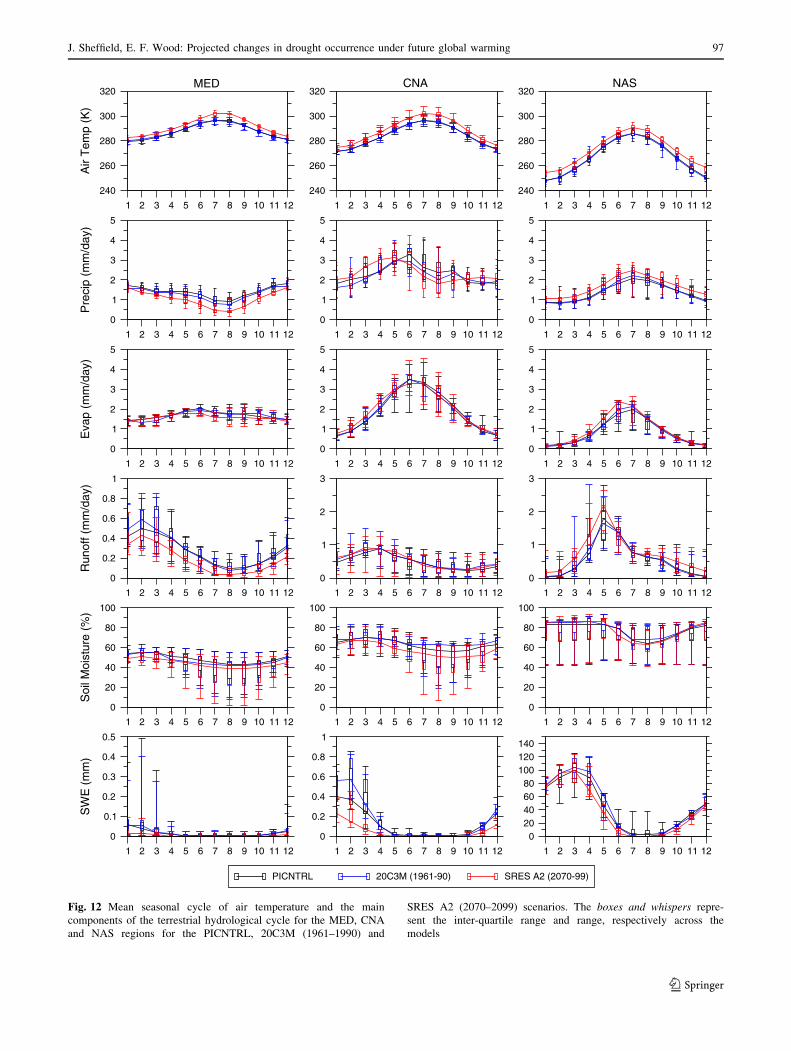
Model projections of future climates show increases in
temperature globally and for all regions whereas changes in
precipitation are regionally and often scenario dependent as
shown for three example regions in Fig. 12. These regions
were chosen as they show diversity in changes in future
drought. The MED region shows some of the largest
increases in drought frequency that is robust across models
(Sect. 3.3). This can be directly attributed to reductions in
precipitation totals, especially in the warm season,
accompanied by reductions in runoff and soil moisture
(Fig. 12). Changes in evaporation are limited to small
decreases in the summer, driven by reduced precipitation
that is not offset by increased atmospheric demand from
higher temperatures in an already water limited environ-
ment. In the CNA region, drought occurrence is expected
to increase but changes in other variables are mixed. Pre-
cipitation is expected to increase in the spring but decrease
in the summer. Coupled with increased temperature, this
leads to increased evaporation in the spring but little
change in the summer as decreased precipitation likely
outweighs any increases in potential evaporation.
Changes in drought in the NAS region are modest but are
focused on the summertime and are generally representative
of other high latitude regions. The hydrology in these regions
is dominated by snow and ice processes which, given
increases in air temperature in these regions, can explain the
seasonally disproportionate changes in soil moisture deficits.
Warmer temperatures tend to reduce the snow cover through
melting of the existing pack and increasing the ratio of
rainfall to snowfall. Precipitation is also predicted to increase
Table 2 Summary of multi-model global mean soil moisture and drought characteristics for the PICNTRL, 20C3M and future climate SRES B1,
A1B and A2 scenarios
PICNTRL 20C3M (1961–1990) SRES B1 (2070–2099) SRES A1B (2070–2099) SRES A2 (2070–2099)
SM (%) 50.8, 0.9 49.8, 4.0 45.8, 5.6 44.7, 7.4 44.9, 7.3
A (%) 9.2, 1.0 11.2, 3.1 18.9, 6.2 22.3, 7.2 23.0, 6.7
D4–6 (30 year-1) 1.1, 0.3 1.4, 0.3 2.2, 0.8 2.6, 1.0 2.8, 1.1
D12+ (30 year-1) 0.2, 0.14 0.3, 0.2 0.6, 0.6 0.7, 0.7 0.7, 0.6
Dmean (months) 3.0, 1.4 3.2, 1.7 4.7, 3.3 5.4, 4.9 5.2, 3.6
Smean (months %) 14.8, 7.0 17.8, 9.3 31.9, 22.2 39.8, 40.7 38.2, 29.3
The first of each pair of values is the multi-model mean and the second is the multi-model IQR. The individual model PICNTRL values are
calculated as the average of the values in each 30-yr period within the whole simulation period, whose length varies among models and is
between 330 and 500 years
88 J. Sheffield, E. F. Wood: Projected changes in drought occurrence under future global warming
123
in the winter (and throughout the rest of the year). Rain
falling on the existing snow pack will also increase the rate of
melting. This will in turn shift the spring melt earlier. These
changes force wetter soil moisture conditions in the winter
and spring, although this is offset somewhat by increased
evapotranspiration due to higher temperatures. During the
summer, soil moisture is reduced, despite increased precip-
itation, because of earlier spring melt that is compounded by
evapotranspiration increases as a result of increased
temperatures. The frequency of soil moisture deficits there-
fore increases disproportionately in the summer time
compared to the wintertime.
4 Detectability of changes in drought
The detection of statistically significant changes in drought
is dependent upon, among other factors, the strength of the
0
1
2
3
4
5
SRESB1 SRESA1B SRESA2 20C3M
World
0
1
2
3
4
5Northern Europe (NEU)
0
1
2
3
4
5Mediterranean (MED)
0
1
2
3
4
5West Africa (WAF)
0
1
2
3
4
5East Africa (EAF)
0
1
2
3
4
5Southern Africa (SAF)
0
1
2
3
4
5North Asia (NAS)
0
1
2
3
4
5Central Asia (CAS)
0
1
2
3
4
5Tibetan Plateau (TIB)
0
1
2
3
4
5East Asia (EAS)
0
1
2
3
4
5Southeast Asia (SEA)
0
1
2
3
4
5South Asia (SAS)
0
1
2
3
4
5Australia (AUS)
0
1
2
3
4
5Alaska (ALA)
0
1
2
3
4
5Northeast Canada (NEC)
0
1
2
3
4
5Western North America (WNA)
0
1
2
3
4
5Central North America (CNA)
0
1
2
3
4
5Eastern North America (ENA)
1900 1950 2000 2050 2100
0
1
2
3
4
5Central America (CAM)
1900 1950 2000 2050 2100
0
1
2
3
4
5Amazon (AMZ)
1900 1950 2000 2050 2100
0
1
2
3
4
5Southern South America (SSA)
Fre
quen
cy o
f 4-6
mon
th d
urat
ion
drou
ghts
(30
yr-1
)
Fig. 5 Regional time series of
multi-model ensemble mean of
frequency of short-term
droughts (D4–6, q0(h) = 10.0%)
for the twenty-first century for
the SRESB1, SRESA1B and
SRESA2 scenarios. The values
are calculated over a 30-year
moving window and then
averaged over each region
J. Sheffield, E. F. Wood: Projected changes in drought occurrence under future global warming 89
123
change (signal) against the background of natural vari-
ability (noise). As these factors vary, a change will be
detected earlier or later, and the time of detection can be
used to quantify detectability (e.g., Ziegler et al. 2003). The
above analysis shows that statistically significant changes
are predicted to occur in many regions by the end of this
century, in particular the MED, SAF, CNA and CAM
regions. However, these changes may actually have
become significant at earlier times and there may be other
regions where changes become significant or detectable at
later time periods (if simulation data are available).
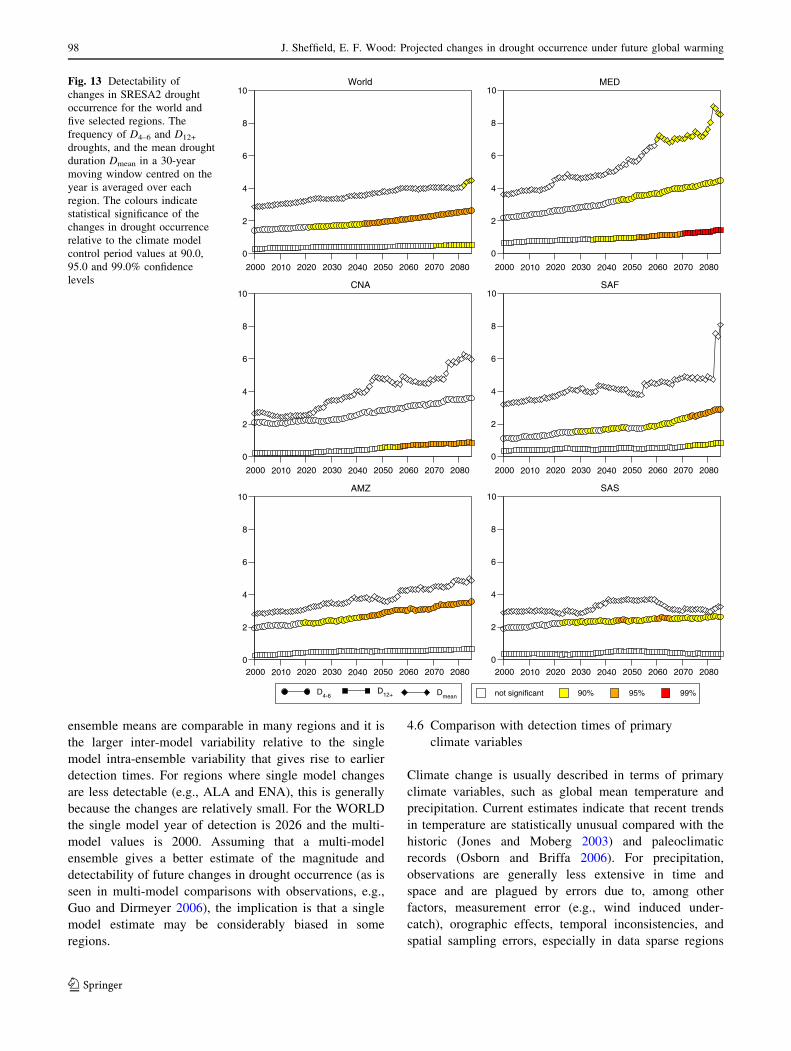
4.1 Examples of regional detectability
Figure 13 shows some examples of the detectability of
drought occurrence for the A2 scenario for the WORLD
and five regions (MED, CNA, SAF, AMZ and SAS). These
0
0.5
1
1.5
2
SRESB1 SRESA1B SRESA2 20C3M
World Northern Europe (NEU) Mediterranean (MED)
0
0.5
1
1.5
2West Africa (WAF) East Africa (EAF) Southern Africa (SAF)
0
0.5
1
1.5
2North Asia (NAS) Central Asia (CAS) Tibetan Plateau (TIB)
0
0.5
1
1.5
2East Asia (EAS) Southeast Asia (SEA) South Asia (SAS)
0
0.5
1
1.5
2Australia (AUS) Alaska (ALA) Northeast Canada (NEC)
0
0.5
1
1.5
2Western North America (WNA) Central North America (CNA) Eastern North America (ENA)
1900 1950 2000 2050 2100
0
0.5
1
1.5
2
0
0.5
1
1.5
2
0
0.5
1
1.5
2
0
0.5
1
1.5
2
0
0.5
1
1.5
2
0
0.5
1
1.5
2
0
0.5
1
1.5
2
0
0.5
1
1.5
2
0
0.5
1
1.5
2
0
0.5
1
1.5
2
0
0.5
1
1.5
2
0
0.5
1
1.5
2
0
0.5
1
1.5
2
0
0.5
1
1.5
2
0
0.5
1
1.5
2Central America (CAM)
1900 1950 2000 2050 2100
Amazon (AMZ)
1900 1950 2000 2050 2100
Southern South America (SSA)
Fre
quen
cy o
f 12+
mon
th d
urat
ion
drou
ghts
(30
yr-1
)
Fig. 6 As Fig. 5 but for long-
term (D12+) drought frequency
90 J. Sheffield, E. F. Wood: Projected changes in drought occurrence under future global warming
123
regions were chosen as they represent a variety of
increasing drought responses (some regions, such as NEU
and NAS, show no statistically significant changes). As the
mean change in drought occurrence increases over time,
because of, for example, decreasing precipitation, the
statistical significance of the change generally also
increases. Whether the changes in drought occurrence are
statistically significant is dependent on the region, drought
characteristic and scenario, although we only show results
here for A2 (results for all scenarios are shown in Sect.
4.2). The variance (or spread) among models is also a
factor. For some regions (e.g., MED) the changes are
detectable by mid-twenty-first century. In others, such as
WORLD, changes at the same confidence level vary by
several decades between drought characteristics. Else-
where, changes can flip between being detectable or not
0
10
20
30
40
50
SRESB1 SRESA1B SRESA2 20C3M
World
0
10
20
30
40
50Northern Europe (NEU)
0
10
20
30
40
50Mediterranean (MED)
0
10
20
30
40
50West Africa (WAF)
0
10
20
30
40
50East Africa (EAF)
0
10
20
30
40
50Southern Africa (SAF)
0
10
20
30
40
50North Asia (NAS)
0
10
20
30
40
50Central Asia (CAS)
0
10
20
30
40
50Tibetan Plateau (TIB)
0
10
20
30
40
50East Asia (EAS)
0
10
20
30
40
50Southeast Asia (SEA)
0
10
20
30
40
50South Asia (SAS)
0
10
20
30
40
50Australia (AUS)
0
10
20
30
40
50Alaska (ALA)
0
10
20
30
40
50Northeast Canada (NEC)
0
10
20
30
40
50Western North America (WNA)
0
10
20
30
40
50Central North America (CNA)
0
10
20
30
40
50Eastern North America (ENA)
1900 1950 2000 2050 2100
0
10
20
30
40
50Central America (CAM)
1900 1950 2000 2050 2100
0
10
20
30
40
50Amazon (AMZ)
1900 1950 2000 2050 2100
0
10
20
30
40
50Southern South America (SSA)
Spa
tial e
xten
t of m
onth
ly d
roug
ht (
%)
Fig. 7 As Fig. 5 but for the
spatial extent of monthly
drought, q0(h) = 10%
J. Sheffield, E. F. Wood: Projected changes in drought occurrence under future global warming 91
123
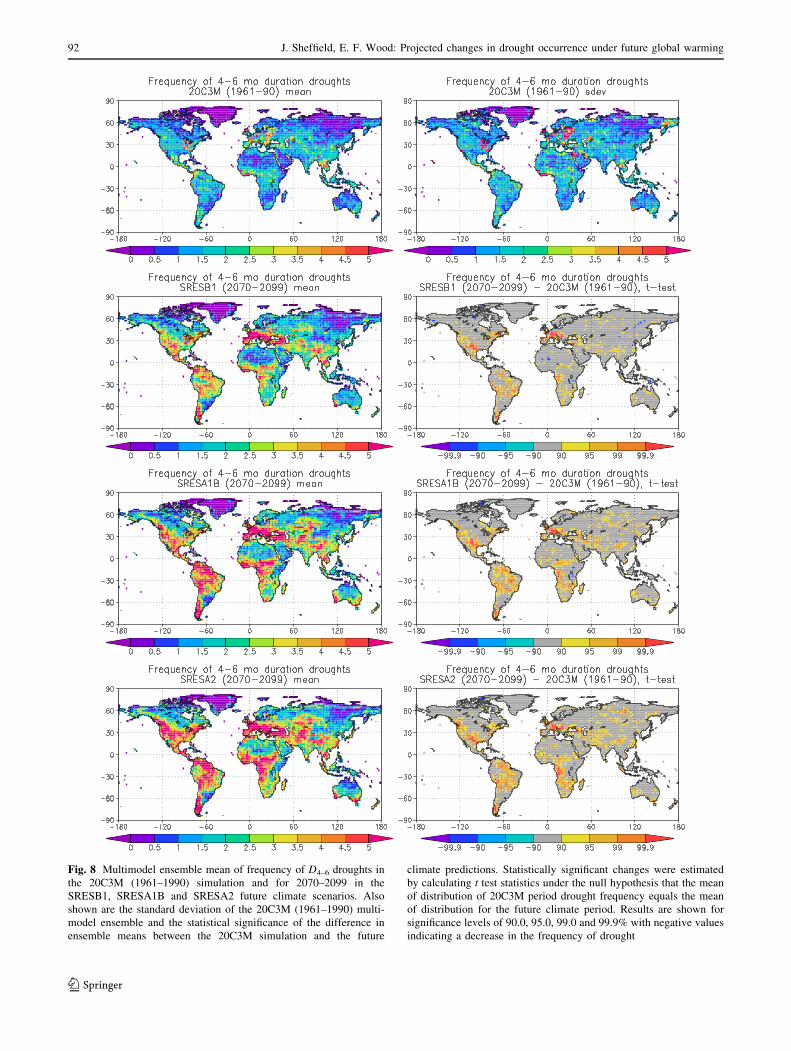
Fig. 8 Multimodel ensemble mean of frequency of D4–6 droughts in
the 20C3M (1961–1990) simulation and for 2070–2099 in the
SRESB1, SRESA1B and SRESA2 future climate scenarios. Also
shown are the standard deviation of the 20C3M (1961–1990) multi-
model ensemble and the statistical significance of the difference in
ensemble means between the 20C3M simulation and the future
climate predictions. Statistically significant changes were estimated
by calculating t test statistics under the null hypothesis that the mean
of distribution of 20C3M period drought frequency equals the mean
of distribution for the future climate period. Results are shown for
significance levels of 90.0, 95.0, 99.0 and 99.9% with negative values
indicating a decrease in the frequency of drought
92 J. Sheffield, E. F. Wood: Projected changes in drought occurrence under future global warming
123
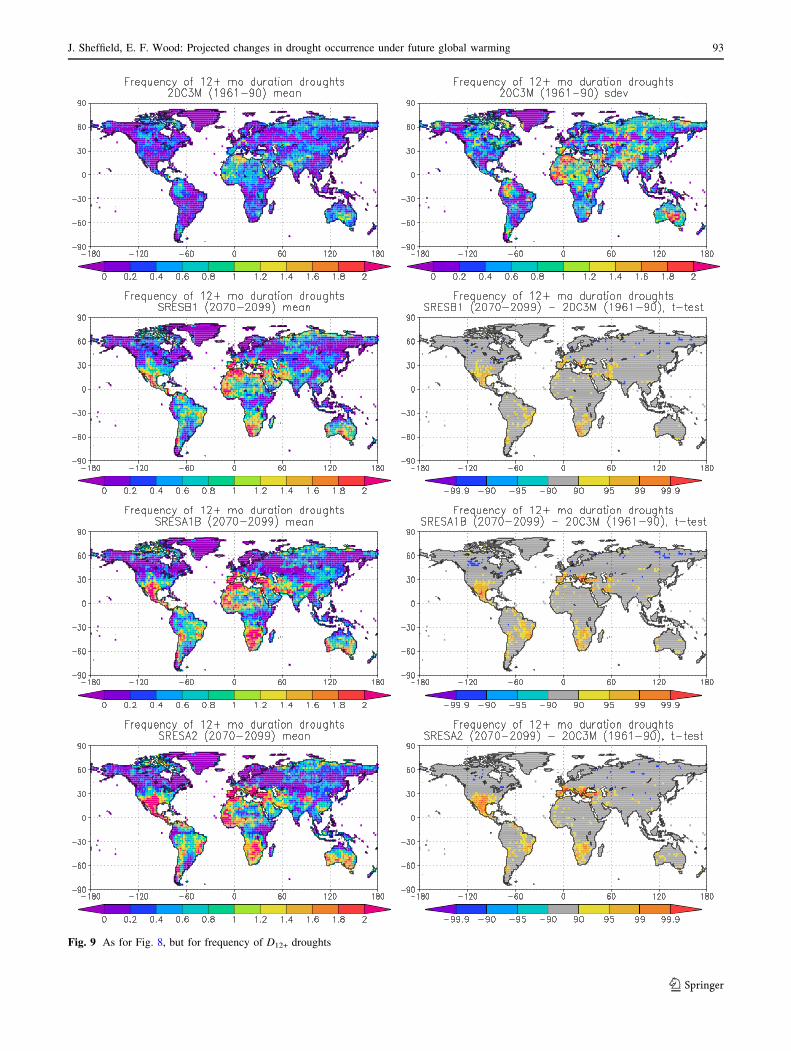
Fig. 9 As for Fig. 8, but for frequency of D12+ droughts
J. Sheffield, E. F. Wood: Projected changes in drought occurrence under future global warming 93
123
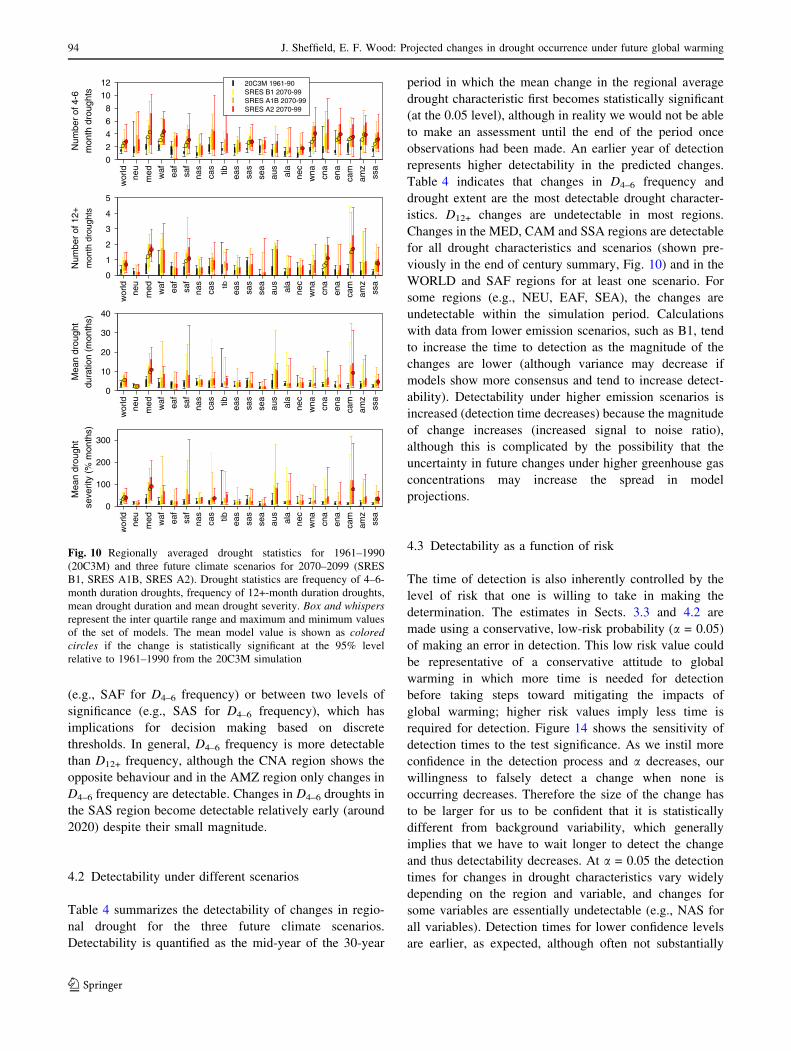
(e.g., SAF for D4–6 frequency) or between two levels of
significance (e.g., SAS for D4–6 frequency), which has
implications for decision making based on discrete
thresholds. In general, D4–6 frequency is more detectable
than D12+ frequency, although the CNA region shows the
opposite behaviour and in the AMZ region only changes in
D4–6 frequency are detectable. Changes in D4–6 droughts in
the SAS region become detectable relatively early (around
2020) despite their small magnitude.
4.2 Detectability under different scenarios
Table 4 summarizes the detectability of changes in regio-
nal drought for the three future climate scenarios.
Detectability is quantified as the mid-year of the 30-year
period in which the mean change in the regional average
drought characteristic first becomes statistically significant
(at the 0.05 level), although in reality we would not be able
to make an assessment until the end of the period once
observations had been made. An earlier year of detection
represents higher detectability in the predicted changes.
Table 4 indicates that changes in D4–6 frequency and
drought extent are the most detectable drought character-
istics. D12+ changes are undetectable in most regions.
Changes in the MED, CAM and SSA regions are detectable
for all drought characteristics and scenarios (shown pre-
viously in the end of century summary, Fig. 10) and in the
WORLD and SAF regions for at least one scenario. For
some regions (e.g., NEU, EAF, SEA), the changes are
undetectable within the simulation period. Calculations
with data from lower emission scenarios, such as B1, tend
to increase the time to detection as the magnitude of the
changes are lower (although variance may decrease if
models show more consensus and tend to increase detect-
ability). Detectability under higher emission scenarios is
increased (detection time decreases) because the magnitude
of change increases (increased signal to noise ratio),
although this is complicated by the possibility that the
uncertainty in future changes under higher greenhouse gas
concentrations may increase the spread in model
projections.
4.3 Detectability as a function of risk
The time of detection is also inherently controlled by the
level of risk that one is willing to take in making the
determination. The estimates in Sects. 3.3 and 4.2 are
made using a conservative, low-risk probability (a = 0.05)
of making an error in detection. This low risk value could
be representative of a conservative attitude to global
warming in which more time is needed for detection
before taking steps toward mitigating the impacts of
global warming; higher risk values imply less time is
required for detection. Figure 14 shows the sensitivity of
detection times to the test significance. As we instil more
confidence in the detection process and a decreases, our
willingness to falsely detect a change when none is
occurring decreases. Therefore the size of the change has
to be larger for us to be confident that it is statistically
different from background variability, which generally
implies that we have to wait longer to detect the change
and thus detectability decreases. At a = 0.05 the detection
times for changes in drought characteristics vary widely
depending on the region and variable, and changes for
some variables are essentially undetectable (e.g., NAS for
all variables). Detection times for lower confidence levels
are earlier, as expected, although often not substantially
wor
ldne
u
med waf eaf
saf
nas
cas tib eas
sas
sea
aus
ala
nec
wna cna
ena
cam
amz
ssa
0
2
4
6
8
10
12 N
umbe
r of
4-6
mon
th d
roug
hts
20C3M 1961-90SRES B1 2070-99SRES A1B 2070-99SRES A2 2070-99
wor
ldne
u
med waf eaf
saf
nas
cas tib
eas
sas
sea
aus
ala
nec
wna cna
ena
cam
amz
ssa
0
1
2
3
4
5
Num
ber
of 1
2+m
onth
dro
ught
s
wor
ldne
u
med waf eaf
saf
nas
cas tib eas
sas
sea
aus
ala
nec
wna cn
a
ena
cam
amz
ssa
0
10
20
30
40
M
ean
drou
ght
dura
tion
(mon
ths)
wor
ldne
u
med waf eaf
saf
nas
cas tib eas
sas
sea
aus
ala
nec
wna cn
a
ena
cam
amz
ssa
0
100
200
300
M
ean
drou
ght
seve
rity
(% m
onth
s)
Fig. 10 Regionally averaged drought statistics for 1961–1990
(20C3M) and three future climate scenarios for 2070–2099 (SRES
B1, SRES A1B, SRES A2). Drought statistics are frequency of 4–6-
month duration droughts, frequency of 12+-month duration droughts,
mean drought duration and mean drought severity. Box and whispersrepresent the inter quartile range and maximum and minimum values
of the set of models. The mean model value is shown as coloredcircles if the change is statistically significant at the 95% level
relative to 1961–1990 from the 20C3M simulation
94 J. Sheffield, E. F. Wood: Projected changes in drought occurrence under future global warming
123
different from the 95% values. However, above the 99%
level, the changes generally become undetectable within
the simulation period. For example, detection times for
changes in D12+ frequency over CNA increase from about
2050 at 95% and below, to undetectable for 99% and
above.
4.4 Detectability relative to natural variability
Detection of change is dependent on the background noise
used to quantify the variability of the system. The results
shown so far are relative to the model twentieth century
simulations, which represent contemporary climate and
thus encompass observed climate variability. This allows
us to perceive future changes relative to the contemporary
occurrence of drought of which we have first hand expe-
rience. Nevertheless, it is also of interest to know the
detectability of drought changes relative to a ‘‘pristine’’
climate without elevated greenhouse gases, and so estimate
the anthropogenic influence on drought occurrence. This
was done by calculating the detectability relative to the
PICNTRL simulations, and therefore assuming that these
are our best estimate of natural variability. Variability in
these simulations results from a number of sources
including variability in solar output and internal variability
of the coupled atmosphere-ocean-land system. Figure 15
gives the detection times when using either the PICNTRL
or the 20C3M (1961–1990) data to estimate the back-
ground variability. Detectability generally increases when
using the PICNTRL data as would be expected, because
drought frequency is, in general, relatively lower in the
PICNTRL compared to the 20C3M simulations (as shown
in the regional statistics in Table 3). It should be noted
though that decadal variability within the twentieth century
means that for some regions 1961–1990 is a wet period and
the changes become detectable earlier than when using the
PICNTRL data.
4.5 Multi-model ensemble versus single model
detectability
Given the uncertainty in future climate projections by a
single model, this study is based on a multi-model ensem-
ble. This enables us to capture the uncertainty in the
representation of climate processes. However we have
chosen to use a single model simulation as representative of
each particular model despite the variability among same
model simulations that differ only by their initial condi-
tions. To assess how detectability differs when using the
predicted climate of a single model we calculated the year
Table 3 Regionally averaged,
multi-model mean values of
short- (D4–6) and long (D12+)
term drought frequencies and
spatial extent of drought (A), for
the PICNTRL (PIC), 20C3M
(1961–1990) (20C) and SRES
B1, A1B, A2 (2070–2099)
scenarios
Future values in bold are
statistically significant, relative
to 1961–1990 of the 20C3M
simulation, at the 0.05 level
with df = 14
D4–6 D12+ A
PIC 20C B1 A1B A2 PIC 20C B1 A1B A2 PIC 20C B1 A1B A2
WORLD 1.1 1.4 2.2 2.6 2.8 0.2 0.3 0.6 0.7 0.7 9.2 11.2 18.9 22.3 23.0
NEU 1.4 2.0 2.3 2.9 2.9 0.1 0.2 0.2 0.2 0.2 9.2 11.1 12.3 13.3 14.1
MED 1.2 2.1 3.5 4.3 4.6 0.2 0.5 1.2 1.5 1.7 8.7 15.7 32.7 41.4 44.7
WAF 1.3 2.0 3.0 3.8 4.4 0.2 0.5 0.8 1.0 1.1 9.9 15.1 23.0 27.9 30.2
EAF 1.2 1.5 2.0 2.4 2.6 0.2 0.3 0.3 0.4 0.4 9.7 11.2 14.5 16.9 17.1
SAF 0.9 1.1 2.2 2.7 3.1 0.2 0.3 0.9 1.2 1.1 9.4 10.3 24.3 31.7 30.7
NAS 1.0 0.9 1.5 1.7 1.8 0.2 0.2 0.4 0.4 0.4 9.8 9.9 13.6 15.0 14.9
CAS 1.4 1.8 2.9 3.6 4.0 0.2 0.4 0.7 0.7 0.8 9.9 12.8 25.0 27.9 29.2
TIB 1.5 1.7 2.1 2.6 3.0 0.2 0.5 0.5 0.7 0.7 10.0 14.8 19.4 24.1 24.4
EAS 1.3 1.5 1.8 2.2 2.3 0.2 0.2 0.3 0.4 0.4 9.3 10.5 13.1 15.5 15.7
SAS 1.3 1.7 2.7 2.8 2.8 0.2 0.4 0.5 0.5 0.4 9.4 14.0 17.9 20.4 18.5
SEA 1.2 1.7 1.9 2.0 2.2 0.1 0.1 0.2 0.2 0.3 7.2 9.0 10.4 11.6 12.6
AUS 1.0 1.2 1.5 1.9 1.8 0.3 0.5 0.8 0.9 0.9 9.3 12.2 20.2 22.1 22.4
ALA 1.1 1.0 1.4 1.6 1.7 0.1 0.1 0.4 0.4 0.4 9.6 9.8 15.5 17.4 17.7
NEC 1.0 0.9 1.5 1.7 1.8 0.1 0.3 0.4 0.4 0.4 8.8 8.8 17.3 18.3 18.2
WNA 1.5 1.6 2.8 3.2 4.1 0.2 0.2 0.5 0.4 0.7 9.9 10.8 18.8 21.3 24.8
CNA 1.6 2.0 3.0 3.2 3.8 0.2 0.2 0.6 0.8 1.1 9.9 9.7 20.3 26.3 30.5
ENA 1.5 1.8 3.1 3.3 4.0 0.1 0.2 0.5 0.5 0.5 8.9 10.4 18.2 21.1 24.1
CAM 1.3 1.9 3.2 3.4 3.7 0.1 0.2 1.3 1.5 1.7 8.5 10.8 30.6 36.0 41.1
AMZ 1.4 1.7 3.1 3.9 3.8 0.2 0.2 0.7 0.8 0.9 9.7 11.8 23.8 28.0 29.0
SSA 1.3 1.4 2.5 3.1 3.2 0.2 0.2 0.5 0.8 0.8 9.5 10.1 19.0 24.8 24.9
J. Sheffield, E. F. Wood: Projected changes in drought occurrence under future global warming 95
123
to detection for each of the five available ensemble mem-
bers for the GISS-ER model for the A2 scenario (Fig. 16).
This model was chosen because of the availability of a
relatively large number of ensemble members and it is
assumed that similar results would be obtained when using
other models if multiple members were available. The
results show reasonable agreement (within 25 years) for
WAF, SAF and parts of the Americas but large differences
in detectability elsewhere (e.g., the NAS and SAS regions).
In general, the single model changes are detectable at earlier
times. Examination of the regional time series of the single
and multi-model ensembles (not shown) indicates that the
0
20
40
60
80
PICNTRL 20C3M SRES B1 SRES A1B SRES A2
World
0
20
40
60
80Northern Europe (NEU)
0
20
40
60
80Mediterranean (MED)
0
20
40
60
80West Africa (WAF)
0
20
40
60
80East Africa (EAF)
0
20
40
60
80Southern Africa (SAF)
0
20
40
60
80North Asia (NAS)
0
20
40
60
80Central Asia (CAS)
0
20
40
60
80Tibetan Plateau (TIB)
0
20
40
60
80East Asia (EAS)
0
20
40
60
80Southeast Asia (SEA)
0
20
40
60
80South Asia (SAS)
0
20
40
60
80Australia (AUS)
0
20
40
60
80Alaska (ALA)
0
20
40
60
80Northeast Canada (NEC)
0
20
40
60
80Western North America (WNA)
0
20
40
60
80Central North America (CNA)
0
20
40
60
80Eastern North America (ENA)
1 2 3 4 5 6 7 8 9 10 11 12
0
20
40
60
80Central America (CAM)
1 2 3 4 5 6 7 8 9 10 11 12
0
20
40
60
80Amazon (AMZ)
1 2 3 4 5 6 7 8 9 10 11 12
0
20
40
60
80Southern South America (SSA)
Fre
quen
cy o
f Mon
thly
Soi
l Moi
stur
e D
efic
its (
%)
Fig. 11 Multi-model regional
average of frequency of
monthly soil moisture deficits
for the PICNTRL, 20C3M,
SRES B1, A1B and A2
scenarios, relative to the tenth
percentile of the PICNTRL
simulations. For each model, the
number of months with soil
moisture deficits below the tenth
percentile soil moisture value of
the PICNTRL simulation are
summed and averaged across all
models and the region and
converted to a percentage. The
values are calculated separately
for each month. The PICNTRL
data are by definition equal to
10% for all months. The 20C3M
data are calculated for 1961–
1990. The future climate SRES
scenarios are calculated for
2070–2099
96 J. Sheffield, E. F. Wood: Projected changes in drought occurrence under future global warming
123
1 2 3 4 5 6 7 8 9 10 11 12
240
260
280
300
320A
ir T
emp
(K)
PICNTRL 20C3M (1961-90) SRES A2 (2070-99)
MED
1 2 3 4 5 6 7 8 9 10 11 12
240
260
280
300
320CNA
1 2 3 4 5 6 7 8 9 10 11 12
240
260
280
300
320NAS
1 2 3 4 5 6 7 8 9 10 11 12
0
1
2
3
4
5
Pre
cip
(mm
/day
)
1 2 3 4 5 6 7 8 9 10 11 12
0
1
2
3
4
5
1 2 3 4 5 6 7 8 9 10 11 12
0
1
2
3
4
5
1 2 3 4 5 6 7 8 9 10 11 12
0
1
2
3
4
5
Eva
p (m
m/d
ay)
1 2 3 4 5 6 7 8 9 10 11 12
0
1
2
3
4
5
1 2 3 4 5 6 7 8 9 10 11 12
0
1
2
3
4
5
1 2 3 4 5 6 7 8 9 10 11 12
0
0.2
0.4
0.6
0.8
1
Run
off (
mm
/day
)
1 2 3 4 5 6 7 8 9 10 11 12
0
1
2
3
1 2 3 4 5 6 7 8 9 10 11 12
0
1
2
3
1 2 3 4 5 6 7 8 9 10 11 12
0
20
40
60
80
100
Soi
l Moi
stur
e (%
)
1 2 3 4 5 6 7 8 9 10 11 12
0
20
40
60
80
100
1 2 3 4 5 6 7 8 9 10 11 12
0
20
40
60
80
100
1 2 3 4 5 6 7 8 9 10 11 12
0
0.1
0.2
0.3
0.4
0.5
SW
E (
mm
)
1 2 3 4 5 6 7 8 9 10 11 12
0
0.2
0.4
0.6
0.8
1
1 2 3 4 5 6 7 8 9 10 11 12
020406080
100120140
Fig. 12 Mean seasonal cycle of air temperature and the main
components of the terrestrial hydrological cycle for the MED, CNA
and NAS regions for the PICNTRL, 20C3M (1961–1990) and
SRES A2 (2070–2099) scenarios. The boxes and whispers repre-
sent the inter-quartile range and range, respectively across the
models
J. Sheffield, E. F. Wood: Projected changes in drought occurrence under future global warming 97
123
ensemble means are comparable in many regions and it is
the larger inter-model variability relative to the single
model intra-ensemble variability that gives rise to earlier
detection times. For regions where single model changes
are less detectable (e.g., ALA and ENA), this is generally
because the changes are relatively small. For the WORLD
the single model year of detection is 2026 and the multi-
model values is 2000. Assuming that a multi-model
ensemble gives a better estimate of the magnitude and
detectability of future changes in drought occurrence (as is
seen in multi-model comparisons with observations, e.g.,
Guo and Dirmeyer 2006), the implication is that a single
model estimate may be considerably biased in some
regions.
4.6 Comparison with detection times of primary
climate variables
Climate change is usually described in terms of primary
climate variables, such as global mean temperature and
precipitation. Current estimates indicate that recent trends
in temperature are statistically unusual compared with the
historic (Jones and Moberg 2003) and paleoclimatic
records (Osborn and Briffa 2006). For precipitation,
observations are generally less extensive in time and
space and are plagued by errors due to, among other
factors, measurement error (e.g., wind induced under-
catch), orographic effects, temporal inconsistencies, and
spatial sampling errors, especially in data sparse regions
2000 2010 2020 2030 2040 2050 2060 2070 2080
0
2
4
6
8
10
D4-6D12+ Dmean
World
2000 2010 2020 2030 2040 2050 2060 2070 2080
0
2
4
6
8
10MED
2000 2010 2020 2030 2040 2050 2060 2070 2080
0
2
4
6
8
10CNA
2000 2010 2020 2030 2040 2050 2060 2070 2080
0
2
4
6
8
10SAF
2000 2010 2020 2030 2040 2050 2060 2070 20800
2
4
6
8
10AMZ
2000 2010 2020 2030 2040 2050 2060 2070 20800
2
4
6
8
10SAS
not significant 90% 95% 99%
Fig. 13 Detectability of
changes in SRESA2 drought
occurrence for the world and
five selected regions. The
frequency of D4–6 and D12+
droughts, and the mean drought
duration Dmean in a 30-year
moving window centred on the
year is averaged over each
region. The colours indicate
statistical significance of the
changes in drought occurrence
relative to the climate model
control period values at 90.0,
95.0 and 99.0% confidence
levels
98 J. Sheffield, E. F. Wood: Projected changes in drought occurrence under future global warming
123
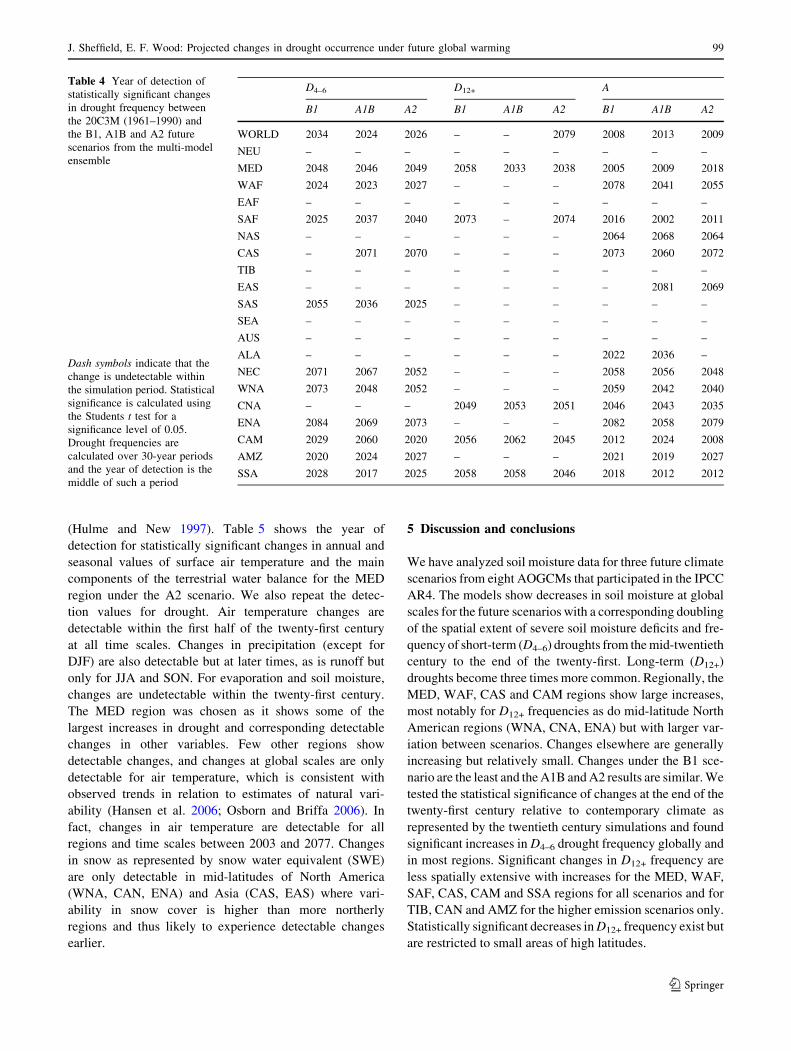
(Hulme and New 1997). Table 5 shows the year of
detection for statistically significant changes in annual and
seasonal values of surface air temperature and the main
components of the terrestrial water balance for the MED
region under the A2 scenario. We also repeat the detec-
tion values for drought. Air temperature changes are
detectable within the first half of the twenty-first century
at all time scales. Changes in precipitation (except for
DJF) are also detectable but at later times, as is runoff but
only for JJA and SON. For evaporation and soil moisture,
changes are undetectable within the twenty-first century.
The MED region was chosen as it shows some of the
largest increases in drought and corresponding detectable
changes in other variables. Few other regions show
detectable changes, and changes at global scales are only
detectable for air temperature, which is consistent with
observed trends in relation to estimates of natural vari-
ability (Hansen et al. 2006; Osborn and Briffa 2006). In
fact, changes in air temperature are detectable for all
regions and time scales between 2003 and 2077. Changes
in snow as represented by snow water equivalent (SWE)
are only detectable in mid-latitudes of North America
(WNA, CAN, ENA) and Asia (CAS, EAS) where vari-
ability in snow cover is higher than more northerly
regions and thus likely to experience detectable changes
earlier.
5 Discussion and conclusions
We have analyzed soil moisture data for three future climate
scenarios from eight AOGCMs that participated in the IPCC
AR4. The models show decreases in soil moisture at global
scales for the future scenarios with a corresponding doubling
of the spatial extent of severe soil moisture deficits and fre-
quency of short-term (D4–6) droughts from the mid-twentieth
century to the end of the twenty-first. Long-term (D12+)
droughts become three times more common. Regionally, the
MED, WAF, CAS and CAM regions show large increases,
most notably for D12+ frequencies as do mid-latitude North
American regions (WNA, CNA, ENA) but with larger var-
iation between scenarios. Changes elsewhere are generally
increasing but relatively small. Changes under the B1 sce-
nario are the least and the A1B and A2 results are similar. We
tested the statistical significance of changes at the end of the
twenty-first century relative to contemporary climate as
represented by the twentieth century simulations and found
significant increases in D4–6 drought frequency globally and
in most regions. Significant changes in D12+ frequency are
less spatially extensive with increases for the MED, WAF,
SAF, CAS, CAM and SSA regions for all scenarios and for
TIB, CAN and AMZ for the higher emission scenarios only.
Statistically significant decreases in D12+ frequency exist but
are restricted to small areas of high latitudes.
Table 4 Year of detection of
statistically significant changes
in drought frequency between
the 20C3M (1961–1990) and
the B1, A1B and A2 future
scenarios from the multi-model
ensemble
Dash symbols indicate that the
change is undetectable within
the simulation period. Statistical
significance is calculated using
the Students t test for a
significance level of 0.05.
Drought frequencies are
calculated over 30-year periods
and the year of detection is the
middle of such a period
D4–6 D12+ A
B1 A1B A2 B1 A1B A2 B1 A1B A2
WORLD 2034 2024 2026 – – 2079 2008 2013 2009
NEU – – – – – – – – –
MED 2048 2046 2049 2058 2033 2038 2005 2009 2018
WAF 2024 2023 2027 – – – 2078 2041 2055
EAF – – – – – – – – –
SAF 2025 2037 2040 2073 – 2074 2016 2002 2011
NAS – – – – – – 2064 2068 2064
CAS – 2071 2070 – – – 2073 2060 2072
TIB – – – – – – – – –
EAS – – – – – – – 2081 2069
SAS 2055 2036 2025 – – – – – –
SEA – – – – – – – – –
AUS – – – – – – – – –
ALA – – – – – – 2022 2036 –
NEC 2071 2067 2052 – – – 2058 2056 2048
WNA 2073 2048 2052 – – – 2059 2042 2040
CNA – – – 2049 2053 2051 2046 2043 2035
ENA 2084 2069 2073 – – – 2082 2058 2079
CAM 2029 2060 2020 2056 2062 2045 2012 2024 2008
AMZ 2020 2024 2027 – – – 2021 2019 2027
SSA 2028 2017 2025 2058 2058 2046 2018 2012 2012
J. Sheffield, E. F. Wood: Projected changes in drought occurrence under future global warming 99
123
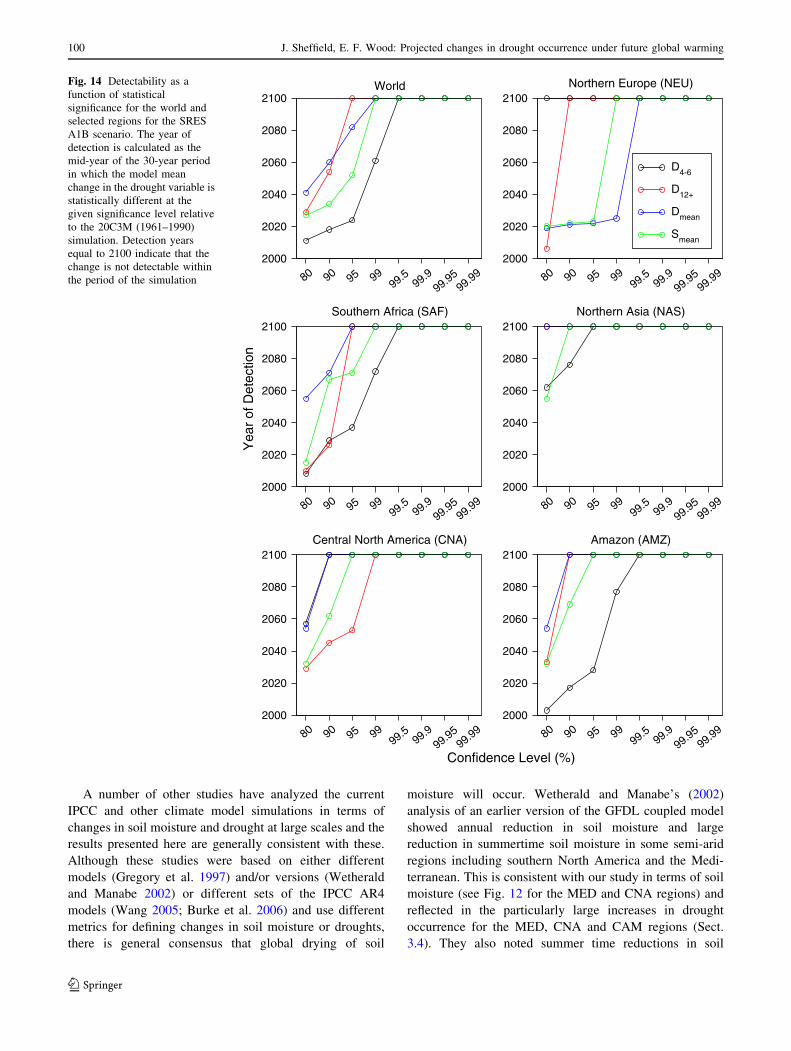
A number of other studies have analyzed the current
IPCC and other climate model simulations in terms of
changes in soil moisture and drought at large scales and the
results presented here are generally consistent with these.
Although these studies were based on either different
models (Gregory et al. 1997) and/or versions (Wetherald
and Manabe 2002) or different sets of the IPCC AR4
models (Wang 2005; Burke et al. 2006) and use different
metrics for defining changes in soil moisture or droughts,
there is general consensus that global drying of soil
moisture will occur. Wetherald and Manabe’s (2002)
analysis of an earlier version of the GFDL coupled model
showed annual reduction in soil moisture and large
reduction in summertime soil moisture in some semi-arid
regions including southern North America and the Medi-
terranean. This is consistent with our study in terms of soil
moisture (see Fig. 12 for the MED and CNA regions) and
reflected in the particularly large increases in drought
occurrence for the MED, CNA and CAM regions (Sect.
3.4). They also noted summer time reductions in soil
80 90 95 9999.5
99.999.95
99.992000
2020
2040
2060
2080
2100
D4-6
D12+
Dmean
Smean
World
80 90 95 9999.5
99.999.95
99.992000
2020
2040
2060
2080
2100Northern Europe (NEU)
80 90 95 9999.5
99.999.95
99.992000
2020
2040
2060
2080
2100
Yea
r of
Det
ectio
n
Southern Africa (SAF)
80 90 95 9999.5
99.999.95
99.992000
2020
2040
2060
2080
2100Northern Asia (NAS)
80 90 95 9999.5
99.999.95
99.99
Confidence Level (%)
2000
2020
2040
2060
2080
2100Central North America (CNA)
80 90 95 9999.5
99.999.95
99.992000
2020
2040
2060
2080
2100Amazon (AMZ)
Fig. 14 Detectability as a
function of statistical
significance for the world and
selected regions for the SRES
A1B scenario. The year of
detection is calculated as the
mid-year of the 30-year period
in which the model mean
change in the drought variable is
statistically different at the
given significance level relative
to the 20C3M (1961–1990)
simulation. Detection years
equal to 2100 indicate that the
change is not detectable within
the period of the simulation
100 J. Sheffield, E. F. Wood: Projected changes in drought occurrence under future global warming
123
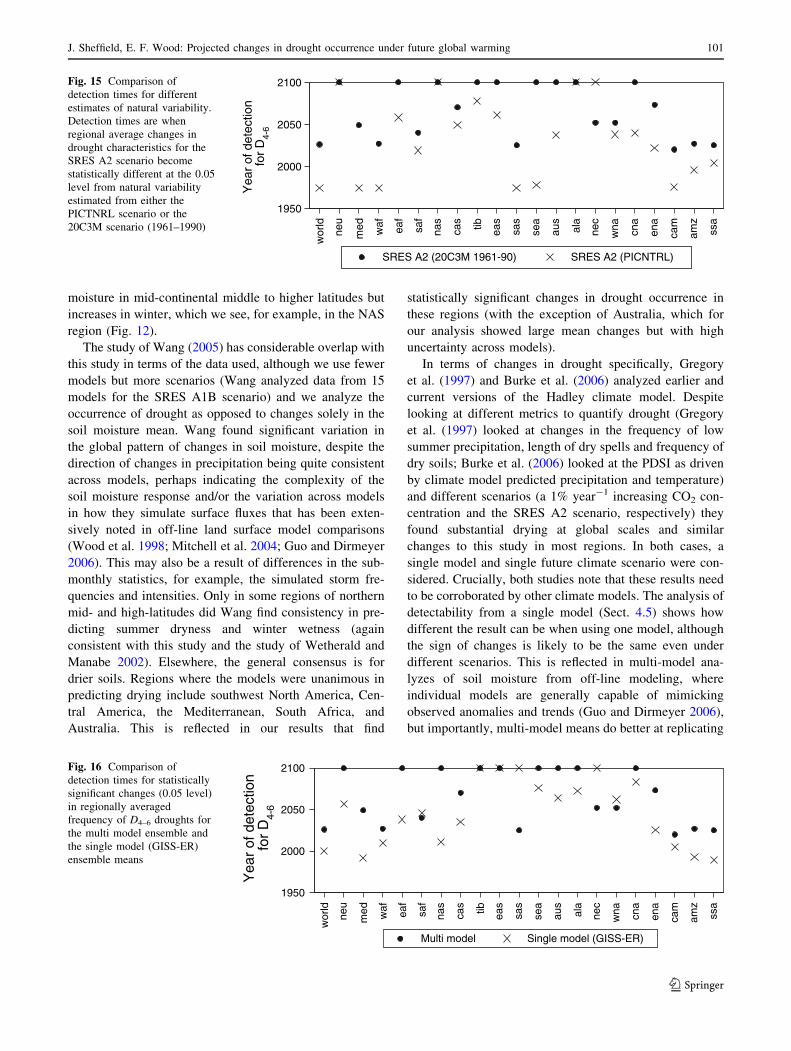
moisture in mid-continental middle to higher latitudes but
increases in winter, which we see, for example, in the NAS
region (Fig. 12).
The study of Wang (2005) has considerable overlap with
this study in terms of the data used, although we use fewer
models but more scenarios (Wang analyzed data from 15
models for the SRES A1B scenario) and we analyze the
occurrence of drought as opposed to changes solely in the
soil moisture mean. Wang found significant variation in
the global pattern of changes in soil moisture, despite the
direction of changes in precipitation being quite consistent
across models, perhaps indicating the complexity of the
soil moisture response and/or the variation across models
in how they simulate surface fluxes that has been exten-
sively noted in off-line land surface model comparisons
(Wood et al. 1998; Mitchell et al. 2004; Guo and Dirmeyer
2006). This may also be a result of differences in the sub-
monthly statistics, for example, the simulated storm fre-
quencies and intensities. Only in some regions of northern
mid- and high-latitudes did Wang find consistency in pre-
dicting summer dryness and winter wetness (again
consistent with this study and the study of Wetherald and
Manabe 2002). Elsewhere, the general consensus is for
drier soils. Regions where the models were unanimous in
predicting drying include southwest North America, Cen-
tral America, the Mediterranean, South Africa, and
Australia. This is reflected in our results that find
statistically significant changes in drought occurrence in
these regions (with the exception of Australia, which for
our analysis showed large mean changes but with high
uncertainty across models).
In terms of changes in drought specifically, Gregory
et al. (1997) and Burke et al. (2006) analyzed earlier and
current versions of the Hadley climate model. Despite
looking at different metrics to quantify drought (Gregory
et al. (1997) looked at changes in the frequency of low
summer precipitation, length of dry spells and frequency of
dry soils; Burke et al. (2006) looked at the PDSI as driven
by climate model predicted precipitation and temperature)
and different scenarios (a 1% year-1 increasing CO2 con-
centration and the SRES A2 scenario, respectively) they
found substantial drying at global scales and similar
changes to this study in most regions. In both cases, a
single model and single future climate scenario were con-
sidered. Crucially, both studies note that these results need
to be corroborated by other climate models. The analysis of
detectability from a single model (Sect. 4.5) shows how
different the result can be when using one model, although
the sign of changes is likely to be the same even under
different scenarios. This is reflected in multi-model ana-
lyzes of soil moisture from off-line modeling, where
individual models are generally capable of mimicking
observed anomalies and trends (Guo and Dirmeyer 2006),
but importantly, multi-model means do better at replicating
wor
ld
neu
med waf ea
f
saf
nas
cas tib eas
sas
sea
aus
ala
nec
wna cn
a
ena
cam
amz
ssa
1950
2000
2050
2100
Yea
r of
det
ectio
n
for
D4-
6SRES A2 (20C3M 1961-90) SRES A2 (PICNTRL)
Fig. 15 Comparison of
detection times for different
estimates of natural variability.
Detection times are when
regional average changes in
drought characteristics for the
SRES A2 scenario become
statistically different at the 0.05
level from natural variability
estimated from either the
PICTNRL scenario or the
20C3M scenario (1961–1990)
wor
ld
neu
med waf ea
f
saf
nas
cas tib eas
sas
sea
aus
ala
nec
wna cn
a
ena
cam
amz
ssa
1950
2000
2050
2100
Yea
r of
det
ectio
n
for
D4-
6
Multi model Single model (GISS-ER)
Fig. 16 Comparison of
detection times for statistically
significant changes (0.05 level)
in regionally averaged
frequency of D4–6 droughts for
the multi model ensemble and
the single model (GISS-ER)
ensemble means
J. Sheffield, E. F. Wood: Projected changes in drought occurrence under future global warming 101
123
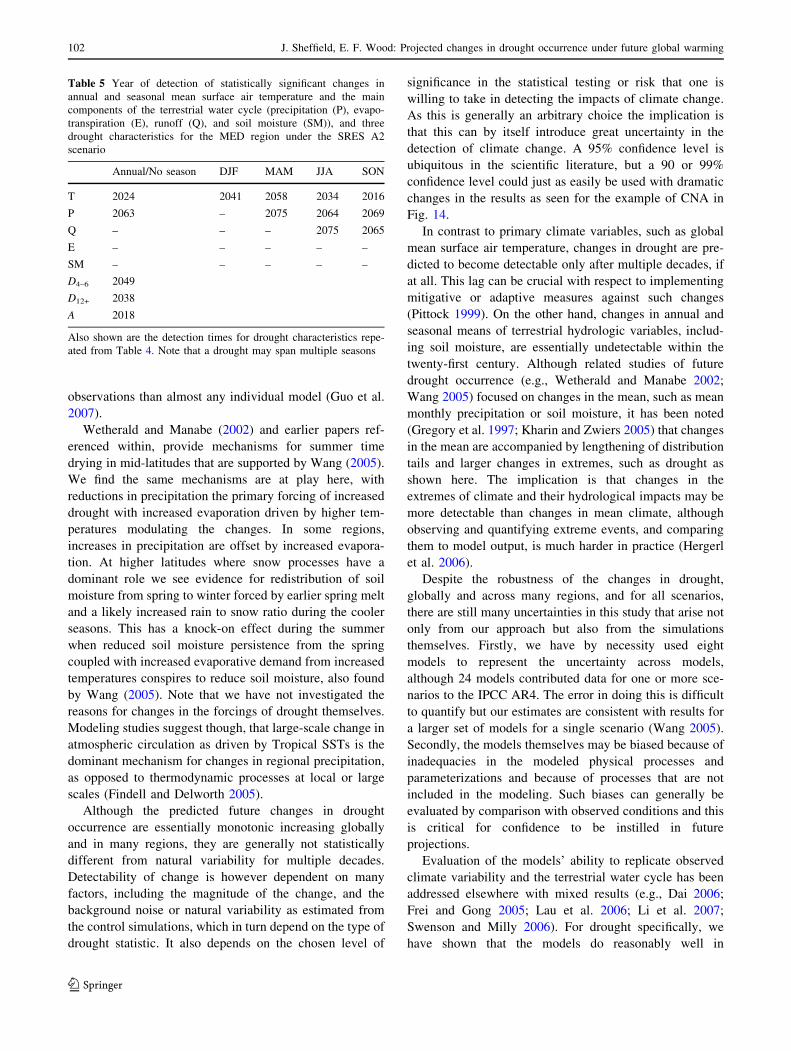
observations than almost any individual model (Guo et al.
2007).
Wetherald and Manabe (2002) and earlier papers ref-
erenced within, provide mechanisms for summer time
drying in mid-latitudes that are supported by Wang (2005).
We find the same mechanisms are at play here, with
reductions in precipitation the primary forcing of increased
drought with increased evaporation driven by higher tem-
peratures modulating the changes. In some regions,
increases in precipitation are offset by increased evapora-
tion. At higher latitudes where snow processes have a
dominant role we see evidence for redistribution of soil
moisture from spring to winter forced by earlier spring melt
and a likely increased rain to snow ratio during the cooler
seasons. This has a knock-on effect during the summer
when reduced soil moisture persistence from the spring
coupled with increased evaporative demand from increased
temperatures conspires to reduce soil moisture, also found
by Wang (2005). Note that we have not investigated the
reasons for changes in the forcings of drought themselves.
Modeling studies suggest though, that large-scale change in
atmospheric circulation as driven by Tropical SSTs is the
dominant mechanism for changes in regional precipitation,
as opposed to thermodynamic processes at local or large
scales (Findell and Delworth 2005).
Although the predicted future changes in drought
occurrence are essentially monotonic increasing globally
and in many regions, they are generally not statistically
different from natural variability for multiple decades.
Detectability of change is however dependent on many
factors, including the magnitude of the change, and the
background noise or natural variability as estimated from
the control simulations, which in turn depend on the type of
drought statistic. It also depends on the chosen level of
significance in the statistical testing or risk that one is
willing to take in detecting the impacts of climate change.
As this is generally an arbitrary choice the implication is
that this can by itself introduce great uncertainty in the
detection of climate change. A 95% confidence level is
ubiquitous in the scientific literature, but a 90 or 99%
confidence level could just as easily be used with dramatic
changes in the results as seen for the example of CNA in
Fig. 14.
In contrast to primary climate variables, such as global
mean surface air temperature, changes in drought are pre-
dicted to become detectable only after multiple decades, if
at all. This lag can be crucial with respect to implementing
mitigative or adaptive measures against such changes
(Pittock 1999). On the other hand, changes in annual and
seasonal means of terrestrial hydrologic variables, includ-
ing soil moisture, are essentially undetectable within the
twenty-first century. Although related studies of future
drought occurrence (e.g., Wetherald and Manabe 2002;
Wang 2005) focused on changes in the mean, such as mean
monthly precipitation or soil moisture, it has been noted
(Gregory et al. 1997; Kharin and Zwiers 2005) that changes
in the mean are accompanied by lengthening of distribution
tails and larger changes in extremes, such as drought as
shown here. The implication is that changes in the
extremes of climate and their hydrological impacts may be
more detectable than changes in mean climate, although
observing and quantifying extreme events, and comparing
them to model output, is much harder in practice (Hergerl
et al. 2006).
Despite the robustness of the changes in drought,
globally and across many regions, and for all scenarios,
there are still many uncertainties in this study that arise not
only from our approach but also from the simulations
themselves. Firstly, we have by necessity used eight
models to represent the uncertainty across models,
although 24 models contributed data for one or more sce-
narios to the IPCC AR4. The error in doing this is difficult
to quantify but our estimates are consistent with results for
a larger set of models for a single scenario (Wang 2005).
Secondly, the models themselves may be biased because of
inadequacies in the modeled physical processes and
parameterizations and because of processes that are not
included in the modeling. Such biases can generally be
evaluated by comparison with observed conditions and this
is critical for confidence to be instilled in future
projections.
Evaluation of the models’ ability to replicate observed
climate variability and the terrestrial water cycle has been
addressed elsewhere with mixed results (e.g., Dai 2006;
Frei and Gong 2005; Lau et al. 2006; Li et al. 2007;
Swenson and Milly 2006). For drought specifically, we
have shown that the models do reasonably well in
Table 5 Year of detection of statistically significant changes in
annual and seasonal mean surface air temperature and the main
components of the terrestrial water cycle (precipitation (P), evapo-
transpiration (E), runoff (Q), and soil moisture (SM)), and three
drought characteristics for the MED region under the SRES A2
scenario
Annual/No season DJF MAM JJA SON
T 2024 2041 2058 2034 2016
P 2063 – 2075 2064 2069
Q – – – 2075 2065
E – – – – –
SM – – – – –
D4–6 2049
D12+ 2038
A 2018
Also shown are the detection times for drought characteristics repe-
ated from Table 4. Note that a drought may span multiple seasons
102 J. Sheffield, E. F. Wood: Projected changes in drought occurrence under future global warming
123
replicating our best estimates of twentieth century drought
statistics at regional scales yet with large spread among the
models and a general over-estimation of drought duration
and frequency (especially for long-term drought). Note that
the off-line drought values are estimates that are subject to
uncertainty in themselves. However, we currently consider
the VIC off-line dataset our best estimate of global drought
conditions, in the most part because it has been evaluated
in terms of its depiction of large-scale drought (Sheffield
and Wood 2007), directly through assessment of historic
drought events and indirectly through validation of the
underlying hydrologic fluxes and states. Furthermore,
comparison of modeled soil moisture variability from
multiple off-line models indicates that inter-model differ-
ences are small (Guo and Dirmeyer 2006), which leads us
to believe that comparable estimates would be obtained if a
different model was used.
The reasons for the difference between the climate
models and the off-line dataset are unclear at present, and a
more detailed evaluation of these models in terms of their
representation of drought is work in progress that will be
reported elsewhere by the authors. Potential candidates for
explaining some of the differences include model biases in
the characteristics of precipitation, especially the frequency
and intensity of individual events (Dai 2006), and the
strength of land–atmosphere coupling (Dirmeyer et al.
2006), which impacts the persistence of anomalies. Climate
models may actually do better at replicating atmospheric
and large-scale climate variability (e.g., AchutaRao and
Sperber 2006), but the uncertainty in modeled land surface
processes (precipitation, soil moisture and their feedbacks
in particular) coupled with the uncertainties in future cli-
mate projections is reason to incorporate as many models
as possible in any assessment of future change.
Processes that have a direct impact on drought occur-
rence but are not present in the models include
anthropogenic forcings such as irrigation, water diversion
and land use and natural processes such as vegetation
dynamics and wildfire. Anthropogenic processes are diffi-
cult to quantify, even historically. Estimates of current day
irrigation are that 16.3% of cultivated regions are equipped
for irrigation (Siebert et al. 2005) which can have a sig-
nificant impact on the water cycle (Haddeland et al. 2007),
although historically this may have been offset by changes
in land use. The impact of vegetation dynamics, through
feedbacks with climate and interactions with climate
induced changes in plant phenology and species composi-
tion may have a profound impact on drought occurrence
through controls on water use, with potential positive
feedbacks from natural deforestation (Cox et al. 2000;
Gullison et al. 2007).
Notwithstanding the uncertainties in detectability, we
can make some final general observations regarding the
results. The consensus among this set of the latest GCM
projections of future climates is that drought frequency will
increase relative to the contemporary climate but will not
show statistically significant changes for several decades,
indicating that the impacts of climate change will not be
felt immediately at regional scales. In general, there is a
greater propensity to increased warm season drought which
may be especially pertinent when specific impacts are
taken into consideration, such as drought effects on agri-
culture that are most important during the growing season.
Drought is shown to increase under all scenarios, including
the B1 scenario that follows a reduced greenhouse gas
emission pathway through the twenty-first century relative
to the present day. The implication is that drought occur-
rence will increase, despite future emission reductions and
this will be exacerbated by the thermal inertia of the oceans
(Wigley 2005; Meehl et al. 2005) and already accumulated
greenhouse gases, which in turn will increase the time to
stabilization of concentrations. Under high emission path-
ways (A1B and A2), the magnitude of the drought changes
are expected to be even higher, but more worrisome is that
these scenarios may already be underestimating observed
changes as has been seen since the IPCC Third Assessment
Report simulations (Rhamstorf et al. 2007).
Acknowledgments This work was partly supported by U.S.
Department of Energy grant 983338. We acknowledge the modeling
groups for making their simulations available for analysis, the Pro-
gram for Climate Model Diagnosis and Intercomparison (PCMDI) for
collecting and archiving the CMIP3 model output, and the WCRP’s
Working Group on Coupled Modeling (WGCM) for organizing the
model data analysis activity. The WCRP CMIP3 multi-model dataset
is supported by the Office of Science, U.S. Department of Energy. We
would also like to thank the two anonymous reviewers for their
thoughtful comments that helped improve this work.
References
Achuta Rao K, Sperber KR (2006) ENSO simulation in coupled
ocean–atmosphere models: are the current models better? Clim
Dyn. doi:10.1007/s00382-006-0119-7
Brohan P, Kennedy JJ, Haris I, Tett SFB, Jones PD (2006)
Uncertainty estimates in regional and global observed temper-
ature changes: a new dataset from 1850. J Geophys Res
111:D12106. doi: 10.1029/2005JD006548
Burke EJ, Brown SJ, Christidis N (2006) Modeling the recent
evolution of global drought and projections for the twenty-first
century with the hadley centre climate model. J Hydrometeorol
7:1113–1125
Christensen E, Lassen K (1991) Length of the solar cycle: an indicator
of solar activity closely associated with climate. Science
254:698–700
Ciais P et al (2005) Europe-wide reduction in primary productivity
caused by the heat and drought in 2003. Nature 437:529–533
Collins M, Osborn TJ, Tett SFB, Briffa KR, Schweingruber FH
(2002) A comparison of the variability of a climate model with
paleotemperature estimates from a network of tree-ring densities.
J Clim 15:1497–1515
J. Sheffield, E. F. Wood: Projected changes in drought occurrence under future global warming 103
123
Cox PM, Betts RA, Jones CD, Spall SA, Totterdell IJ (2000)
Acceleration of global warming due to carbon-cycle feedbacks
in a coupled climate model. Nature 408:184–187
Dai A (2006) Precipitation characteristics in eighteen coupled climate
models. J Clim 19:4605–4630
Dai A, Trenberth KE, Karl TR (1998) Global variations in droughts
and wet spells: 1900–1995. Geophys Res Lett 25(17):3367–3370
Dirmeyer PA, Koster RD, Guo ZC (2006) Do global models properly
represent the feedback between land and atmosphere? J Hydro-
meteorol 7:1177–1198
Easterling DR, Meehl GA, Parmesan C, Changnon SA, Karl TR,
Mearns LO (2000) Climate extremes: observations, modeling,
and impacts. Science 289:2068–2074
Findell KL, Delworth TL (2005) A modeling study of dynamic and
thermodynamic mechanisms for summer drying in response to
global warming. Geophys Res Lett 32:L16702. doi:
10.1029/2005GL023414
Frei A, Gong G (2005) Decadal to century scale trends in North
American snow extent in coupled atmosphere–ocean General
Circulation Models. Geophys Res Lett 32:L18502
Giorgi F (2006) Climate change hot-spots. Geophys Res Lett 33:4
Giorgi F, Bi X (2005) Updated regional precipitation and temperature
changes for the 21st century from ensembles of recent AOGCM
simulations. Geophys Res Lett 32(21):4
Giorgi F, Francisco R (2000) Uncertainties in regional climate change
prediction: a regional analysis of ensemble simulations with the
HADCM2 coupled AOGCM. Clim Dyn 16:169–182
Gregory JM, Mitchell JFB, Brady AJ (1997) Summer drought in
northern midlatitudes in a time-dependent CO2 climate exper-
iment. J Clim 10:662–686
Gullison RE, Frumhoff PC, Canadell JG, Field CB, Nepstad DC,
Hayhoe K, Avissar R, Curran LM, Friedlingstein P, Jones CD,
Nobre C (2007) Tropical forests and climate policy. Science
316(5827):985. doi:10.1126/science.1136163
Guo ZC, Dirmeyer PA (2006) Evaluation of the second global soil
wetness project soil moisture simulations: 1. Intermodel com-
parison. J Geophys Res Atmos 111(D22):14
Guo Z, Dirmeyer PA, Gao X, Zhao M (2007) Improving the quality of
simulated soil moisture multi-model ensemble approach. Q J R
Meteorol Soc 133:731–747. doi:10.1002/qj.48
Haddeland I, Skaugen T, Lettenmaier DP (2007) Hydrologic effects
of land and water management in North America and Asia:
1700–1992. Hydrol Earth Sys Sci 11(2):1035–1045
Hansen J, Ruedy R, Glascoe J, Sato Mki (1999) GISS analysis of
surface temperature change. J Geophys Res 104:30997–31022.
doi: 10.1029/1999JD900835
Hansen J, Sato M, Ruedy R, Lo K, Lea DW, Medina-Elizade M
(2006) Global temperature change. Proc Natl Acad Scie USA
103:14288–14293
Hasselmann K, Latif M, Hooss G, Azar C, Edenhofer O, Jaeger CC,
Johannessen OM, Kemfert C, Welp M, Wokaun A (2003) The
challenge of long-term climate change. Science 302:1923–1925
Hegerl GC, Karl TR, Allen M, Bindoff NL, Gillett N, Karoly D, Zhang
XB, Zwiers F (2006) Climate change detection and attribution:
beyond mean temperature signals. J Clim 19:5058–5077
Held IM, Soden BJ (2000) Water vapor feedback and global warming.
Ann Rev Energy Environ 25:441–475
Higgins RW, Leetmaa A, Xue Y, Barnston A (2000) Dominant
factors influencing the seasonal predictability of US precipitation
and surface air temperature. J Clim 13:3994–4017
Hulme M, New M (1997) Dependence of large-scale precipitation
climatologies on temporal and spatial sampling. J Clim 10:1099–
1113
Hulme M, Barrow EM, Arnell NW, Harrison PA, Johns TC, Downing
TE (1999) Relative impacts of human-induced climate change
and natural climate variability. Nature 397:688–691
Hunt BG (2006) The medieval warm period, the little ice age and
simulated climatic variability. Clim Dyn 27:677–694
Huntington TG (2006) Evidence for intensification of the global water
cycle: review and synthesis. J Hydrol 319:83–95
IPCC (2001) Climate change 2001: the scientific basis. In: Houghton
JT et al (eds) Contribution of Working Group I to the Third
Assessment Report of the Intergovernmental Panel on Climate
Change. Cambridge University Press, Cambridge, 944 pp
IPCC (2007) Climate change 2007: the physical science basis. In:
Solomon S, Qin D, Manning M, Chen Z, Marquis M, Averyt KB,
Tignor M, Miller HL (eds) Contribution of Working Group I to
the fourth assessment report of the intergovernmental panel on
climate change. Cambridge University Press, Cambridge, 996 pp
Jansen E, Overpeck J, Briffa KR, Duplessy J-C, Joos F, Masson-
Delmotte V, Olago D, Otto-Bliesner B, Peltier WR, Rahmstorf
S, Ramesh R, Raynaud D, Rind D, Solomina O, Villalba R,
Zhang D (2007) Palaeoclimate. In: Solomon S, Qin D, Manning
M, Chen Z, Marquis M, Averyt KB, Tignor M, Miller HL (eds)
Climate change 2007: the physical science basis. Contribution of
Working Group I to the fourth assessment report of the
intergovernmental panel on climate change. Cambridge Univer-
sity Press, Cambridge
Jones PD, Moberg A (2003) Hemispheric and large-scale surface air
temperature variations: an extensive revision and an update to
2001. J Clim 16:206–223
Jones PD, New M, Parker DE, Martin S, Rigor IG (1999) Surface air
temperature and its variations over the last 150 years. Rev
Geophys 37:173–199
King DA (2004) Climate change science:adapt, mitigate, or ignore?
Science 303:176–177
Kharin VV, Zwiers FW (2005) Estimating extremes in transient
climate change simulations. J Clim 18:1156–1173
Lau K-M, Shen S, Kim K-M, Wang H (2006) A multi-model study of
the 20th century simulations of Sahel drought from the 1970s to
1990s. J Geophys Res 111:D0711. doi: 10.1029/2005JD006281
Li H, Robock A, Wild M (2007) Evaluation of intergovernmental
panel on climate change fourth assessment soil moisture
simulations for the second half of the twentieth century. J
Geophys Res 112:D06106. doi: 10.1029/2006JD007455
Maurer EP, Wood AW, Adam JC, Lettenmaier DP, Nijssen B (2002)
A long-term hydrologically-based data set of land surface fluxes
and states for the conterminous United States. J Clim 15:3237–
3251
McCabe GJ Jr, Wolock DM (1997) Climate change and the detection
of trends in annual runoff. Clim Res 8:129–134
Meehl GA et al (2005) How much more global warming and sea level
rise? Science 307(5716):1769–1772
Mitchell KE, 22 coauthors (2004) The multi-institution North
American Land Data Assimilation System (NLDAS): Utilizing
multiple GCIP products and partners in a continental distributed
hydrological modeling system. J Geophys Res 109:D07S90. doi:
10.1029/2003JD003823
Nakicenovic N, Davidson O, Davis G, Grubler A, Kram T, Rovere
ELL, Metz B, Morita T, Pepper W, Pitcher H, Sankovski A,
Shukla P, Swart R, Watson R, Dadi Z (2000) Emissions
scenarios—summary for policymakers. Intergovernmental Panel
on Climate Change, Geneva
NRC (2003) Understanding climate change feedbacks. Report of the
Panel on Climate Change Feedbacks, National Research Coun-
cil. National Academies Press, Washington, 166pp
Osborn T, Briffa KR (2006) The spatial extent of 20th-century
warmth in the context of the past 1200 years. Science 311:841–
844
Palmer TN, Raisanen J (2002) Quantifying the risk of extreme
seasonal precipitation events in a changing climate. Nature
415:512–514
104 J. Sheffield, E. F. Wood: Projected changes in drought occurrence under future global warming
123
Pittock AB (1999) Climate change: the question of significance.
Nature 397:657–658
Rahmstorf S, Cazenave A, Church JA, Hansen JE, Keeling RF, Parker
DE, Somerville RCJ (2007) Recent climate observations com-
pared to projections. Science 316(5825):709
Rind D, Goldberg R, Hansen J, Ruedy C, Rosenzweig C (1990)
Potential evapotranspiration and the likelihood of future drought.
J Geophys Res 95:9983–10004
Robock A, Mao J (1995) The volcanic signal in surface temperature
observations. J Clim 8:1086–1103
Robock A, Vinnikov KY, Srinivasan G, Entin JK, Hollinger SE,
Speranskaya NA, Liu SX, Namkhai A (2000) The global soil
moisture data bank. Bull Am Meteorol Soc 81:1281–1299
Seneviratne SI, Luthi D, Litschi M, Schar C (2006a) Land–atmosphere
coupling and climate change in Europe. Nature 443:205–209
Seneviratne SI, Koster RD, Guo ZC, Dirmeyer PA, Kowalczyk E,
Lawrence D, Liu P, Lu CH, Mocko D, Oleson KW, Verseghy D
(2006b) Soil moisture memory in AGCM simulations: analysis
of global land–atmosphere coupling experiment (GLACE) data.
J Hydrometeorol 7:1090–1112
Sheffield J, Wood EF (2007) Characteristics of global and regional
drought, 1950–2000: analysis of soil moisture data from off-line
simulation of the terrestrial hydrologic cycle. J Geophys Res
112:D17115. doi: 10.1029/2006JD008288
Siebert S, Doll P, Hoogeveen J, Faures J-M, Frenken K, Feick S
(2005) Development and validation of the global map of
irrigation areas. Hydrol Earth Syst Sci 9:535–547
Sheffield J, Goteti G, Wen F, Wood EF (2004) A simulated soil
moisture based drought analysis for the United States. J Geophys
Res 109:D24108. doi: 10.1029/2004JD005182
Sheffield J, Goteti G, Wood EF (2006) Development of a 50-year
high-resolution global dataset of meteorological forcings for land
surface modeling. J Clim 19:3088–3111
Swenson SC, Milly PCD (2006) Climate model biases in seasonality
of continental water storage revealed by satellite gravimetry.
Water Resour Res 42:W03201. doi: 10.1029/2005WR004628
Trenberth KE (1999) Atmospheric moisture recycling: role of
advection and local evaporation. J Clim 12:1368–1381
Trenberth KE, Hurrell JW (1994) Decadal atmosphere–ocean vari-
ations in the Pacific. Clim Dyn 9:303
Wang GL (2005) Agricultural drought in a future climate: results
from 15 global climate models participating in the IPCC 4th
assessment. Clim Dyn 25:739–753
Wetherald RT, Manabe S (1995) The mechanisms of summer dryness
induced by greenhouse warming. J Clim 8:3096–3108
Wetherald RT, Manabe S (1999) Detectability of summer dryness
caused by greenhouse warming. Climatic Change 43:495–511
Wetherald RT, Manabe S (2002) Simulation of hydrologic changes
associated with global warming. J Geophys Res 107(D19):4379
Wigley TML (2005) The climate change commitment. Science
307(5716):1766–1769
Wilhite DA (2000) Drought as a natural hazard: concepts and
definitions. In: Wilhite DA (Ed) Drought: a global assessment.
Routledge, New York, pp 3–18
Wood EF, Lettenmaier DP, Liang X, Lohmann D, Boone A, Chang S,
Chen F, Dai YJ, Dickinson RE, Duan QY, Ek M, Gusev YM,
Habets F, Irannejad P, Koster R, Mitchell KE, Nasonova ON,
Noilhan J, Schaake J, Schlosser A, Shao YP, Shmakin AB,
Verseghy D, Warrach K, Wetzel P, Xue YK, Yang ZL, Zeng QC
(1998) The project for intercomparison of land-surface param-
eterization schemes (PILPS) phase 2(c) Red-Arkansas River
basin experiment: 1. Experiment description and summary
intercomparisons. Global Planet Change 19:115–135
Zheng X, Basher RE (1999) Structural time series models and trend
detection in global and regional temperature series. J Clim
12:2347–2358
Ziegler AD, Sheffield J, Maurer EP, Nijssen B, Wood EF,
Lettenmaier DPL (2003) Detection of intensification in global-
and continental-scale hydrological cycles: temporal scale of
evaluation. J Clim 16:535–547
J. Sheffield, E. F. Wood: Projected changes in drought occurrence under future global warming 105
123