a global picture of drought occurrence, magnitude, and preparedness
DESCRIPTION
Nishadi Eriyagama, Vladimir Smakhtin and Nilantha Gamage, International Water Management Institute (IWMI), Colombo, Sri Lanka, Second International Conference on Drought Managementm, Istanbul, Turkey, March, 2010TRANSCRIPT

A GLOBAL PICTURE OF DROUGHT OCCURRENCE, MAGNITUDE, AND PREPAREDNESS
Nishadi Eriyagama, Vladimir Smakhtin and Nilantha Gamage
International Water Management Institute (IWMI), Colombo, Sri Lanka
Second International Conference on Drought Management
Istanbul, Turkey
March, 2010

OBJECTIVE AND RATIONALE
To examine the global patterns and impacts of droughts as an individual natural disaster
Why?
Affect all world regions
Severe social and economic impacts, especially in developing countries
Studies that map global patterns, impacts of droughts are limited or non-existent
Climate change: more frequent, more severe and longer lasting droughts

METHODOLOGY
How?
Mapped 14 drought related characteristics and indices
Cover various aspects: meteorology, social vulnerability, drought preparedness
At either country scale or a regular grid scale
Produced by integrating about 15 publicly available global data sets:
• AQUASTAT (FAO)• Gridded Population of the World (Columbia University)• University of East Anglia (CRU* data)• World Register of Dams (International Commission on
Large Dams)
*CRU- Climate Research Unit

SOME EXAMPLE INDICES
Mean Annual Precipitation and variability
Per Capita Mean Annual River Discharge
Agricultural Water Crowding
Drought Risk Index
Mean Drought Run Duration
Infrastructure Vulnerability Index
Socioeconomic Drought Vulnerability Index
Storage-Drought Duration Index
Storage-Drought Deficit Index
Source: Figures created by N.Eriyagama (IWMI),2008 using data from AQUASTAT, ProdSTAT, Gridded Population of the World (Columbia University), University of East Anglia and the World Register of Dams (International Commission on Large Dams etc.

MEAN ANNUAL PRECIPITATION, COEFFICIENT OF VARIABILITY & DROUGHT
Mean Annual Precipitation
Coefficient of Variability (CV) of Mean Annual Precipitation
Probability (%) of annual precipitation in any year being less than 75% of its long term mean
Naturally arid and semi-arid areas have higher CV and higher probability of drought occurrence
Source: Figures created by N.Eriyagama (IWMI),2008 using data from AQUASTAT, ProdSTAT, Gridded Population of the World (Columbia University), University of East Anglia and the World Register of Dams (International Commission on Large Dams) etc.

DROUGHT RISK INDEX
Precipitation Drought Risk Index
Measure of frequency of drought occurrence and drought intensity (after Hashimoto et al. 1982 and Zongxue et al. 1998) Range: 0-1
River Discharge Drought Risk Index
•River discharge drought risk higher than precipitation drought risk •Naturally arid and semi arid areas show higher drought risk
•Europe: “better-off” Africa: the worst case
Source: Figures created by N.Eriyagama (IWMI),2008 using data from AQUASTAT, ProdSTAT, Gridded Population of the World (Columbia University) , University of East Anglia and the World Register of Dams (International Commission on Large Dams) etc.

STORAGE DROUGHT DURATION INDEX (SLI)
What proportion of the annual hydrological drought duration can a country’s present storage satisfy, based on its monthly water needs
If SLI>=1: Satisfactory Storage (green and blue)
Source: Figure created by N.Eriyagama (IWMI),2008 using data from AQUASTAT, ProdSTAT, Gridded Population of the World (Columbia University) , University of East Anglia and the World Register of Dams (International Commission on Large Dams) etc.

STORAGE DROUGHT DEFICIT INDEX (SDI)
What proportion of the annual hydrological drought deficit can a country’s present storage satisfy, based on its monthly water needs
If SDI>=1: Susceptible to river fragmentation, overexploitation of freshwater resources (dark green and blue)
Source: Figure created by N.Eriyagama (IWMI),2008 using data from AQUASTAT, ProdSTAT, Gridded Population of the World (Columbia University), University of East Anglia and the World Register of Dams (International Commission on Large Dams) etc.
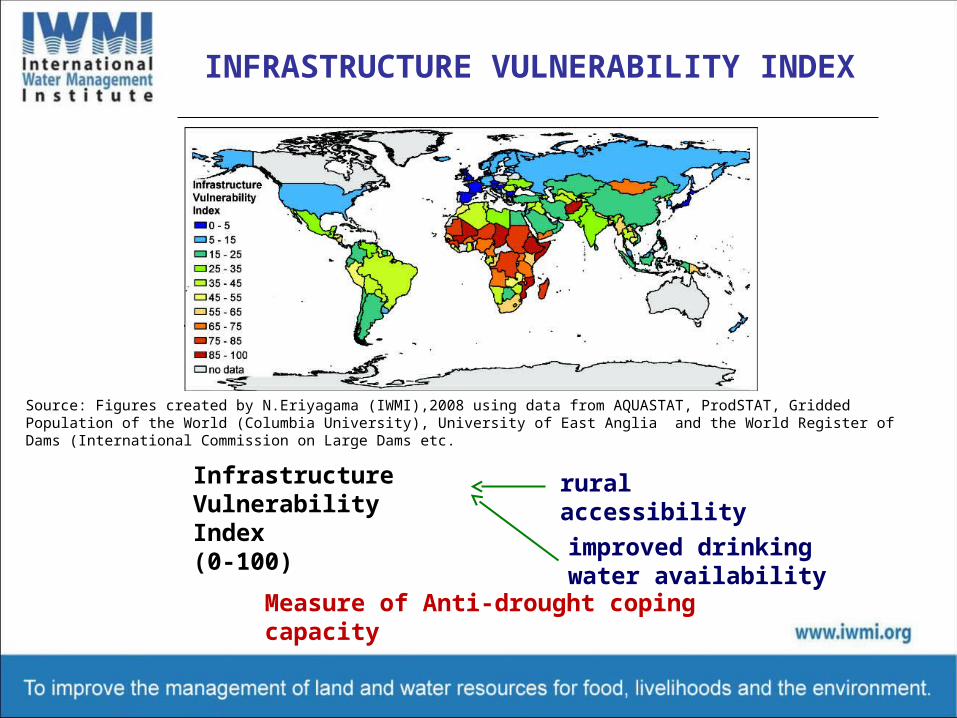
INFRASTRUCTURE VULNERABILITY INDEX
Infrastructure Vulnerability Index(0-100)
rural accessibility
improved drinking water availability
Measure of Anti-drought coping capacity
Source: Figures created by N.Eriyagama (IWMI),2008 using data from AQUASTAT, ProdSTAT, Gridded Population of the World (Columbia University), University of East Anglia and the World Register of Dams (International Commission on Large Dams etc.
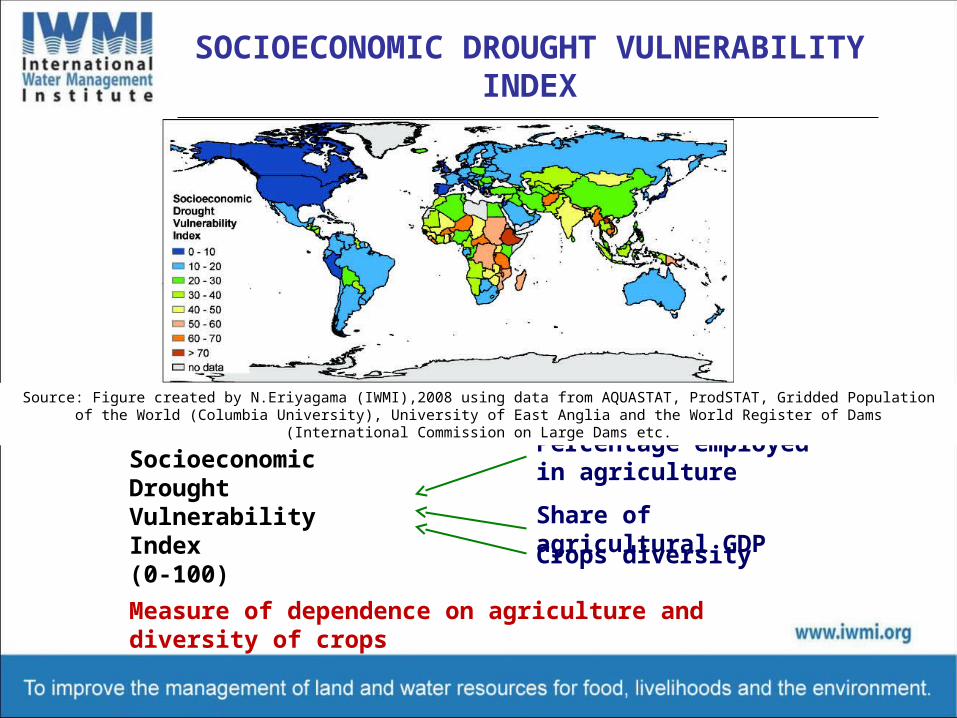
SOCIOECONOMIC DROUGHT VULNERABILITY INDEX
Measure of dependence on agriculture and diversity of crops
Percentage employed in agriculture
Share of agricultural GDP
Crops diversity
Socioeconomic Drought Vulnerability Index(0-100)
Source: Figure created by N.Eriyagama (IWMI),2008 using data from AQUASTAT, ProdSTAT, Gridded Population of the World (Columbia University), University of East Anglia and the World Register of Dams (International Commission on Large Dams etc.

SOME KEY MESSAGES (1)
• Naturally arid and semi-arid areas: higher probability of drought occurrence
• Generally river discharge drought risk is higher than precipitation drought risk
• Areas more prone to multi-year hydrological droughts: Majority of Africa; South, Southwest, Central Asia; and northern Australia
• Out of them, Australia and southern Africa appear to have sufficient storage to satisfy their water needs during drought
• South and Central Asia have no apparent hydrological barriers for increasing storage in the future

SOME KEY MESSAGES(2)
• In drought years the highest per capita water losses occur in areas which are not normally water scarce due to climate
• Potential for rainwater use in agriculture which could be tapped with increased rainwater harvesting
• Agricultural economies (Asia and Africa) are much more vulnerable to adverse societal impacts of meteorological droughts
• The African continent lags behind the rest of the world on many indicators related to drought preparedness

CONCLUSIONS AND THE WAY FORWARD
• It is hoped that this study may:• develop into a Global Drought Indicators ‘Atlas’ • feed into operational drought tools (drought monitoring, drought early
warning systems) and national drought preparedness plans • Future research should concentrate on:
• quantifying and indexing vulnerability to droughts within countries and at local and household levels to identify vulnerable regions or populations
• the differences between short term and long term droughts (impacts and response options)
• identifying how some of the mapped indices might change with climate change

THANK YOU!
http://www.iwmi.cgiar.org/Publications/IWMI_Research_Reports/PDF/PUB133/RR133.aspx
Reference: Eriyagama, Nishadi; Smakhtin, Vladimir; Gamage, Nilantha. 2009. Mapping drought patterns and impacts: a global perspective. Colombo, Sri Lanka: International Water Management Institute (IWMI). 23p. (IWMI Research Report 133) doi: 10.3910/2009.132
http://dx.doi.org/10.3910/2009.132