the occurrence, productionand projected …the following reference format is recommended: edwards,...
TRANSCRIPT

The Occurrence, Productionand Projected Consumptionof Sand and Gravel in theMunicipal District of Foothills
EUB/AGS Information Series 135

EUB/AGS Information Series 135
The Occurrence, Production and Projected Consumption of Sand and Gravel in the Municipal District of Foothills
W.A.D. Edwards1 and H.D. Budney2 1Alberta Energy and Utilities Board/Alberta Geological Survey2Simon Fraser University
January 2007

EUB/AGS Information Series 135 (January 2007) • ii
©Her Majesty the Queen in Right of Alberta, 2007ISBN 0-7785-1503-6
The Alberta Energy and Utilities Board/Alberta Geological Survey (EUB/AGS) and its employees and contractors make no warranty, guarantee or representation, express or implied, or assume any legal liability regarding the correctness, accuracy, completeness or reliability of this publication. Any digital data and software supplied with this publication are subject to the licence conditions. The data are supplied on the understanding that they are for the sole use of the licensee, and will not be redistributed in any form, in whole or in part, to third parties. Any references to proprietary software in the documentation, and/or any use of proprietary data formats in this release, do not constitute endorsement by the EUB/AGS of any manufacturer's product.When using information from this publication in other publications or presentations, due acknowledgment should be given to the EUB/AGS. The following reference format is recommended:
Edwards, W.A.D. and Budney, H.D. (2006): The occurrence, production and projected consumption of sand and gravel in the Municipal District of Foothills; Alberta Energy and Utilities Board, EUB/AGS INF 135, 17 p.
Author AddressH.D. Budney School of Resource and Environmental ManagementSimon Fraser University8888 University Drive Burnaby, British Columbia V5A 1S6CanadaE-mail: [email protected]
Published January 2007 by:Alberta Energy and Utilities BoardAlberta Geological Survey4th Floor, Twin Atria Building4999 – 98th AvenueEdmonton, AlbertaT6B 2X3Canada
Tel: (780) 422-3767 (Information Sales)Fax: (780) 422-1918E-mail: [email protected]: www.ags.gov.ab.ca

EUB/AGS Information Series 135 (January 2007) • iii
Contents Acknowledgments ....................................................................................................................................... vAbstract ....................................................................................................................................................... vi1 Sand and Gravel Resources .................................................................................................................. 12 Aggregate Resource Production and Consumption ........................................................................... 83 Aggregate Resource Issues ...................................................................................................................15
3.1 Trucking ..........................................................................................................................................153.2 Environment ...................................................................................................................................153.3 Export .............................................................................................................................................153.4 Community Aggregate Payment ....................................................................................................153.5 Crushed Stone .................................................................................................................................16
4 Conclusions ............................................................................................................................................165 Recommendations .................................................................................................................................166 References ..............................................................................................................................................17
Tables1 Sand and gravel volume estimates according to Alberta Geological Survey data .................................32 Sand and gravel volume estimates based on collaboration between the Municipal District of Foothills and Alberta Geological Survey ................................................................................................33 Gravel volume estimates based on collaboration between the Municipal District of Foothills and Alberta Geological Survey ................................................................................................54 Sand and gravel volume estimates according to Municipal District of Foothills and Alberta Geological Survey data with a 100 m no development buffer on rivers and lakes .................................55 Estimated sand and gravel volumes zoned INN with a 100 m no development buffer on rivers and lakes, based on Municipal District of Foothills and Alberta Geological Survey data ...........86 Populations and aggregate consumption rates used for aggregate resource modelling ........................107 Estimates of total potential sand and gravel resources relative to the Municipal District of Foothills aggregate consumption centre ...........................................................................................128 Estimates of reasonably recoverable sand and gravel resources relative to the Municipal District of Foothills aggregate consumption centre ..............................................................................129 Estimates of total potential gravel resources relative to the Municipal District of Foothills aggregate consumption centre ...............................................................................................................1310 Estimates of reasonably recoverable gravel resources relative to the Municipal District of Foothills aggregate consumption centre ...............................................................................................1311 Cost of hauling aggregate to the Municipal District of Foothill's consumption centre from 2005 to 2031 assuming haul rate remains constant ...................................................................... 1412 Cost of hauling aggregate to the Municipal District of Foothill's consumption centre from 2005 to 2031 assuming haul rate increases with time .................................................................. 1413 Aggregate production cost in the MD of Foothills from 2005 to 2031 assuming production cost remains constant .......................................................................................................... 1414 Aggregate production cost in the MD of Foothills from 2005 to 2031 assuming production cost increases with time ...................................................................................................... 14
FiguresFigure 1 Sand and gravel areas with aggregate resource potential as identified by the Alberta Geological Survey, Municipal District of Foothills, Alberta.........................................2

EUB/AGS Information Series 135 (January 2007) • iv
Figure 2 Sand and gravel areas with aggregate resource potential as identified by the Alberta Geological Survey and Municipal District of Foothills ..............................................................4Figure 3 Sand and gravel areas with aggregate resource potential and a 100 m no development buffer around rivers and lakes ...............................................................................6Figure 4 Areas zoned for industrial natural resource development (INN) with a 100 m no development buffer around rivers and lakes ..........................................................................7Figure 5 Location of aggregate deposits relative to the primary aggregate consumption location ..........9Figure 6 Sand and gravel consumption (2005-2031) and recoverable resources in the Municipal District of Foothills ..................................................................................................10Figure 7 Gravel consumption (2005-2031) and recoverable resources in the Municipal District of Foothills .................................................................................................. 11

EUB/AGS Information Series 135 (January 2007) • v
Acknowledgments
This project was undertaken specifically to provide the Municipal District of Foothills with information on sand and gravel resources within the municipality for the effective and sustainable development of the municipality’s aggregate resources in the future. The project was successful due to the dedicated efforts of Municipal District of Foothills staff Harry Riva Cambrin (municipal manager), Dan Ellice (public works superintendent) and Johanna Kortenschyl-Allan (GIS specialist). Inland Aggregates Ltd., Burnco Rock Products Ltd., McHugh Sand and Gravel, Wallator Sand and Gravel and other local sand and gravel operations are thanked for providing access to their pits for geological mapping. We thank those residents of the Municipal District of Foothills that provided information on sand and gravel or access to their land. Bill Symmonds, Alberta Municipal Affairs, and Don Peel, Alberta Sustainable Development deserve special mention for their efforts in supporting this initiative. Joanne Sweeney, Alberta Sustainable Development, and Kathleen Edwards, Alberta Geological Survey summer student, are thanked for their assistance with fieldwork. Cal Hill, Joe MacGillivray, Rick Marsh, Andy Warren, Rick Richardson and Reg Olson, all of the Alberta Energy and Utilities Board, are thanked for their support and encouragement. A report entitled "The Occurrence, Production and Projected Consumption of Sand and Gravel in the Municipal District of Foothills" was issued to the Municipal District of Foothills on June 23, 2004. This report contains the same information, analyses and conclusions as the earlier report.

EUB/AGS Information Series 135 (January 2007) • vi
Abstract
The Municipal District of Foothills is estimated to have 79 million m3 of sand and gravel resources zoned for aggregate extraction. At modestly increasing consumption rates, these reserves will be exhausted in 15 years. As reserves are depleted, the cost to transport each tonne of resource will triple as haul distances increase from about 14 km to more than 40 km. This scenario is inevitable unless additional resources are identified and conserved, and producing pits developed.
In 2003, the Alberta Geological Survey, in collaboration with the municipality, identified 446 deposits containing at least 317,780,000 m3 of sand and gravel during the update of a sand and gravel inventory of the Municipal District of Foothills. Depletion of nearby resources could be delayed and haul costs reduced by developing some of these deposits for aggregate.
The low-unit price of sand and gravel (~$5.79 per tonne) and common applications (roads, bridges, foundations) often conceal the fact that sand and gravel is a major mineral resource and aggregate an essential commodity. For example, the current, in-ground value of sand and gravel identified during the preliminary sand and gravel inventory could be in excess of $5 billion. This would equate to a community aggregate payment to the Municipal District of Foothills of $217 million (at $0.25 per tonne). If all deposits were developed the transportation costs to haul aggregate to market areas could be minimized to about $2 billion and the life of sand and gravel resources in the municipality extended beyond 2050.
The Municipal District of Foothills can control aggregate production and transportation costs, limit environmental and safety hazards associated with sand and gravel development, and determine aggregate resource revenue by maintaining the sand and gravel inventory that was updated in 2003 and devise a sand and gravel development strategy.

EUB/AGS Information Series 135 (January 2007) • 1
1 Sand and Gravel Resources
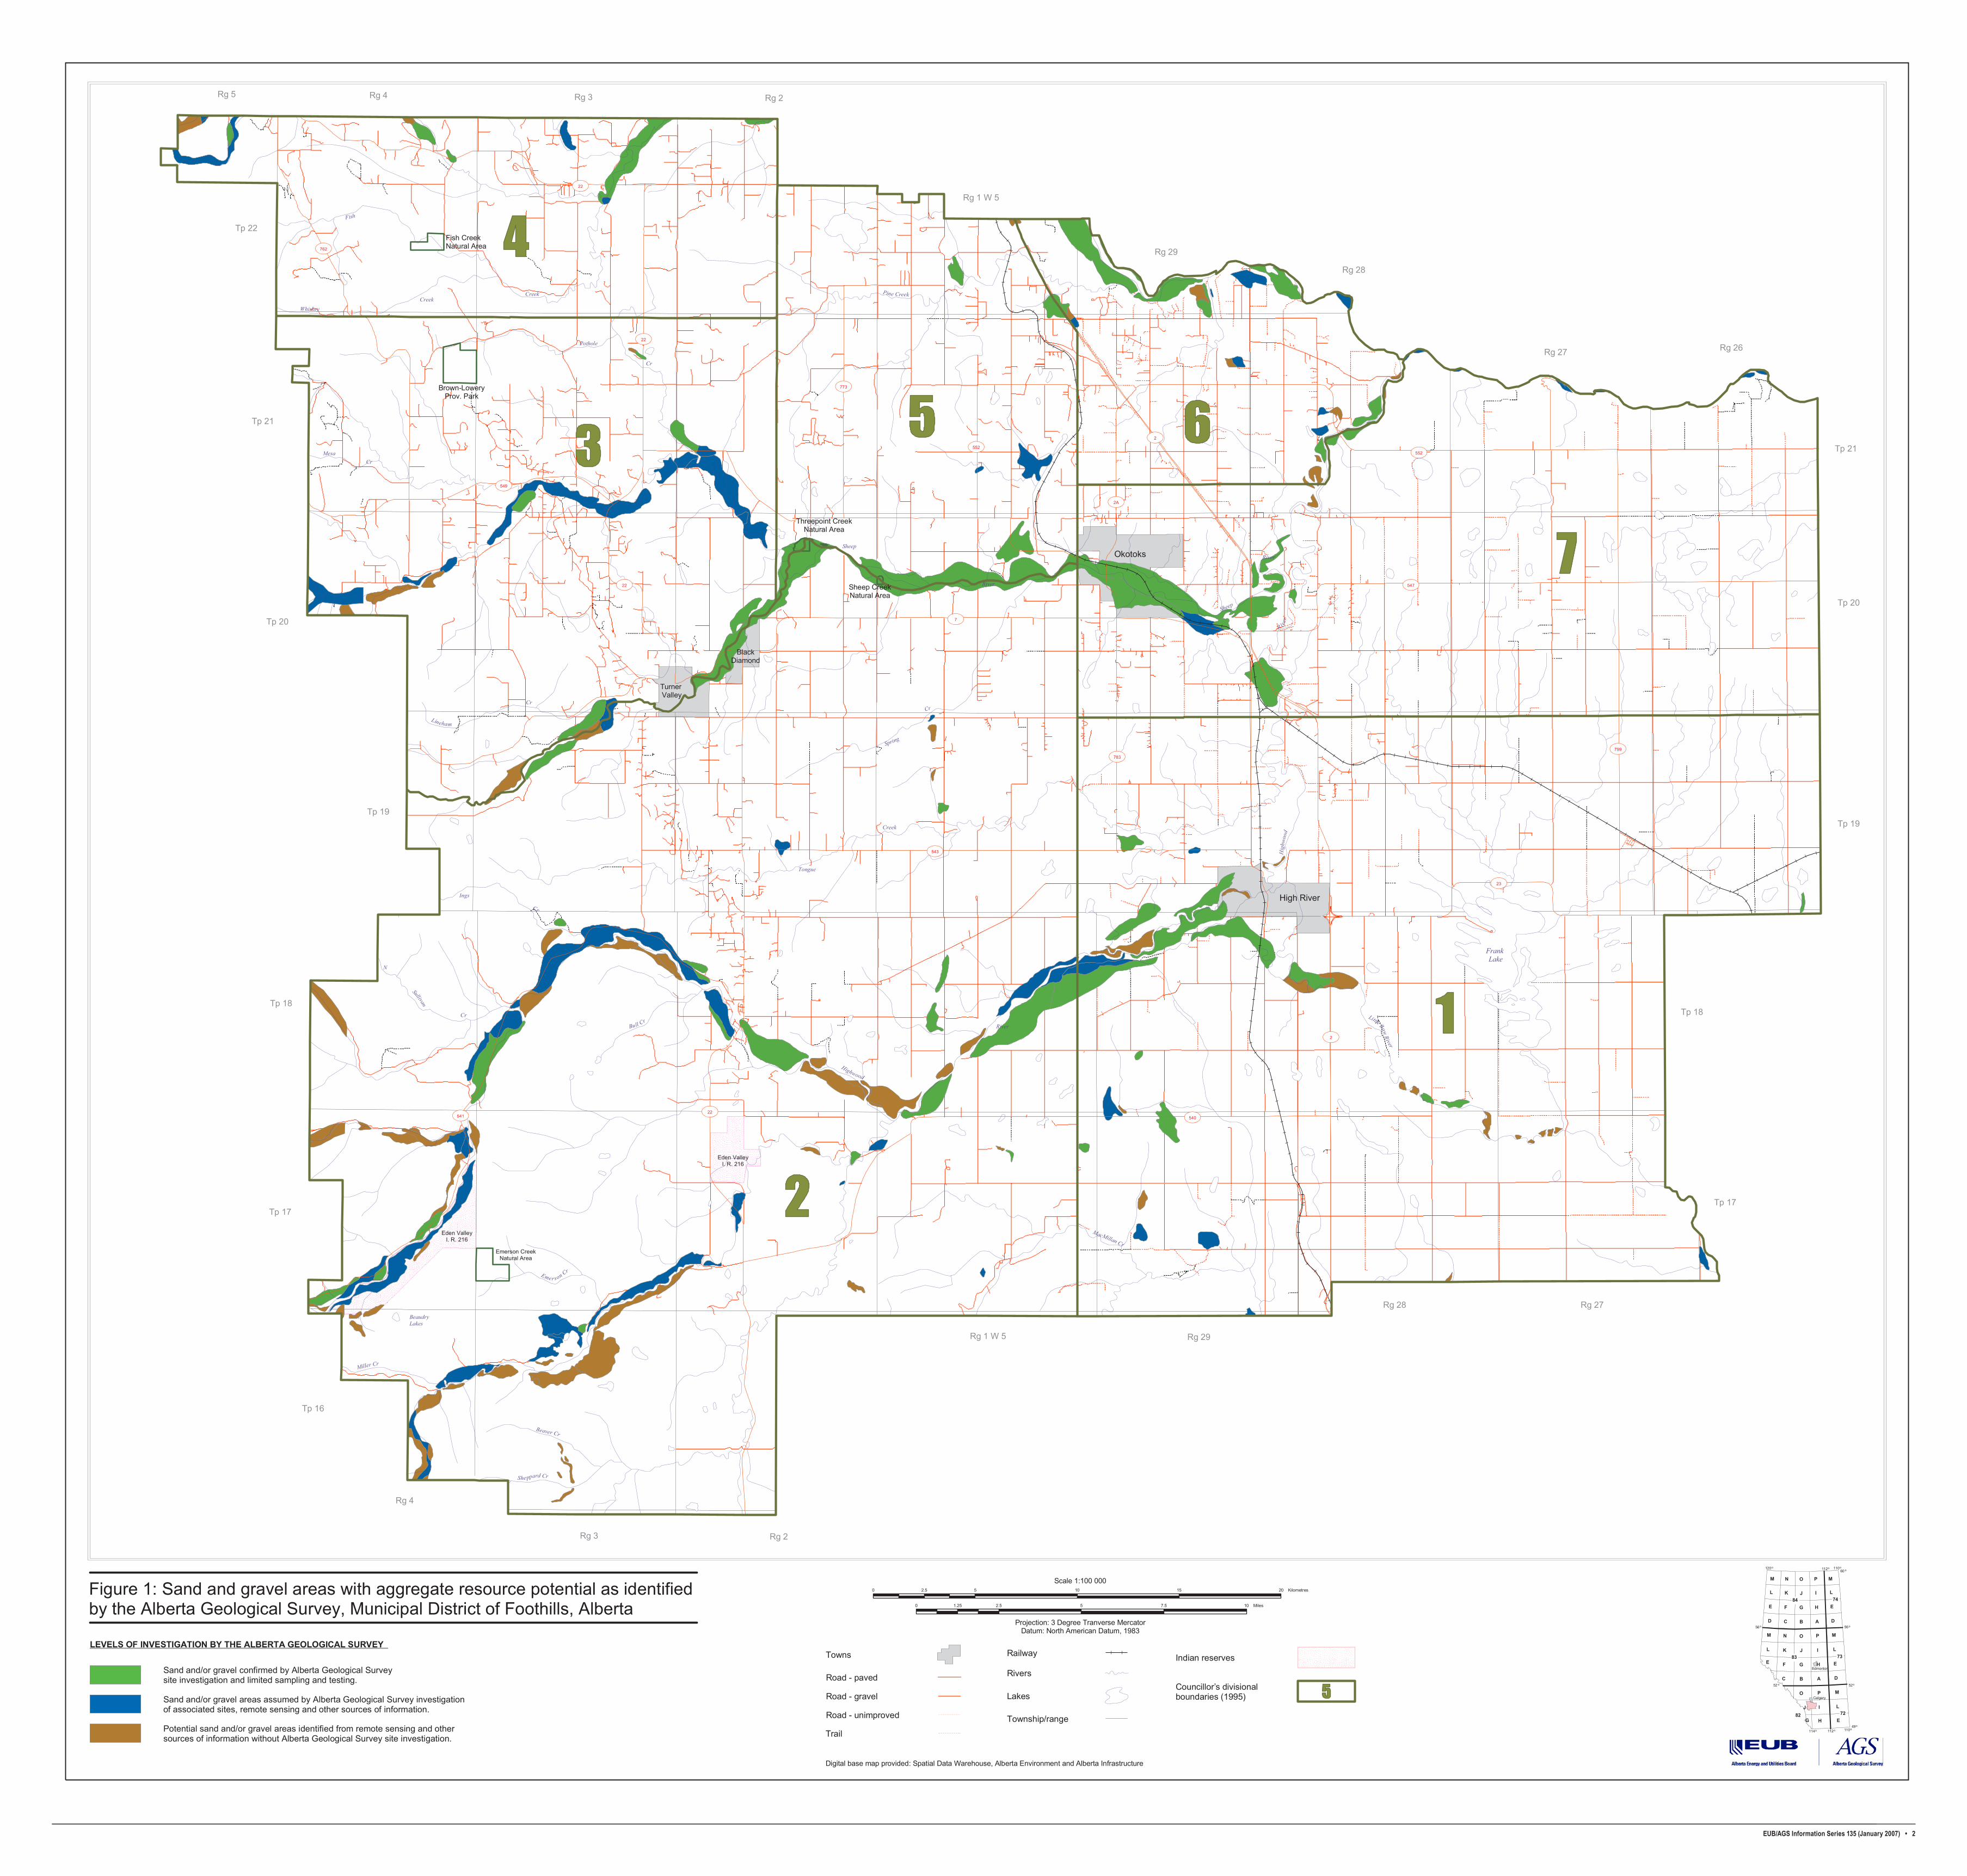
The Alberta Geological Survey (AGS) mapped and published information on sand and gravel deposits in and around the Municipal District of Foothills in 1979 (Edwards), 1981 (Shetsen, 1981a, 1981b, 1981c and 1981d), 1982 (Fox), 1987 (Shetsen) and 1996 (Edwards and Scafe). In 2003, the potential resources identified in these earlier studies were consolidated and a field review undertaken. Based on this review the amount of sand and gravel estimated to have aggregate potential in the Municipal District of Foothills ranges from 541,318,000 m3 (total potential) to 286,382,000 m3 (reasonably expected to produce aggregate) (Table 1 and Figure 1). The wide range in the estimates cited is due to the nature of the original surveys (reconnaissance, enhanced reconnaissance or site visited) and the reasonable expectation of recovery of aggregate resources from deposits.
AGS surveys used to identify sand and gravel deposits in the Municipal District of Foothills are defined as follows:
• Reconnaissance: sand and gravel areas were identified from remote sensing and/or other information without Alberta Geological Survey site investigation of the area. There is potential for the occurrence of sand and/or gravel.
• Enhanced reconnaissance: sand and gravel areas assumed to contain sand and/or gravel based on Alberta Geological Survey investigation of other sites in the area, remote sensing and/or other sources of information.
• Site visited: sand and/or gravel with resource potential were confirmed in these deposits by Alberta Geological Survey site investigation and limited sampling and/or testing.
Amounts are estimated as volumes. The volume of each deposit is calculated by multiplying the area of the deposit by its thickness. All area and thickness values are estimates that depend on the precision of the original mapping and the field review. The total volume estimate assumes there is no uncertainty in the area and thickness values and is not adjusted for the nature of the original survey. A second estimate that more closely reflects expected recovery applies a reduction factor to the volumes of certain deposits to illustrate the uncertainty of deposit area and thickness.
The reasonable expectation of recovery of aggregate resources from deposits described by the AGS is based on experience gained by tracking the development of deposits over a twenty-five period. This experience shows that the aggregate resources mined from areas estimated to have potential by the AGS are less than originally estimated depending on the level of the original survey. The reduction factor applied is generated from the mapping information as follows:
• Reconnaissance level: in general, aggregate is recovered from only one in ten deposits original identified as having potential based on reconnaissance study; in other words only ~10% of the originally estimated volume is recoverable.
• Enhanced reconnaissance level: in general, aggregate is recovered from four in ten deposits original identified as having potential based on enhanced reconnaissance study; in other words only ~25% of the originally estimated volume is recoverable.
• Site visited level: all deposits contain granular materials and in general, ~75% of the originally estimated volume is recoverable.
EUB/AGS Information Series 135 (January 2007) • 2
Rg 5 Rg 4 Rg 3 Rg 2
Rg 1 W 5
Rg 29
Rg 28
Rg 27 Rg 26
Rg 27Rg 28
Rg 29Rg 1 W 5
Rg 2Rg 3
Rg 4
Tp 22
Tp 21
Tp 20
Tp 19
Tp 18
Tp 17
Tp 16
Tp 17
Tp 18
Tp 19
Tp 20
Tp 21
22
549
773
7
547
552
799
23
54022
541
543
783
2A
552
22
762
22
2
2
MacMillan Cr
Hig
hwoo
d
R iver
Sheep
River
River
Cr
Creek
Pothole
Cr
MesaCr
Whiskey
Creek
Lineham
Cr
Bull Cr
Beaver Cr
Frank Lake
Little BowRiver
Pine Creek
Emerson Cr
Sheppard Cr
Miller Cr
BeaudryLakes
N
Sullivan
Cr
Ings
Cr
Tongue
Spring
Sheep
Creek
Fish
Highwood
River
Okotoks
Turner Valley
BlackDiamond
High River
Emerson CreekNatural Area
Sheep CreekNatural Area
Threepoint CreekNatural Area
Brown-LoweryProv. Park
Fish CreekNatural Area
Eden ValleyI. R. 216
Eden ValleyI. R. 216
114o 110o112o49o
52o
56o
60 o110o112o120o
56o
52 o
Edmonton
Calgary
Figure 1: Sand and gravel areas with aggregate resource potential as identified by the Alberta Geological Survey, Municipal District of Foothills, Alberta
Sand and/or gravel confirmed by Alberta Geological Surveysite investigation and limited sampling and testing.
Sand and/or gravel areas assumed by Alberta Geological Survey investigation of associated sites, remote sensing and other sources of information.
Potential sand and/or gravel areas identified from remote sensing and other sources of information without Alberta Geological Survey site investigation.
LEVELS OF INVESTIGATION BY THE ALBERTA GEOLOGICAL SURVEY
Scale 1:100 000
0 2.5 5 7.5 101.25 Miles
Projection: 3 Degree Tranverse MercatorDatum: North American Datum, 1983
0 5 10 15 202.5 Kilometres
Digital base map provided: Spatial Data Warehouse, Alberta Environment and Alberta Infrastructure
Towns
Road - paved
Road - gravel
Road - unimproved
Trail
Railway
Rivers
Lakes
Township/range
Indian reserves
Councillor’s divisional boundaries (1995)

EUB/AGS Information Series 135 (January 2007) • 3
Table 1. Sand and gravel volume estimates according to Alberta Geological Survey data
Alberta Geological Survey Levels of Investigation
Total Volume (000’s m3)Reconnaissance
(000’s m3)
Enhanced Reconnaissance
(000’s m3)
Site Visited (000’s m3)
91208 120643 329467 541318 total volume of material9121 30161 247100 286382 expected recovery
The Municipal District of Foothills has also identified areas with sand and gravel potential. We consider this assurance of development and for the purposes of this study completely recoverable. Adding the Municipal District of Foothills information to our data set and applying it to jointly identified areas increased the overall expected recovery estimates by 31,398,000 m3 (Table 2, Figure 2).
Table 2. Sand and gravel volume estimates based on collaboration between the Municipal District of Foothills and Alberta Geological Survey
Alberta Geological Survey Levels of Investigation
MD of Foothills (000's m3)
Total Volume (000’s m3)Reconnaissance
(000's m3)
Enhanced Reconnaissance
(000’s m3)
Site Visited (000’s m3)
87125 102830 272013 79350 541318 total volume
8713 25708 204010 79350 317780 expected recovery
The Municipal District of Foothills is estimated to have between 182,432,000 m3 and 303,135,000 m3 of gravel with aggregate potential (Table 3). There is an important distinction to be made between gravel resources and sand and gravel resources. Gravel is the essential natural ingredient in the construction and maintenance of paved and gravel roads and is the primary application of aggregate. The estimation of gravel resources is more difficult than for combined sand and gravel and consequently estimates of gravel resources are much less certain. Even so, gravel estimates such as these are extremely valuable. To work without any estimates is to assume that gravel supplies are unlimited and this action can lead to very large, possibly avoidable, expenditures.

EUB/AGS Information Series 135 (January 2007) • �
Rg 5 Rg 4 Rg 3 Rg 2
Rg 1 W 5
Rg 29
Rg 28
Rg 27 Rg 26
Rg 27Rg 28
Rg 29Rg 1 W 5
Rg 2Rg 3
Rg 4
Tp 22
Tp 21
Tp 20
Tp 19
Tp 18
Tp 17
Tp 16
Tp 17
Tp 18
Tp 19
Tp 20
Tp 21
22
549
773
7
547
552
799
23
54022
541
543
783
2A
552
22
762
22
2
2
MacMillan Cr
Hig
hwoo
d
R iver
Sheep
River
River
Cr
Creek
Pothole
Cr
MesaCr
Whiskey
Creek
Lineham
Cr
Bull Cr
Beaver Cr
Frank Lake
Little BowRiver
Pine Creek
Emerson Cr
Sheppard Cr
Miller Cr
BeaudryLakes
N
Sullivan
Cr
Ings
Cr
Tongue
Spring
Sheep
Creek
Fish
Highwood
River
Okotoks
Turner Valley
BlackDiamond
High River
Emerson CreekNatural Area
Sheep CreekNatural Area
Threepoint CreekNatural Area
Brown-LoweryProv. Park
Fish CreekNatural Area
Eden ValleyI. R. 216
Eden ValleyI. R. 216
114o 110o112o49o
52o
56o
60 o110o112o120o
56o
52 o
Edmonton
Calgary
Digital base map provided: Spatial Data Warehouse, Alberta Environment and Alberta Infrastructure
Towns
Road - paved
Road - gravel
Road - unimproved
Trail
Railway
Rivers
Lakes
Township/range
Indian reserves
Councillor’s divisional boundaries (1995)
Figure 2: Sand and gravel areas with aggregate resource potential as identified by the Alberta Geological Survey and Municipal District of Foothills
Areas with aggregate resource potential identified by the Alberta Geological Survey
SOURCES OF SAND AND GRAVEL INFORMATION
Areas with aggregate resource potential identified by theMunicipal District of Foothills and Alberta Geological Survey
Areas with aggregate resource potential identified by theMunicipal District of Foothills
Scale 1:100 000
Projection: 3 Degree Tranverse MercatorDatum: North American Datum, 1983
0 5 10 15 202.5 Kilometres
0 2.5 5 7.5 101.25 Miles

EUB/AGS Information Series 135 (January 2007) • 5
Table 3. Gravel1 volume estimates based on collaboration between the Municipal District of Foothills and Alberta Geological Survey
Alberta Geological Survey Levels of Investigation
MD of Foothills (000's m3)
Total Volume (000’s m3)Reconnaissance
(000's m3)
Enhanced Reconnaissance
(000’s m3)
Site Visited (000’s m3)
48407 50710 156415 47603 303135 total volume
4841 12678 117311 47603 182432 expected recovery1The Alberta Geological Survey classifies and gravel deposits into four categories based on gravel content. The gravel calculations were made by applying the following factors to sand and gravel volumes in Table 2 based on gravel content:
• GRAVEL: deposits contain 75-100% gravel. A factor of 0.75 was applied to GRAVEL deposit volumes• Sandy GRAVEL: deposits contain 50%-75% gravel. A factor of 0.5 was applied to sandy GRAVEL deposit volumes• Gravelly SAND: deposits contain 25%-50% gravel. A factor of 0.25 was applied to gravelly SAND deposit volumes• SAND deposits contain 0-25% gravel. A factor of 0 was applied to SAND deposit volumes
In addition to the natural and limited occurrence of sand and gravel deposits, there are societal rules and regulations that restrict aggregate resource development. The Federal Department of Fisheries and Oceans and Alberta Environment are charged with the protection of Alberta’s groundwater resources and fish stocks and habitat. Sand and gravel deposits adjacent to and within rivers and lakes are usually precluded from development to protect groundwater and fish resources. Commonly a 100 m no-development buffer is applied around rivers and lakes. Figure 3 shows the occurrence of sand and gravel deposits after eliminating deposits within 100 m of rivers and lakes. The estimated volume of sand and gravel deposits with aggregate resource potential (Table 2) is reduced by 70,340,000 m3 by the 100 m no-development buffer (Table 4).
Table �. Sand and gravel volume estimates according to Municipal District of Foothills and Alberta Geological Survey data with a 100 m no development buffer on rivers and lakes
Alberta Geological Survey Levels of Investigation
MD of Foothills (000's m3)
Total Volume (000’s m3)Reconnaissance
(000’s m3)
Enhanced Reconnaissance
(000’s m3)
Site Visited (000’s m3)
72883 77093 201685 69615 421276 total volume
7288 19273 151264 69615 247440 expected recovery
Current municipal land use bylaws restrict the amount of developable sand and gravel resources to areas zoned for natural resource extraction (Figure 4). This further reduces the amount of developable sand and gravel to about 45 million m3 (Table 5).

EUB/AGS Information Series 135 (January 2007) • �
Rg 5 Rg 4 Rg 3 Rg 2
Rg 1 W 5
Rg 29
Rg 28
Rg 27 Rg 26
Rg 27Rg 28
Rg 29Rg 1 W 5
Rg 2Rg 3
Rg 4
Tp 22
Tp 21
Tp 20
Tp 19
Tp 18
Tp 17
Tp 16
Tp 17
Tp 18
Tp 19
Tp 20
Tp 21
22
549
773
7
547
552
799
23
54022
541
543
783
2A
552
22
762
22
2
2
MacMillan Cr
Hig
hwoo
d
R iver
Sheep
River
River
Cr
Creek
Pothole
Cr
MesaCr
Whiskey
Creek
Lineham
Cr
Bull Cr
Beaver Cr
Frank Lake
Little BowRiver
Pine Creek
Emers on Cr
Sheppard Cr
Miller Cr
BeaudryLakes
N
Sullivan
Cr
Ings
Cr
Tongue
Spring
Sheep
Creek
Fish
Highwood
River
Okotoks
Turner Valley
BlackDiamond
High River
Emerson CreekNatural Area
Sheep CreekNatural Area
Threepoint CreekNatural Area
Brown-LoweryProv. Park
Fish CreekNatural Area
Eden ValleyI. R. 216
Eden ValleyI. R. 216
114o 110o112o49o
52o
56o
60o110o112o120o
56o
52o
Edmonton
Calgary
Scale 1:100 000
0 2.5 5 7.5 101.25 Miles
Projection: 3 Degree Tranverse MercatorDatum: North American Datum, 1983
0 5 10 15 202.5 Kilometres
Digital base map provided: Spatial Data Warehouse, Alberta Environment and Alberta Infrastructure
Towns
Road - paved
Road - gravel
Road - unimproved
Trail
Railway
Rivers
Lakes
Township/range
Indian reserves
Councillor’s divisional boundaries (1995)
Figure 3: Sand and gravel areas with aggregate resource potential and a 100 m no development buffer around rivers and lakes
SOURCES OF SAND AND GRAVEL INFORMATION
Areas with aggregate resource potential identified by theMunicipal District of Foothills and Alberta Geological Survey
Areas with aggregate resource potential identified by theMunicipal District of Foothills
Areas with aggregate resource potential identified by the Alberta Geological Survey

EUB/AGS Information Series 135 (January 2007) • 7
Rg 5 Rg 4 Rg 3 Rg 2
Rg 1 W 5
Rg 29
Rg 28
Rg 27 Rg 26
Rg 27Rg 28
Rg 29Rg 1 W 5
Rg 2Rg 3
Rg 4
Tp 22
Tp 21
Tp 20
Tp 19
Tp 18
Tp 17
Tp 16
Tp 17
Tp 18
Tp 19
Tp 20
Tp 21
22
549
773
7
547
552
799
23
54022
541
543
783
2A
552
22
762
22
2
2
MacMillan Cr
Hig
hwoo
d
R iver
Sheep
River
River
Cr
Creek
Pothole
Cr
MesaCr
Whiskey
Creek
Lineham
Cr
Bull Cr
Beaver Cr
Frank Lake
Little BowRiver
Pine Creek
Emers on Cr
Sheppard Cr
Miller Cr
BeaudryLakes
N
Sullivan
Cr
Ings
Cr
Tongue
Spring
Sheep
Creek
Fish
Highwood
River
Okotoks
Turner Valley
BlackDiamond
High River
Emerson CreekNatural Area
Sheep CreekNatural Area
Threepoint CreekNatural Area
Brown-LoweryProv. Park
Fish CreekNatural Area
Eden ValleyI. R. 216
Eden ValleyI. R. 216
114o 110o112o49o
52o
56o
60o110o112o120o
56o
52o
Edmonton
Calgary
Scale 1:100 000
0 2.5 5 7.5 101.25 Miles
Projection: 3 Degree Tranverse MercatorDatum: North American Datum, 1983
0 5 10 15 202.5 Kilometres
Digital base map provided: Spatial Data Warehouse, Alberta Environment and Alberta Infrastructure
Towns
Road - paved
Road - gravel
Road - unimproved
Trail
Railway
Rivers
Lakes
Township/range
Indian reserves
Councillor’s divisional boundaries (1995)
Figure 4: Areas zoned for industrial natural resource development (INN) with a 100 m no development buffer around rivers and lakes
SOURCES OF SAND AND GRAVEL INFORMATION
Areas with aggregate resource potential identified by theMunicipal District of Foothills and Alberta Geological Survey
Areas with aggregate resource potential identified by theMunicipal District of Foothills
Areas with aggregate resource potential identified by the Alberta Geological Survey

EUB/AGS Information Series 135 (January 2007) • �
Table 5. Estimated sand and gravel volumes zoned INN1 with a 100 m no development buffer on rivers and lakes, based on Municipal District of Foothills and Alberta Geological Survey data
Alberta Geological Survey Levels of Investigation
MD of Foothills (000's m3)
Total Volume (000’s m3)
Area Used in Volume CalculationsReconnaissance
(000’s m3)
Enhanced Reconnaissance
(000’s m3)
Site Visited (000’s m3)
1 235 1430 43974 45640 total volume0 59 1073 43974 45105 expected recovery
1INN: areas zoned for natural resource extractive industrial development according to the Municipal District of Foothills’ Land Use Bylaw.
2 Aggregate Resource Production and Consumption
Statistics on sand and gravel production are available from an annual survey of operators in Alberta by Natural Resources Canada and surveys conducted by the Alberta Geological Survey in 1981 and 1991 (Edwards, 1995). Historical air photos also provide an idea of the development and expansion of operating pits. Based on these sources of information and observations in the municipality we conclude:
• The largest consumption of aggregate in the municipality is currently near Okotoks, High River and along the Highway 2 corridor into Calgary.
• Large amounts of sand and gravel are exported from the municipality to Calgary.• Aggregate resource demand will increase as population increases in both the Municipal District of
Foothills and Calgary.• Annual, per capita aggregate consumption values for the Municipal District of Foothills and Calgary
were respectively 20 and 10 tonnes (Edwards, 1995).
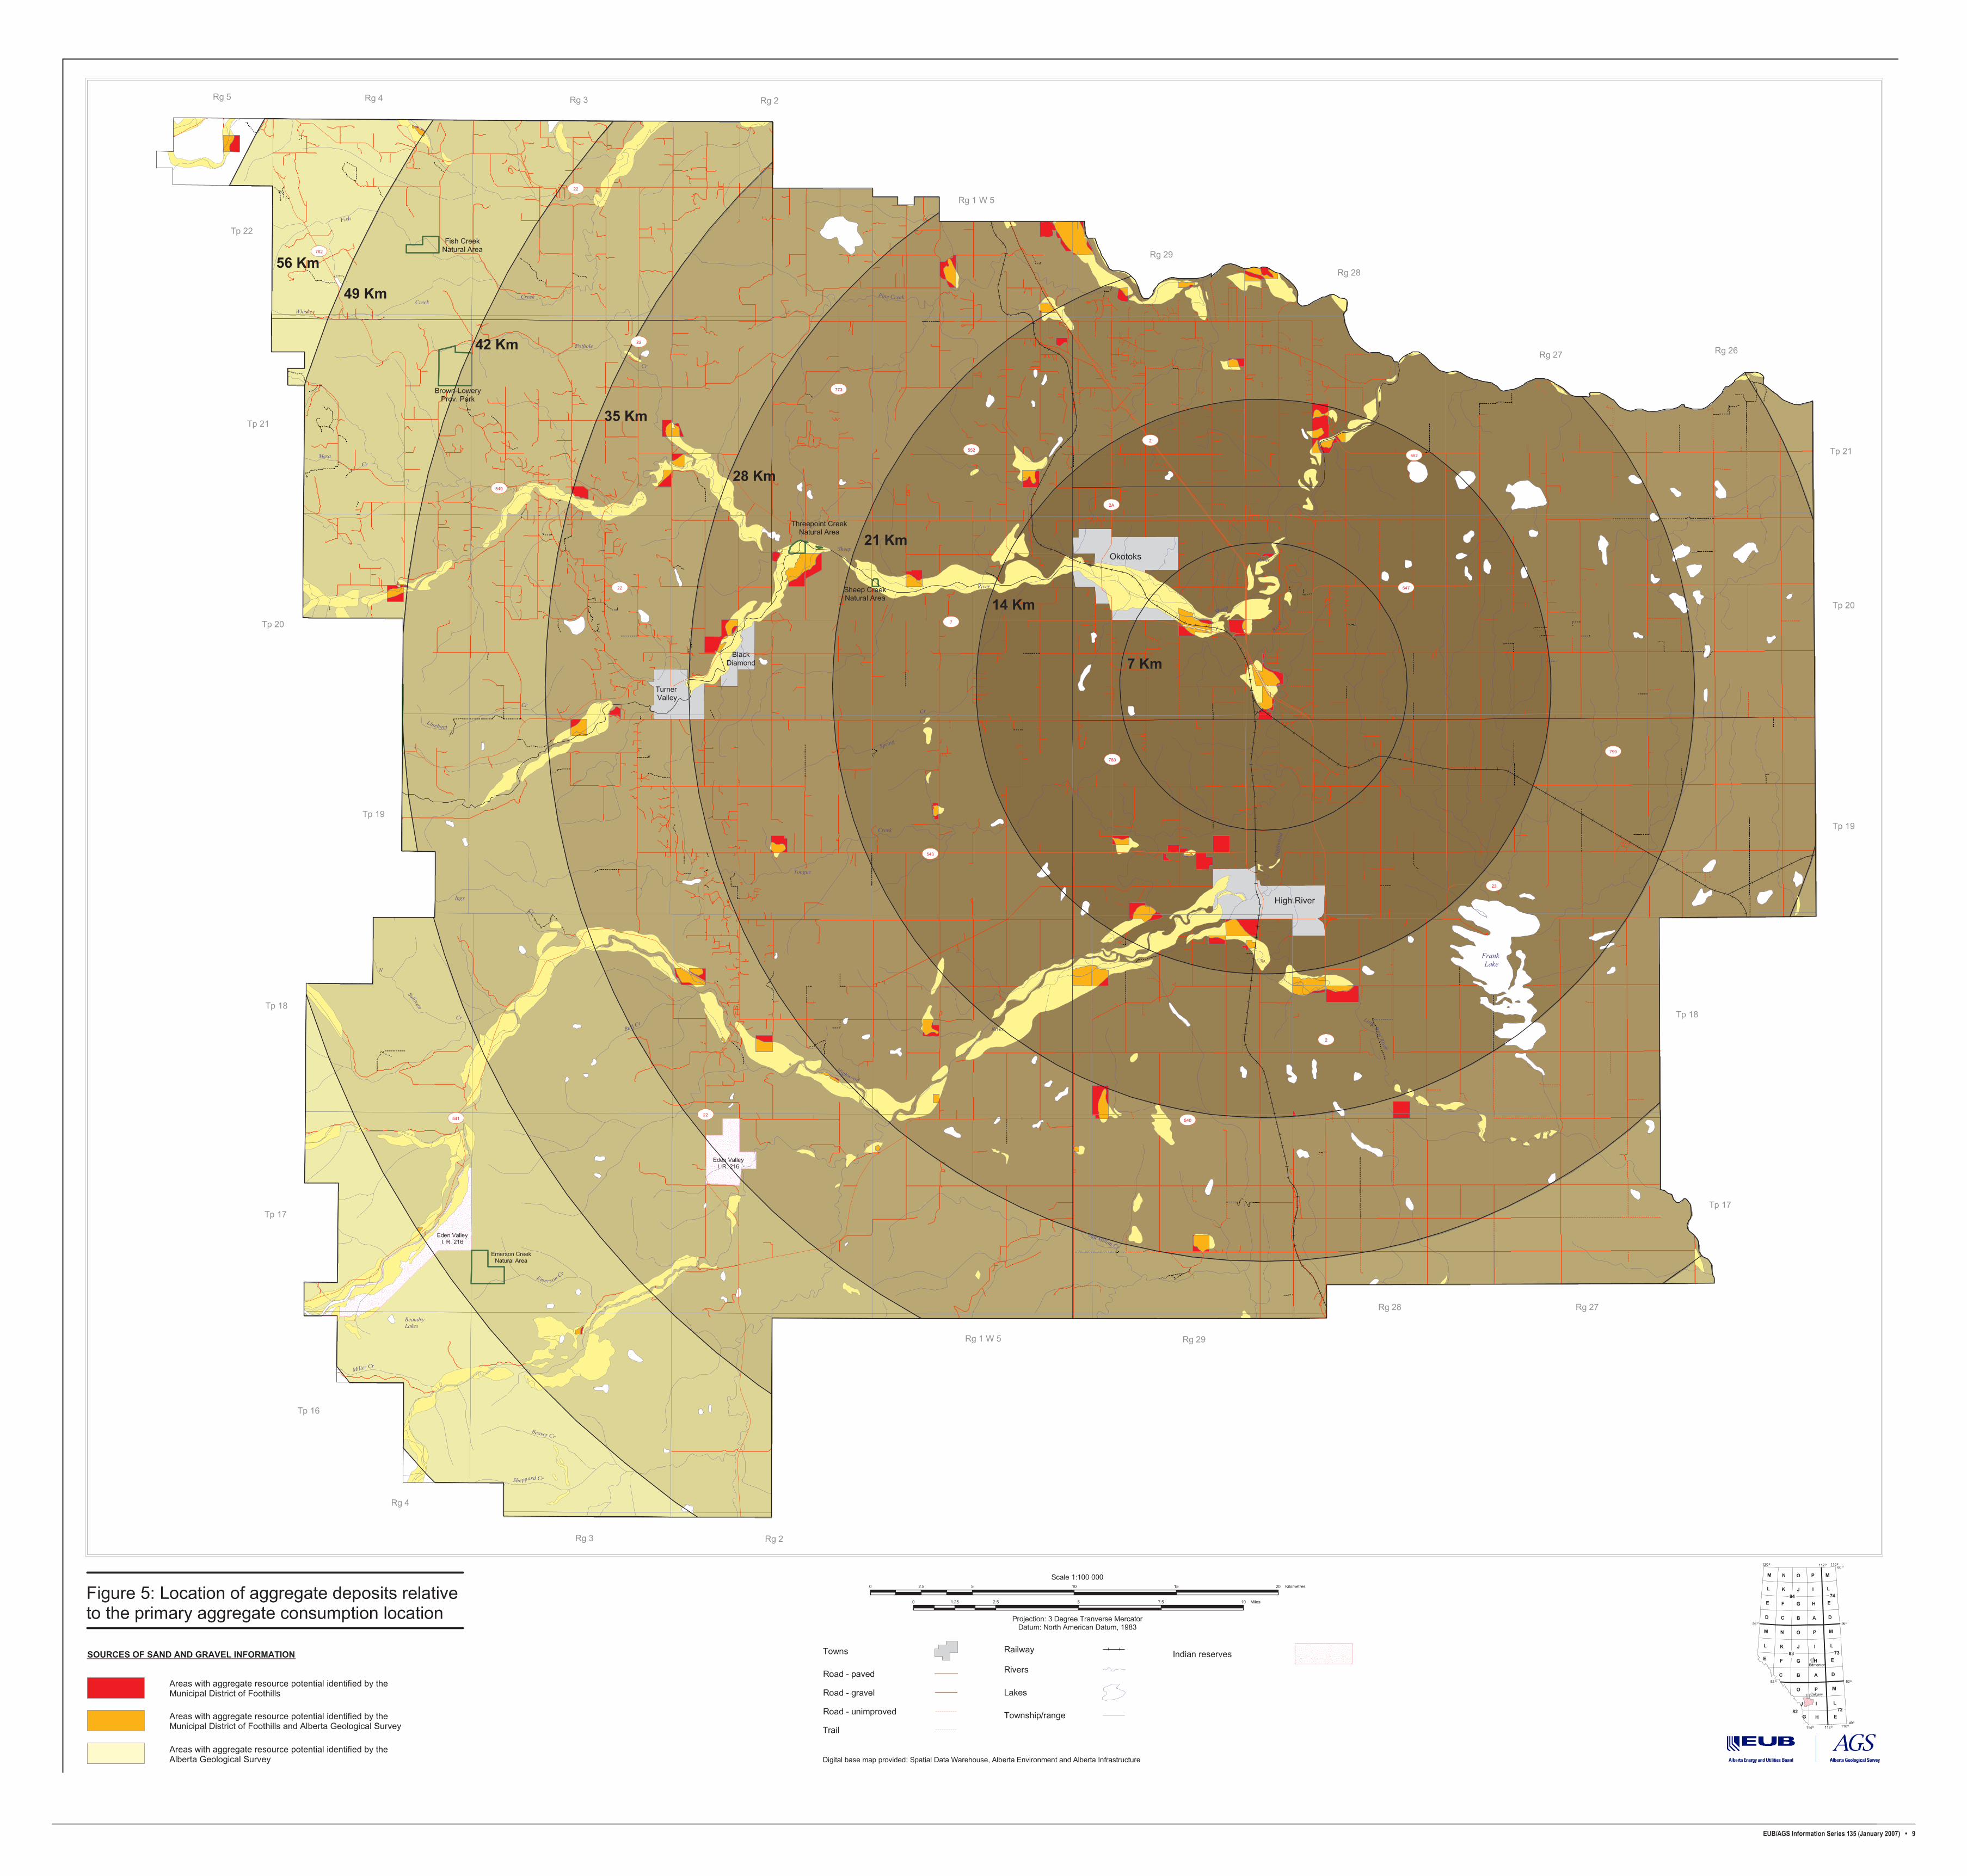
A resource consumption model was developed using the statistical values shown in Table 6 and the assumptions stated above. Results of the modelling are presented as Figures 5, 6 and 7. Resource volumes are reasonably recoverable resources. According to the model, the municipality will produce 163 million tonnes of aggregate in the next 20 years to satisfy its own and Calgary’s needs. The gross estimates of consumption presented in Figures 6 and 7 do not account for concentrated demand for aggregate near towns and major highways or the uneven distribution of sand and gravel deposits. Nor does this method enable the estimation of the huge haul costs associated with aggregate transport.
EUB/AGS Information Series 135 (January 2007) • �
Rg 5 Rg 4 Rg 3 Rg 2
Rg 1 W 5
Rg 29
Rg 28
Rg 27 Rg 26
Rg 27Rg 28
Rg 29Rg 1 W 5
Rg 2Rg 3
Rg 4
Tp 22
Tp 21
Tp 20
Tp 19
Tp 18
Tp 17
Tp 16
Tp 17
Tp 18
Tp 19
Tp 20
Tp 21
22
549
773
7
547
552
799
23
54022
541
543
783
2A
552
22
762
22
2
2
MacMillan Cr
Hig
hwoo
d
R iver
Sheep
River
River
Cr
Creek
Pothole
Cr
MesaCr
Whiskey
Creek
Lineham
Cr
Bull Cr
Beaver Cr
Frank Lake
Little BowRiver
Pine Creek
Emerson Cr
Sheppard Cr
Miller Cr
BeaudryLakes
N
Sullivan
Cr
Ings
Cr
Tongue
Spring
Sheep
Creek
Fish
Highwood
River
Okotoks
Turner Valley
BlackDiamond
High River
Emerson CreekNatural Area
Sheep CreekNatural Area
Threepoint CreekNatural Area
Brown-LoweryProv. Park
Fish CreekNatural Area
Eden ValleyI. R. 216
Eden ValleyI. R. 216
21 Km
28 Km
14 Km
35 Km
42 Km
7 Km
49 Km
56 Km
114o 110o112o49o
52o
56o
60 o110o112o120o
56o
52 o
Edmonton
Calgary
Scale 1:100 000
0 2.5 5 7.5 101.25 Miles
Projection: 3 Degree Tranverse MercatorDatum: North American Datum, 1983
0 5 10 15 202.5 KilometresFigure 5: Location of aggregate deposits relative to the primary aggregate consumption location
Areas with aggregate resource potential identified by the Alberta Geological Survey
SOURCES OF SAND AND GRAVEL INFORMATION
Areas with aggregate resource potential identified by theMunicipal District of Foothills and Alberta Geological Survey
Areas with aggregate resource potential identified by theMunicipal District of Foothills
Digital base map provided: Spatial Data Warehouse, Alberta Environment and Alberta Infrastructure
Towns
Road - paved
Road - gravel
Road - unimproved
Trail
Railway
Rivers
Lakes
Township/range
Indian reserves

EUB/AGS Information Series 135 (January 2007) • 10
Table �. Populations and aggregate consumption rates used for aggregate resource modelling
Communities
Population8
Consumption Rate9
(tonnes/year/capita)1996 2001 Increase From 1996 To 2001(%)
Increase For Every 5 Year Period (%)
High River 7359 9345 27 ~20 25Okotoks 8528 11664 37 ~30 25
Black Diamond, Turner Valley, Longview
3573 3774 7 ~10 20
MD of Foothills 14331 16764 17 ~10 20
Calgary10 253129 289251 14 ~5 108Population information from http://www.municipalaffairs.gov.ab.ca/mahome/ms/official_pop_lists.cfm.9Consumption rates are estimates from Edwards (1995). One cubic metre of sand and gravel is equal to 1.6 metric tonnes.10Calgary's population in 2001 was 876,519 but a population of one-third is used as aggregate from the Municipal District of Foothills is assumed consumed by the southeast part of Calgary.
Figure �. Sand and gravel consumption (2005-2031) and recoverable resources in the Municipal District of Foothills

EUB/AGS Information Series 135 (January 2007) • 11
Another consumption model was developed to illustrate the uneven distribution of deposits and the impact of haul distance. A consumption centre was chosen at Aldersyde and concentric circles (every 7 km) generated outward from this location (Figure 5). Each ring in Figure 5 represents a minimum and maximum distance, as a straight line, from Aldersyde and defines an area for which volumes of sand and gravel (Tables 7 and 8) and gravel (Tables 9 and 10) were calculated in the GIS system. By comparing the resources available for each distance with the aggregate consumption curves in Figure 6, we estimate that by 2013 all the sand and gravel resources within 7 km of the municipality’s consumption centre will be depleted and by 2028 the municipality will have depleted all the sand and gravel resources within 14 km of the consumption centre. If we run the model for gravel consumption alone, the situation becomes critical in a relatively short time. By 2009, all the gravel will be depleted within 7 km of the consumption centre and by 2030; gravel will be hauled from at least 21 km to the Aldersyde area. Some of the deposits used in the consumption model are nearly depleted and others will be precluded from development. Considering these variables and our experience with aggregate depletion in areas such as Edmonton, we conclude that aggregate haul distances will likely reach 40 km in the next 20 years.
Figure 7. Gravel consumption (2005-2031) and recoverable resources in the Municipal District of Foothills

EUB/AGS Information Series 135 (January 2007) • 12
Table 7. Estimates of total potential sand and gravel resources relative to the Municipal District of Foothills aggregate consumption centre
Distance From Consumption Centre (km)
Alberta Geological Survey Levels of Investigation MD of Foothills (000’s m3)
Total Volumes (000’s m3)
Reconnaissance (000’s m3)
Enhanced Reconnaissance (000’s m3)
Site Visited (000’s m3)
0-7 1531 32493 14748 487727-14 5042 493 70714 8553 84802
14-21 8533 14159 73993 17723 11440821-28 8746 6308 39937 28207 8319828-35 10449 18185 15222 7243 5109935-42 10156 17980 24706 0 5284242-49 27846 25068 8621 1013 6254849-56 14539 13721 6190 697 35147
Total 532�1�
Table �. Estimates of reasonably recoverable sand and gravel resources relative to the Municipal District of Foothills aggregate consumption centre
Distance From Consumption Centre (km)
Alberta Geological Survey Levels of Investigation MD of Foothills
(000’s m3)
Recoverable Resource Volumes
(000’s m3)Reconnaissance
(000's m3) Enhanced Reconnaissance
(000's m3)Site Visited (000's m3)
0-7 0 383 24370 14748 395017-14 504 123 53036 8553 62216
14-21 853 3540 55495 17723 7761121-28 875 1577 29953 28207 6061128-35 1045 4546 11417 7243 2425135-42 1016 4495 18530 0 2404042-49 2785 6267 6466 1013 1653049-56 1454 3430 4643 697 10224
Total 31���3

EUB/AGS Information Series 135 (January 2007) • 13
Table �. Estimates of total potential gravel resources relative to the Municipal District of Foothills aggregate consumption centre
Distance From
Consumption Centre (km)
Alberta Geological Survey Levels of Investigation MD of Foothills
(000’s m3)5
Total Volumes (000’s m3)Reconnaissance1
(000's m3) Enhanced Reconnaissance2
(000's m3)Site Visited3 (000's m3)
0-7 0 766 17005 7327 250987-14 3431 196 40037 5678 49342
14-21 3425 6109 44879 10098 6451121-28 5608 3637 23375 19232 5185228-35 5944 9222 6502 3842 2551035-42 3339 9433 13290 0 2606242-49 17198 13576 5814 437 3702549-56 9134 7524 4133 357 21148
Total 3005��
Table 10. Estimates of reasonably recoverable gravel resources relative to the Municipal District of Foothills aggregate consumption centre
Distance From Consumption Centre (km)
Alberta Geological Survey Levels of InvestigationMD of Foothills
(000’s m3)
Recoverable Resource
Volumes (000’s m3)
Reconnaissance (000’s m3)
Enhanced Reconnaissance (000’s m3)
Site Visited (000’s m3)
0-7 0 192 12754 7327 202727-14 343 49 30028 5678 36098
14-21 343 1527 33659 10098 4562721-28 561 909 17531 19232 3823328-35 594 2306 4877 3842 1161835-42 334 2358 9968 0 1266042-49 1720 3394 4361 437 991149-56 913 1881 3100 357 6251
Total 1�0�71
Transportation is one of the largest costs involved in the use of aggregate resources. Our consumption model estimates the total haul cost from 2005 to 2031 will be between $605 million (assuming no increase in fuel and labour costs) and $2.2 billion (assuming costs increase) (Tables 11 and 12). These values are underestimations because the modelling above is based on straight lines of travel and the model assumes optimal use of all resources.

EUB/AGS Information Series 135 (January 2007) • 1�
Table 11. Cost of hauling aggregate to the Municipal District of Foothill's consumption centre from 2005 to 2031 assuming haul rate remains constant
Years Aggregate Consumed (megatonnes) Average Haul (km) Haul Rate
($ /tonne/km) Haul Cost ($)
2005-2013 42.36827005 14 0.14 83,041,8092014-2028 96.5106385 28 0.14 378,321,7032029-2031 24.43730827 42 0.14 143,691,373
Total �05,05�,��5
Table 12. Cost of hauling aggregate to the Municipal District of Foothill's consumption centre from 2005 to 2031 assuming haul rate increases with time
Years Aggregate Consumed (megatonnes) Average Haul (km) Haul Rate
($ / tonne km) Haul Cost ($)
2005-2013 42.36827005 14 0.14 83,041,8092014-2028 96.5106385 28 0.28 756,643,4062029-2031 24.43730827 42 1.40 1,436,913,726
Total 2,27�,5��,��1
Aggregate is a low cost per unit commodity, but because huge quantities are required the ultimate cost of aggregate is very large. Based on our consumption model, between $946 million and $1.5 billion will be spent on producing enough aggregate to meet the needs of the municipality (Tables 13 and 14). Between 238,431,000 m3 and 461,968,000 m3 of aggregate resources will be left in the ground according to current land use bylaws. This equates to a loss of between $2.2 billion and $4.3 billion to the local economy.
Table 13. Aggregate production cost in the MD of Foothills from 2005 to 2031 assuming production cost remains constant
Years Aggregate Consumed
(megatonnes) Cost per Tonne ($) Production Cost ($)
2005-2013 42.36827005 5.79 245,312,2842014-2028 96.5106385 5.79 558,796,5972029-2031 24.43730827 5.79 141,492,015
Total ��5,�00,���
Table 1�. Aggregate production cost in the MD of Foothills from 2005 to 2031 assuming production cost increases with time
Years Aggregate Consumed (megatonnes) Cost per Tonne ($) Production Cost ($)
2005-2013 42.36827005 6.9 292,341,0632014-2028 96.5106385 9.31 898,514,0442029-2031 24.43730827 11.56 282,495,284
Total 1,�73,350,3�1

EUB/AGS Information Series 135 (January 2007) • 15
3 Aggregate Resource Issues
Sand and gravel development is often met with opposition from people justifiably concerned with environmental and safety issues. Poor sand and gravel development planning and mining in the past has left a negative impression of the aggregate industry in the minds of some residents. These issues should be acknowledged and addressed in a sand and gravel development strategy.
3.1 Trucking
Poorly planned routes and long haul distances increases the amount of dust generated from trucks and releases more harmful greenhouse gases into the atmosphere. Minimizing haul distances can help the municipality maintain a high quality environment. Increased truck haul distances make injury to residents walking, cycling or driving on local roads more likely. Reducing haul distances not only consumes less non-renewable fuel resources, it can keep residents alive and well.
3.2 Environment
The Municipal District of Foothill’s “Municipal Development Plan” identifies the impact of development on water supply and the minimization of air and water pollution as priority environmental concerns that must be addressed when making development decisions. A sand and gravel development strategy can help decision makers evaluate development proposals, especially for Environmentally Significant land.
It was noted earlier in the report that sand and gravel deposits adjacent to or within rivers and lakes are not developed to prevent damage to groundwater resources and fish habitats. Sand and gravel deposits can also contain freshwater resources (aquifers). Mining sand and gravel can reduce the flow of water to wells and poor mining practices may introduce pollutants, such as motor oil, into the aquifer. The first step to prevent aquifer damage is to identify sand and gravel deposits that are important freshwater resources, and secondly, to insist on sound sand and gravel mining practices to reduce the risk of aquifer damage.
3.3 Export
The Municipal District of Foothills is likely to remain an important supplier of sand and gravel to the City of Calgary. That said, the municipality must plan for the development and transport of sand and gravel in the municipality for its own use over the long term.
3.� Community Aggregate Payment
At the same time that this study was underway, the Aggregate Resource Development Task Force proposed a community aggregate payment of up to $0.25/tonne to municipalities to compensate for the inconvenience imposed on communities by sand and gravel development. This has now been passed into law. This money would be designated as general revenue for the municipality. According to current land use bylaws, the municipality could receive $17,589,600 in revenue based on a $0.25/tonne community aggregate payment rate. However, if all sand and gravel deposits were developed, the municipality could receive as much as $216,527,200 in revenue.

EUB/AGS Information Series 135 (January 2007) • 1�
3.5 Crushed Stone
The most common alternative to sand and gravel for aggregate is crushed stone. Local bedrock is too soft to use as aggregate, and the closest source of rock suitable for crushed stone is the Rocky Mountains and Foothills. Blasting and crushing stone to produce aggregate is more expensive than processing sand and gravel aggregate: $12.74 for stone in Alberta versus an average $5.79 for sand and gravel aggregate. The haul distance from the mountains is much longer than from local sand and gravel deposits. The municipality and Calgary will be forced to use crushed stone when sand and gravel resources are depleted. This eventuality can be moved farther into the future by a good sand and gravel development strategy that includes the provision for the change over to crushed stone as the primary source of aggregate.
� Conclusions
Although this report identifies depletion of sand and gravel resources in the Municipal District of Foothills, it also suggests there are enough sand and gravel resources zoned INN to meet its and Calgary’s aggregate resource needs for at least 20 years. The amount of sand and gravel that can and will be used in the Municipal District of Foothills may be far less than indicated in this report. Many variables used in the modelling have a high degree of uncertainty and true sand and gravel volumes may be far less than anticipated. Competing land uses will undoubtedly preclude the development of some sand and gravel deposits and restrictions on haul routes may make some deposits uneconomical. One certainty is that an aggregate resource development plan can reduce sterilization of resources, which will reduce haul distances, haul costs, greenhouse gas emissions and injuries or fatalities caused by gravel trucks.Although the data used in this study did not permit a high level of precision, the results demonstrated that a large amount of resource, as much as 462 million m3 valued at $4.3 billion, might be left in the ground due to current land-use bylaws. Furthermore, even more resource can be expected to remain unused unless great care is used in the future.
5 Recommendations
1) An inventory of sand and gravel resources sufficiently detailed to identify with certainty potential aggregate resources including their quantity and quality should be completed in the Municipal District of Foothills.
2) A similar inventory of sand and gravel resources should be completed for surrounding municipalities and counties as the start of a regional inventory.
3) An aggregate resource analysis that includes projections of demand forward to depletion based on reliable estimates of municipal growth and development should be completed for the Municipal District of Foothills.
4) The Municipal District of Foothills should amend their bylaws to protect those supplies of aggregate identified as essential through the resource analysis.
5) The Municipal District of Foothills should continue to work with the Aggregate Resource Development Task Force and/or relevant mainline departments to promote aggregate conservation in neighbouring counties and municipalities.
6) The Municipal District of Foothills, provincial government departments and the Alberta Geological Survey should work together to educate residents and landowners about the uses and value of aggregate resources in the municipality.

EUB/AGS Information Series 135 (January 2007) • 17
� References
Edwards, W.A.D. (1995): Mineral aggregate commodity analysis; Alberta Energy and Utilities Board, EUB/AGS Open File Report 1995-08, 54 p.
Edwards, W.A.D. (1979): Sand and gravel deposits in the Canmore corridor area; Alberta Research Council, Alberta Geological Survey, Earth Sciences Report 1979-02, 30 p.
Edwards, W.A.D. and Scafe, D. (1996): Mapping and resource evaluation of the Tertiary and preglacial sand and gravel formations of Alberta; Alberta Energy and Utilities Board, EUB/AGS Open File Report 1994-06, 241 p.
Fox, J.C. (1982): Aggregate resources of the Gleichen Lake map area, NTS 82I; Alberta Research Council, Alberta Geological Survey, Map A82I, scale 1:250 000.
Shetsen, I. (1981a): Aggregate resources of the Bragg Creek map area, NTS 82J/15; Alberta Research Council, Alberta Geological Survey, Map A82J15, scale 1:50 000.
Shetsen, I. (1981b): Sand and gravel resources of the Calgary area, Alberta; Alberta Research Council, Alberta Geological Survey, Open File Report 1981-08, 96 p.
Shetsen, I. (1981c): Aggregate resources of the Priddis map area, NTS 82J/16; Alberta Research Council, Alberta Geological Survey, Map A82J16, scale 1:50 000.
Shetsen, I. (1981d): Aggregate resources of the Turner Valley map area, NTS 82J/09; Alberta Research Council, Alberta Geological Survey, Map A82J09, scale 1:50 000.
Shetsen, I. (1987): Quaternary geology, southern Alberta; Alberta Research Council, Alberta Geological Survey, Map 207, scale 1:500 000.