project report on conduction of baseline survey of
TRANSCRIPT
i
Project Report
on
Conduction of Baseline Survey of Citizens in Bihar for
Assembly Election - 2020
Office of the Chief Electoral Officer, Bihar
Chandragupt Institute of Management Patna

ii
PROJECT RESEARCH TEAM
Prof. (Dr.) V. Mukunda Das
Prof. Ankit Sharma Prof. Anuj Sharma Prof. Sriranga Vishnu
Field Researchers
Mr. Ajay Kumar Mr. Kundan Kumar Singh Mr. Santosh Kumar
Mr. Amitesh Kumar Mr. Pankaj Kumar Singh Mr. Shibnath Chatterjee
Mr. Brajmohan Kumar Mr. Rajeeva Kumar Sharma Mr. Sunil Kumar
Doctor Santosh Kumar Mr. Rajesh Kumar Singh Mr. Umesh Kumar Deo
Mr. Gopesh Kumar Mr. Randhir Pratap Singh
Computer Operators
Mr. Sunil Kumar
Mr. Sumit Kumar
Executive Assistant
Mr. Alok Kumar Raj
iii
ACKNOWLEDGEMENTS
In the trying times of COVID-19 pandemic, conduction of this research work within pressing
time limit was a herculean task. Meticulous planning, teamwork and cooperation by one and
all made this project report possible. The research team owes its gratitude and appreciation to
all the stakeholders involved.
At the very outset, we thank Shri H. R. Srinivasa, IAS, Chief Electoral Officer, Department
of Election, Government of Bihar, for entrusting CIMP with this study. As the tone-setter, he
has provided the perspective required to conduct this research work. Heartfelt thanks for his
guidance, motivation and support.
The research team extends earnest thanks to Ms. Ranjita, Additional Chief Electoral Officer,
Department of Election, Government of Bihar, for her guidance and support in this study.
Shri Baijunath Kumar Singh, Deputy Chief Electoral Officer, and Shri Vijay Kumar, Deputy
Election Officer, merit special mention for their support during different phases of this study.
Deepest thanks to Dr. V. Mukunda Das, Director, Chandragupt Institute of Management
Patna, for showing confidence in the research team and assigning this arduous task to us. He
has been a constant source of inspiration and guidance during the course of this research
work.
Special thanks to our field investigators who braved incessant rains and flood-like situations,
Covid-19 pandemic and district and state-level lockdowns to collect primary data from
various assembly constituencies. We also extend our appreciation to the staff members of
CIMP and the team of data entry and computer operators.
Democracy is all about people. Last but not the least, we are grateful to our respondents and
the general public who showed interest in the survey and took out time to share their
knowledge and understanding about electoral processes.
(Project Co-ordinator)
iv
EXECUTIVE SUMMARY
Background
Election for Bihar Legislative Assembly is due in the Year-2020and is expected to be held in
the closing months of the Year. Even as the ground-level assessments are being done and
polling dates are being decided by the Election Commission of India (ECI), Office of the
Chief Electoral Officer, Bihar, has taken a proactive step to get a baseline survey conducted
for the citizens of the State to complement their preparations for ensuing assembly election.
In this backdrop, this study has been conducted with multiple objectives such as assessing the
voters' awareness about enrolment procedure, eligibility and EPIC; identifying key factors
responsible for their participation in elections, understanding theirexpectations and attitude
regarding assembly election especially in COVID-19 period, assessing exposure of voters to
the SVEEP interventions, analyzing the challenges faced by disabled voters during
registration and voting, and assessing the use of inducements to affect voting in elections.
The survey covered 48 Assembly Constituencies (ACs) spread across 25 districts of Bihar.
From each AC, four polling booths, two with high voter turnout and two with low turnout,
were targeted for data collection. In the final sample, 5863 respondents from 190 polling
stations were surveyed during this research study. Around 71% respondents belong to rural
settings. Remaining are from urban and rurban areas.
Socio-Economic-Demographic Profile
The demographic profile of respondents of this survey reveals these significant information:
• Majority of the respondents are illiterate or have passed primary school.
• Large group of the respondents informed that they are engaged as laborer/cultivator
and are active in agriculture and allied activities.
• Nearly 90% of the respondents are married.
• 50.69% of the respondents belong to OBC category.
• Majority of the respondents do not read Newspapers or Magazines.
• Majority of the respondents do not listen to the Radio. Rather, they watch Television.

v
• TV and newspapers are the most preferred media vehicles to receive election-related
information. Some respondents use mobile phones as well.
• 3.16% of the respondents came back to their homes due to COVID-19 pandemic.
• Those respondents who came back have their names in electoral roll. Nearly all of
them are enrolled in Bihar and willing to vote in the upcoming assembly elections.
• Majority of the respondents who are not displaced due to COVID-19 are willing to
vote in the upcoming assembly elections.
• A sizeable no. of the respondents suggest availability of sanitizers, masks, soap and
water, thermal screening and markings on the ground to maintain social distancing at
the polling booth on the day of voting.
Voter Registration
• 98.46% of respondents possess their voter ID card.
• Approximately 19% of the respondents who don’t have voter card are not aware about
the process of getting this card and the same number of respondents have specified
that they have lost their card.
• 94% of the respondents are aware of “Voter’s List”.
• 98.73% respondent’s name have been currently enrolled/ included in the voter’s list
• The assessment of reasons behind non-enrollment discovers that 31.20% of the
respondents do not know about the process of enrollment.
• Assessment of awareness of enrollment requirement reveals that 63.53% respondents
were informed about the enrollment status by their area’s BLO.
• 97.1% respondents have confirmed that their name and other details have been
correctly enrolled.
• When enquired if any adult member in their family was not registered, about 96%
respondents have confirmed that all eligible members have been correctly enrolled in
the voter’s list.
• Around 4% respondents informed that they have such adult members in the family
who are notregistered. The major reasons cited were lack of interest, lack of valid
documents and cumbersome process of getting names registered in the electoral roll.
• Assessment of participant’s knowledge about the enrollment center’s location reveals
that about 80% respondents contacted the BLO to get enrolled in the voter’s list.
• 98% of respondents are aware of the EPIC/Election card.

vi
• The assessment of the availability and custody of the EPIC with participants
highlights that about 96% respondents have confirmed that they have their Election
card safe with them.
• This study has also assessed about the issuing date of the EPIC of participants. About
39% respondents confirmed having received their voter card before last assembly
elections.
• When enquired about the length of possession of the voter I-card, about 21%
respondents confirmed that they got their EPIC (Election card) within six months.
• About 61% respondents have confirmed that they got their EPIC (Election card)
easily without any major problem.
• About 53% respondents have confirmed that the procedure to get EPIC card is long,
while 25% of respondents have specified that the concerned officials are unfriendly.
• Assessment of substitutes of the EPIC (Election Card) - alternative IDs reveals that
about 44% respondents have given ‘no response’ while 27.8% have specified ‘Voter’s
slip’ as an alternative.
• Assessment of the participant’s awareness about local person appointed for assisting
in enrolment reveals that about 86% respondents know that Govt. /Election office has
appointed local persons to help in enrolment.
• About 91.56% respondents have clearly confirmed that they know that Govt.
/Election office has appointed ‘Booth Level Officer’ to help for enrolment.
• About 99% respondents have specified that they know their polling booth’s location.
Knowledge, Attitude, Behaviour, Belief, and Practices (KABBP)of Voters
• 91.86%of the respondents confirmed having voted during last Assembly Election.
• 92%of the respondentsvoted during the last Parliamentary Election.
• Absence from the area of residence on polling day was the most common reason
(35%) for not voting in the last General Election-2019. This corresponds to high out-
migration of people for jobs and seasonal employment.
• Electors voted in previous elections for varied reasons. For 81% respondents,
awareness about their voting rights was the main reason. Other mentionable reasons
include good candidate (31%), receiving voter’s slip before election (56%), affinity
with a particular candidate or party (11%) and enabling environment for free and fair
elections created by ECI (31%).
vii
• Majority of the survey respondents (93.37%) said that their overall experience was
satisfactory on the day of voting. About 2.76% people said that they had to face some
inconvenience while voting.
• Candidate’s honesty and experience stands the most prominent reason for selecting a
candidate as more than 54% respondents have reported these factors.
• 18.49% respondents have reported that one or more eligible voter in their family have
not voted in the last elections.
• Multiple reasons were cited for not voting in previous elections. More than 54%
respondents said that the voters in their family were not in the area on polling day.
Further, about 10% respondents reported not having Voter-ID card while 23%
reported that their names were not listed on the electoral roll.
• The major factors resulting in high voter turnout on polling day are good candidate
(58%) and political wave in favour of a particular party or candidate (30%). Anti-
incumbency was a marginal issue for most voters.
• Majority of the survey respondents (78.48%) said that their overall experience was
good on the day of voting.
• When asked about security arrangements and deployment of police force during the
elections, more than 80% respondents reported that the arrangements were adequate.
• About 78.94% respondents were satisfied with the behavior of the polling staff at the
booth on the day of election.
• About 78.41% respondents have confirmed that they did not face any problem at the
polling booth during election.
• When asked about difficulties faced on the day of voting, 72% respondents said that
they experienced long queues at the polling booths while 26.51% people indicated the
lack of arrangements for drinking water, toilets and ramp for differently abled voters.
15.47% respondents also pointed the absence of separate queue for senior citizens.
Voter Awareness and Attitudes
To understand the level of knowledge and awareness among the voters about the electoral
process, questions related to minimum age to become a voter, qualifying date for registration,
National Voters’ Day, NOTA option, Braille on EVMs, and VVPAT, etc. were asked. The
findings of the survey revealed that:
viii
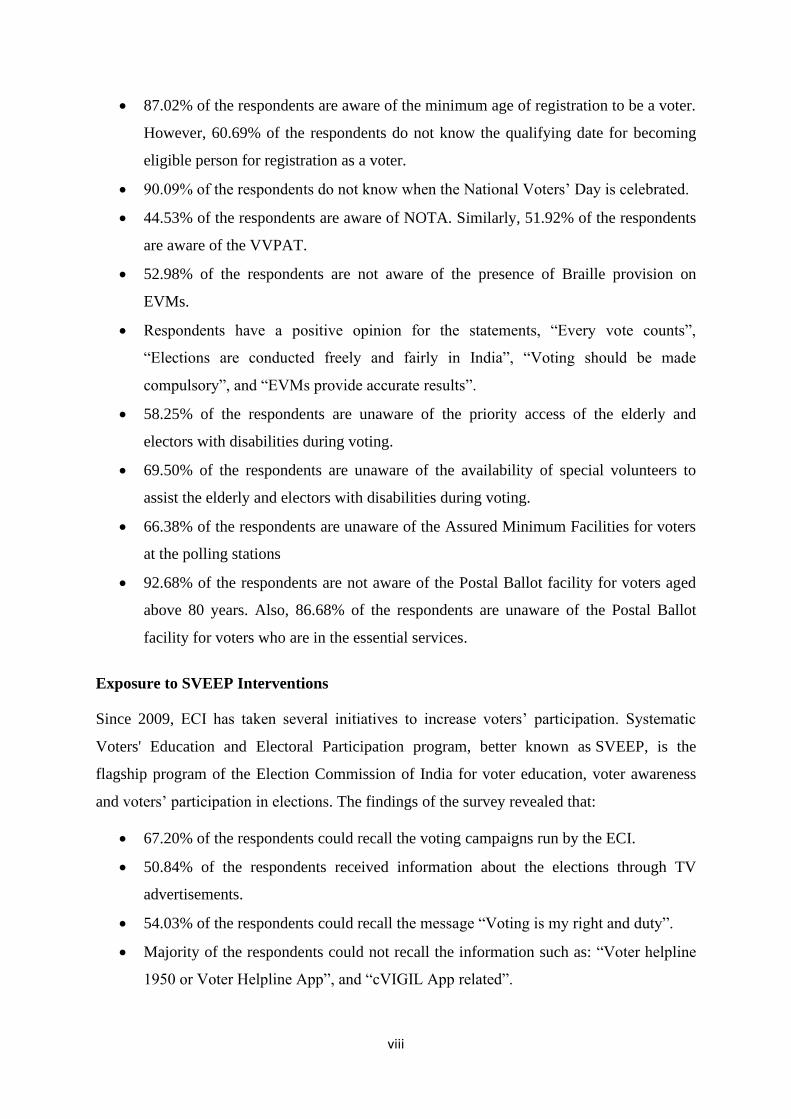
• 87.02% of the respondents are aware of the minimum age of registration to be a voter.
However, 60.69% of the respondents do not know the qualifying date for becoming
eligible person for registration as a voter.
• 90.09% of the respondents do not know when the National Voters’ Day is celebrated.
• 44.53% of the respondents are aware of NOTA. Similarly, 51.92% of the respondents
are aware of the VVPAT.
• 52.98% of the respondents are not aware of the presence of Braille provision on
EVMs.
• Respondents have a positive opinion for the statements, “Every vote counts”,
“Elections are conducted freely and fairly in India”, “Voting should be made
compulsory”, and “EVMs provide accurate results”.
• 58.25% of the respondents are unaware of the priority access of the elderly and
electors with disabilities during voting.
• 69.50% of the respondents are unaware of the availability of special volunteers to
assist the elderly and electors with disabilities during voting.
• 66.38% of the respondents are unaware of the Assured Minimum Facilities for voters
at the polling stations
• 92.68% of the respondents are not aware of the Postal Ballot facility for voters aged
above 80 years. Also, 86.68% of the respondents are unaware of the Postal Ballot
facility for voters who are in the essential services.
Exposure to SVEEP Interventions
Since 2009, ECI has taken several initiatives to increase voters’ participation. Systematic
Voters' Education and Electoral Participation program, better known as SVEEP, is the
flagship program of the Election Commission of India for voter education, voter awareness
and voters’ participation in elections. The findings of the survey revealed that:
• 67.20% of the respondents could recall the voting campaigns run by the ECI.
• 50.84% of the respondents received information about the elections through TV
advertisements.
• 54.03% of the respondents could recall the message “Voting is my right and duty”.
• Majority of the respondents could not recall the information such as: “Voter helpline
1950 or Voter Helpline App”, and “cVIGIL App related”.

ix
• Majority of the respondent recall the taglines, “Desh ka Mahatyohar” and “No Voter
to be Left Behind/Koi Matdata Na Chootey”.
• Mahinder Singh Dhoni is the most popular icon with recall by 33.26% respondents.
• 95.41% of the respondents have not used the websites of Election Commissionof
India or Chief Electoral Officer, Bihar. Also, 99.68% of the respondents reported that
they have not used Voter Helpline No.-1950 or the Voter Helpline App.
Participation of Persons with Disability (PwD) in Elections
ECI has taken several initiatives to increase the participation of PwD in the elections. These
initiatives include producing and circulating special publicity material aimed at increasing
their participation in the elections, easy registration and voting initiatives, and creating
special mobile application. Eighty five such people were surveyed. The findings are as
follows:
• 76.47% of the PwD respondents have not received any publicity or voter edutainment
material aimed at their smooth participation in the elections.
• 63.53% of the PwD respondents have interacted with the Booth Level Officers.
• Majority of the PwD respondents have not faced difficulty during registration process.
• 96.47% of these respondents are unaware about special mobile application (PwD
App).
• PwD respondents reportedlack of facilities such as drinking water, toilet, and ramp at
polling booths. They also reported about the presence of long queue at the booths, no
separate queue for senior citizens, difficulty in getting voter slip, and unavailability of
a wheelchair at the polling booth.
Inducementsduring Elections
A free and fair election is imperative to vibrant democracy. Inducements influence voting
pattern and affect the election results thereby compromising withtransparency and fairness of
the entireelectoral process. Section on inducements reveals the following information:
• 96% of the respondents deny receiving any inducements in the previous elections.
They also deny use of money and muscle power by parties or candidates.
• 10.57% respondents admitted to attending political rallies. In 90% of such cases, the
expenses are borne by the party or candidate.

x
• 4% of the people who were approached with inducements informed that allurements
can be in form of cash, food packets, fuel coupons, liquor and other promises.
Conclusion
The result shows that there exists a large scope to increase awareness among people about the
electoral process, increase voter participation, make the registration process more efficient,
increase the exposure to SVEEP interventions, and increase the participation of PwDs.
Strategic interventions and adequate planning by the Election Commission of India will
improve the overall election process and turn voters more informed and concerned about the
election process. This will lead to establishing good governance and democracy.
CONTENTS
Chapter Particulars Page No.
Project Research Team ii
Acknowledgements iii
Executive Summary iv-ix
Contents x
List of Tables xi-xiv
List of Figures xv-xviii
List of Abbreviations xix
1 Introduction 1-22
2 Socio-Economic Demographic Profile 23-37
3 Voter Registration 38-59
4 Knowledge, Attitude, Behaviour, Belief, and Practices 60-78
5 Voter Awareness and Attitude 79-89
6 Exposure to SVEEP Interventions 90-101
7 Involvement of Persons with Disabilities (PwDs) in the Election 102-106
8 Inducement 107-110
9 Conclusions and Recommendations 111-122
Annexure-I Questionnaire in Hindi 123-136
Annexure-II Photographs Taken During the Field Study 137-150
xi
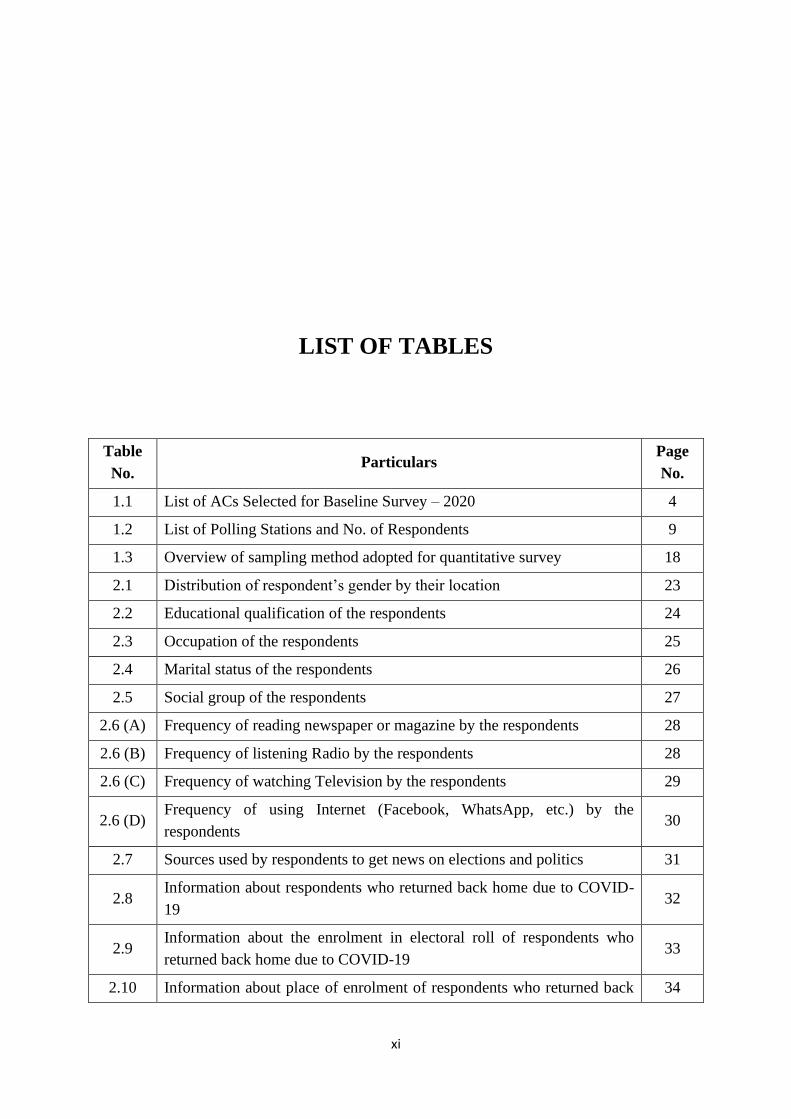
LIST OF TABLES
Table
No. Particulars
Page
No.
1.1 List of ACs Selected for Baseline Survey – 2020 4
1.2 List of Polling Stations and No. of Respondents 9
1.3 Overview of sampling method adopted for quantitative survey 18
2.1 Distribution of respondent’s gender by their location 23
2.2 Educational qualification of the respondents 24
2.3 Occupation of the respondents 25
2.4 Marital status of the respondents 26
2.5 Social group of the respondents 27
2.6 (A) Frequency of reading newspaper or magazine by the respondents 28
2.6 (B) Frequency of listening Radio by the respondents 28
2.6 (C) Frequency of watching Television by the respondents 29
2.6 (D) Frequency of using Internet (Facebook, WhatsApp, etc.) by the
respondents 30
2.7 Sources used by respondents to get news on elections and politics 31
2.8 Information about respondents who returned back home due to COVID-
19 32
2.9 Information about the enrolment in electoral roll of respondents who
returned back home due to COVID-19 33
2.10 Information about place of enrolment of respondents who returned back 34

xii
home due to COVID-19
2.11 Willingness of the respondents who came back to their homes due to
COVID-19 to vote in the upcoming assembly elections 34
2.12 Willingness of the respondents to vote in the upcoming assembly
elections 35
2.13 Facilities expected on polling booth as precautionary measures
associated with COVID-19 36
3.1 Availability of a voter ID card/EPIC 39
3.2 Assessment of reasons behind not having a Voter ID card 40
3.3 Assessment of awareness about the ‘Voter’s List’ 41
3.4 Assessment of enrolment status of the respondents 42
3.5 Assessment of reasons behind non-enrolment 43
3.6 Assessment of awareness of enrolment requirement 44
3.7 Assessment of perceived correctness of enrolment 45
3.8 Assessment of non-enrolled family member(s) in the respondent’s
household 46
3.9 Assessment of reasons behind having non-enrolled family member(s) 47
3.10 Assessment of participant’s knowledge about the enrolment center’s
location 47
3.11 Assessment of participant’s knowledge about the EPIC (Election Card) 48
3.12 Assessment of the availability and custody of the EPIC (Election Card) 49
3.13 Assessment of the issuing date of the EPIC (Election Card) of
participants 50
3.14 Assessment of the total duration in getting the EPIC (Election Card) 51
3.15 Assessment of the process related complexities in getting the EPIC
(Election Card) 52
3.16 Assessment of the major issues in getting the EPIC (Election Card) 53
3.17 Assessment of substitutes of the EPIC (Election Card) 54
3.18 Participant’s awareness about local person appointed for assisting in
EPIC enrolment 55
3.19 Assessment of the participant’s awareness about local person’s
designation 56
3.20 Assessment of the respondents’ awareness about the local person’s visit
to their area 57
3.21 Assessment of the respondents’ awareness of the Polling booth’s location 58

xiii
4.1 Voting in the last Assembly Elections 60
4.2 Voting in the last Parliamentary Elections 61
4.3 Reasons for not voting during the previous elections 62
4.4 Assessment of reasons for voting during previous elections 64
4.5 Experience on the day of Voting 65
4.6 Assessment of motivating factors for selecting a particular candidate 66
4.7 Assessment of respondent’s family members eligible for voting who
have not voted 67
4.8 Reasons for not voting by eligible voters in the respondent’s family 68
4.9 Factors influencing voting preference 70
4.10 Factors influencing high voter turnout 71
4.11 Overall experience in the last elections 71
4.12 Assessment of security threats during elections 72
4.13 Deployment of the police force 73
4.14 Experience at the polling booth during elections 74
4.15 Behaviour of the polling staff at the polling booth during elections 75
4.16 Difficulties at the polling booth during elections 76
4.17 Type of difficulties faced by voters on the day of voting 77
5.1 Awareness about minimum age of registration to be a voter 79
5.2 Awareness about Date for determining qualifying age for getting
registered on the electoral voting 80
5.3 Awareness about Voters’ Day 81
5.4 (A) Awareness about NOTA option 81
5.4 (B) Awareness about the name of candidates available in Braille on the EVM 82
5.4 (C) Awareness about Voter Verifiable Paper Audit Trail VVPAT 83
5.5 Opinion of the respondents 84
5.6 Awareness about the priority access of elderly and electors with
disability during voting 86
5.7 Awareness about the availability of special volunteers to assist elderly
and electors with disability during voting 86
5.8 Awareness about the Assured Minimum Facilities for voters at the
polling stations 87
5.9 Awareness about the Postal Ballot facility for voters above 80 years 88
5.10 Awareness about the Postal Ballot facility for voters who are in the 88

xiv
essential services
6.1 Frequency of respondents to recall seeing or reading any voter/election
related campaign of Election Commission of India 90
6.2 Sources used by respondents to receive the election related information 92
6.3 Voter information/messages received by the respondents 93
6.4 Frequency of respondents able to recall tagline of the campaign during
this election 94
6.5 Frequency of the respondent who recall the message given by the
celebrities 95
6.6 Frequency of respondents who have accessedwww.nvsp.in 95
6.7 Purpose for using the website www.nvsp.in. 96
6.8 Satisfactory experience of the respondents who used the website
www.nvsp.in 97
6.9 Usage of voter helpline number and App 98
6.10 Purpose for using the Voter Helpline Number and App. 99
6.11 Satisfactory experience of respondents who used Voter Helpline No.
1950 or Voter Helpline App. 100
7.1 Information about households who have members with special abilities
in their family 102
7.2 Information (publicity/voter edutainment material) received by PwDs
which aimed at participation during the elections 103
7.3 Interaction of Booth Level Officers with PwDs 103
7.4 Experience of PwDs during the process of registration 104
7.5 Experience of PwDs during the process of voting 105
7.6 Awareness of PwDs about the special mobile application (PwD App) 106
8.1 Information about the inducements/offers given to influence voters 107
8.2 Information about the use of money or muscle power to influence voters 108
8.3 Participation of respondents in rallies or political events 108
8.4 Expenditure incurred to participate in the rallies or political events 109
8.5 Types of inducements used to lure respondents during the previous
elections 110

xv
LIST OF FIGURES
Figure
No. Particulars
Page
No.
1.1 Geographical coverage of sample survey in Bihar 6
1.2 Total sample size 17
2.1 Distribution of respondent’s gender by their location 23
2.2 Educational qualification of the respondents 24
2.3 Occupation of the respondents 25
2.4 Marital status of the respondents 26
2.5 Social group of the respondents 27
2.6 (A) Frequency of reading newspaper or magazine by the respondents 28
2.6 (B) Frequency of listening Radio by the respondents 29
2.6 (C) Frequency of watching Television by the respondents 30
2.6 (D) Frequency of using Internet (Facebook, WhatsApp, etc.) by the
respondents 31
2.7 Sources used by respondents to get news on elections and politics 32
2.8 Information about respondents who returned back home due to COVID-
19 32
2.9 Information about the enrolment in electoral roll of respondents who
returned back home due to COVID-19 33
2.10 Information about place of enrolment of respondents who returned back
home due to COVID-19 34

xvi
2.11 Willingness of the respondents who came back to their homes due to
COVID-19 to vote in the upcoming assembly elections 35
2.12 Willingness of the respondents to vote in the upcoming assembly
elections 36
2.13 Facilities expected on polling booth as precautionary measures
associated with COVID-19 37
3.1 Availability of a voter ID card/EPIC 39
3.2 Assessment of reasons behind not having a Voter ID card 40
3.3 Assessment of awareness about the ‘Voter’s List’ 41
3.4 Assessment of enrolment status of the respondents 42
3.5 Assessment of reasons behind non-enrolment 43
3.6 Assessment of awareness of enrolment requirement 44
3.7 Assessment of perceived correctness of enrolment 45
3.8 Assessment of non-enrolled family member(s) in the respondent’s
household 46
3.9 Assessment of reasons behind having a non-enrolled family member(s) 47
3.10 Assessment of participant’s knowledge about the enrolment center’s
location 48
3.11 Assessment of participant’s knowledge about the EPIC (Election Card) 49
3.12 Assessment of the availability and custody of the EPIC (Election Card) 50
3.13 Assessment of the issuing date of the EPIC (Election Card) of
participants 51
3.14 Assessment of the total duration in getting the EPIC (Election Card) 52
3.15 Assessment of the process related complexities in getting the EPIC
(Election Card) 53
3.16 Assessment of the major issues in getting the EPIC (Election Card) 54
3.17 Assessment of substitutes of the EPIC (Election Card) 55
3.18 Participant’s awareness about local person appointed for assisting in
EPIC enrolment 56
3.19 Assessment of the participant’s awareness about local person’s
designation 57
3.20 Assessment of the respondents’ awareness about local person’s visit of
the area 58
3.21 Assessment of the respondents’ awareness about the Polling booth’s
location 59

xvii
4.1 Voting in the last Assembly Elections 60
4.2 Voting in the last Parliamentary Elections 61
4.3 Reasons for not voting during previous elections 63
4.4 Assessment of reasons for voting during previous elections 65
4.5 Experience on the day of Voting 66
4.6 Assessment of motivating factors for selecting a particular candidate 67
4.7 Assessment of respondent’s eligible family members who have not
voted 68
4.8 Reasons for not voting by eligible voters in the respondent’s family 69
4.9 Factors influencing voting preference 70
4.10 Factors influencing high voter turnout 71
4.11 Overall experience in the last elections 72
4.12 Assessment of security threats during elections 73
4.13 Deployment of the police force 74
4.14 Experience at the polling booth during elections 75
4.15 behaviour of the polling staff at the polling booth during elections 76
4.16 Difficulties at the polling booth during elections 77
4.17 Type of difficulties faced by voters on the day of voting 78
5.1 Awareness about minimum age of registration to be a voter 79
5.2 Awareness about Date for determining qualifying age for getting
registered on the electoral voting 80
5.3 Awareness about Voters’ Day 81
5.4 (A) Awareness about NOTA option 82
5.4 (B) Awareness about the name of candidates available in Braille on the
EVM 83
5.4 (C) Awareness about Voter Verifiable Paper Audit Trail VVPAT 84
5.5 Opinion of the respondents 85
5.6 Awareness about the priority access of elderly and electors with
disability during voting 86
5.7 Awareness about the availability of special volunteers to assist elderly
and electors with disability during voting 87
5.8 Awareness about the Assured Minimum Facilities for voters at the
polling stations 87
5.9 Awareness about the Postal Ballot facility for voters above 80 years 88

xviii
5.10 Awareness about the Postal Ballot facility for voters who are in the
essential services 89
6.1 Frequency of respondents to recall seeing or reading any voter/election
related campaign of Election Commission of India 91
6.2 Sources used by respondents to receive the election related information 92
6.3 Voter information/messages received by the respondents 93
6.4 Frequency of respondents able to recall tagline of the campaign during
this election 94
6.5 Frequency of the respondent who recall the message given by the
celebrities 95
6.6 Frequency of respondents who have accessed www.nvsp.in 96
6.7 Purpose for using the website www.nvsp.in. 97
6.8 Satisfactory experience of the respondents who used the website
www.nvsp.in 98
6.9 Usage of voter helpline number and App 99
6.10 Purpose for using the Voter Helpline Number and App. 100
6.11 Satisfactory experience of respondents who used Voter Helpline No.
1950 or Voter Helpline App. 101
7.1 Information (publicity/voter edutainment material) received by PwDs
which aimed at participation during the elections 103
7.2 Interaction of Booth Level Officers with PwDs 104
7.3 Experience of PwDs during the process of registration 104
7.4 Experience of PwDs during the process of voting 105
7.5 Awareness of PwDs about the special mobile application (PwD App) 106
8.1 Information about the inducements/offers given to influence voters 107
8.2 Information about the use of money or muscle power to influence voters 108
8.3 Participation of respondents in rallies or political events 109
8.4 Expenditure incurred to participate in the rallies or political events 109
8.5 Types of inducements used to lure respondents during the previous
elections 110

xix
LIST OF ABBREVIATIONS
AC Assembly Constituency
BLO Booth Level Officer
CIMP Chandragupt Institute of Management Patna
COVID-19 Coronavirus Disease of 2019
ECI Election Commission of India
EPIC Electors Photo Identity Card
EVM Electronic Voting Machine
KABBP Knowledge, Attitude, Behaviour, Beliefs and Practices
KAP Knowledge, Attitude and Practices
LSE Lok Sabha Election
NGO Non-Governmental Organization
NOTA None of the Above
OBC Other Backward Class
PwD Person with Disability
SC Scheduled Caste
ST Scheduled Tribe
SVEEP Systematic Voters' Education and Electoral Participation
VVPAT Voter Verifiable Paper Audit Trail

xx

1
CHAPTER- 1
INTRODUCTION
1.1. Background of the Study
It is more than seven decades when India gained independence from the British rule and
chose Democracy as a way of public governance. In modern as well as traditional societies of
the world, Democracy is considered to be the finest form of governance because it entails
people’s participation in the legislation process, gives voice to their opinions and demands
and helps in resolving differences and conflicts in amicable manner. In India, the three pillars
of democracy - Executive, Legislature and Judiciary, serve these ends and are helpful in
providing checks and balances for various interest groups, institutions and the people in
power.
The founding policy makers of the nation were keen on establishing a representative
democracy wherein a bicameral parliamentary system consisting of Lower House (Lok
Sabha) and Upper House (Rajya Sabha), would epitomize the aspirations of common people
and be responsible for enactment of legislations to establish means of governance and ‘rule of
law’ in the country. In the existing parliamentary system in India, people vote to directly elect
their representatives for the Lower House while members of the Upper House are elected
through an electoral college consisting of members from the State Assemblies. These
members are elected by the people during the State Assembly elections. Implementation of
universal adult suffrage has ensured that people participate in representative democracy
irrespective of differences in caste, colour, creed, region, religion, language, status, age and
income. Representative democracy has worked well in the Indian scenario, primarily due to
growing social awareness, richness of the Indian Constitution and integrity and independence
of the institutions set up to realize the ethos of the Constitution. One such institution
established under the provisions of Indian Constitution is the Election Commission of India
(ECI) which is autonomous in nature and is entrusted with the responsibility of conducting
free and fair elections in the country.
The Election Commission of India is a constitutional body responsible for administering
elections in India in accordance with the provisions and powers provided by the Constitution.
2
The ECI provides the basic layout for conduction of general and state assembly elections in
different parts of the country and is responsible for enforcement of the model code of
conductduring polls. The Commission has taken many steps to ensure enhanced participation
of the voters in the electoral processes. Some of the notable initiatives include preparation
and regular updating of electoral rolls, creation of more polling booths, upscaling of security
and administrative arrangements at voting locations, use of Electronic Voting Machines
(EVMs), distribution of Electors Photo Identity Card (EPIC) to the eligible voters and
conduction of large scale awareness campaigns for people through various media vehicles.
These initiatives have yielded positive results. Elections in India are now carried out in more
conducive environment and there are better arrangements at the polling stations. Special care
is taken for voters who are elderly, women and with disabilities. The process largely remains
peaceful and over the years there is a sharp decline in the incidents of booth rigging, bogus
voting, and factional violence. Use of EVMs ensures quicker counting of votes and
dissemination of election results.
While the voting environment has improved considerably in recent years, the voter turnout at
polling stations has not been equally encouraging. It is a matter of concern for the Election
Commission of India because active participation of voters in electoral processes is essential
for a strong and sustained democracy in the country. The challenge for ECI is even deeper
this time given the wide-spread cases of COVID-19 disease in the country. The Commission
has been taking proactive steps so that the elections are more participatory and conducted
without fear and favor. In order to educate the voters and motivate them for voting, the ECI
runs Systematic Voters’ Education and Electoral Participation (SVEEP) program. The study
of voters’ composition and turnout rates and their Knowledge, Attitude, and Practices (KAP)
is also an integral part of election management. In KAP surveys, voters are randomly selected
from some sampled assembly constituencies. Through these surveys, the Commission gets to
understand the attitude of voters towards the entire gamut of elections and the reasons for not
participating in electoral process.
For better understanding of the types of positive behavioral inputs required to enhance
interest in the electoral process among voters, a well-structured research study is required.
The present baseline KABBP survey has been conducted to help the Election Department of
the state toformulate future strategies, programs and interventions for educating voters on all
the aspects of democratic and electoral process and hence, ensure higher voter participation in
forthcoming assembly elections in Bihar. This study also focuses on associated aspects such

3
as inducement of voters during election process, electoral registration and voting-related
issues with disabled electors and people’s expectations and suggestions regarding election
during COVID-19 pandemic. It is expected that the findings of this study shall provide
valuable insights that can help in meeting the desired objectives.
1.2. Research Objectives
Specific objectives of this study can be stated as under:
1. To assess votes’ awareness about enrolment procedure, eligibility and EPIC.
2. To identify key factors responsible for the participation of voters in the elections.
3. To understand the awareness and attitude of the voters regarding Assembly
Election.
4. To identify the exposure of SVEEP interventions to the voters.
5. To analyze the challenges faced by persons with disabilities (PwD) during
registration and voting
6. To assess use of inducements on the voters during elections.
1.3. Research Design
The major objective of the current study is to assess the current status of voters’ level of
knowledge, attitude involving belief and perception related to participation in the election
process. In light of this, the research team has formulated a comprehensive master plan to
ensure that requisite data in accordance with the problem at hand is collected accurately and
economically to integrate the different components of the study in a coherent and logical
way.
Research design is a comprehensive plan for selecting respondents, research sites, and data
collection procedures in an empirical research project. It is aimed at answering specific
research questions or testing specific hypotheses, and contains details on the processes
entailing research methodology, geographical outreach, sampling tools and techniques and
data collection process.
1.3.1. Geographical Coverage
For the purpose of public administration, Bihar has been divided into 9 divisions, 38 districts,
101 subdivisions and 534 circles or community development blocks. In terms of political
units, the state is sub-divided into 40 Parliamentary Constituencies (PCs) and 243 Assembly
Constituencies (ACs). The present research study has surveyed and collected data from 48
4
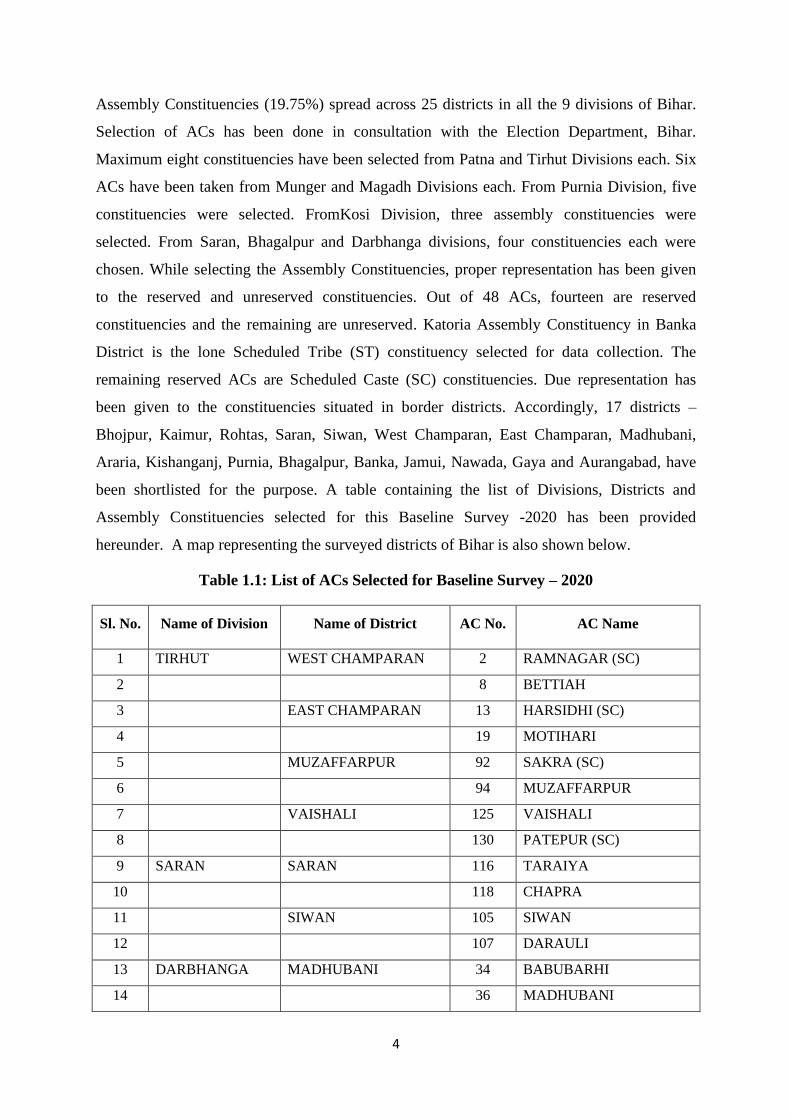
Assembly Constituencies (19.75%) spread across 25 districts in all the 9 divisions of Bihar.
Selection of ACs has been done in consultation with the Election Department, Bihar.
Maximum eight constituencies have been selected from Patna and Tirhut Divisions each. Six
ACs have been taken from Munger and Magadh Divisions each. From Purnia Division, five
constituencies were selected. FromKosi Division, three assembly constituencies were
selected. From Saran, Bhagalpur and Darbhanga divisions, four constituencies each were
chosen. While selecting the Assembly Constituencies, proper representation has been given
to the reserved and unreserved constituencies. Out of 48 ACs, fourteen are reserved
constituencies and the remaining are unreserved. Katoria Assembly Constituency in Banka
District is the lone Scheduled Tribe (ST) constituency selected for data collection. The
remaining reserved ACs are Scheduled Caste (SC) constituencies. Due representation has
been given to the constituencies situated in border districts. Accordingly, 17 districts –
Bhojpur, Kaimur, Rohtas, Saran, Siwan, West Champaran, East Champaran, Madhubani,
Araria, Kishanganj, Purnia, Bhagalpur, Banka, Jamui, Nawada, Gaya and Aurangabad, have
been shortlisted for the purpose. A table containing the list of Divisions, Districts and
Assembly Constituencies selected for this Baseline Survey -2020 has been provided
hereunder. A map representing the surveyed districts of Bihar is also shown below.
Table 1.1: List of ACs Selected for Baseline Survey – 2020
Sl. No. Name of Division Name of District AC No. AC Name
1 TIRHUT WEST CHAMPARAN 2 RAMNAGAR (SC)
2 8 BETTIAH
3 EAST CHAMPARAN 13 HARSIDHI (SC)
4 19 MOTIHARI
5 MUZAFFARPUR 92 SAKRA (SC)
6 94 MUZAFFARPUR
7 VAISHALI 125 VAISHALI
8 130 PATEPUR (SC)
9 SARAN SARAN 116 TARAIYA
10 118 CHAPRA
11 SIWAN 105 SIWAN
12 107 DARAULI
13 DARBHANGA MADHUBANI 34 BABUBARHI
14 36 MADHUBANI

5
Sl. No. Name of Division Name of District AC No. AC Name
15 DARBHANGA 82 DARBHANGA RURAL
16 85 BAHADURPUR
17 KOSI SAHARSA 74 SONBARSHA
18 75 SAHARSA
19 MADHEPURA 72 SINGHESHWAR (SC)
20 PURNIA ARARIA 48 FORBESGANJ
21 49 ARARIA
22 KISHANGANJ 55 KOCHADHAMAN
23 PURNIA 59 BANMANKHI (SC)
24 62 PURNIA
25 PATNA KAIMUR 204 MOHANIA (SC)
26 205 BHABUA
27 ROHTAS 208 SASARAM
28 212 DEHRI
29 BHOJPUR 194 ARRAH
30 195 AGIAON
31 PATNA 184 PATNA SAHIB
32 188 PHULWARI (SC)
33 BHAGALPUR BANKA 161 BANKA
34 162 KATORIA (ST)
35 BHAGALPUR 154 PIRPAINTI (SC)
36 156 BHAGALPUR
37 MUNGER BEGUSARAI 142 BACHHWARA
38 146 BEGUSARAI
39 KHAGARIA 148 ALAULI (SC)
40 149 KHAGARIA
41 JAMUI 241 JAMUI
42 243 CHAKAI
43 MAGADH AURANGABAD 222 KUTUMBA (SC)
44 223 AURANGABAD
45 GAYA 227 IMAMGANJ (SC)
46 230 GAYA TOWN
47 NAWADA 235 RAJAULI (SC)
48 237 NAWADA

6
Districts Covered for Baseline Survey (in Green Color)
Figure 1.1: Geographical Coverage of Sample Survey in Bihar
1.3.2. Research Methodology
Methodology provides the philosophical and operational groundwork for the process adopted
to carry out any research. Essentially, the procedure by which researchers go on to
conceptualize, describe and explain their work and predict phenomena is called research
methodology. For this study, a quantitative research methodology like questionnaire based
survey was designed to measure voter’s perception, attitude and behaviour in Bihar.
Questionnaire based survey has been found to be efficient in collecting information from a
large number of respondents where a wide range of information needs to be collected.

7
1.3.2.1. Secondary Data Collection
The faculty team of CIMP held discussions with the officials of the Election Department
regarding selection of districts, Assembly Constituencies and polling booths with high and
low voter turnout. The objective was to get a representative sample for this survey. Based on
these detailed discussions, the team collected the secondary data pertaining to the voter
turnout during the last general election (assembly-wise and booth-wise) for sampling
purposes. The team also collected the contact numbers of District Collector-cum-District
Election Officer and Deputy Election Officer of relevant districts. For the ease of finding the
location of booths and the Booth Level Officer (BLO), much needed information was
collected from the website of the Chief Electoral Officer, Bihar. Such information were
shared with the field investigators which immensely helped them in locating booths,
contacting the BLOs and conducting this data collection work.
1.3.2.2. Primary Data Collection for Quantitative Survey
Primary data collection through a well-designed questionnaire forms the core of this research
study. All pertinent data have been captured using a basic questionnaire template approved by
the Election Commission of India. However, for this survey, the basic template was suitably
modified and developed for data collection purpose. Hence,questions related to inducement
and COVID-19 were added to the original format.For the sake of convenience of the
enumerators and the general public, the questionnaire was translated into Hindi, without any
tampering with the instructions, section heads and the data entry codes. It covers various
aspects of KAP survey such as profile of the respondents, voter registration and participation,
their awareness and attitude, and exposure to SVEEP interventions. A special section
captures pertinent information related to persons with disabilities, COVID-19 and
inducement of electors. The questionnaire includes single response and multiple response
questions. Most of the questions are close-ended and have been assigned a code to capture the
responses of the person being interviewed. The target group for this KAP survey was eligible
voters (respondents above the age of 18 years) in a household who are registered and are
available for the interview. Selection of the household attached to a sampled booth was done
randomly. In a family, the respondent was selected through a Kish grid provided in the

8
questionnaire. This further added to the randomness in the selection of respondent for this
survey. A copy of the questionnaire has been attached with this report as Annexure - I.
1.3.2.3. Quantitative Survey
In addition to the quantitative survey through a structured questionnaire, the research team
also collected qualitative information on various aspects such as reasons for low and high
turnout of voters in the recently held general election, amenities available at the polling
booth, role of the Booth Level Officer (BLO), location of the booth, people’s attitude towards
electoral process, etc. During data collection, field enumerators interacted with various
electors, general public, Booth Level Officers and other functionaries and marked down their
observations.
1.3.3. Sample Size
During this research study, all the 243 Assembly Constituencies from all 38 districts of Bihar
were considered for sample selection. From this data universe, 50 Assembly Constituencies
were selected for data collection in consultation with the Election Department of the State.
However, owing to various ground-level challenges in form of incessant rains, flooding of
areas, Covid-19 pandemic, lockdown in various districts and finally the state-wide lockdown,
markedly hampered the intensity of data collection work and the field investigators could
collect data from 48 assembly constituencies only.
In order to ensure a proper representation of the electors spread across the length and breadth
of the State, all the nine administrative divisions of Bihar were represented through the 48
Assembly Constituencies spread in the 25 sampled districts. Major criteria for selection of
these constituencies was their spread across the state, their categorization as reserved or
unreserved constituencies, their location in difficult terrain (hill, forest, etc.), constituencies
affected by naxal activities and constituencies located in border districts. The research team
obtained the names of ten highest and ten lowest polling stations of each of these ACs from
the Election Department Office. This list has been prepared on the basis of voter turnout ratio
in the Lok Sabha General Election -2019. From this list, names of two high polling and two
low polling booths were selected and provided to the investigators for data collection. Hence,
from each sampled constituency, four polling stations were taken. The research team also
ensured that urban and rural booths get proportionately represented in the overall sample.
This was done to develop an insight about the factors, practices, beliefs, etc. that lead to high

9
and low voting. One of the basic outcomes of this information shall be to use these findings
to enhance the overall voting percentage in various assembly constituencies.
The data collection team surveyed respondents from 190 polling booths in 48 ACs. A total of
5863 respondents were interviewed during this survey. While collecting data at a particular
booth, the field investigators were instructed to select respondents from a representative
sample. Proper mix of gender, age, community, etc. was taken into consideration. This was
done to avoid any biases in the data and the resulting inferences. A list of districts, assembly
constituencies, polling booths selected for data collection is given hereunder.
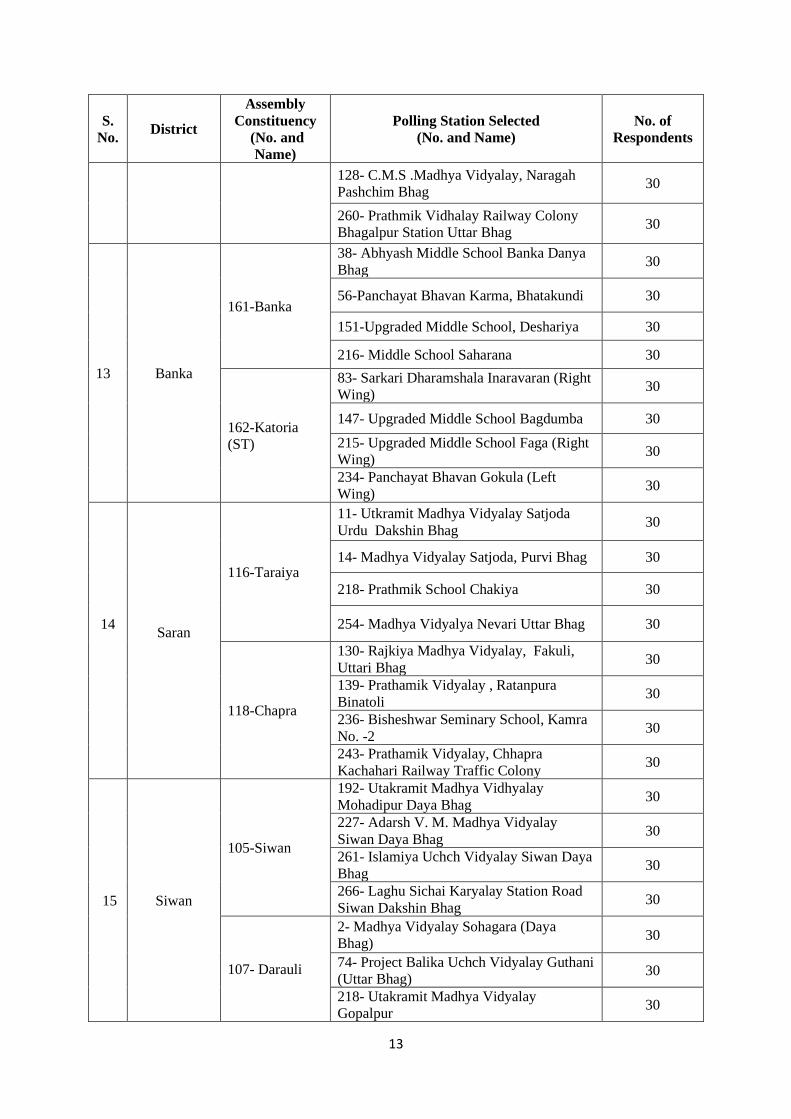
Table 1.2: List of Polling Stations and No. of Respondents
S.
No. District
Assembly
Constituency
(No. and
Name)
Polling Station Selected
(No. and Name)
No. of
Respondents
1 Patna
184-Patna
Sahib
1-Prathamik Vidyalay Math Kedaranath
Uttari Bhag 51
20- Rajakiya Polytechnic Gulajarabag
Uttari Bhag Ka Dusra Kamra 53
288-Harijan Madhya Vidyalay Beladari
Tola Uttari Bhag 50
303-Kanhai Lal Madhya Vidyalay
Chutakiya Bajar Pashchimi Bhag 52
188-Phulwari
Sharif
5-Prathmik Vidyalaya Beldari Tola,
Dharmpur 51
127-Madhya Vidyalaya, Ranipur Dakshani
Bhag, Ranipur 51
247-Prathmik Vidyalaya, Sultanchak 52
325-Madhya Vidyalaya, Maranchi 51
2
Rohtas
208-Sasaram
62- Madhay Vidyalay, Amara Talav
(Pashchim Bhag) 30
111- Kanya prathamik vidyalay takiya
sasaram (purvi bhag) 30
130-Samudayik bhavan Gaurkshani
(pashicham bhag) 30
303-Prathamik vidhyalay Bahera 30
212-Dehri
186- Prathamik Vidyalay, Mathuri,
(Hindi)Madhy Bhag 30
187-Prathamik Vidyalay, Mathuri, (hindi)
paschim bhag 30
193-Prathmik Vidyalay New Sidhauli
(Dakshin Bhag) 30
205- Rajkiya Balika Uchh Vidyalay,
Dalmiya Nagar (Uttar Bhag) 30
194-Arrah 276-Lok Nirman Pramandal Karyalay, Ara, 30

10
S.
No. District
Assembly
Constituency
(No. and
Name)
Polling Station Selected
(No. and Name)
No. of
Respondents
3
Bhojpur
291- Madhya Vidyalay Anaith Ara
(Dakshini Bhag) 30
316- Madhya Vidyalay Jamira (Pashchimi
Bhag)Ara 30
332- Utkramit Madhya Vidyalay Alipur 30
195-Agiaon
43- Utkramit Madhya Vidyalay Kurakuri,
(Pashcimi Bhag) 30
67- Utkramit Madhya Vidyalay, Balabandh
(Pashchim Bhag) 30
139- Madhya Vidyalay, Koyal (Madhya
Bhag) 30
274- Prathamik Vidyalay, Nonaur Ganj Par 30
4
Kaimur
204-Mohania
(SC)
99- Utkramit Madhya Vidyalaya Rasulpur
Karmahari 30
216-Utkramit Madhya Vidyalay, Ghateyan 30
228-Urdu Prathmik Vidyalay Babhangavan 30
264- Utkramit Madhya Vidyalay, Golaudih 30
205-Bhabhua
10-Utkramit Madhya Vidyalay, Goraipur
(Purvi Bhag) 5
11- Utkramit Madhya Vidyalay, Goraipur
(Paschimi Bhag) 30
120- Rajkiya Balika Madhya Vidyalay,
Bhabhua,Ward -18 (Dakshini Bhag ) 30
126- Sasaram Bhabhua Central Coperative
Bank Bhabhua Ward No.-3 (Pashchimi
Bhag-1)
30
5
West
Champaran
2-Ramnagar
(SC)
121- Madhya Vidyalay, Inar Bharva 30
130- Madhya Vidyalay Sabeya, Utari Bhag 30
165-Rajakiy Prathamik Vidyalay,
Banahava Parasa 30
210- Rajakiy Prathamik Vidyalay,
Mahayogin 30
8-Bettiah
70- Prathamik Vidyalaya Railway Colony
Bettiah Paschim Bhag, banya bhag 30
99- Van Vibhag Karyalay Betiya Purwi
Bhag 30
157-Prathamik Vidyalay, Avaraiya 30
200- Rajakiy Utakramit Madhya Vidyalay,
Jagannathpur 30
6 East 13-Harisidhi 6- Prathmik Vidyalaya, Dudhni (Nav 30

11
S.
No. District
Assembly
Constituency
(No. and
Name)
Polling Station Selected
(No. and Name)
No. of
Respondents
Champaran (SC) Nirmit Bhawan) Baya Bhag
118- Utkramit Madhya Vidyalaya,
Rampurwa Barmaswa, Baya Bhag 30
119- Utkramit Madhya Vidyalaya,
Rampurwa Barmaswa, Daya Bhag 30
192- Madhya Vidyalaya, Raghunathpur
Dakshini Bhag 30
19-Motihari
4- Madhya Vidhalay Bahuari Purana
Bhawan 30
143- Maharani Janaki Kunwar Kanya
Uchha Vidyalaya, Motihari, Paschimi Bhag 30
164- Mahabir Madhay Vidhalay
Luathahan, Motihari Daya Bhag 30
176- Utkramit Madhay Vidhalay Bairia
Baya Bhag 30
7 Muzaffarpur
92-Sakra (SC)
89- Prathamik Vidhyalay ,Sakara Wajid 30
114- Madhya Vidhyalay, Vishunapur
Baghanagari (Dakshini Bhag) 30
234- Urdu Prathamik Vidyalay, Rajapur 30
250- Urdu Uttkarmit Madhya Vidhalay
Makatab, Rahimapur Raksha (Uttari Bhag) 30
94-Muzaffarpur
5- Yantrik Karyalay, Rashtriya Uchha Path
Pariyojana Lok Nirman Vibhag
Muzaffarpur Sikandarapur Kundal Purvi
Bhag
30
13- Rajkiye Madhya Vidhyalay, Laxmi
Chowk Brahmapura, Uttar Bhag 30
30- Arabi College, Brahmapura, Dakshin
Bhag 30
168- Islamiya Degree College, Pakki Sarai 30
8 Vaishali
125-Vaishali
2- Rajkiy prathmik vidhyalay Fuladh,
kamra No - 02 30
25- Rajkiy prathmik vidyalay Chakrasul
kamra no- 2 30
239- Utkramit Madhy Vidhyalay Lodipur
Uttar Bhag 30
272- Rajkiya Prathmik Vidhalay Rampur
Sarotar 30
130-Patepur
118- Rajkiye Madhya Vidyalay, Patepur 30
184- Panchayat Bhawan imadpur Uttar
Bhag 30
214- Prathamik Vidyalay,Vajitpur,Kushahi 30
217- Prathamik Vidyalay,Raghopur
Wajitpur Shiv Mandir 30

12
S.
No. District
Assembly
Constituency
(No. and
Name)
Polling Station Selected
(No. and Name)
No. of
Respondents
9 Araria
48-Forbesganj
49- Madhya Vidyalay Pipra, North Part 30
100- Nibandhan Karyalay Forbesganj,
North Part 30
106- Nagar Parishad Karyalay Forbesganj,
Naya Bhawan 30
188- Madhya Vidyalay Lahsanganj 30
49-Araria
11- Utkramit Madhya Vidyalay Jamua
Dharbari (North Part) 30
91- Madhya Vidyalay Wanswari (South
Part) 30
168- Koshi Rajaswa Karyalay Araria
(East Part) 30
177- Azad Academy, Araria (West Part) 30
10 Kishanganj 55-
Kochadhaman
40- Madarsa Saptiya Vishanpur (North
Part) 30
231- Utkrmit Madh Vidhalay. Samda Purab
Bhag 30
11 Purnia
59-Banmankhi
(SC)
66- Madhya Vidyalay Kachahari Balua
Madhepura 30
77- Madhya Vidyalay Masuriya Uttar 30
141- Madhya Vidyalay Radhanagar 30
279- Madhya Vidyalay Kailu Tol Dakshin
Madhya Bhag 30
62-Purnia
34- Rajaswa Up Samahartta Karyalay
Koshi Yojana Purnia Dakshin Bhag 30
78- Braj Bihari Memoriyal Uchcha
Vidyalay Bhatta Uttar Bhag 30
237- Prathmik Vidyalay Aga Tola Uttar
Bhag 30
277- Utkramit Madhya Vidyalay
Jiyagachhi 30
12 Bhagalpur
154-Pirpainti
(SC)
75- Prathamik Vidyalay Lalapur 30
77- Pustakalay Bhavan Sarakapur 30
140- C.K. Uchcha Vidyalay, Kairiya Uttar
Bhag 30
164- Utkramit Madhya Vidyalay,
Chaukhandi 30
156-Bhagalpur
36- C.M.S.Prathamik Vidyalay, Adamapur,
Uttar Bhag 30
117- Prathamik Vidyalay Nasaratakhani,
Madhya Bhag 30
13
S.
No. District
Assembly
Constituency
(No. and
Name)
Polling Station Selected
(No. and Name)
No. of
Respondents
128- C.M.S .Madhya Vidyalay, Naragah
Pashchim Bhag 30
260- Prathmik Vidhalay Railway Colony
Bhagalpur Station Uttar Bhag 30
13
Banka
161-Banka
38- Abhyash Middle School Banka Danya
Bhag 30
56-Panchayat Bhavan Karma, Bhatakundi 30
151-Upgraded Middle School, Deshariya 30
216- Middle School Saharana 30
162-Katoria
(ST)
83- Sarkari Dharamshala Inaravaran (Right
Wing) 30
147- Upgraded Middle School Bagdumba 30
215- Upgraded Middle School Faga (Right
Wing) 30
234- Panchayat Bhavan Gokula (Left
Wing) 30
14
Saran
116-Taraiya
11- Utkramit Madhya Vidyalay Satjoda
Urdu Dakshin Bhag 30
14- Madhya Vidyalay Satjoda, Purvi Bhag 30
218- Prathmik School Chakiya 30
254- Madhya Vidyalya Nevari Uttar Bhag 30
118-Chapra
130- Rajkiya Madhya Vidyalay, Fakuli,
Uttari Bhag 30
139- Prathamik Vidyalay , Ratanpura
Binatoli 30
236- Bisheshwar Seminary School, Kamra
No. -2 30
243- Prathamik Vidyalay, Chhapra
Kachahari Railway Traffic Colony 30
15 Siwan
105-Siwan
192- Utakramit Madhya Vidhyalay
Mohadipur Daya Bhag 30
227- Adarsh V. M. Madhya Vidyalay
Siwan Daya Bhag 30
261- Islamiya Uchch Vidyalay Siwan Daya
Bhag 30
266- Laghu Sichai Karyalay Station Road
Siwan Dakshin Bhag 30
107- Darauli
2- Madhya Vidyalay Sohagara (Daya
Bhag) 30
74- Project Balika Uchch Vidyalay Guthani
(Uttar Bhag) 30
218- Utakramit Madhya Vidyalay
Gopalpur 30

14
S.
No. District
Assembly
Constituency
(No. and
Name)
Polling Station Selected
(No. and Name)
No. of
Respondents
270- Madhya Vidyalay Jamalpur (Baya
Bhag 30
16 Begusarai
142-Bachhwara
12-Utkramit Madhya Vidhalay Govindpur
Dakshin Bhag 30
29- Utkramit Madhya Vidyalay
Havasapur, Dakshin Bhag 30
37- Madhya Vidhalay, Samsa Paschim
Bhag 30
167- Madhya Vidyalay Chamtha -1
Chhotkhut Daya Bhag 30
146-Begusarai
70- Urdu Prathamik Vidyalay, Singadaha
Pashchim Bhag 30
72- Madhya Vidyalay,Bakhatapur 30
236- Aayurvedik Mahavidhalay Begusarai
Dakshin Bhawan Madhay Bhag 30
296- Nagarapalika Karyalay, BegusaraI
Pashchimi Bhag Daya Bhag 30
17 Khagaria
148-Alauli (SC)
53- Madhy Vidyalay Aura (Pashchimi
Bhag) 30
136- Middle School Chharrapatti Madhy
Bhag 30
176- Madhy Vidyalay Mohanapur 30
235- Panchayat Bhavan Jalakauda 30
149-Khagaria
79- Samudayik Bhavan Sanhauli Panchayat
Karyalay South Side 30
89- Dayanand Sarswati Madhay Vidyalay
Maturapur Sanhauli Naya Bhavan 30
98- Madhya Vidyalay Ramatola Kothiya 30
137- Town Hall, Khagaria 30
18 Jamui
241-Jamui
92- Uchcha Vidyalay Jamui (Pachhim
Bhag) 30
146- Samudayik Bhavan Lotan Anusuchit
Jati Kendar 30
160- Van Vibhag Vishramalay Guramaha 30
224- Utkramit Urdu Madhya Vidyalay
Guguladih Baya Bhag 30
243-Chakai
43- Utkramit Madhya Vidyalay
Kendualevar 30
150- Utkramit Madhya Vidyalay
Gaganapur Danya Bhag 30
156- Utkriyamit Madhya Vidyalay
Manjhla Dih 30

15
S.
No. District
Assembly
Constituency
(No. and
Name)
Polling Station Selected
(No. and Name)
No. of
Respondents
270- Prathamik Vidyalay Manakola 30
19 Aurangabad
222-Kutumba
(SC)
36- Utkramit Madhya Vidyalay Basadiha 32
156- Prathamik Vidhalay Dadhapa
Utarwari Bigha 30
211- Samudayik Bhavan Mandar Gopal 32
262 -Madhya Vidyalay, Pachaukhar Purana
Bhawan 31
223-
Aurangabad
23- Madhya Vidyalay Manjurahi 32
54- Utkramit Madhya Vidyalay Chatara 32
162- Anugrah Madhya Vidyalay,
Aurangabad Purvi Bhag Kamara No- 3 34
166- Jila Pashupalan Karyalay Aurangabad
Uttar Bhavan 30
20 Gaya
227-Imamganj
(SC)
1-Middle School, Hurmeth 30
110- Madhya Vidyalay Madsari 30
240- Utkramit Madhya Vidyalay, Lutua 30
329- Utkramit Madhya Vidyalay, Lutua 30
230-Gaya
Town
2- Prathamik Vidyalay, Dhaniya Bagicha
(Bayan Bhag) 31
34- Prathamik Vidyalay, Sanjay Nagar 32
141- Adhikshan Abhiyanta, Vidhut
Karyalay Gairej, Katari Road (Purwi Bhag) 30
162- Gaya College, Bhugol Vibhag 31
21 Nawada
235-Rajauli
(SC)
43- Prathmik Vidyalay Lalu Nagar 30
108- Utkramit Madhya Vidyalay Manjhauli 30
160- Prathmik Vidhyalay Chhomuha 30
284- Prathamik Vidyalay Bigha Haradiya
Sector-C 30
237-Nawada
116- Utkrmit Madhya Vidhalay Sonsihari
Dakshni Bhag 30
117- Utkrmit Madhya Vidhlay
Manjhanpura 30
200- Samudayik Vikas Bhavan
Jayasinavigaha 30
254- Kanya Inter Vidyalay Navada Kamara
No.- 5 Avasthit Prasad Vigaha 30

16
S.
No. District
Assembly
Constituency
(No. and
Name)
Polling Station Selected
(No. and Name)
No. of
Respondents
22 Darbhanga
82-Darbhanga
Rural
86- Panchayat Bhavan, Dhoi, Puravi Bhag 30
116- Kanya Prathamik Vidyalay, Bhalapatti 30
136- Upgraded Middle School Narayanpur
Urdu, North Part 30
144- Primary School Anusuchit Jati Paithan
Kawai,East Part 30
85-Bahadurpur
10- Utkramit Madhya Vidyalaya,
Ratanpura (Dakshini Bhag) 30
81- Madhya Vidyalay Narsara (Purvi Bhag) 30
122- Utkatmit Madhya Vaidyalay
,Taralahi (Dakshini Bhag) 30
172- Prathmik Vidyalay Bhairopatti 30
23 Madhubani
34-Babubarhi
131- Primary School, Marukiya Left Part 30
199- Primary School, Bela Rauahi 30
241- Primary Maqtab, Babubarhi Right
Part 30
243- Middle School, Babubarhi Right Part 30
36-Madhubani
50- Sanskrit Uchcha Vidyalay,Jaladhari
Chauk Madhubani 30
75- Madhy Vidhalay Basuara Naya Bhavan
Uttar Bhag 30
238- Prathmik Vidyalay, Pachadhi 30
281- Prathmik Vidyalay, Pandaul Bazar 30
24 Saharsa
74-Sonbarsha
18- Madhya Vidyalay Rahua Purvi Bahg 30
128- Panchayat Bhavan Sonvarsha Uttar
Bhag 30
146- Middle School Khajuraha Pashchami
South Side 30
218- Madhya Vidyalay Behata Dakshini
Bhag 30
75-Saharsa
134- Samudayik Bhavan Hasa Hakapara
Dakshin Bhag 30
171- Manohar Uchcha Vidyalay Saharasa
Pachmi Bhag 30
185- Utkramit Middle School Koralahi
Sarahasa 30
306- Uttkramit Middle School Bhavanipur 30
25 Madhepura 24- Madhya Vidyalay, Baihari 30

17
S.
No. District
Assembly
Constituency
(No. and
Name)
Polling Station Selected
(No. and Name)
No. of
Respondents
72-Singheshwar
(SC) 62- Kanya Madhya Vidyalay, Sinheshwar
Gauripur, Uttar Bhag 30
169- Gudar Madhya Vidyalay, Vishanapur,
Madhy Bhag 30
219- Madhya Vidyalay, Isarain Kala 30
TOTAL SAMPLE SIZE 5863
Figure 1.2: Total Sample Size
1.3.4. Sampling Methodology
Multistage stratified random sampling method was used for the selection of various
constituents of the population. In stratified random sampling, the population is divided into
small groups based on a particular criterion common to all members of the group. These
groups are known as ‘strata’. Then, a random sample from each stratum is taken
First stage
25 districts of the State
•All 9 administrative divisions of Bihar have been represented
Second Stage
48 Assembly Constituencies
• Proper representation has been given to the reserved and unreserved constituencies
Third Stage
High and Low turnout polling
stations
• Ensure that urban and rural booths get proportionately represented
Final Stage
30 households per Booth
• A representative through kish grid from each household

18
proportionately. The sum total of these random samples forms the universe for research
study. This technique is very useful in capturing important population characteristics in the
sample and in reproducing characteristics that are proportional to the overall population. In
this research study, the randomness of the data was ensured at multiple levels – during
selection of assembly constituencies, polling stations, households and finally the selection of
respondents.
Table 1.3: Overview of Sampling Method Adopted For Quantitative Survey
S. No. Particulars Nos.
1 Total number of districts in Bihar 38
2 Number of districts covered (65.79%) 25
3 Total number of Assembly Constituencies 243
4 Number of Assembly Constituencies targeted (20.57%) 50
5 Number of Assembly Constituencies actually surveyed (19.75%) 48
6 Number of Polling Stations targeted 200
7 Number of Polling Stations actually surveyed 190
8 Total sample size targeted (No. of Respondents) 6000
9 Total sample size actually achieved 5863
1.4. Project Implementation
The aim of this section of the report is to provide information about the operational details of
the study.
1.4.1. Development of Research Tools
Since survey forms the core of this entire research work, a well-structured questionnaire was
used for the purpose. The KAP Survey questionnaire approved by the ECI served as the basis
for this study as well. However, the template was suitably modified and extended to serve the
objectives of the current study. Accordingly, a section on inducements during election was
included in the basic template. This apart, pertinent questions on COVID-19 pandemic and
about persons with disabilities were added. After approval from competent authority, this
questionnaire was administered to the respondents above the age of 18 years who were
selected as per the sampling plan given in Section 1.3.3 and 1.3.4. For the sake of
convenience of the enumerators and the general public, the project team has ensured that

19
questionnaire has been translated into Hindi, without any tampering with the instructions,
section heads and the data entry codes. The KAP tool was then translated and back translated
to ensure that no information was lost due to translation.
1.4.2. Training of Field Teams
An orientation and training programme was organized at the Chandragupt Institute of
Management Patna (CIMP) premises in the last week of June, 2020, to select prospective
Field Investigators (FIs). The final list of FIs included a proper mix of young and elderly
investigators who are well versed in Hindi and had prior experience of conducting such social
surveys. Each question of the survey questionnaire was discussed at length with the
investigators and their doubts were clarified by the project team. They were trained on
various aspects related to the KAP survey especially about selecting respondents using Kish
Grid, conducting the interviews, filling coded responses and skipping the question, if needed.
Following a detail question-by-question discussion, various methods of probing/asking
questions were also discussed. Then the field investigators were asked to conduct mock
interviews among themselves in order to exterminate issues and biases related to the data
collection.
During the training program, issues related to ethical considerations in data collection were
discussed as well. The enumerators were briefed on aspects such informed consent of the
respondent, confidentiality of the information received and maintaining dignity of the person
responding. Before leaving for the field for data enumeration, they were provided with the
various codes required to fill the Section-A of the Questionnaire. They were also provided
with information regarding their Assembly Constituencies, the polling booths they have to
visit, authorization letter from CIMP, name and mobile no. of BLOs and the Deputy Election
Officer and other necessary details.
1.4.3. Field Survey and Data Collection
After completion of the training, the field investigators left for their respective areas for data
collection. Each investigator was provided with the necessary kit, questionnaires in adequate
numbers, and important contact numbers to initiate their work. They were instructed to
collect around 120 responses from each assembly constituency, with 50% of the responses
coming from high voter turnout area and the rest from low turnout area. While collecting data
at a particular booth, the field investigators were instructed to select respondents from a
representative sample. Proper mix of gender, age, community, etc. was taken into

20
consideration. This was done to avoid any biases in the data and the resulting inferences.
Selection of a respondent in a household was done randomly through a Kish Grid provided in
the questionnaire. In the case of unavailability of the person whose sequence appeared
through the grid, responses were collected from the next best alternate respondent in terms of
gender and age. In case of families having a member who is an eligible voter as well as a
person with disability, that member was selected for interview.The CIMP research team
directed the study and closely monitored the entire process of data collection. They were also
present for training of the enumerators and supervised the data collection work. The faculty
team maintained regular communication with these enumerators to assess the work in
progress, answer their queries and guide them in case of hindrances in field work.
1.4.4. Data Processing
After the preparatory data collection and data validation exercise was complete, the data entry
was conducted by experienced personnel under the supervision of the analytics and research
team. As per instructions of ECI, all data was coded, punched, cleaned and validated before it
was handed over to the research team for conducting data analysis. The chapters that follow
contain detail result of the analysis done on the data. The raw data was stored in ASCII
format that was converted to STATA/SPSS format.
1.5. Data Analysis and Documentation
The quantitative information, after data processing, culminated into tables and charts which
were used for further analysis and report writing. The data captured under the various heads
of the questionnaire were used for formulating the chapters of this report and the information
captured through the questions under those heads have been used for analysis work. In
addition to quantitative information, qualitative information were also generated during the
research study. Such information collected by field investigators, supervisors and faculty
team of CIMP were transcribed and have been used in enriching this report.
1.6. Ethical Considerations
The major ethical issues in conducting research are: informed consent, beneficence, respect
for anonymity and confidentiality, and respect for privacy. Research ethics involve the
protection of dignity of respondents, seeking consent of the respondents, ensuring privacy
and confidentiality of the respondent is maintained, allowing the respondent the freedom to
not answer a particular question/terminate interview and being sensitive to respondents with

21
special needs. The principle of informed consent involves researchers providing sufficient
information and assurances about taking part to allow individuals to understand the
implications of participation and to reach a fully informed, considered and freely given
decision about whether or not to do so, without the exercise of any pressure or coercion.
Following are the main ethical considerations that were taken into account while conducting
this study:-
a)Informed consent: Informed consent is the major ethical issue in conducting research.
Informed consent is one of the means by which a respondent’s right to autonomy is protected.
In the current study, full consent was obtained from the respondents prior to data collection
by the field investigators.
b)Freedom to terminate the interview and not to respond to questions: The purpose of the
study was explained to respondents and opportunity was given for non-participation in case
the respondent does not feel comfortable. The respondents were given rights to withdraw
from the data collection process at any stage if they wished to do so.
c)Privacy and confidentiality: Privacy and anonymity of respondents is of a paramount
importance. The issue of confidentiality and anonymity is closely connected with the rights of
beneficence, respect for the dignity and fidelity. Anonymity is protected as the respondents’
identity cannot be linked with personal responses. All the respondents of the current study
were well informed that their names, address or any other personal information will never be
disclosed to any other person or organization.
d)Respect and dignity of the respondent: The data collection related activities were conducted
only after ensuring that the respondents were comfortable about the entire process, context
and the surroundings. Gender roles and cultural factors were kept in perspective in
conducting the field work, especially the qualitative component of the study.
e)Influence and peer pressure: The field investigators made sure that only the respondent
answered the questions and there were no influences from surrounding members even if they
are from the same family/household.
f)Vulnerable groups of respondents: The vulnerable groups among the respondent covers
people from socially backward strata, women and people with special needs. The low
participation of vulnerable groups in research can be attributed to their inability to give an
informed consent and also to their need for further protection and sensitivity from the
researcher as they are in a greater risk of being deceived, threatened or forced to participate.

22
All the field investigators were given special training to collect data from these groups of
respondents for ensuring their participation in the current study.
1.7. Limitations of the Study
The population under study includes the inhabitants of 48 ACs in Bihar. However, the study
does not observe social interactions or communications between persons or institutions in a
given population, but only characteristics of the individual members involved.
Quantitative research’s main purpose is the quantification of the data, thereby allowing
generalisation of the results by measuring the views and responses of the sample population.
Every research methodology consists of two broad aspects– planningand execution. In
execution of these two aspects, there is likelihood of limitations that are beyond the control of
the researcher. Despite applying appropriate sampling plan, representation of the subjects is
dependent on the probability distribution of the observed data. This may lead to
miscalculation of probability distribution and further lead to falsity in proposition. The data
collection was confined to only 48 ACs in Bihar owing to time and resource constraints. The
sample for the present study comprised 5863 voters of Bihar. This sample is only a small
proportion of the entire population of voters in the State. Replication of this study with larger
sample and inwider regions of Bihar would enable better generalization of the findings of the
study.
Conclusions
The chapter has introduced the study objectives, described the research design, the
research methodology including the quantitative and qualitative components, and has
discussed the sampling plan and geographical coverage for the study. In the last, this Chapter
has described the project implementation plan, ethical considerations and concluded the
limitation of the current study. The next Chapter will present the social, economic and
demographic aspects of the respondents.

23
CHAPTER- 2
SOCIO-ECONOMIC DEMOGRAPHIC PROFILE
Introduction
This chapter describes the socio-economic demographic profile of the respondents. This
chapter provides information about the gender, area of residence, educational qualifications,
occupation, marital status, social group, reading, watching, and listening habits of the
respondents.
2.1: Distribution of respondent’s gender by their location
Table 2.1 shows that 61.62% of the total respondents are male and 38.38% of the total
respondents are female. Among male respondents, 43.61% belong to the rural area, and
18.01% of male respondents belong to the urban area. Among female respondents, 27.41%
belong to the rural area, and 10.97% belong to the urban area.
Table 2.1: Distribution of respondent’s gender by their location
Gender Rural Urban Total
Number Percent Number Percent Number Percent
Male 2557 43.61% 1056 18.01% 3613 61.62%
Female 1607 27.41% 643 10.97% 2250 38.38%
Grand Total 4164 71.02% 1699 28.98% 5863 100.00%
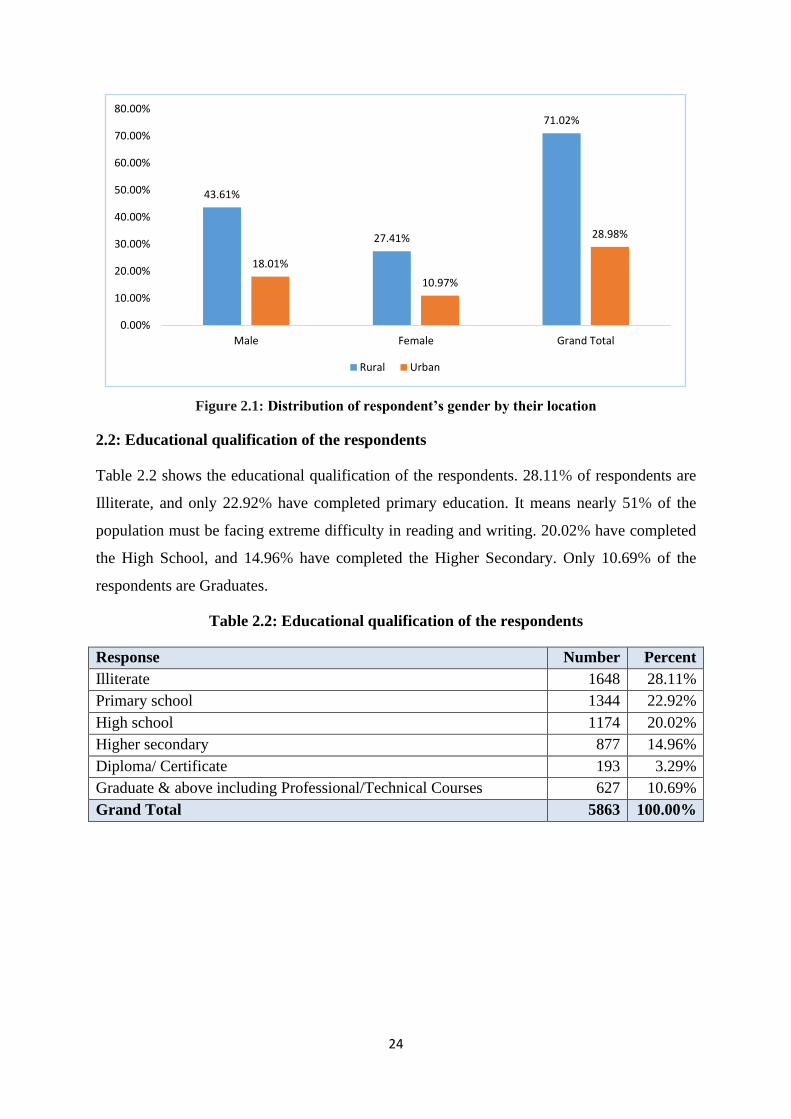
24
Figure 2.1: Distribution of respondent’s gender by their location
2.2: Educational qualification of the respondents
Table 2.2 shows the educational qualification of the respondents. 28.11% of respondents are
Illiterate, and only 22.92% have completed primary education. It means nearly 51% of the
population must be facing extreme difficulty in reading and writing. 20.02% have completed
the High School, and 14.96% have completed the Higher Secondary. Only 10.69% of the
respondents are Graduates.
Table 2.2: Educational qualification of the respondents
Response Number Percent
Illiterate 1648 28.11%
Primary school 1344 22.92%
High school 1174 20.02%
Higher secondary 877 14.96%
Diploma/ Certificate 193 3.29%
Graduate & above including Professional/Technical Courses 627 10.69%
Grand Total 5863 100.00%
43.61%
27.41%
71.02%
18.01%
10.97%
28.98%
0.00%
10.00%
20.00%
30.00%
40.00%
50.00%
60.00%
70.00%
80.00%
Male Female Grand Total
Rural Urban

25
Figure 2.2: Educational qualification of the respondents
2.3: Occupation of the respondents
Table 2.3 shows the occupation of the respondents. We found that the highest number of
respondents i.e. 36.55% are labourers (or related to some Agricultural activity) followed by
homemakers which constitute 30.89% of the respondents. 11.63% of the respondents have
their enterprise, 4.45% work for the government, and 8.32% work for the private sector.
2.71% of the respondents are students. 1.43% of the respondents are unemployed and 1.35%
are unemployed and available for work.
Table 2.3: Occupation of the respondents
Response Number Percent
Student 159 2.71%
Unemployed 84 1.43%
Unemployed available for work 79 1.35%
Government Service 261 4.45%
Private Service 488 8.32%
Own enterprise 682 11.63%
Labourer/ Cultivator/ Agricultural and allied activities 2143 36.55%
3.29%
10.69%
14.96%
20.02%
22.92%
28.11%
Diploma/ Certificate
Graduate & above including Professional/TechnicalCourses
Higher secondary
High school
Primary school
Illiterate

26
Home maker 1811 30.89%
Others* 106 1.81%
No Response 50 0.85%
Grand Total 5863 100.00%
*Business, Pensioner, Politician
Figure 2.3: Occupation of the respondents
2.4: Marital status of the respondents
Table 2.4 shows the marital status of the respondents. We found that 89.77% of the
respondents are married, 6.69% are not married, and 3.31% are widowed. A very small
fraction of the respondents (0.10%) are married and waiting for Gauna. The rate of divorce is
negligible among the respondents only 0.14% of the respondents got divorced or separated.
Table 2.4: Marital status of the respondents
Response Number Percent
Never married 392 6.69%
Married, No Gauna 6 0.10%
Married 5263 89.77%
Widowed 194 3.31%
Separated/divorced 8 0.14%
Grand Total 5863 100.00%
0.85%
1.35%
1.43%
1.81%
2.71%
4.45%
8.32%
11.63%
30.89%
36.55%
No Response
Unemployed available for work
Unemployed
Others*
Student
Government Service
Private Service
Own enterprise
Home maker
Labourer/ Cultivator/ Agricultural and allied activities
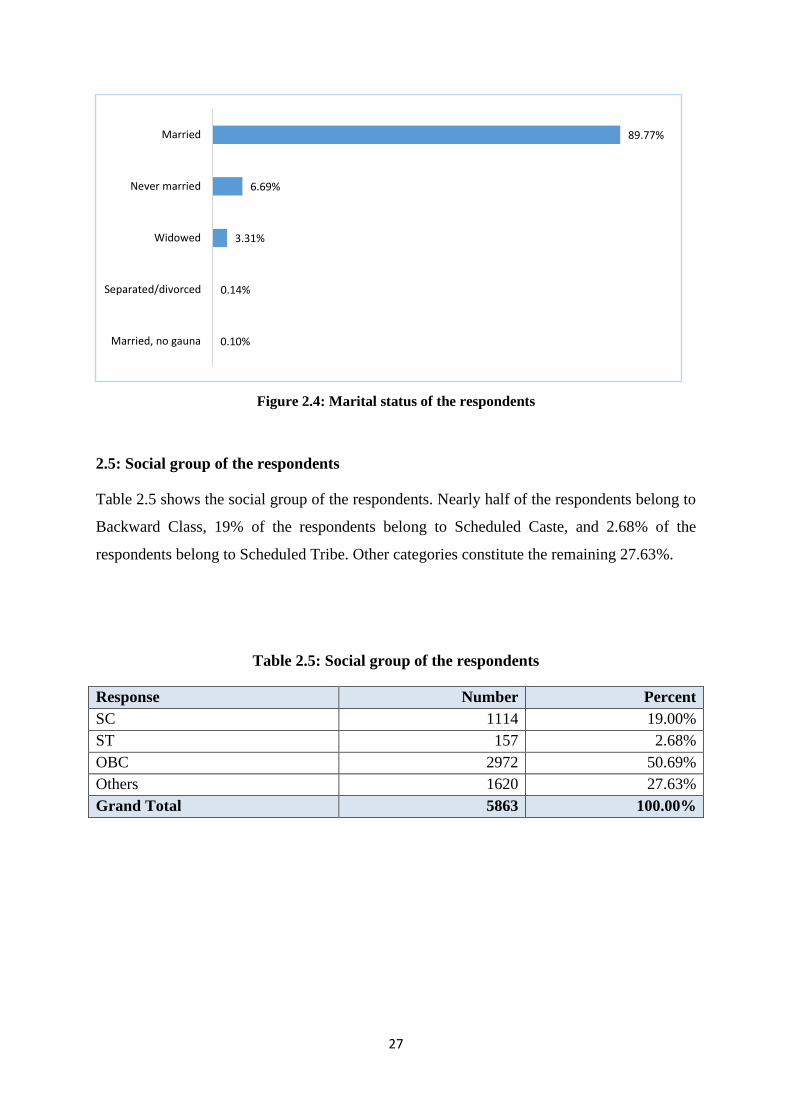
27
Figure 2.4: Marital status of the respondents
2.5: Social group of the respondents
Table 2.5 shows the social group of the respondents. Nearly half of the respondents belong to
Backward Class, 19% of the respondents belong to Scheduled Caste, and 2.68% of the
respondents belong to Scheduled Tribe. Other categories constitute the remaining 27.63%.
Table 2.5: Social group of the respondents
Response Number Percent
SC 1114 19.00%
ST 157 2.68%
OBC 2972 50.69%
Others 1620 27.63%
Grand Total 5863 100.00%
0.10%
0.14%
3.31%
6.69%
89.77%
Married, no gauna
Separated/divorced
Widowed
Never married
Married
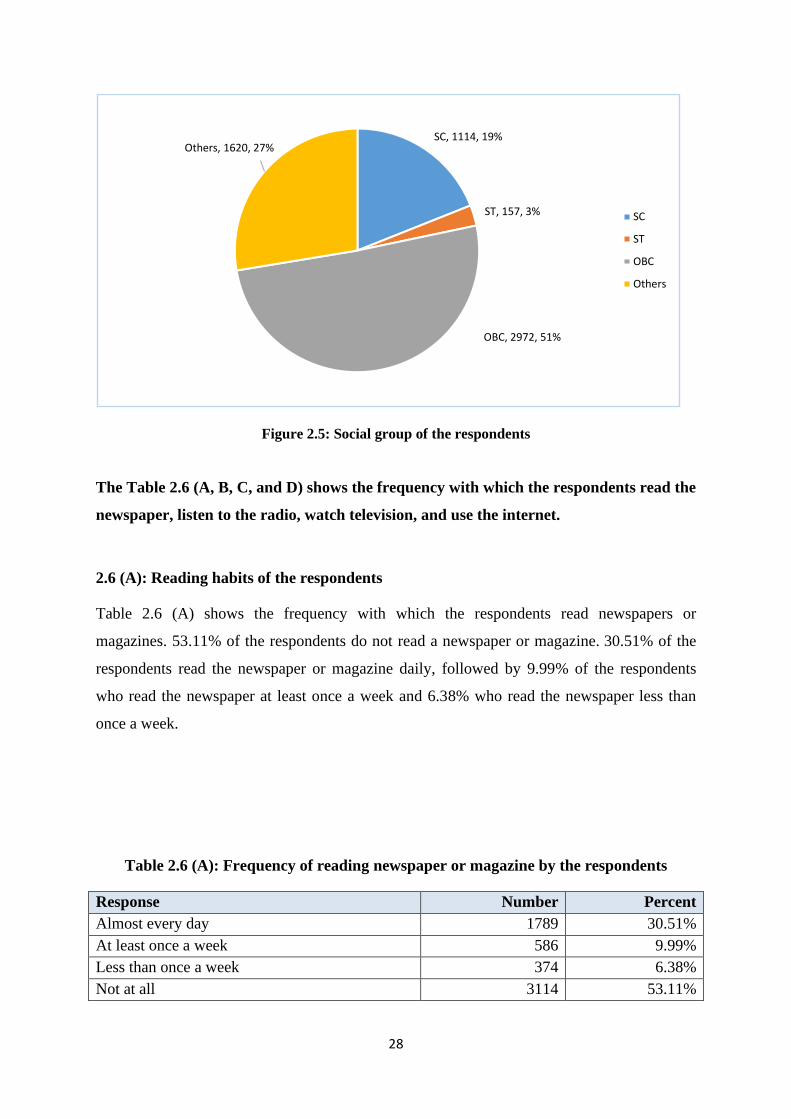
28
Figure 2.5: Social group of the respondents
The Table 2.6 (A, B, C, and D) shows the frequency with which the respondents read the
newspaper, listen to the radio, watch television, and use the internet.
2.6 (A): Reading habits of the respondents
Table 2.6 (A) shows the frequency with which the respondents read newspapers or
magazines. 53.11% of the respondents do not read a newspaper or magazine. 30.51% of the
respondents read the newspaper or magazine daily, followed by 9.99% of the respondents
who read the newspaper at least once a week and 6.38% who read the newspaper less than
once a week.
Table 2.6 (A): Frequency of reading newspaper or magazine by the respondents
Response Number Percent
Almost every day 1789 30.51%
At least once a week 586 9.99%
Less than once a week 374 6.38%
Not at all 3114 53.11%
SC, 1114, 19%
ST, 157, 3%
OBC, 2972, 51%
Others, 1620, 27%
SC
ST
OBC
Others

29
Grand Total 5863 100.00%
Figure 2.6 (A): Frequency of reading newspaper or magazine by the respondents
2.6 (B): Listening habits of the respondents
Table 2.6 (B) shows the frequency with which the respondents listen to Radio. 86.25% of the
respondents do not listen to Radio. 6.16% of the respondents listen to the Radio less than
once a week, followed by 4.16% of the respondents who listen to Radio at least once a week.
Only 3.43% of the respondents listen to Radio almost every day.
Table 2.6 (B): Frequency of listening Radio by the respondents
Response Number Percent
Almost every day 201 3.43%
At least once a week 244 4.16%
Less than once a week 361 6.16%
Not at all 5057 86.25%
Grand Total 5863 100.00%
6.38%
9.99%
30.51%
53.11%
Less than once a week
At least once a week
Almost every day
Not at all

30
Figure 2.6 (B): Frequency of listening Radio by the respondents
2.6 (C): Watching habits of the respondents
Table 2.6 (C) shows the frequency with which the respondents watch Television. 67.68% of
the respondents watch Television almost every day. 4.55% of the respondents watch
Television at least once a week, followed by 2.49% of the respondents who watch the
Television less than once a week. 25.28% of the respondents do not watch Television at all.
Table 2.6 (C): Frequency of watching Television by the respondents
Response Number Percent
Almost every day 3968 67.68%
At least once a week 267 4.55%
Less than once a week 146 2.49%
Not at all 1482 25.28%
Grand Total 5863 100.00%
3.43%
4.16%
6.16%
86.25%
Almost every day
At least once a week
Less than once a week
Not at all

31
Figure 2.6 (C): Frequency of watching Television by the respondents
2.6 (D): Use of Internet by the respondents
Table 2.6 (D) shows the frequency of the respondents who use the internet (Facebook,
WhatsApp, etc.). The results reveal that the use of the internet has penetrated to the remotest
part of the State. 42.71% of the respondents use the internet almost every day. 4.04% of the
respondents use the internet at least once a week, followed by 3.39% who use the internet less
than once a week. 49.86% of the respondents do not use the internet.
The results show that the use of radio has reduced tremendously, and the use of the internet is
increasing.
Table 2.6 (D): Frequency of using Internet (Facebook, WhatsApp, etc.) by the
respondents
Response Number Percent
Almost every day 2504 42.71%
At least once a week 237 4.04%
Less than once a week 199 3.39%
Not at all 2923 49.86%
Grand Total 5863 100.00%
2.49%
4.55%
25.28%
67.68%
Less than once a week
At least once a week
Not at all
Almost every day

32
Figure 2.6 (D): Frequency of using Internet (Facebook, WhatsApp, etc.) by the respondents
2.7: Sources used by the respondents to get information about elections and politics
Table 2.7 shows information about the sources used by the respondents to get information
about elections and politics. Results show that 37.98% of the respondents get information
about election and politics from their family members, relatives, and friends. 31.18% of the
respondents rely on Television, 23.95% of the respondents read newspapers and magazines
while 0.19% listen to Radio to get information about the elections. The use of mobile phones
and the internet was found to be 2.51% and 0.39% respectively.
We found that the information about elections is also received from ward member, BLO,
announcement using loudspeakers, workers of the political parties, society, etc.
Table 2.7:Sources used by respondents to get news on elections and politics
Response Number Percent
Newspaper/Magazine 1404 23.95%
Television 1828 31.18%
Radio 11 0.19%
Internet 23 0.39%
Mobile Phone 147 2.51%
Family/relatives/friends 2227 37.98%
Others* 5 0.07%
No Response 218 3.72%
Grand Total 5863 100.00%
3.39%
4.04%
42.71%
49.86%
Less than once a week
At least once a week
Almost every day
Not at all
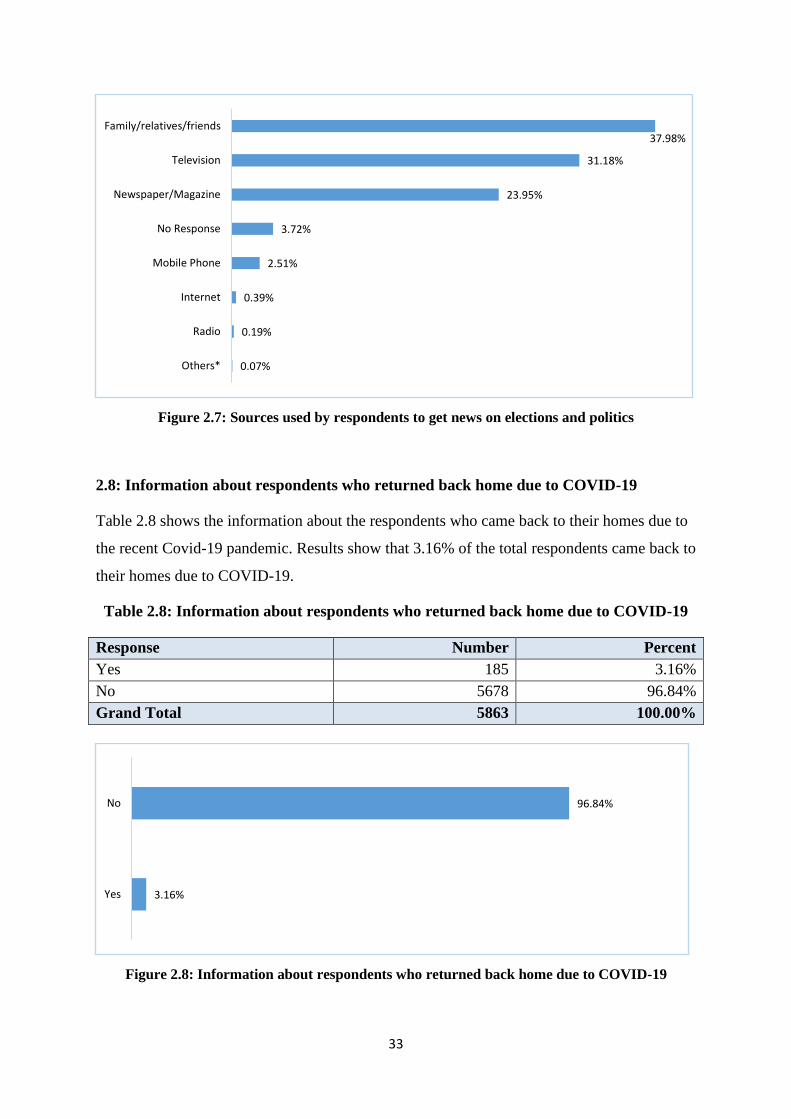
33
Figure 2.7: Sources used by respondents to get news on elections and politics
2.8: Information about respondents who returned back home due to COVID-19
Table 2.8 shows the information about the respondents who came back to their homes due to
the recent Covid-19 pandemic. Results show that 3.16% of the total respondents came back to
their homes due to COVID-19.
Table 2.8: Information about respondents who returned back home due to COVID-19
Response Number Percent
Yes 185 3.16%
No 5678 96.84%
Grand Total 5863 100.00%
Figure 2.8: Information about respondents who returned back home due to COVID-19
0.07%
0.19%
0.39%
2.51%
3.72%
23.95%
31.18%
37.98%
Others*
Radio
Internet
Mobile Phone
No Response
Newspaper/Magazine
Television
Family/relatives/friends
3.16%
96.84%
Yes
No
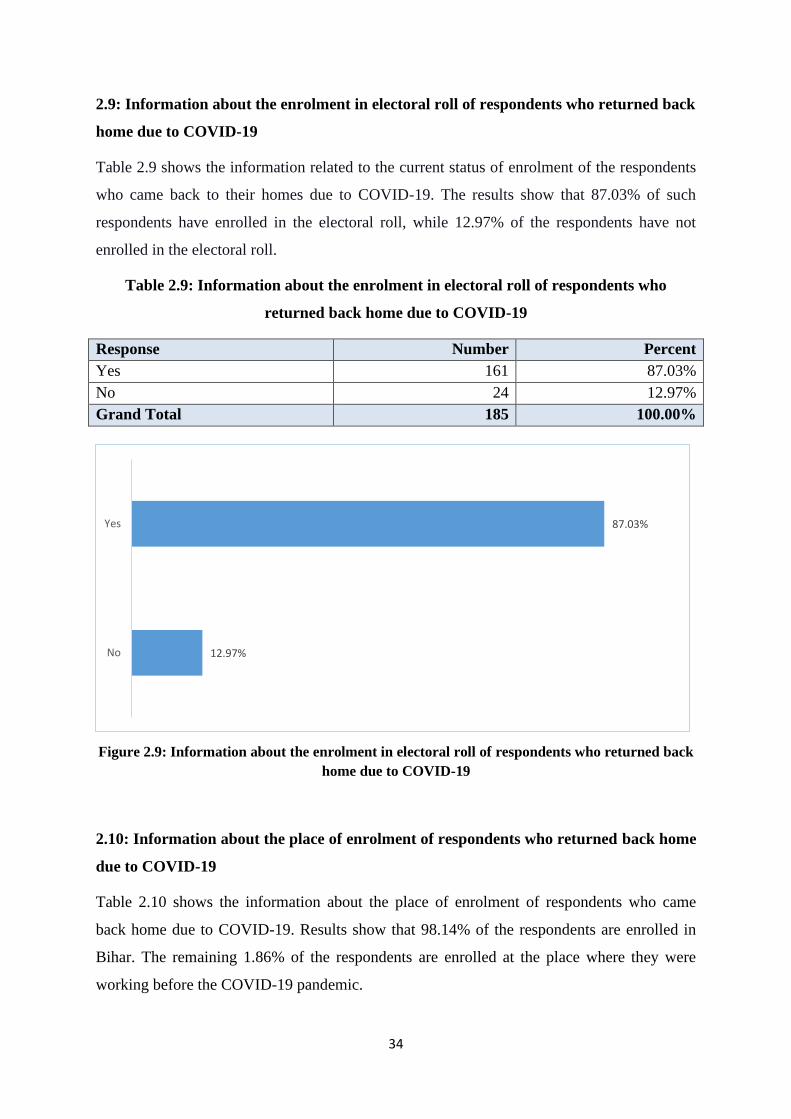
34
2.9: Information about the enrolment in electoral roll of respondents who returned back
home due to COVID-19
Table 2.9 shows the information related to the current status of enrolment of the respondents
who came back to their homes due to COVID-19. The results show that 87.03% of such
respondents have enrolled in the electoral roll, while 12.97% of the respondents have not
enrolled in the electoral roll.
Table 2.9: Information about the enrolment in electoral roll of respondents who
returned back home due to COVID-19
Response Number Percent
Yes 161 87.03%
No 24 12.97%
Grand Total 185 100.00%
Figure 2.9: Information about the enrolment in electoral roll of respondents who returned back
home due to COVID-19
2.10: Information about the place of enrolment of respondents who returned back home
due to COVID-19
Table 2.10 shows the information about the place of enrolment of respondents who came
back home due to COVID-19. Results show that 98.14% of the respondents are enrolled in
Bihar. The remaining 1.86% of the respondents are enrolled at the place where they were
working before the COVID-19 pandemic.
12.97%
87.03%
No
Yes
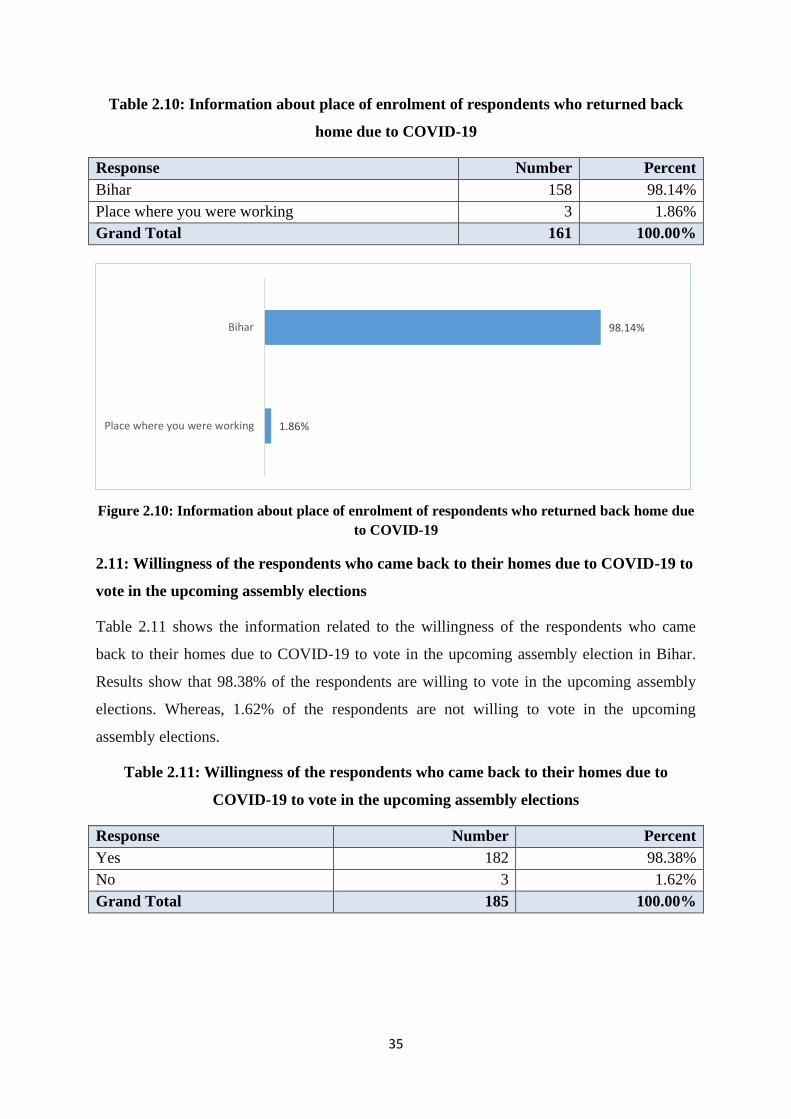
35
Table 2.10: Information about place of enrolment of respondents who returned back
home due to COVID-19
Response Number Percent
Bihar 158 98.14%
Place where you were working 3 1.86%
Grand Total 161 100.00%
Figure 2.10: Information about place of enrolment of respondents who returned back home due
to COVID-19
2.11: Willingness of the respondents who came back to their homes due to COVID-19 to
vote in the upcoming assembly elections
Table 2.11 shows the information related to the willingness of the respondents who came
back to their homes due to COVID-19 to vote in the upcoming assembly election in Bihar.
Results show that 98.38% of the respondents are willing to vote in the upcoming assembly
elections. Whereas, 1.62% of the respondents are not willing to vote in the upcoming
assembly elections.
Table 2.11: Willingness of the respondents who came back to their homes due to
COVID-19 to vote in the upcoming assembly elections
Response Number Percent
Yes 182 98.38%
No 3 1.62%
Grand Total 185 100.00%
1.86%
98.14%
Place where you were working
Bihar
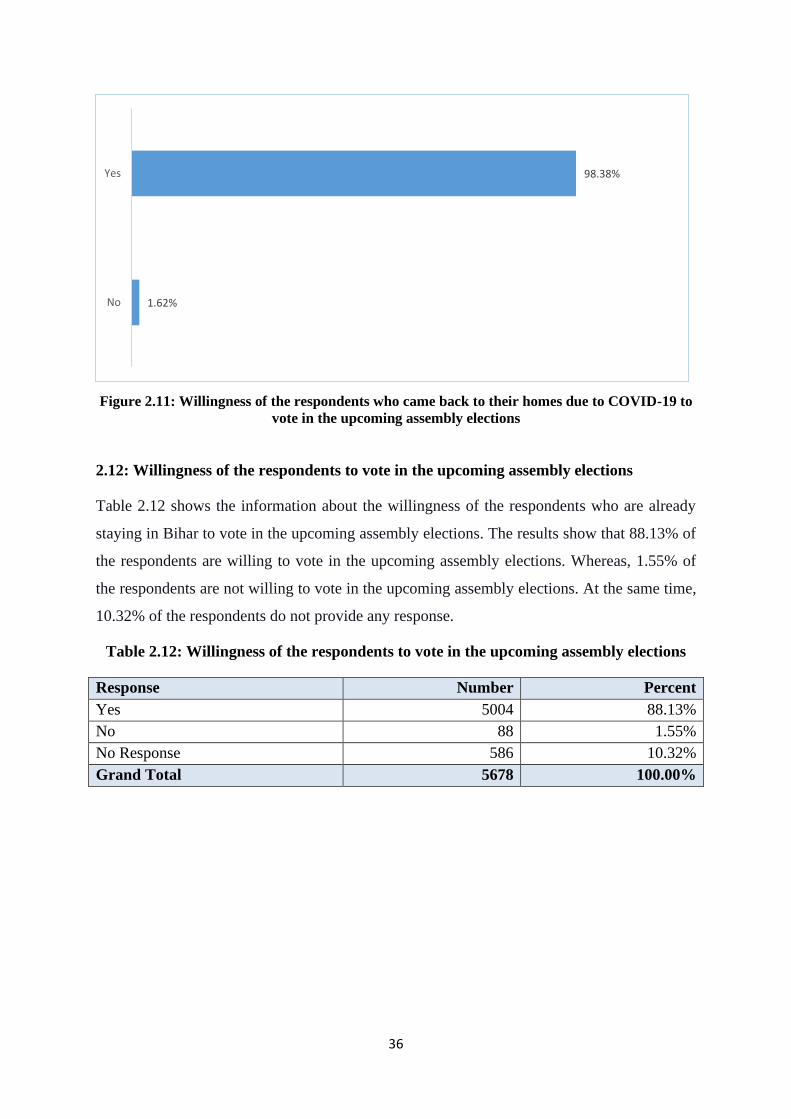
36
Figure 2.11: Willingness of the respondents who came back to their homes due to COVID-19 to
vote in the upcoming assembly elections
2.12: Willingness of the respondents to vote in the upcoming assembly elections
Table 2.12 shows the information about the willingness of the respondents who are already
staying in Bihar to vote in the upcoming assembly elections. The results show that 88.13% of
the respondents are willing to vote in the upcoming assembly elections. Whereas, 1.55% of
the respondents are not willing to vote in the upcoming assembly elections. At the same time,
10.32% of the respondents do not provide any response.
Table 2.12: Willingness of the respondents to vote in the upcoming assembly elections
Response Number Percent
Yes 5004 88.13%
No 88 1.55%
No Response 586 10.32%
Grand Total 5678 100.00%
1.62%
98.38%
No
Yes

37
Figure 2.12: Willingness of the respondents to vote in the upcoming assembly elections
2.13: Facilities expected on polling booth as precautionary measures associated with
COVID-19
Table 2.13 shows the facilities that the respondents expect on the polling booth on the day of
voting as precautionary measures associated with COVID-19. A maximum number of
respondents expect the availability of sanitizers, followed by availability of masks, markings
on the ground to maintain social distancing, availability of soap and water, and thermal
screening facility at the polling station. Other suggestions include the availability of sanitizer
machine, gloves, sanitizer tunnel, a mechanism to vote without pressing a button on EVM,
and sanitize hands before and after pressing the EVM button.
Table 2.13: Facilities expected on polling booth as precautionary measures associated
with COVID-19
Response Number Percent
Markings on ground to know where to stand in the queue; 4565 77.86%
Availability of soap and water 3815 65.07%
Availability of sanitizers 5369 91.57%
Availability of masks 5008 85.42%
Thermal screening at the polling station 2633 44.91%
Any suggestion 108 1.84%
1.55%
10.32%
88.13%
No
No Response
Yes

38
Figure 2.13: Facilities expected on polling booth as precautionary measures associated with
COVID-19
Conclusion
Approximately half of the respondents are either illiterate or have passed the primary school.
It means that half of the respondents might be having difficulty in reading and writing. Nearly
one-third of the respondents are labourer or actively engaged in agricultural and allied
activities. The majority of the respondents watch Television and do not prefer to listen to the
Radio. A small percentage of respondents returned home due to the pandemic and are willing
to vote in the upcoming elections.
1.84%
44.91%
65.07%
77.86%
85.42%
91.57%
Any suggestion
Thermal screening at the polling station
Availability of soap and water
Markings on ground to know where to stand in thequeue;
Availability of masks
Availability of sanitizers

39
CHAPTER- 3
VOTER REGISTRATION
Introduction
Voting or election is like a festival of democracy. It not only enables us to choose our
representative who will rule us for five years but also make us realize the importance of
citizenship. Voter registration (or enrollment) is the requirement that a person otherwise
eligible to vote register (or enroll) on an electoral roll before they will be entitled or permitted
to vote. Registered persons may need to re-register or update their registration if they change
residence or other relevant information. The Election Commission of India revises the voter's
list from time to time. An additional summary revision is conducted every year. Apart from
this, citizens can request their inclusion in the voter's list by applying through Form 6. If the
application is valid, the applicant's name will get included in the list. Election Commission of
India also offers online voter registration for Indian citizens who have attained the age of 18
on the qualifying date (1st of January of the year of revision of electoral roll). This study
assessed the critical steps and method for registering online which includes-
• General Voters that need to fill Form 6,which is also for 'first-time voters' and 'voters
who have shifted to another constituency.'
• NRI Voters who need to fill form 6A.
• Form 7 for Deletion or Objection in electoral roll fill.
• Form 8 for any change in (Name, Photo, Age, EPIC Number, Address, Date of birth,
Age, Name of relative, Type of relation, Gender).
• Form 8A in case of shifting from one place of residence to another area of residence
within the same constituency.
• Finally, assessment of voters who need to fill Form 6 if they are shifting from one
constituency to another.
It is expected that every person who is eligible to vote must be registered, and their name
must appear on the voting list. If the person has changed the location, then his/her name must

40
be removed from the previous list and added to the current voter's list. Requirements for
registering to vote and enroll as a Voter are given below:
• Being an Indian citizen.
• Have attained the age of 18 years on the qualifying date, i.e., 1st of January of the
year of revision of electoral roll.
• Being an ordinarily resident of the part/polling area of the constituency where the
candidate wants to be enrolled.
• Should not be disqualified to be enrolled as an elector.
This Chapter focuses on the registration process, which plays a vital role in conducting the
elections.
3.1: Availability of a voter ID card/EPIC
The Table and Figure given below show that out of the 5863 respondents in this study who
were registered in the voter list, 98.46 percent possess their voter ID card while 1.54 percent
of respondents do not have their voter ID card.
Table 3.1: Availability of a voter ID card/EPIC
Response Number Percent
Yes 5773 98.46%
No 90 1.54%
Grand Total 5863 100.00%
Figure 3.1: Availability of a voter ID card/EPIC
Yes98.46%
No1.54%

41
3.2: Assessment of reasons behind not having a Voter ID card
The Table given below displays that approximately 19% of respondents who don't have voter
cards are not aware of the process of getting this card. About the same number of respondents
have specified that they have lost their Voter ID cards.
Table 3.2: Assessment of reasons behind not having a Voter ID card
Response Number Percent
Not aware about how to get this card 17 18.89%
Lost -by self 17 18.89%
Lost -by the department 1 1.11%
Could not get time to get photographed 5 5.56%
Did not get information when it was being made 33 36.67%
Lack of time 4 4.44%
Cumbersome procedure 7 7.78%
Not Interested in getting the same 6 6.67%
Grand Total 90 100.00%
Figure 3.2: Assessment of reasons behind not having a Voter ID card
3.3: Assessment of awareness about the 'Voter's List'
The voter list (officially known as the electoral roll) is a compiled comprehensive list, which
includes the names and other details of voters. The Election Commission of India maintains a
constituency-wise voter list wherein all individuals who are eligible to vote are listed. The
voter list also includes relevant information used to identify voters and assign them to a
1.11%
4.44%
5.56%
6.67%
7.78%
18.89%
18.89%
36.67%
Lost -by the department
Lack of time
Could not get time to get photographed
Not Interested in getting the same
Cumbersome procedure
Not aware about how to get this card
Lost -by self
Did not get information when it was being made

42
specific electoral district and polling station. A master voter list is divided into sub-lists for
use at each polling station. Polling station voter lists typically only have the names of people
designated to vote at that specific polling station. This makes it quicker and easier for election
officials to determine who has the right to vote. The following Table and figure assess and
show the awareness of respondents about the voter's list.
Table 3.3: Assessment of awareness about the 'Voter's List'
Response Number Percent
Yes 5497 93.76%
No 266 4.54%
Can't say 100 1.71%
Grand Total 5863 100.00%
Figure: 3.3: Assessment of awareness about the 'Voter's List'
3.4: Assessment of the enrollment status of the respondents
In order to make sure that eligible voters can vote and ineligible people are not, voter lists
must be:
• Complete: eligible people and their relevant details are on the list, while ineligible
people are not on the list.
• Accurate: the information included in the list is correct. Polling station lists can also
be inaccurate if they are incorrectly drawn from the master voter list.
Aware
93.76%
Unaware
4.54%Can’t say
1.71%

43
• Current: updated to acknowledge recent deaths, recognize newly eligible voters and
reflect changes in residency, personal identification or other voter details.
The following Table and Figure highlightthe enrollment status of the respondents in the
voter's list.
Table 3.4:Assessment of the enrollment status of the respondents
Response Number Percent
Yes 5427 98.73%
No 52 0.95%
Can’t say 18 0.33%
Grand Total 5497 100.00%
Figure 3.4:Assessment of the enrollment status of the respondents
3.5: Assessment of reasons behind non-enrollment
The voter enrollment process has three goals:
• Voter enrollment makes sure eligible citizens have a real opportunity to vote;
• Voter enrollment prevents ineligible people from voting; and
• Voter enrollment should prevent multiple voting.
Fair and transparent voter registration and enrollment process fosters political equality and
actively encourages the inclusion of eligible voters. Voter registration is integral to the
Enrolled
98.73%
Not enrolled
0.95%
Can’t say
0.33%

44
administration of elections. When the voter registration process is high quality, it can increase
the legitimacy of the entire process. The following Table assessesthe reasons behind not
enrolling in the voter's list specified by the respondents.
Table 3.5: Assessment of reasons behind non-enrollment
Response Number Percent
Did not know about it 83 31.20%
Was not told 18 6.77%
Can't say/don't know 163 61.28%
Was not interested 2 0.75%
Grand Total 266 100.00%
Figure 3.5: Assessment of reasons behind non-enrollment
3.6: Assessment of awareness of enrollment requirement
The ability to view and correct the entire list can boost public confidence in the voter
registration process, electoral authorities, and election process more broadly. Access to the
voter list allows political parties to make sure that their interests are respected -- for instance,
allowing them to check voter registration rates in their geographic bases of support. Civic
organizations can check the quality of the voter's list through an independent audit or other
impartial review procedure. Such an assessment may highlight positive aspects of the voter
list as well as any issues that need to be addressed, such as cases of individuals who are
registered multiple times. Access to population information, like census data, allows for
better assessment of voter lists.
0.75%
6.77%
31.20%
61.28%
Was not interested
Was not told
Did not know about it
Can’t say/don’t know

45
The following Table and related Figure assess the awareness of enrollment requirement of the
voters in the voter's list as specified by the respondents. A research question was
administered by asking each eligible respondent about how he/she came to know that his /her
name has to be enrolled.
Table 3.6: Assessment of awareness of enrollment requirement
Response Number Percent
Friends/Relatives 632 11.65%
Newspapers 78 1.44%
Local Community leaders 718 13.23%
BLO 3448 63.53%
TV 7 0.13%
Radio 1 0.02%
Poster/Hoarding etc. 4 0.07%
Can't say 539 9.93%
Grand Total 5427 100.00%
Figure 3.6: Assessment of awareness of enrollment requirement
0.00% 20.00% 40.00% 60.00% 80.00%
Can’t say
Poster/Hoarding etc
Radio
TV
BLO
Local Community leaders
Newspapers
Friends/Relatives
9.93%
0.07%
0.02%
0.13%
63.53%
13.23%
1.44%
11.65%

46
3.7: Assessment of perceived correctness of enrollment
Public access to voter lists can increase the accuracy and completeness of the voter list if
individuals have sufficient opportunity to correct any errors or update their information. The
following Table and Graph assess perceived correctness of the enrollment processby the
voters in the voter's list as specified by the respondents. A research question was
administered in the survey asking each eligible respondent about if their name and other
details have been correctly enrolled or not. About 97.1% of respondents have confirmed that
their names and other details have been successfully registered.
Table: 3.7: Assessment of perceived correctness of enrollment
Response Number Percent
Yes 5270 97.11%
No 54 1.00%
Can't say/do not know 103 1.90%
Grand Total 5427 100.00%
Figure 3.7:Assessment of perceived correctness of enrollment
3.8: Assessment of non-enrolled family member(s) in the respondent's household
The registration of the voting-eligible population should be regarded as the result of ongoing
efforts to regularly collect and update personal data on the population for election use. The
following Table and related Graph assess and highlight the possibility of a non-enrolled
Yes
97.11%
No
1.00%
Can’t say/do not
know
1.90%

47
family member(s) in the respondent's household. A research question was administered in the
survey asking each eligible respondent about if any members in their family who are 18+
years of age and not registered. About 96% of respondents have confirmed that all eligible
members have been correctly enrolled in the voter's list.
Table: 3.8:Assessment of non-enrolled family member(s) in the respondent's household
Response Number Percent
Yes 244 4.16%
No 5619 95.84%
Grand Total 5863 100.00%
Figure 3.8: Assessment of non-enrolled family member(s) in the respondent's household
3.9: Assessment of reasons behind having a non-enrolled family member(s) in the
respondent's household
The following Table assesses the main reasons behind having a/many non-enrolled family
member(s) in the respondent's household. A research question was administered in the survey
asking each eligible respondent reasons behind having member(s) in their family who are 18+
years of age and not registered. About 36% of respondents have confirmed that the lengthy
process forbids them from being enrolled in the voter's list.
Yes
4.16%
No
95.84%
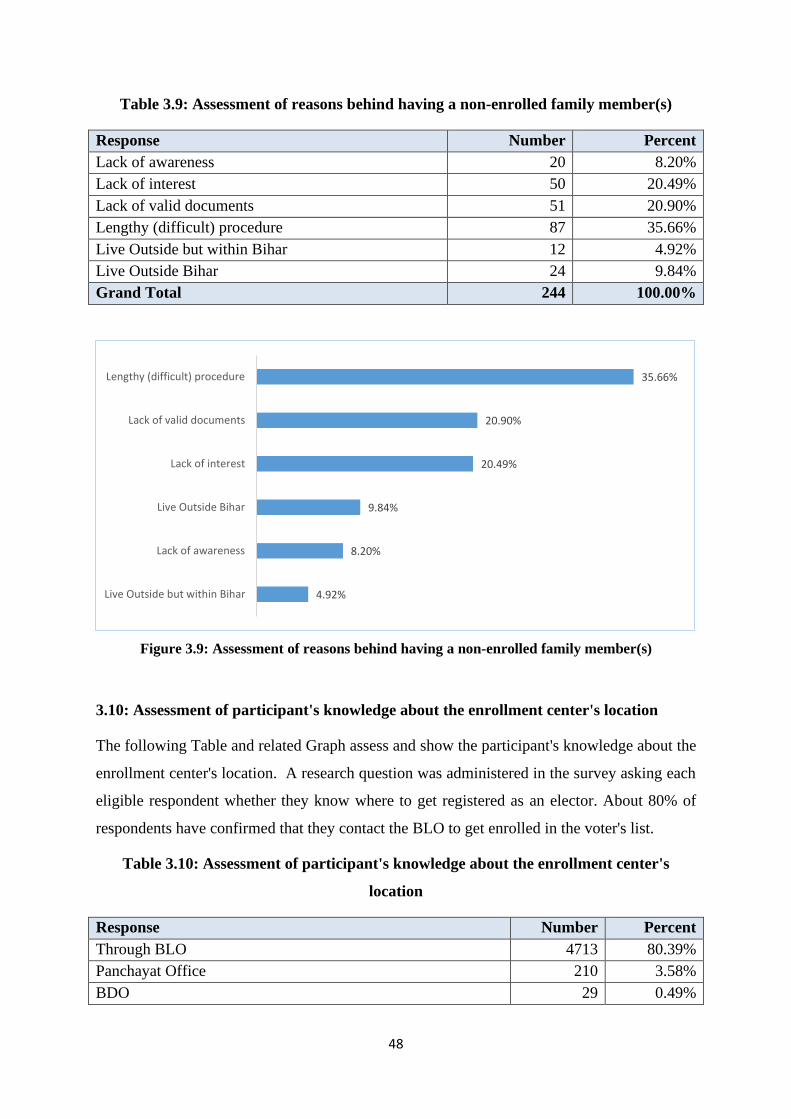
48
Table 3.9: Assessment of reasons behind having a non-enrolled family member(s)
Response Number Percent
Lack of awareness 20 8.20%
Lack of interest 50 20.49%
Lack of valid documents 51 20.90%
Lengthy (difficult) procedure 87 35.66%
Live Outside but within Bihar 12 4.92%
Live Outside Bihar 24 9.84%
Grand Total 244 100.00%
Figure 3.9: Assessment of reasons behind having a non-enrolled family member(s)
3.10: Assessment of participant's knowledge about the enrollment center's location
The following Table and related Graph assess and show the participant's knowledge about the
enrollment center's location. A research question was administered in the survey asking each
eligible respondent whether they know where to get registered as an elector. About 80% of
respondents have confirmed that they contact the BLO to get enrolled in the voter's list.
Table 3.10: Assessment of participant's knowledge about the enrollment center's
location
Response Number Percent
Through BLO 4713 80.39%
Panchayat Office 210 3.58%
BDO 29 0.49%
4.92%
8.20%
9.84%
20.49%
20.90%
35.66%
Live Outside but within Bihar
Lack of awareness
Live Outside Bihar
Lack of interest
Lack of valid documents
Lengthy (difficult) procedure

49
Response Number Percent
Block Office 562 9.59%
Collector’s Office 30 0.51%
Matdata Sahayata Kendra / Voter Centre/CSC 319 5.44%
Grand Total 5863 100.00%
Figure: 3.10: Assessment of participant's knowledge about the enrollment center's location
3.11: Assessment of participant's knowledge about the EPIC (Election Card)
A Voter ID Card, also known as the Elector's Photo Identity Card (EPIC) is a photo identity
card that is issued by the Election Commission of India to all individuals who are eligible to
vote. The primary purpose of this card is to improve the accuracy of the electoral roll and to
help prevent cases of electoral fraud. Additionally, it also serves as an identification proof
when individuals cast their vote. This card is commonly known by other names such as an
election card, voter's card, Voter ID, etc. As shown in the Table and Graph given below,
more than 98% of respondents of this study are aware of the EPIC/Election card.
Table 3.11: Assessment of participant's knowledge about the EPIC (Election Card)
Response Number Percent
Yes 5784 98.65%
No 75 1.28%
Can’t say 4 0.07%
Grand Total 5863 100.00%
Through
BLO
Panchayat
Office
BDO Block
OfficeCollector’s
Office
Matdata
Sahayata
Kendra /
Voter
Centre/CSC
80.39%
3.58% 0.49% 9.59% 0.51% 5.44%
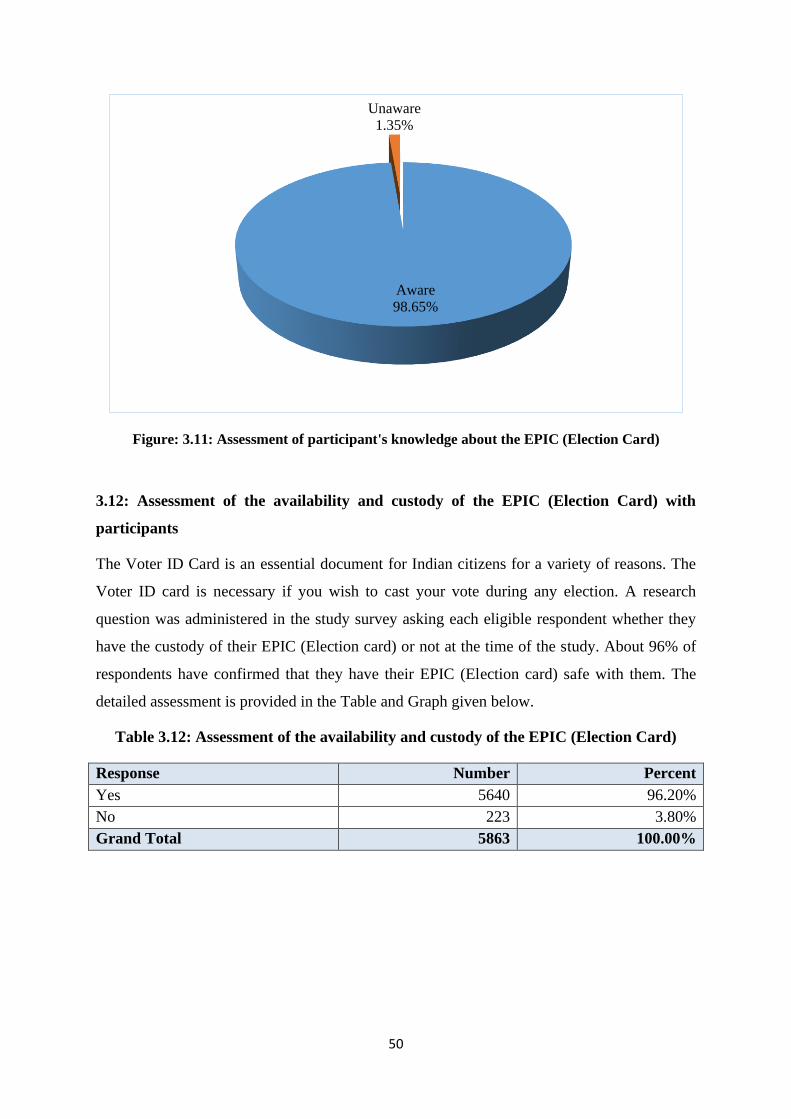
50
Figure: 3.11: Assessment of participant's knowledge about the EPIC (Election Card)
3.12: Assessment of the availability and custody of the EPIC (Election Card) with
participants
The Voter ID Card is an essential document for Indian citizens for a variety of reasons. The
Voter ID card is necessary if you wish to cast your vote during any election. A research
question was administered in the study survey asking each eligible respondent whether they
have the custody of their EPIC (Election card) or not at the time of the study. About 96% of
respondents have confirmed that they have their EPIC (Election card) safe with them. The
detailed assessment is provided in the Table and Graph given below.
Table 3.12: Assessment of the availability and custody of the EPIC (Election Card)
Response Number Percent
Yes 5640 96.20%
No 223 3.80%
Grand Total 5863 100.00%
Aware
98.65%
Unaware
1.35%
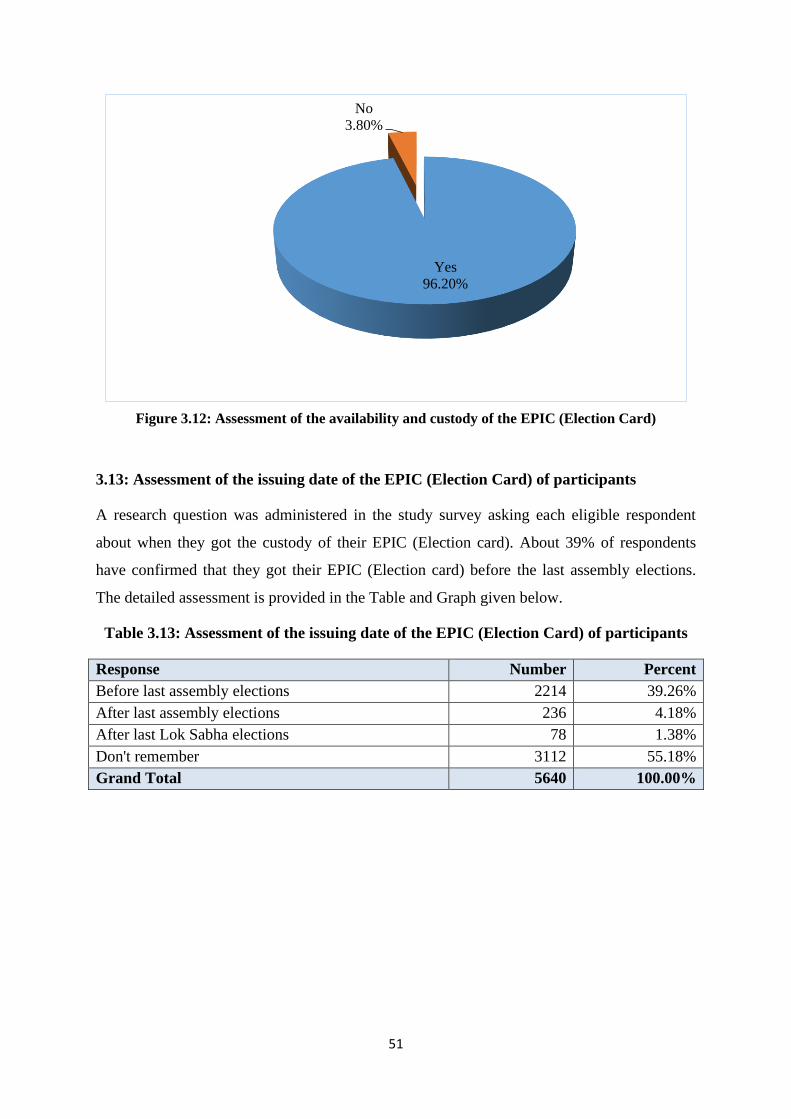
51
Figure 3.12: Assessment of the availability and custody of the EPIC (Election Card)
3.13: Assessment of the issuing date of the EPIC (Election Card) of participants
A research question was administered in the study survey asking each eligible respondent
about when they got the custody of their EPIC (Election card). About 39% of respondents
have confirmed that they got their EPIC (Election card) before the last assembly elections.
The detailed assessment is provided in the Table and Graph given below.
Table 3.13: Assessment of the issuing date of the EPIC (Election Card) of participants
Response Number Percent
Before last assembly elections 2214 39.26%
After last assembly elections 236 4.18%
After last Lok Sabha elections 78 1.38%
Don't remember 3112 55.18%
Grand Total 5640 100.00%
Yes
96.20%
No
3.80%

52
Figure 3.13: Assessment of the issuing date of the EPIC (Election Card) of participants
3.14: Assessment of the total duration in getting the EPIC (Election Card)
Applying for a Voter ID usually entails a long and tedious process. But the Government of
India has simplified this process by digitizing it and making it available online. Online
applications are faster and more convenient and are delivered within a month. A research
question was administered in the study survey asking each eligible respondent about in how
many days they got the custody of their EPIC (Election card). About 21% of respondents
have confirmed that they got their EPIC (Election card) within six months. The detailed
assessment is provided in the Table and Graph given below.
Table 3.14: Assessment of the total duration in getting the EPIC (Election Card)
Response Number Percent
Within 15 days 601 10.66%
Within 1 month 1221 21.65%
Within six months 1199 21.26%
Don't know 2619 46.44%
Grand Total 5640 100.00%
Before last
assembly
elections
After last
assembly
elections
After last
LokSabha
elections
Don’t remember
39.26%
4.18% 1.38%
55.18%
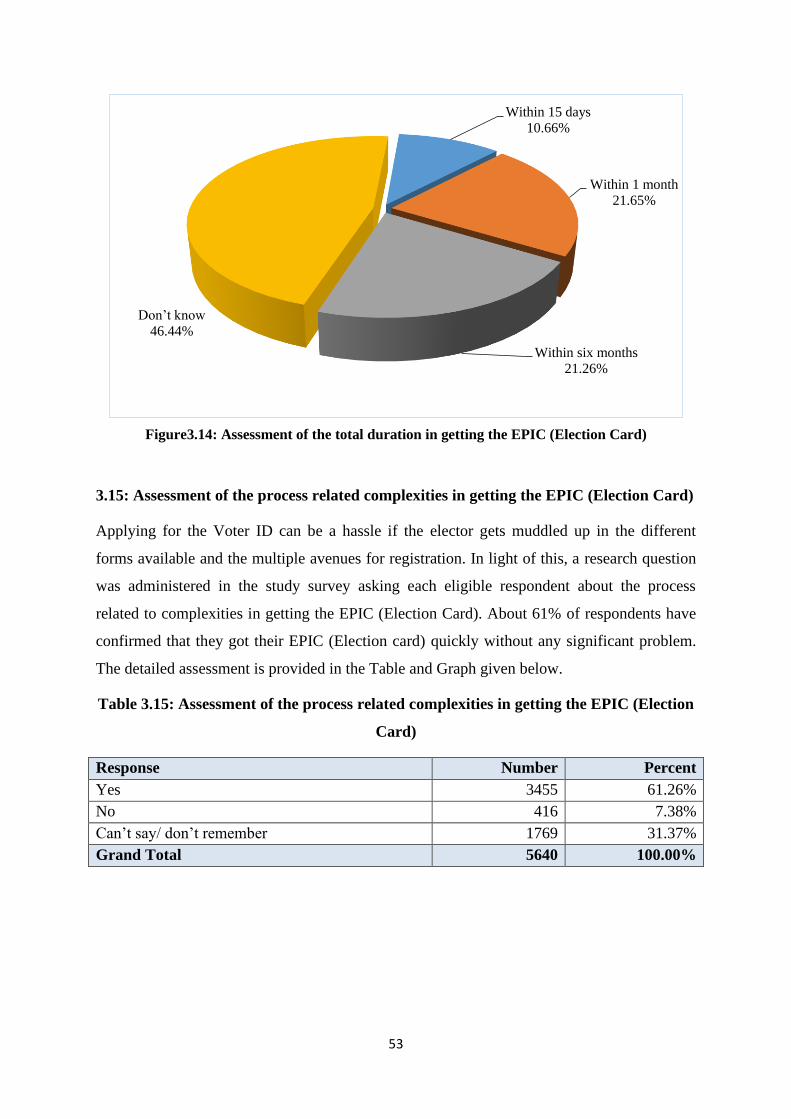
53
Figure3.14: Assessment of the total duration in getting the EPIC (Election Card)
3.15: Assessment of the process related complexities in getting the EPIC (Election Card)
Applying for the Voter ID can be a hassle if the elector gets muddled up in the different
forms available and the multiple avenues for registration. In light of this, a research question
was administered in the study survey asking each eligible respondent about the process
related to complexities in getting the EPIC (Election Card). About 61% of respondents have
confirmed that they got their EPIC (Election card) quickly without any significant problem.
The detailed assessment is provided in the Table and Graph given below.
Table 3.15: Assessment of the process related complexities in getting the EPIC (Election
Card)
Response Number Percent
Yes 3455 61.26%
No 416 7.38%
Can’t say/ don’t remember 1769 31.37%
Grand Total 5640 100.00%
Within 15 days
10.66%
Within 1 month
21.65%
Within six months
21.26%
Don’t know
46.44%

54
Figure3.15: Assessment of the process complexities in getting the EPIC (Election Card)
3.16: Assessment of the major issues in getting the EPIC (Election Card)
A research question was administered in the study survey asking each eligible respondent
about the significant issues in getting the EPIC (Election Card). About 53% of respondents
have confirmed that the procedure is lengthy, while 25% of respondents have specified that
the concerning officials are unfriendly. The detailed assessment is provided in the Table and
Graph given below.
Table 3.16: Assessment of the major issues in getting the EPIC (Election Card)
Response Number Percent
Long procedure 222 53.37%
Unfriendly officials 106 25.48%
Inaccessibility of the concerned office 32 7.69%
Can't say 56 13.46%
Grand Total 416 100.00%
Easy
61.26%
Not Easy
7.38%
Don’t remember
31.37%

55
Figure3.16: Assessment of the major issues in getting the EPIC (Election Card)
3.17: Assessment of substitutes of the EPIC (Election Card) - alternative IDs
The right to vote is an inalienable part of a citizen's rights in a democracy. However, it is
subject to certain conditions laid down by the State. Electoral franchise also strengthens
participatory democracy, allowing common man's concerns to be discussed, debated and
decided in the Indian legislature, and then enacted into laws. Even if anyone does not have a
voter ID card, it is imperative that he/she is registered as a voter, and his/her name appears on
the electoral rolls. If the person is already a registered voter, then he or she can vote without
the voter ID card. Various documents are accepted in case the person does not have his or her
voter ID. A research question was administered in the study survey asking each eligible
respondent about the substitutes of the EPIC (Election Card) and alternative IDs. About 44%
of respondents have given 'no response' while 27.8% have specified 'Voter's slip' as an
alternative ID. The detailed assessment is provided in the Table and Graph given below.
Table 3.17: Assessment of substitutes of the EPIC (Election Card)
Response Number Percent
Driving License 2 0.90%
Ration Card 6 2.69%
Bank Account 7 3.14%
Voter Slip 62 27.80%
Any other* 47 21.08%
No Response 99 44.39%
Grand Total 223 100.00%
*Aadhar card, Other Government Identity card, Old Voter card.
Long procedure Unfriendly
officials
Inaccessibility of
the concerned
office
Can’t say
53.37%
25.48%
7.69%13.46%
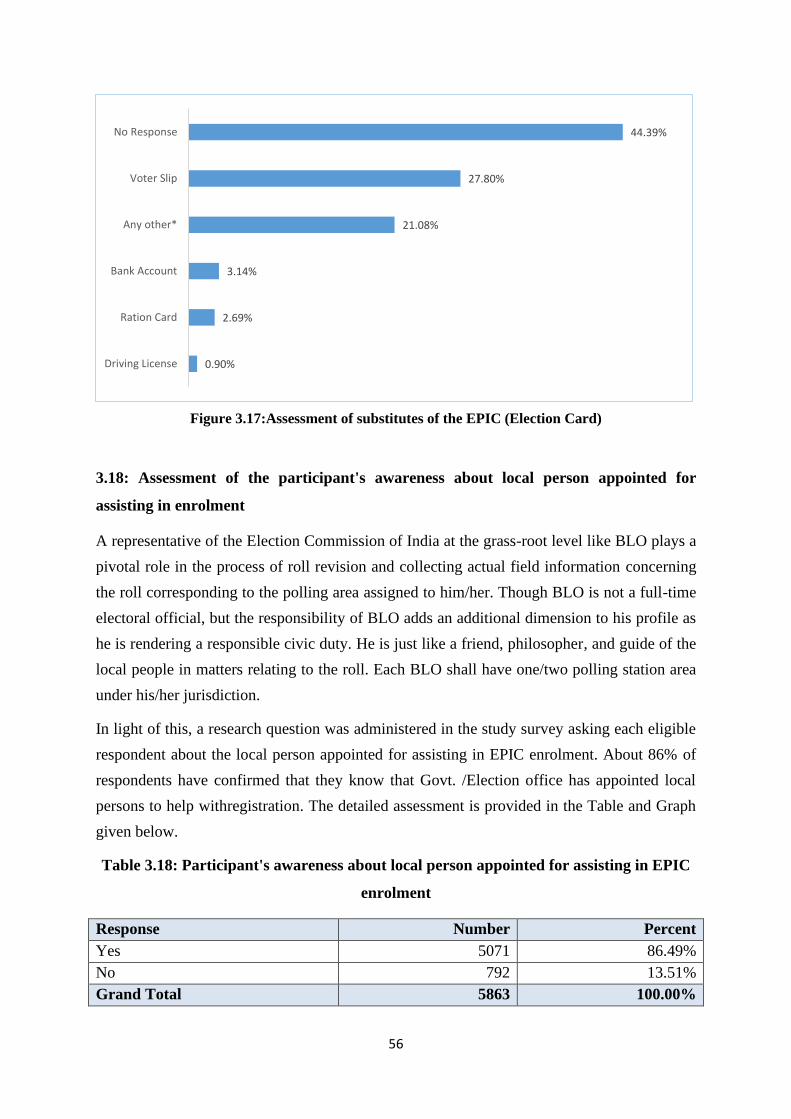
56
Figure 3.17:Assessment of substitutes of the EPIC (Election Card)
3.18: Assessment of the participant's awareness about local person appointed for
assisting in enrolment
A representative of the Election Commission of India at the grass-root level like BLO plays a
pivotal role in the process of roll revision and collecting actual field information concerning
the roll corresponding to the polling area assigned to him/her. Though BLO is not a full-time
electoral official, but the responsibility of BLO adds an additional dimension to his profile as
he is rendering a responsible civic duty. He is just like a friend, philosopher, and guide of the
local people in matters relating to the roll. Each BLO shall have one/two polling station area
under his/her jurisdiction.
In light of this, a research question was administered in the study survey asking each eligible
respondent about the local person appointed for assisting in EPIC enrolment. About 86% of
respondents have confirmed that they know that Govt. /Election office has appointed local
persons to help withregistration. The detailed assessment is provided in the Table and Graph
given below.
Table 3.18: Participant's awareness about local person appointed for assisting in EPIC
enrolment
Response Number Percent
Yes 5071 86.49%
No 792 13.51%
Grand Total 5863 100.00%
0.90%
2.69%
3.14%
21.08%
27.80%
44.39%
Driving License
Ration Card
Bank Account
Any other*
Voter Slip
No Response
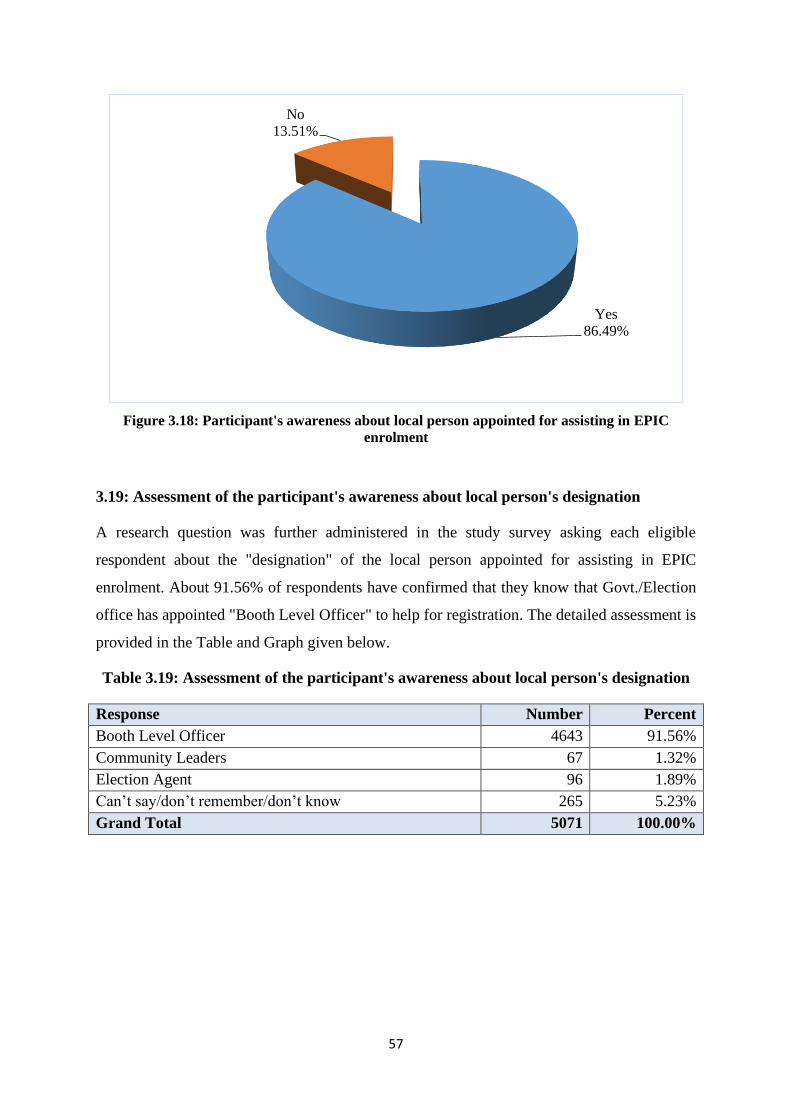
57
Figure 3.18: Participant's awareness about local person appointed for assisting in EPIC
enrolment
3.19: Assessment of the participant's awareness about local person's designation
A research question was further administered in the study survey asking each eligible
respondent about the "designation" of the local person appointed for assisting in EPIC
enrolment. About 91.56% of respondents have confirmed that they know that Govt./Election
office has appointed "Booth Level Officer" to help for registration. The detailed assessment is
provided in the Table and Graph given below.
Table 3.19: Assessment of the participant's awareness about local person's designation
Response Number Percent
Booth Level Officer 4643 91.56%
Community Leaders 67 1.32%
Election Agent 96 1.89%
Can’t say/don’t remember/don’t know 265 5.23%
Grand Total 5071 100.00%
Yes
86.49%
No
13.51%

58
Figure3.19: Assessment of the participant's awareness about the local person's designation
3.20: Assessment of the respondents' awareness about the local person's visit to the area
Under Section 13B (2) of Representation of People Act, 1950, BLOs are appointed from
amongst the officers of the Govt. /Semi Govt. /Local Bodies. Generally, one BLO is
responsible for one part of the electoral roll. The BLO will make a thorough study of the role
of the part assigned to him. He will make frequent field visits to the villages/Tolas in the said
part and interact with local people particularly village elders and grass root level elected
representatives and identify the names of the dead/shifted/duplicate voters in the roll, which
need to be removed under relevant provisions of law.
In light of this, a research question was administered in the study survey asking each eligible
respondent about the visits of the concerned BLO in their area. About 84% of respondents
have confirmed that they know that their area's BLO regularly visits their neighborhood. The
detailed assessment is provided in the Table and Graph given below.
Table 3.20: Assessment of the respondents' awareness about the local person's visit to
their area
Response Number Percent
Yes 4258 83.97%
No 510 10.06%
Can’t say/don’t remember 303 5.98%
Grand Total 5071 100.00%
Booth Level
Officer
Community
Leaders
Election Agent Don’t know
91.56%
1.32% 1.89%5.23%

59
Figure3.20: Assessment of the respondents' awareness about the local person's visit to their area
3.21: Assessment of the respondents' awareness of the Polling booth's location
ECI guidelines say no voter should be more than 2 km away from a polling station. This
means that in densely populated swathes of the country, such as Bihar, the distribution of
polling stations tends to follow a similar pattern to population density.
In light of this, a research question was administered in the study survey for assessment of the
respondents' awareness about the Polling booth's location. About 99% of respondents have
confirmed that they know their polling booth's location. The detailed assessment is provided
in the Table and Graph given below.
Table 3.21: Assessment of the respondents' awareness of the Polling booth's location
Response Number Percent
Yes 5827 99.39%
No 36 0.61%
Grand Total 5863 100.00%
Visited
83.97%
Not visited
10.06%
Don’t remember
5.98%
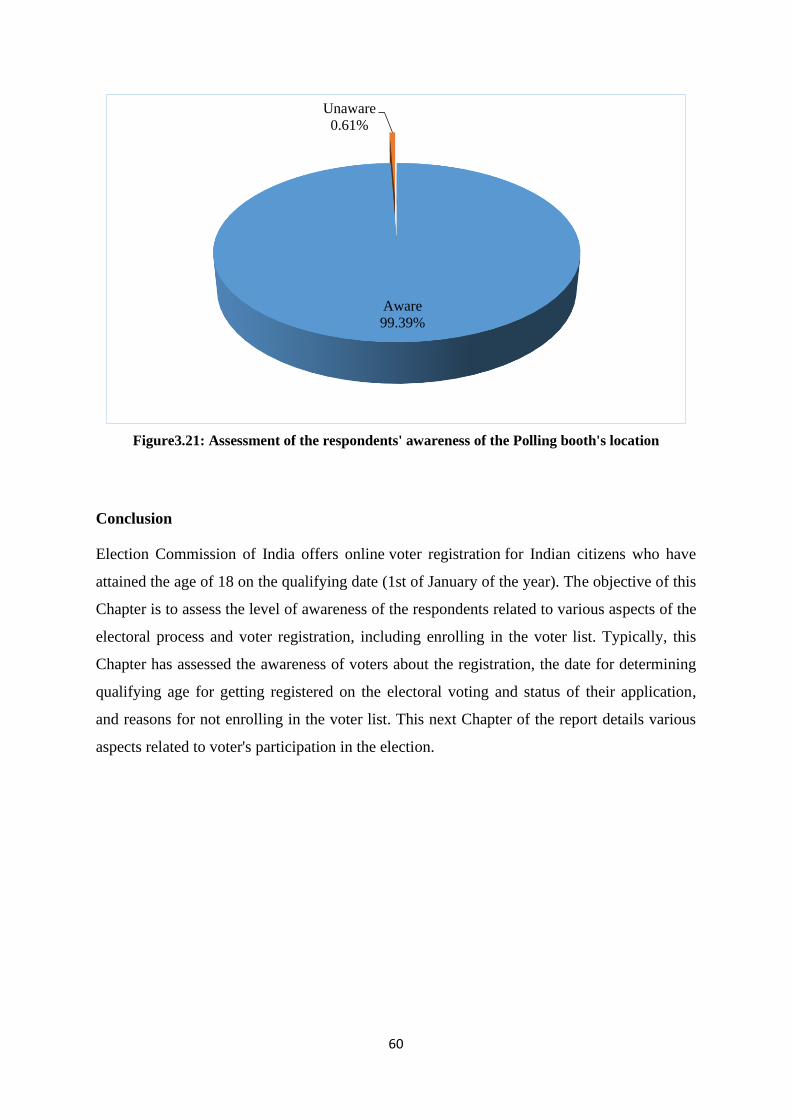
60
Figure3.21: Assessment of the respondents' awareness of the Polling booth's location
Conclusion
Election Commission of India offers online voter registration for Indian citizens who have
attained the age of 18 on the qualifying date (1st of January of the year). The objective of this
Chapter is to assess the level of awareness of the respondents related to various aspects of the
electoral process and voter registration, including enrolling in the voter list. Typically, this
Chapter has assessed the awareness of voters about the registration, the date for determining
qualifying age for getting registered on the electoral voting and status of their application,
and reasons for not enrolling in the voter list. This next Chapter of the report details various
aspects related to voter's participation in the election.
Aware
99.39%
Unaware
0.61%

61
CHAPTER- 4
KNOWLEDGE, ATTITUDE, BEHAVIOUR, BELIEFS,
AND PRACTICES (KABBP)
Introduction
The study of Knowledge, Attitude, Behaviour, Beliefs, and Practices (KABBP) of the voters
is an integral part of election management by the Election Commission in India. The main
objective of the KABBP survey is to understand the extent and level of the knowledge, belief,
perception, readiness, trends, factors, and reasons of participation or non-participation of the
registered voters in the elections and voting process.
4.1: Voting in the last Assembly Elections
Out of the 5,863 survey respondents, 91.86%reported that they had cast their votes during the
last Assembly elections. The detailed assessment is provided in the Table and Graph given
below.
Table: 4.1: Voting in the last Assembly Elections
Response Number Percent
Yes 5386 91.86%
No 477 8.14%
Grand Total 5863 100.00%
Figure 4.1: Voting in the last Assembly Elections
Yes
91.86%
No
8.14%

62
4.2: Voting in the last Parliamentary Election
A research question was administered in the study survey asking each eligible respondent
about their voting participation in the previous Parliamentary election. Out of the 5,386
survey respondents, more than 92%reported that they had cast their vote during the last
Parliamentary Elections. The detailed assessment is provided in the Table and Graph given
below.
Table 4.2: Voting in the last Parliamentary Elections
Response Number Percent
Yes 5438 92.75%
No 425 7.25%
Grand Total 5863 100.00%
Figure 4.2: Voting in the last Parliamentary Elections
4.3: Reasons for not voting during previous elections
After having recorded responses about voting in last elections, the respondents were enquired
about the reasons for not voting. Out of the total number of 699 responses of having not voted
in last General or Assembly elections in Bihar, replies were recorded for 636 cases only. In
the remaining cases, no response was reported. Answering to the question, nearly 35% of the
respondents said that they were not in their constituency on the day of voting. This result
corresponds to the high out-migration of people for seasonal employment to other regions in
Yes
92.75%
No
7.25%

63
India. 10.3% of respondents reported that they didn’t have EPIC cards and hence, didn’t
vote.Almost24% of people said that their names were not registered in the electoral roll. A
small chunk of respondents didn’t vote as they thought that nothing would change even if
they voted.
About 2.29% of respondents reported that they did not get voter slip even on the day of
polling and hence could not vote. This clearly shows the apathy by local BLOs (Booth Level
Officers). Some respondents (4.15%) also pointed out the distance of the polling booth from
their place of residence as a hurdle in going out to vote. Very few respondents cited long
queues at polling booths as a reason for not casting their votes.
Some other reasons for low voting reported during the survey were illness, being physically
handicapped, inaccessibility of the polling booth (due to a water body in the way or bad road
conditions leading to the polling booth), no good candidates in the poll fray, anger/frustration
with the previous Government, lack of development work, no direct profit from voting, etc.
Table 4.3: Reasons for not voting during the previous election
Response Number Percent
(N=699)
I did not have EPIC Card 72 10.30%
The polling station was at a distance (I had
transportation/logistic problem 29 4.15%
No faith in the political system (or electoral Democracy) 2 0.29%
Did not vote as community or religious leader said so 29 4.15%
Head of the family said not to vote 22 3.15%
Voting is not essential for the maintenance of Democracy; 1 0.14%
There was no good candidate 3 0.43%
I just did not want to vote as anything will not change 1 0.14%
I was not in my constituency 243 34.76%
I did not get voter slip even on polling day at the booth 16 2.29%
My name was not on the electoral roll 165 23.61%
Any otherresponse 53 7.58%

64
Figure4.3:Reasons for not voting during previous elections
4.4: Assessment of reasons for voting during previous elections
Elections are of utmost importance in any democratic country. As we all know, Democracy is
defined as a government of the people, for the people and by the people. In India, which is
the largest Democracy in the world in terms of vastness and population, the Election
Commission of India runs multiple campaigns to motivate voters to cast their votes.
This study has done an assessment of different reasons behind voter participation in previous
elections. After establishing a conversation channel, the field researchers of this study
assessed the main reasons for voter participation in the last elections. The respondents were
free to specify multiple reasons for their motivation behind voting. Owing to this reason, the
aggregate of responses is much higher that the number of respondents (n=5660) voting in the
previous election.As can be seen from the Table given below, the main reason was the
awareness of the voters about their voting rights (81.15% of respondents have specified this
reason). About 31% of respondents reported that they participated in the voting because the
candidate was right. Receiving the voter slip before polling day is also an essential reason as
more than 56% of voters have reported this factor behind their participation. Sympathizing
with a particular political party (11%) and enabling environment (free and fair) created by the
Election Commission of India (31%) were also significant reasons for voters’ participation in
previous elections in Bihar.
0.14%
0.14%
0.29%
0.43%
2.29%
3.15%
4.15%
4.15%
7.58%
10.30%
23.61%
34.76%
Voting is not essential for maintenance of democracy;
I just did not want to vote as nothing will change
No faith in political system (or electoral democracy)
There was no good candidate
I did not get voter slip even on polling day at the booth
Head of family said not to vote
Polling station was at distance (I had…
Did not vote as community or religious leader said so
Any Other
I did not have EPIC Card
My name was not on electoral roll
I was not in my constituency

65
Many other respondents voted because they were delighted with the development of the
village and were interested in choosing a good government for the security of the village and
society. Few respondents also reported the influence of other villagers, family members, and
friends. Few others had a notion that voting is beneficial, and after participation, they can get
some benefits from the Government schemes.
Table 4.4: Assessment of reasons for voting during previous elections
Response Number Percent
(N=5660)
I am a political party sympathizer 641 11.33%
Casted vote due to threat or coercion 1 0.02%
Head of the family said to vote 630 11.13%
Influenced by friends 168 2.97%
Wanted to defeat a particular candidate and/or a political party 407 7.19%
It was my duty/right 4593 81.15%
Because of repeated appeal and advertisement by Election
Commission 50 0.88%
Because of enabling environment (free and Fair) created by
Election Commission 1760 31.10%
I got registered in the electoral roll 1171 20.69%
I got my voter slip 3139 55.46%
Candidate was good 1753 30.97%
The candidate was of my choice and from community and
religion 140 2.47%
Candidate visited me personally 46 0.81%
Money / Liquor was offered 1 0.02%
Any other 34 0.60%

66
Figure 4.4:Assessment of reasons for voting during previous elections
4.5: Experience on the day of voting
The majority of the survey respondents (93.37%) said that their overall experience was
convenient on the day of voting. About 2.76% of people said that they had to face some
inconvenience while voting. The detailed assessment is provided in the Table and Graph
given below.
Table 4.5: Experience on the day of voting
Response Number Percent
(N=5660)
Convenient 5285 93.37%
Inconvenient 156 2.76%
Can’t remember 219 3.87%
Grand Total 5660 100.00%
0.02%
0.02%
0.60%
0.81%
0.88%
2.47%
2.97%
7.19%
11.13%
11.33%
20.69%
30.97%
31.10%
55.46%
81.15%
Casted vote due to threat or coercion
Money / Liquor was offered
Any other
Candidate visited me personally
Because of repeated appeal and advertisement by…
Candidate was of my choice and from community and…
Influenced by friends
Wanted to defeat a particular candidate and/or a…
Head of family said to vote
I am a political party sympathizer
I got registered in electoral roll
Candidate was good
Because of enabling environment (free and Fair) created…
I got my voter slip
It was my duty/right
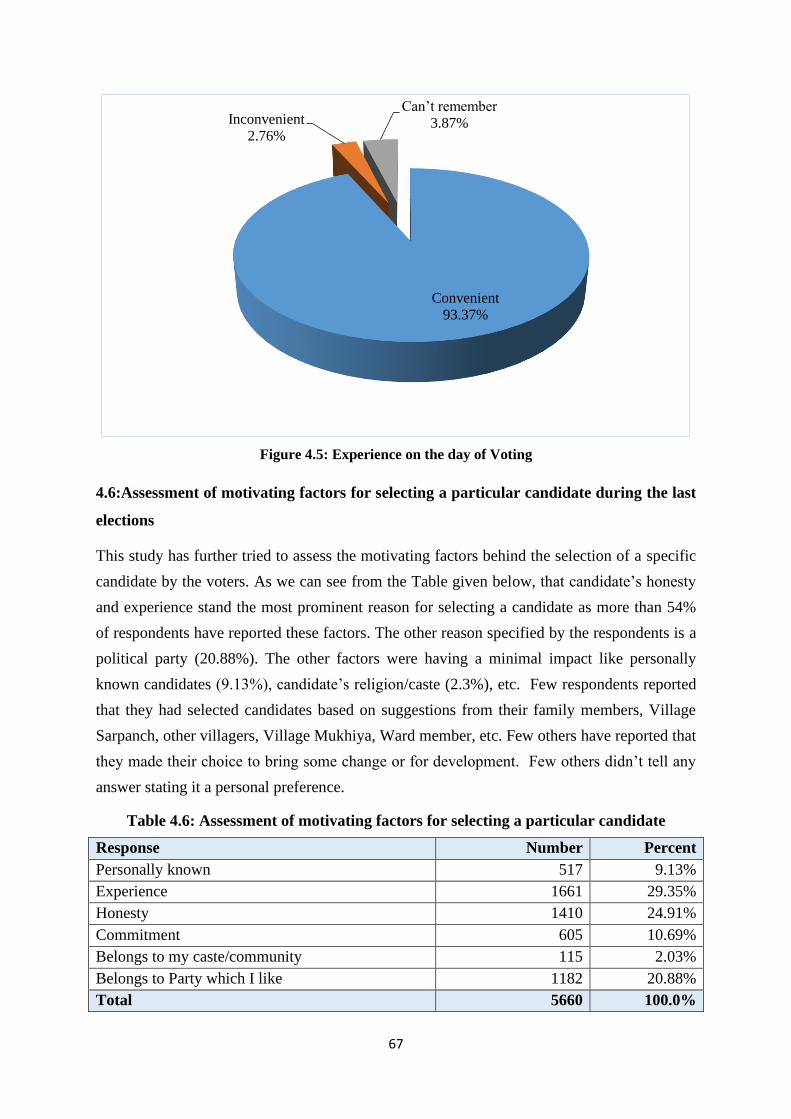
67
Figure 4.5: Experience on the day of Voting
4.6:Assessment of motivating factors for selecting a particular candidate during the last
elections
This study has further tried to assess the motivating factors behind the selection of a specific
candidate by the voters. As we can see from the Table given below, that candidate’s honesty
and experience stand the most prominent reason for selecting a candidate as more than 54%
of respondents have reported these factors. The other reason specified by the respondents is a
political party (20.88%). The other factors were having a minimal impact like personally
known candidates (9.13%), candidate’s religion/caste (2.3%), etc. Few respondents reported
that they had selected candidates based on suggestions from their family members, Village
Sarpanch, other villagers, Village Mukhiya, Ward member, etc. Few others have reported that
they made their choice to bring some change or for development. Few others didn’t tell any
answer stating it a personal preference.
Table 4.6: Assessment of motivating factors for selecting a particular candidate
Response Number Percent
Personally known 517 9.13%
Experience 1661 29.35%
Honesty 1410 24.91%
Commitment 605 10.69%
Belongs to my caste/community 115 2.03%
Belongs to Party which I like 1182 20.88%
Total 5660 100.0%
Convenient
93.37%
Inconvenient
2.76%
Can’t remember
3.87%

68
Figure 4.6: Assessment of motivating factors for selecting a particular candidate
4.7: Assessment of respondent’s family members eligible for voting who have not voted
To assess the voting participation in the entire family of the respondents, this study evaluated
the number of eligible voters in their households who have not voted in the last elections. As
we can see from the below Table, 18.49% of respondents have reported that one or more
eligible voters have not voted in the previous elections.
Table 4.7: Assessment of respondent’s family members eligible for voting who have not
voted
Response Number Percent
Yes 1084 18.49%
No 4737 80.79%
Don’t know/remember 42 0.72%
Total 5863 100.00%
9.13%
29.35%
24.91%
10.69%
2.03%
20.88%
Personally known Experience Honesty Commitment Belongs to my
caste/community
Belongs to Party
which I like

69
Figure 4.7: Assessment of respondent’s eligible family members who have not voted
4.8: Assessment of the reasons for not voting by eligible voters in the respondent’s
family
When the assessment of the reasons for not voting by eligible voters in the respondent’s
family was done, we identified multiple reasons. More than 54% of respondents reported that
the voters in their family were not in town. This result is consistent with the previous findings
that migration is one of the main reasons behind lower participation in the elections. About
10% of respondents reported that the eligible voters were not having electoral photo ID cards,
while 23% reported that their names were not listed on the electoral roll. Few of the
respondents also reported that the eligible voters did not participate in voting because they
believe that nothing will change even after the elections. Also, a few respondents reported
that the eligible voters in their family were unaware of the location of the polling booth.
Some other reasons reported in this study were: long queue at the polling booth, the influence
of community leaders or head of the family, particular caste/community dominance and
lacking theright candidate, etc.
Table 4.8: Reasons for not voting by eligible voters in the respondent’s family
Response Number Percent
(N=1084)
S/he did not have electoral photo ID Card 107 9.87%
S/he did not know the polling station 9 0.83%
The polling station was at a distance (S/he had transportation /logistic 33 3.04%
Yes
18.49%
No
80.79%
Don’t
remember
0.72%

70
Response Number Percent
(N=1084)
problem
Long queue and S/he did not have time 6 0.55%
No faith in the political system (or electoral Democracy) 3 0.28%
Did not vote as community or religious leader said so 28 2.58%
Head of the family said not to vote 14 1.29%
Voting is not essential for the maintenance of Democracy 3 0.28%
There was no good candidate 3 0.28%
The candidate was not of his/her choice or community 2 0.18%
S/he just did not want to vote as nothing will change 7 0.65%
S/he was not in his/her constituency 591 54.52%
S/he did not get voter slip even on polling day at the booth 4 0.37%
His/her name was not on the electoral roll 249 22.97%
Any Other 108 9.96%
Figure 4.8: Reasons for not voting by eligible voters in the respondent’s family
4.9: Factors influencing voting preference
A research question was administered in the survey asking each eligible respondent about the
factors influencing their voting preference. About 44.48% of respondents have confirmed that
their voting choice is based on the candidate. The detailed assessment is provided in the
Table and Graph given below.
0.18%
0.28%
0.28%
0.28%
0.37%
0.55%
0.65%
0.83%
1.29%
2.58%
3.04%
9.87%
9.96%
22.97%
54.52%
Candidate was not of his/her choice or community
No faith in political system (or electoral democracy)
Voting is not essential for maintenance of democracy
There was no good candidate
S/he did not get voter slip even on polling day at the…
Long queue and S/he did not have time
S/he just did not want to vote as nothing will change
S/he did not know the polling station
Head of family said not to vote
Did not vote as community or religious leader said so
Polling station was at distance (S/he had transportation…
S/he did not have electoral photo ID Card
Any Other
His/her name was not on electoral roll
S/he was not in his/her constituency

71
Table 4.9: Factors influencing voting preference
Response Number Percent
Family 331 5.65%
Caste 296 5.05%
Religion 480 8.19%
Candidate 2608 44.48%
Political Party 1641 27.99%
Any other 507 8.65%
Total 5863 100.00%
Figure 4.9: Factors influencing voting preference
4.10: Factors influencing high voter turnout in the respondent’s area
Unusually high voter turnout in elections is also carefully analysed by the concerned
authorities who strive for the execution of fair polling practices. This study has assessed
multiple factors that influence high voter turnout. In response to questions related to factors
influencing high voter turnout in the respondent’s area, 58% of respondents reported that the
right candidate was the main reason for this. Further, 30% reported that because of a
particular party wave, there was high voter turnout in their area. Dissatisfaction from the
Government or candidate was not a very significant reason as only a few respondents
reported this factor. The other reasons were money power and muscle power, police
Family Caste Religion Candidate Political
Party
Any other
5.65% 5.05%8.19%
44.48%
27.99%
8.65%
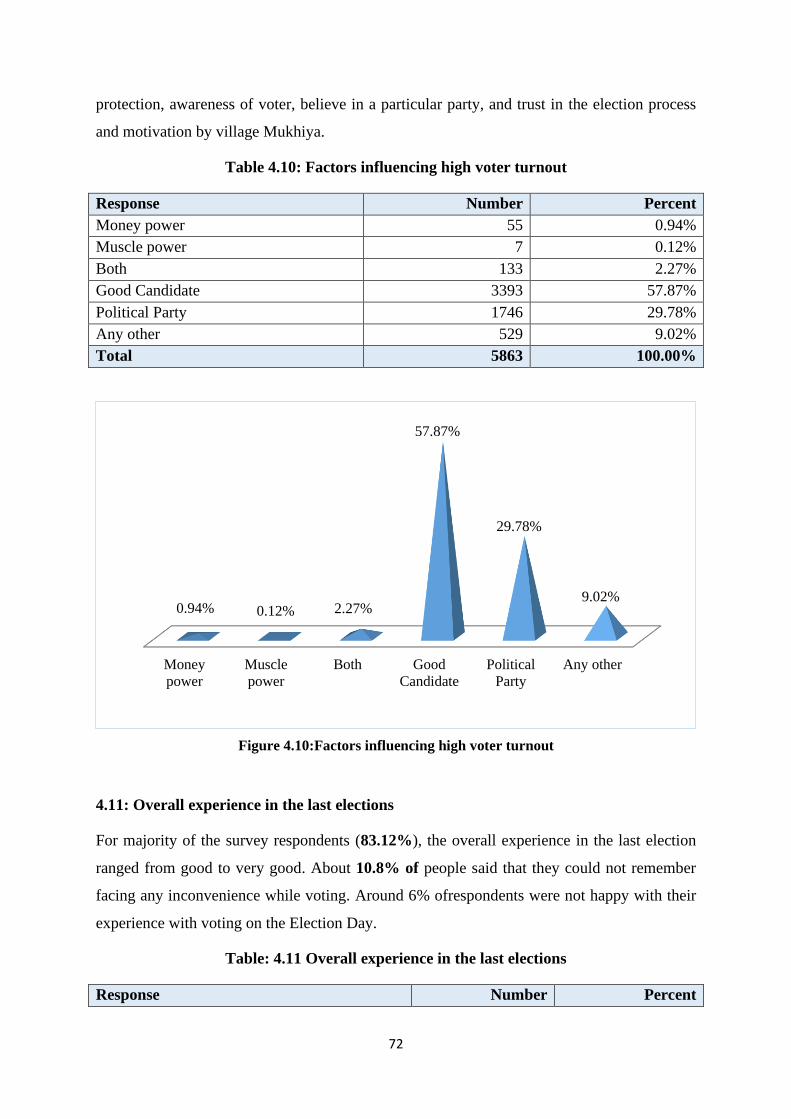
72
protection, awareness of voter, believe in a particular party, and trust in the election process
and motivation by village Mukhiya.
Table 4.10: Factors influencing high voter turnout
Response Number Percent
Money power 55 0.94%
Muscle power 7 0.12%
Both 133 2.27%
Good Candidate 3393 57.87%
Political Party 1746 29.78%
Any other 529 9.02%
Total 5863 100.00%
Figure 4.10:Factors influencing high voter turnout
4.11: Overall experience in the last elections
For majority of the survey respondents (83.12%), the overall experience in the last election
ranged from good to very good. About 10.8% of people said that they could not remember
facing any inconvenience while voting. Around 6% ofrespondents were not happy with their
experience with voting on the Election Day.
Table: 4.11 Overall experience in the last elections
Response Number Percent
Money
power
Muscle
power
Both Good
Candidate
Political
Party
Any other
0.94% 0.12% 2.27%
57.87%
29.78%
9.02%

73
Response Number Percent
Very Good 272 4.64%
Good 4601 78.48%
Not so perfect 310 5.29%
Imperfect 48 0.82%
Can’t Say/Don’t Know 632 10.78%
Total 5863 100.00%
Figure 4.11: Overall experience in the last elections
4.12: Assessment of security threats during elections
Over years, ECI has taken many steps to ensure that elections are held in a more conducive
environment without fear and favour. Today, elections in India largely remain a peaceful
event and this is reflected in this survey as well. When enquiredif there was any feeling of
insecurity during previous elections, less than 1% of the respondents gave an affirmative
reply.
Table 4.12: Assessment of security threats during elections
Response Number Percent
Very much 50 0.85%
Somewhat 498 8.49%
Not at all 5022 85.66%
Can’t say 293 5.00%
Very Good4.64%
Good78.48%
Not so perfect5.29%
Imperfect0.82%
Don’t Know10.78%

74
Total 5863 100.00%
Figure 4.12:Assessment of security threats during elections
4.13: Deployment of the police force
When asked about the deployment of police force during elections, more than 82%of the
respondents reported that the security arrangements were adequate. A total of 37people were
of the view that the security arrangements could have been better.
Table 4.13: Deployment of the police force
Response Number Percent
Very much 2102 35.85%
Somewhat 2721 46.41%
Not at all 37 0.63%
Can’t say 1003 17.11%
Total 5863 100.00%
Very much Somewhat Not at all Can’t say
0.85%
8.49%
85.66%
5.00%

75
Figure 4.13: Deployment of police force
4.14: Experience at the polling booth during elections
A research question was administered in the study survey asking each eligible respondent
about their experience at the polling booth during elections. Nearly 84% of the respondents
felt satisfied with their experience at the polling booth on the day of election. Almost 8% of
the people did not have good experience at the polling booth. The detailed assessment is
provided in the Table and Graph given below.
Table 4.14: Experience at the polling booth during elections
Response Number Percent
Very Good 270 4.77%
Good 4468 78.94%
Not so good 412 7.28%
Not at all good 39 0.69%
Can’t Say 471 8.32%
Total 5660 100.00%
Very much
35.85%
Somewhat
46.41%
Not at all
0.63%Can’t say
17.11%

76
Figure 4.14:Experience at the polling booth during elections
4.15: Behaviour of the polling staff at the polling booth during elections
A research question was administered in the study survey asking each eligible respondent
about the behavior of the polling staff at the polling booth during the last election. About
88% of respondents have confirmed that the polling staff deputed at their booth were
cooperative in their approach. The detailed assessment is provided in the Table and Graph
given below.
Table 4.15:Behaviour of the polling staff at the polling booth during elections
Response Number Percent
Very Cooperative 264 4.66%
Cooperative 4725 83.48%
Not so cooperative 473 8.36%
Not at all cooperative 36 0.64%
Can’t say 162 2.86%
Total 5660 100.00%
Very Good
4.77%
Good
78.94%
Not so good
7.28%
Not at all good
0.69%
Can’t Say
8.32%
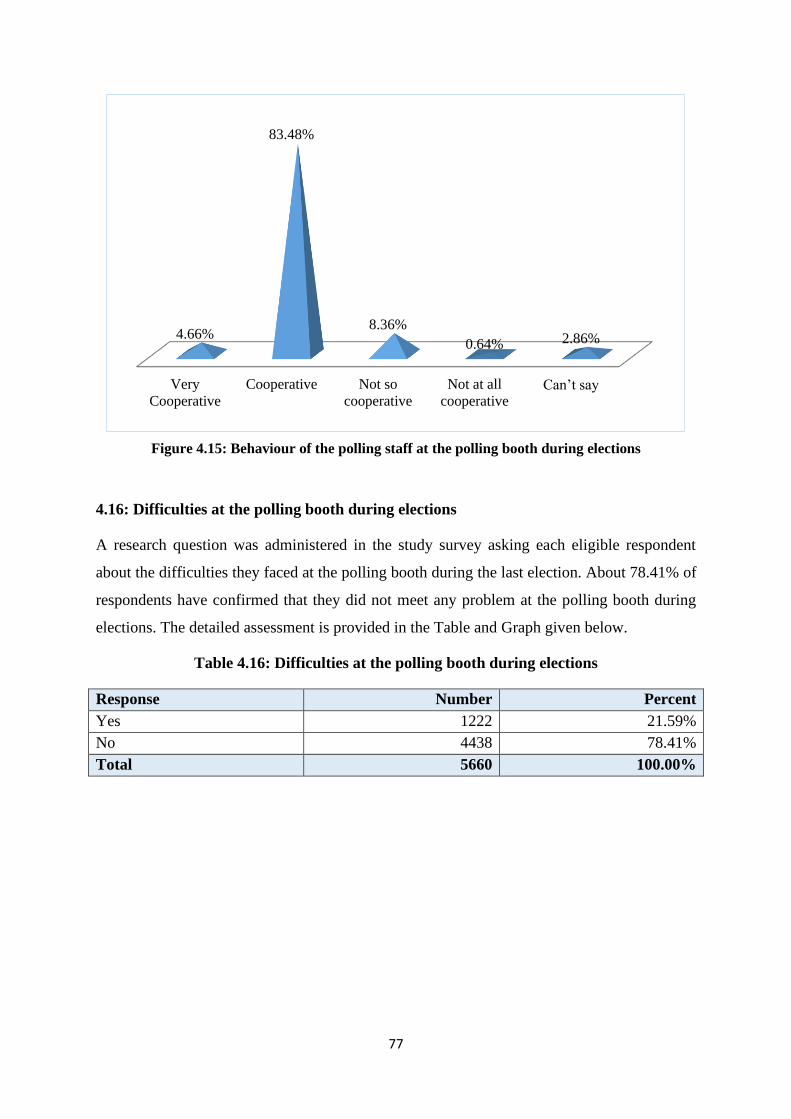
77
Figure 4.15: Behaviour of the polling staff at the polling booth during elections
4.16: Difficulties at the polling booth during elections
A research question was administered in the study survey asking each eligible respondent
about the difficulties they faced at the polling booth during the last election. About 78.41% of
respondents have confirmed that they did not meet any problem at the polling booth during
elections. The detailed assessment is provided in the Table and Graph given below.
Table 4.16: Difficulties at the polling booth during elections
Response Number Percent
Yes 1222 21.59%
No 4438 78.41%
Total 5660 100.00%
Very
Cooperative
Cooperative Not so
cooperative
Not at all
cooperativeCan’t say
4.66%
83.48%
8.36%
0.64% 2.86%

78
Figure 4.16: Difficulties at the polling booth during elections
4.17: Types of difficulties faced by voters’ at the polling booth during elections
When asked about difficulties faced by people on the day of voting, 72% of respondents said
that they experienced long queues at the polling booths. In comparison,26.51% of people
indicated the lack of arrangements for drinking water, toilets, and ramp for differently-abled
voters. 15.47% of respondents during the survey also pointed out the absence of a separate
queue for senior citizens / older adults. 7.53% of people said that they hardly received any
guidance from polling personnel, while 1% of respondents said that they faced difficulty in
getting their voter slip at the facilitation centre.
Some people also talked about the difficulty in accessing the polling booth, especially where
there were water bodies (ponds/lakes) in the way. Several respondents also spoke about harsh
weather and the lack of arrangements of shade for people who have to stand for long hours in
the queue before they get a chance to vote. Few respondents also spoke about the EVMs
getting dysfunctional, and the time they had to wait for before the machine became
functional.
Table 4.17:Type of difficulties faced by voters on the day of voting
Response Number Percent
Long queue 878 71.85%
No separate queue for senior citizen women 189 15.47%
Yes
21.59%
No
78.41%
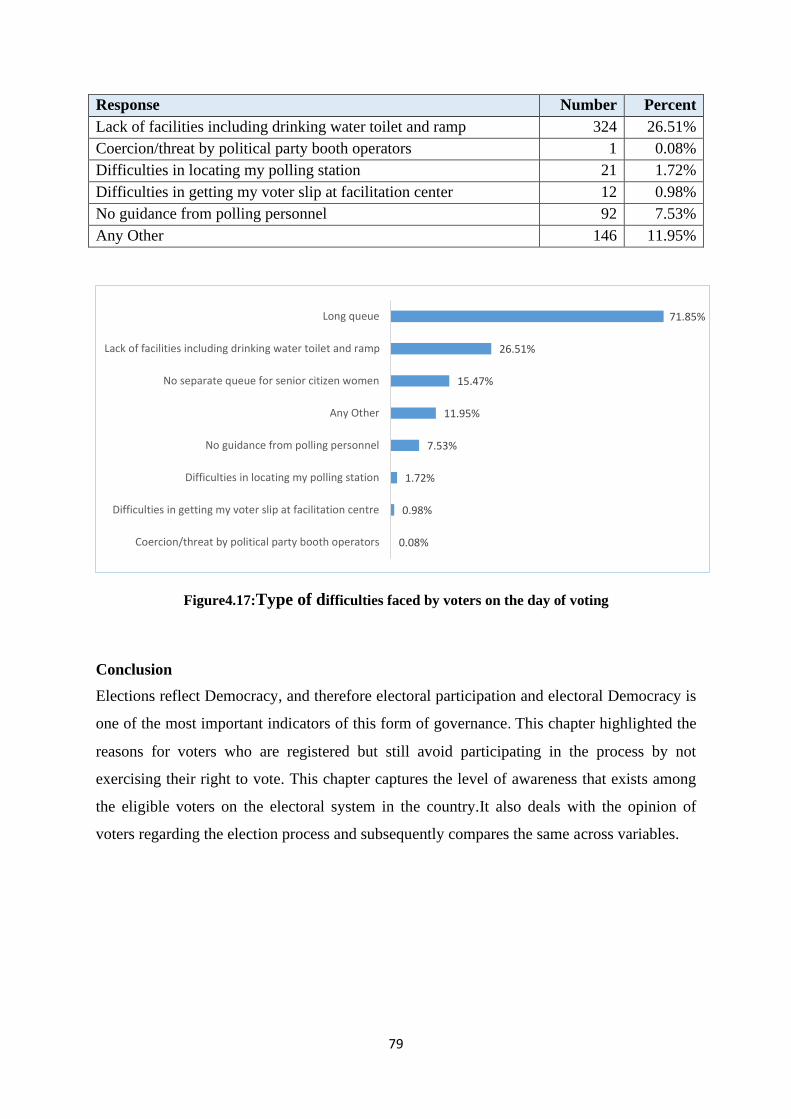
79
Response Number Percent
Lack of facilities including drinking water toilet and ramp 324 26.51%
Coercion/threat by political party booth operators 1 0.08%
Difficulties in locating my polling station 21 1.72%
Difficulties in getting my voter slip at facilitation center 12 0.98%
No guidance from polling personnel 92 7.53%
Any Other 146 11.95%
Figure4.17:Type of difficulties faced by voters on the day of voting
Conclusion
Elections reflect Democracy, and therefore electoral participation and electoral Democracy is
one of the most important indicators of this form of governance. This chapter highlighted the
reasons for voters who are registered but still avoid participating in the process by not
exercising their right to vote. This chapter captures the level of awareness that exists among
the eligible voters on the electoral system in the country.It also deals with the opinion of
voters regarding the election process and subsequently compares the same across variables.
0.08%
0.98%
1.72%
7.53%
11.95%
15.47%
26.51%
71.85%
Coercion/threat by political party booth operators
Difficulties in getting my voter slip at facilitation centre
Difficulties in locating my polling station
No guidance from polling personnel
Any Other
No separate queue for senior citizen women
Lack of facilities including drinking water toilet and ramp
Long queue
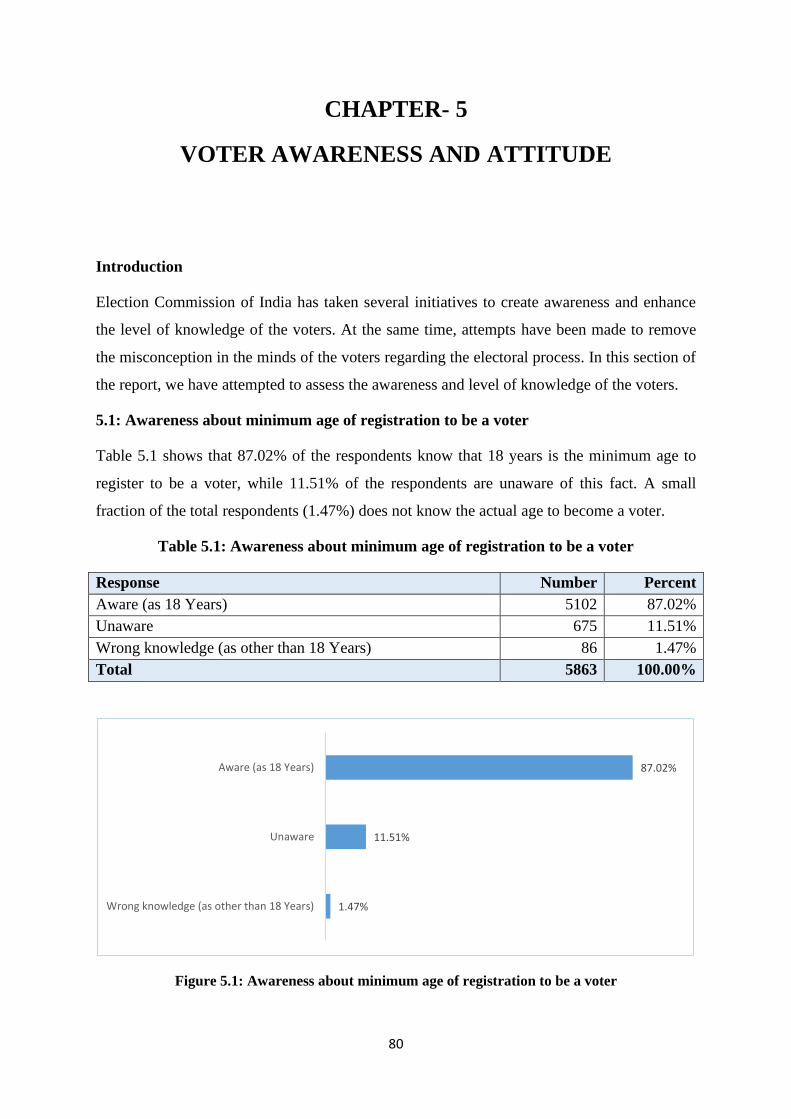
80
CHAPTER- 5
VOTER AWARENESS AND ATTITUDE
Introduction
Election Commission of India has taken several initiatives to create awareness and enhance
the level of knowledge of the voters. At the same time, attempts have been made to remove
the misconception in the minds of the voters regarding the electoral process. In this section of
the report, we have attempted to assess the awareness and level of knowledge of the voters.
5.1: Awareness about minimum age of registration to be a voter
Table 5.1 shows that 87.02% of the respondents know that 18 years is the minimum age to
register to be a voter, while 11.51% of the respondents are unaware of this fact. A small
fraction of the total respondents (1.47%) does not know the actual age to become a voter.
Table 5.1: Awareness about minimum age of registration to be a voter
Response Number Percent
Aware (as 18 Years) 5102 87.02%
Unaware 675 11.51%
Wrong knowledge (as other than 18 Years) 86 1.47%
Total 5863 100.00%
Figure 5.1: Awareness about minimum age of registration to be a voter
1.47%
11.51%
87.02%
Wrong knowledge (as other than 18 Years)
Unaware
Aware (as 18 Years)

81
5.2: Awareness about qualifying date for registration
Table 5.2 shows the awareness level about the qualifying date for registration on the electoral
roll being 1st January of each year. 60.69% of the respondents are unaware about the
qualifying date for registration and 18.44% of the respondents believe that the actual age for
getting registered on electoral voting is 18th birthday. Only 20.88% of the respondents
reported 1st January as the qualifying date. It seems that there is a need to clear the
misconception between minimum age for registration and qualifying date for registration on
the electoral roll.
Table 5.2: Awareness about Date for determining qualifying age for getting registered
on the electoral voting
Response Number Percent
18th Birthday 1081 18.44%
1st January 1224 20.88%
Don’t know 3558 60.69%
Total 5863 100.00%
Figure 5.2: Awareness about Date for determining qualifying age for getting registered on the
electoral voting
5.3: Awareness about Voters’ Day
National Voters’ Day is celebrated on 25th January each year to mark the foundation day of
the Election Commission of India. It is also celebrated with the mission to encourage more
young voters to participate in the political process of the country. Table 5.3 shows 90.09% of
the respondents do not know that the National Voter’s Day is celebrated on 25th January,
18.44%
20.88%
60.69%
18th Birthday
1st January
Don’t know

82
while 6.07% of the respondents are aware of the correct date. However, 3.84% of the
respondents are not aware of the correct date.
Table 5.3: Awareness about Voters’ Day
Response Number Percent
Wrong knowledge 225 3.84%
Right knowledge 356 6.07%
Don’t know 5282 90.09%
Total 5863 100.00%
Figure 5.3: Awareness about Voters’ Day
5.4 (A): Awareness about NOTA option
Election Commission of India introduced the NOTA (None of the above) option on the EVM
in the year 2013. Voters use this option to reject all the candidates contesting in the election.
Table 5.4 (A) shows that 44.53% of respondents have seen the NOTA option on the EVM
machine. 1.55% of respondents are informed about the NOTA option during the electoral
literacy program, while 11.48% of the respondents have read and heard about NOTA.
However, 42.44% of respondents are unaware of the NOTA option on EVM.
Table 5.4 (A): Awareness about NOTA option
Response Number Percent
Yes, saw it when I cast my vote 2611 44.53%
Yes, have seen one in electoral literacy 91 1.55%
Yes, have heard/read about it 673 11.48%
No 2488 42.44%
Total 5863 100.00%
3.84%
6.07%
90.09%
Wrong knowledge
Right knowledge
Don’t know

83
Figure 5.4 (A): Awareness about NOTA option
5.4 (B): Awareness about the name of candidates available in Braille on the Electronic
Voting Machine (EVM)
Since 2009, Election Commission of India is providing the names of the candidates in Braille
to help the visually disabled individuals to cast their votes. Table 5.4 (B) shows that 25.19%
of respondents have seen the Braille provision on the EVM. 3.60% of respondents confirmed
that they were informed about the option in the electoral literacy program, while 18.23% of
respondents have read and heard about this option. Such a facility is available for a decade
now, and despite this, 52.98% of the respondents are not aware of the Braille provision on
EVMs.
Table 5.4 (B): Awareness about the name of candidates available in Braille on the EVM
Response Number Percent
Yes, saw it when I cast my vote 1477 25.19%
Yes, have seen one in electoral literacy 211 3.60%
Yes, have heard/read about it 1069 18.23%
No 3106 52.98%
Total 5863 100.00%
1.55%
11.48%
42.44%
44.53%
Yes, have seen one in electoral literacy
Yes, have heard/read about it
No
Yes, saw it when I cast my vote
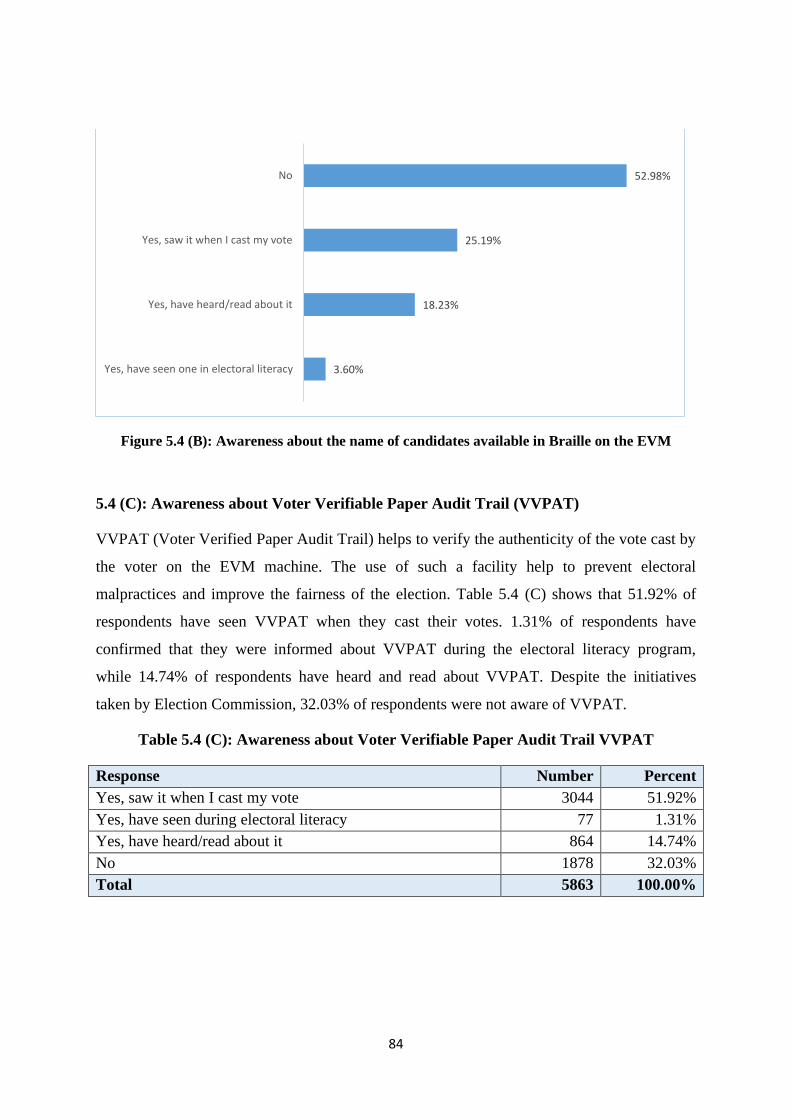
84
Figure 5.4 (B): Awareness about the name of candidates available in Braille on the EVM
5.4 (C): Awareness about Voter Verifiable Paper Audit Trail (VVPAT)
VVPAT (Voter Verified Paper Audit Trail) helps to verify the authenticity of the vote cast by
the voter on the EVM machine. The use of such a facility help to prevent electoral
malpractices and improve the fairness of the election. Table 5.4 (C) shows that 51.92% of
respondents have seen VVPAT when they cast their votes. 1.31% of respondents have
confirmed that they were informed about VVPAT during the electoral literacy program,
while 14.74% of respondents have heard and read about VVPAT. Despite the initiatives
taken by Election Commission, 32.03% of respondents were not aware of VVPAT.
Table 5.4 (C): Awareness about Voter Verifiable Paper Audit Trail VVPAT
Response Number Percent
Yes, saw it when I cast my vote 3044 51.92%
Yes, have seen during electoral literacy 77 1.31%
Yes, have heard/read about it 864 14.74%
No 1878 32.03%
Total 5863 100.00%
3.60%
18.23%
25.19%
52.98%
Yes, have seen one in electoral literacy
Yes, have heard/read about it
Yes, saw it when I cast my vote
No

85
Figure 5.4 (C): Awareness about Voter Verifiable Paper Audit Trail (VVPAT)
5.5: Opinion of the respondents
Several statements were put in front of the respondents and they were asked to give their
opinion at five levels that include Strongly Disagree, Disagree, Neutral, Agree and Strongly
Agree.
Table 5.5 shows that statements to which the majority of the respondents agree include,
“Every vote counts”, “Elections are conducted freely and fairly in India”, “Voting should be
made compulsory”, and “EVMs provide accurate results”. The statement “The influence of
money and muscle is increasing in elections” provided mixed results. A significant number of
respondents agree with the statement. The statements to which the majority of the
respondents disagree include, “Women should consult male members or elders before voting
in elections”, “Voting is cumbersome chore” and “I do not intend to vote in the upcoming
elections”.
Table 5.5: Opinion of the respondents
Type of Problem Strongly
disagree Disagree Neutral Agree
Strongly
agree
Every vote counts 0.17% 0.05% 1.57% 73.31% 24.90%
Voting should be made
compulsory 4.40% 9.65% 6.36% 57.36% 22.22%
Voting is cumbersome chore 38.39% 50.33% 8.72% 2.03% 0.53%
Elections are conducted freely
and fairly in India 8.05% 3.58% 10.86% 49.17% 28.33%
EVMs provide accurate results 2.06% 3.17% 19.55% 52.77% 22.45%
Women should consult male 25.24% 42.73% 5.97% 23.28% 2.78%
1.31%
14.74%
32.03%
51.92%
Yes, have seen one in electoral literacy
Yes, have heard/read about it
No
Yes, saw it when I cast my vote

86
Type of Problem Strongly
disagree Disagree Neutral Agree
Strongly
agree
members or elders before voting
in elections
The influence of money and
muscle is increasing in elections 24.15% 20.76% 22.87% 29.37% 2.85%
I do not intend to vote in the
upcoming elections 39.89% 57.38% 2.08% 0.38% 0.27%
Figure 5.5: Opinion of the respondents
5.6: Awareness about the priority access of elderly and electors with disability during
voting
Table 5.6 shows that 58.25% of the respondents are unaware that the elderly and electors
with disability are given priority access in the polling station on the Election Day, while
41.75% of the respondents are aware of the fact.
Table 5.6: Awareness about the priority access of elderly and electors with disability
during voting
39.89%
38.39%
25.24%
24.15%
57.38%
50.33%
42.73%
20.76%
9.65%
8.72%
5.97%
22.87%
19.55%
6.36%
23.28%
29.37%
52.77%
57.36%
49.17%
73.31%
2.85%
22.45%
22.22%
28.33%
24.90%
I do not intend to vote in the upcoming elections
Voting is cumbersome chore
Women should consult male members or elders beforevoting in elections
The influence of money and muscle is increasing inelections
EVMs provide accurate results
Voting should be made compulsory
Elections are conducted freely and fairly in India
Every vote counts
Strongly disagree Disagree Neutral Agree Strongly agree

87
Response Number Percent
Yes 2448 41.75%
No 3415 58.25%
Total 5863 100.00%
Figure 5.6: Awareness about the priority access of elderly and electors with disability during
voting
5.7: Awareness about the availability of special volunteers to assist elderly and electors
with disability during voting
Table 5.7 shows that 69.50% of the respondents are not aware that special volunteers assist
and guide the elderly and electors with disability at the polling station on the Election Day,
while 30.50% of the respondents are aware of the fact.
Table 5.7:Awareness about the availability of special volunteers to assist elderly and
electors with disability during voting
Response Number Percent
Yes 1788 30.50%
No 4075 69.50%
Total 5863 100.00%
41.75%
58.25%
Yes
No

88
Figure 5.7:Awareness about the availability of special volunteers to assist elderly and electors
with disability during voting
5.8: Awareness about the Assured Minimum Facilities for voters at the polling stations
Table 5.8 shows that 66.38% of the respondents are unaware about the “Assured Minimum
Facilities” (availability of clean drinking water, adequate furniture for voters in the queue,
shed, and toilets) provided to voters at the polling stations on the election day while 33.62%
of the respondents are aware of the fact.
Table 5.8: Awareness about the Assured Minimum Facilities for voters at the polling
stations
Response Number Percent
Yes 1971 33.62%
No 3892 66.38%
Total 5863 100.00%
Figure 5.8: Awareness about the Assured Minimum Facilities for voters at the polling stations
30.50%
69.50%
Yes
No
33.62%
66.38%
Yes
No

89
5.9: Awareness about the Postal Ballot facility for voters above 80 years
Table 5.9 shows that the 92.68% of the respondents are unaware that that ECI has provided
Postal Ballot facility to voters who are above 80 years of age, while 7.32% of the respondents
are aware of the fact.
Table 5.9: Awareness about the Postal Ballot facility for voters above 80 years
Response Number Percent
Yes 429 7.32%
No 5434 92.68%
Total 5863 100.00%
Figure 5.9: Awareness about the Postal Ballot facility for voters above 80 years
5.10: Awareness about the Postal Ballot facility for voters who are in the essential
services
Table 5.10 shows that the 86.68% of the respondents are unaware that that ECI has provided
Postal Ballot facility to voters who in the essential services, while 13.32% of the respondents
are aware of the fact.
Table 5.10: Awareness about the Postal Ballot facility for voters who are in the essential
services
Response Number Percent
Yes 781 13.32%
No 5082 86.68%
Total 5863 100.00%
7.32%
92.68%
Yes
No
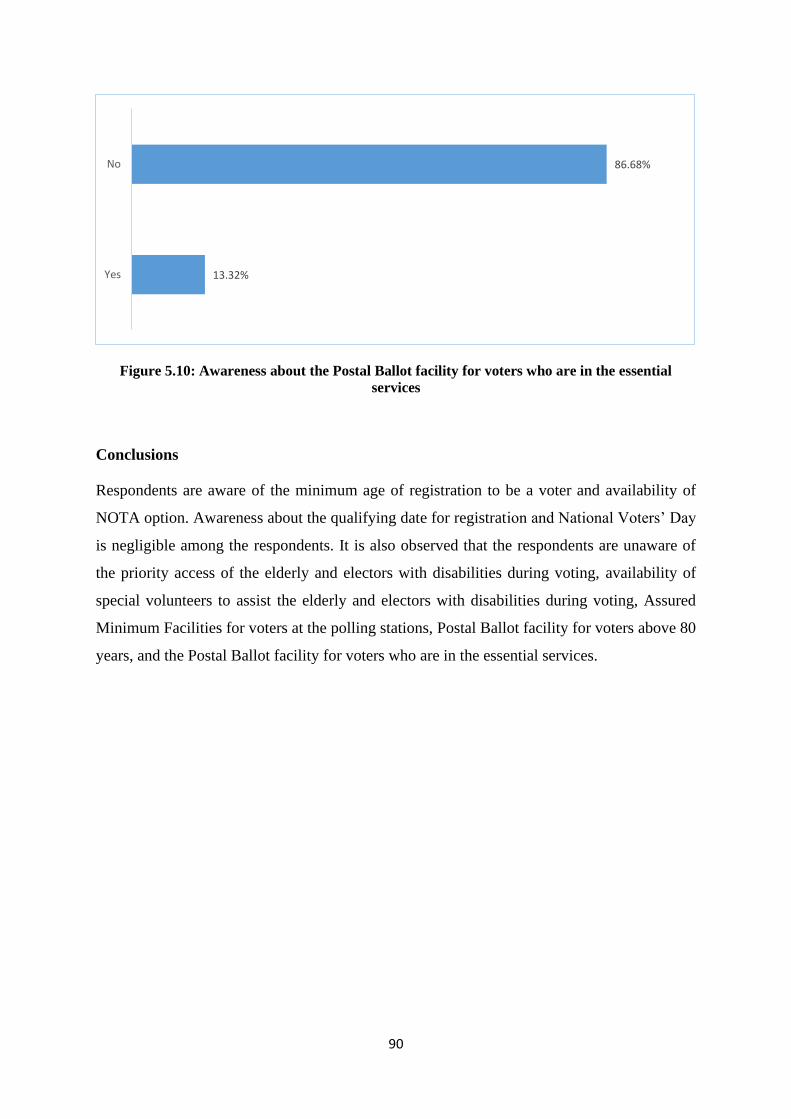
90
Figure 5.10: Awareness about the Postal Ballot facility for voters who are in the essential
services
Conclusions
Respondents are aware of the minimum age of registration to be a voter and availability of
NOTA option. Awareness about the qualifying date for registration and National Voters’ Day
is negligible among the respondents. It is also observed that the respondents are unaware of
the priority access of the elderly and electors with disabilities during voting, availability of
special volunteers to assist the elderly and electors with disabilities during voting, Assured
Minimum Facilities for voters at the polling stations, Postal Ballot facility for voters above 80
years, and the Postal Ballot facility for voters who are in the essential services.
13.32%
86.68%
Yes
No
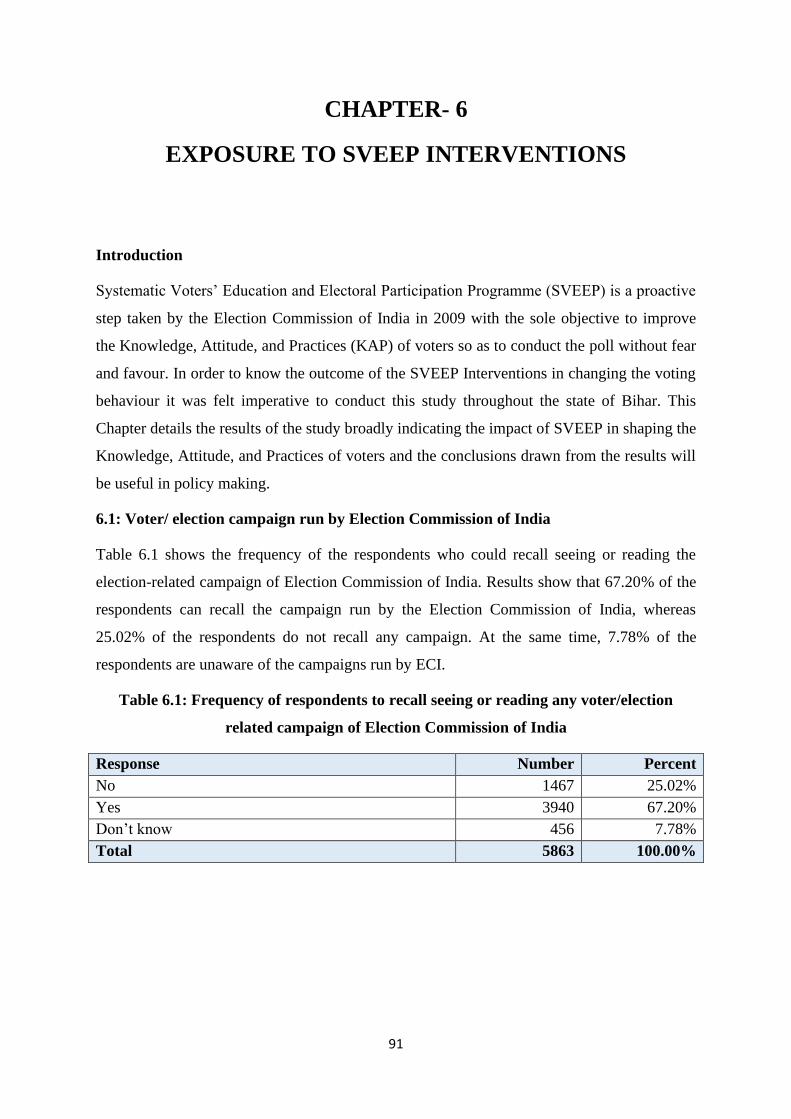
91
CHAPTER- 6
EXPOSURE TO SVEEP INTERVENTIONS
Introduction
Systematic Voters’ Education and Electoral Participation Programme (SVEEP) is a proactive
step taken by the Election Commission of India in 2009 with the sole objective to improve
the Knowledge, Attitude, and Practices (KAP) of voters so as to conduct the poll without fear
and favour. In order to know the outcome of the SVEEP Interventions in changing the voting
behaviour it was felt imperative to conduct this study throughout the state of Bihar. This
Chapter details the results of the study broadly indicating the impact of SVEEP in shaping the
Knowledge, Attitude, and Practices of voters and the conclusions drawn from the results will
be useful in policy making.
6.1: Voter/ election campaign run by Election Commission of India
Table 6.1 shows the frequency of the respondents who could recall seeing or reading the
election-related campaign of Election Commission of India. Results show that 67.20% of the
respondents can recall the campaign run by the Election Commission of India, whereas
25.02% of the respondents do not recall any campaign. At the same time, 7.78% of the
respondents are unaware of the campaigns run by ECI.
Table 6.1: Frequency of respondents to recall seeing or reading any voter/election
related campaign of Election Commission of India
Response Number Percent
No 1467 25.02%
Yes 3940 67.20%
Don’t know 456 7.78%
Total 5863 100.00%

92
Figure 6.1: Frequency of respondents to recall seeing or reading any voter/election related
campaign of Election Commission of India
6.2: Media used by respondents to received election related information
Table 6.2 shows the sources from which the respondents received the information related to
the elections. Results show that 50.84% of the respondents receive information about the
elections through TV advertisements and programs followed by activities such as Rallies,
Prabhat Pheris, and loudspeaker announcements [37.39%], posters, hoardings and publicity
materials [36.67%]. Moreover, 22.46% of respondents prefer to read newspapers or
magazines to receive the information, followed by the use the internet [10.73%], radio
[5.10%]. Around 5.2% of the respondents receive the election-related information at the
polling station.
The assessment of the survey responses has also revealed that the traditional way of
dissemination of election-related information such as radio, advertisement in cinemas,
Cultural/entertainment programs, Government offices circular, NGO and Civil society Group,
SMS, Pledge letters, Sankalp Patras through school students in the family are not much used
by the respondents.
No, 1467, 25%
Yes, 3940, 67%
Don’t know, 456, 8%
No
Yes
Don’t know

93
Table 6.2: Media use by respondents to receive the election related information
Response (N=5863) Number Percent
Newspapers/magazines 1317 22.46%
TV advertisements and programmes 2981 50.84%
Radio and FM channels 299 5.10%
Advertisement in Cinemas 2 0.04%
Activity like Rallies, PrabhatPheris, loudspeaker announcement 2192 37.39%
Cultural/entertainments programmes 54 0.92%
Government offices circular 30 0.51%
Posters, hoardings and publicity materials 2150 36.67%
NGO and Civil society Group 28 0.48%
Internet/social Media/ WhatsApp 629 10.73%
SMS 108 1.84%
Pledge letters/Sankalppatras through school students in the family 138 2.35%
At Polling Station 186 3.17%
Others 113 1.93%
Figure 6.2: Source use by respondents to receive information
6.3: Voter information/messages received by the respondents
Table 6.3 shows the information or the messages received by the respondents. The
assessment of the survey responses has revealed that majority of the respondents (54.03%)
0.04%
0.48%
0.51%
0.92%
1.84%
1.93%
2.35%
3.17%
5.10%
10.73%
22.46%
36.67%
37.39%
50.84%
Advertisement in Cinemas
NGO and Civil society Group
Government offices circular
Cultural/entertainments programmes
SMS
Others
Pledge letters/Sankalppatras through school students in…
At Polling Station
Radio and FM channels
Internet/social Media/ Whatsapp
Newspapers/magazines
Posters, hoardings and publicity materials
Activity like Rallies, PrabhatPheris, loudspeaker…
TV advertisements and programmes

94
could recall “Voting is my right and duty”, followed by “Date of voting and schedules” by
47.55% of respondents, and “Cast vote as per choice and without taking any inducement” by
34.68% of the respondents. 12.16% of the respondents recall “Priority Voting for old and
PwDs” followed by “12 identity documents allowed for Voting” by 9.26% of the respondents,
and “Facilities provided at Polling Station” by 4.06% of the respondents. NVSP portal is
recalled by 3.97% of respondents followed by “≠Go Register or Register” by 3.24% of the
respondents, and “≠Go Verify or Verify name in Voter list” by 1.83% respondents.
The information or messages about, “Voter helpline 1950 or Voter Helpline App”, and
“cVIGIL App related” are marginally recalled by the voters.
Table 6.3: Voter information/messages received by the respondents
Response (N=5863) Number Percent
Date of voting and schedules 2788 47.55%
≠Voting is my right and duty 3168 54.03%
≠Cast vote as per choice and without taking any inducement 2033 34.68%
≠Go Register or Register 190 3.24%
≠Go Verify or Verify name in Voter list 107 1.83%
12 identity documents allowed for Voting 543 9.26%
Facilities provided at Polling Station 238 4.06%
Priority Voting for old and PwDs 713 12.16%
Voter helpline 1950 or Voter Helpline App 18 0.31%
cVIGIL App related 1 0.02%
NVSP portal 233 3.97%
0.02%
0.31%
1.83%
3.24%
3.97%
4.06%
9.26%
12.16%
34.68%
47.55%
54.03%
cVIGIL App related
Voter helpline 1950 or Voter Helpline App
≠Go Verify or Verify name in Voter list
≠Go Register or Register
NVSP portal
Facilities provided at Polling Station
12 identity documents allowed for Voting
Priority Voting for old and PwDs
≠Cast vote as per choice and without taking any …
Date of voting and schedules
≠Voting is my right and duty

95
Figure 6.3: Voter information/messages received by the respondents
6.4: Taglines used in the campaign
Table 6.4 shows the frequency of respondents who were able to recall the tagline used during
the campaign. The assessment of the survey responses has revealed that nearly half of the
respondents recall the taglines, “Desh ka Mahatyohar” and “No Voter to be Left Behind/Koi
Matdata Na Chootey”. However, 82.81% of the respondents do not recall the tagline, “≠ Go
Register, ≠ Go verify or ≠ Go Vote”.
Table 6.4: Frequency of respondents able to recall tagline of the campaign during this
election
Response No Yes
No % No %
Desh ka Mahatyohar 2655 45.28% 3208 54.72%
No Voter to be Left Behind/Koi Matdata Na chootey 2949 50.30% 2914 49.70%
≠ Go Register, ≠ Go verify or ≠ Go Vote 4855 82.81% 1008 17.19%
Figure 6.4: Frequency of respondents able to recall tagline of the campaign during this election
6.5: Celebrities in the election
Table 6.5 shows the frequency of the respondents who recall celebrities/Icons who gave a
message for voting. The assessment of the survey responses has revealed that the respondents
were able to identify or recall M.S. Dhoni [33.26%] followed by Aamir Khan [20.50%],
Saina Nehwal [10.93%] and Mary Kom [7.78%]. A very small number of respondents recall
Pankaj Tripathi and Santosh Yadav.
17.19%
49.70%
54.72%
≠ Go Register, ≠ Go verify or ≠ Go Vote
No Voter to be Left Behind/Koi Matdata Na chootey
Desh ka Mahatyohar

96
Table 6.5: Frequency of the respondent who recall the message given by the celebrities
Response Number Percent
M.S. Dhoni 1950 33.26%
Mary Kom 456 7.78%
Saina Nehwal 641 10.93%
Aamir Khan 1202 20.50%
Pankaj Tripathi 166 2.83%
Santosh Yadav 99 1.69%
Figure 6.5: Frequency of the respondent who recall the message given by the celebrities
6.6: Usage of the website www.nvsp.in
Table 6.6 shows the frequency of respondents who have accessed www.nvsp.in. The
assessment of the survey responses has revealed that 95.41% of the respondents do not know
about the website www.nvsp.in. Only 1.31% of the respondents said that they accessed
www.nvsp.in. About 3.27% of the respondents are unaware of such a website.
Table 6.6: Frequency of respondents who have accessed www.nvsp.in
Response Number Percent
No 5594 95.41%
Yes 77 1.31%
Don’t know 192 3.27%
Total 5863 100.00%
1.69%
2.83%
7.78%
10.93%
20.50%
33.26%
Santosh Yadav
Pankaj Tripathi
Mary Kom
Saina Nehwal
Aamir Khan
M.S. Dhoni

97
Figure 6.6: Frequency of respondents who have accessed www.nvsp.in
6.7: Purpose for using the websitewww.nvsp.in
Table 6.7 shows the details for which the respondents used the website www.nvsp.in. Out of
5863 respondents, only 77 used the website www.nvsp.in. Out of these 52 respondents
[67.53%] used the website to search name and other details on the Electoral Roll. Total 21
respondents [27.27%] used the website to register/make modifications online and 3
respondents [3.90%] used the website to download registration forms and 1 respondent
[1.30%] used the website to know polling station details.
Table 6.7: Purpose for using the websitewww.nvsp.in
Response Number Percent
To search name and other details on the Electoral Roll 52 67.53%
To register/make modifications online 21 27.27%
To download registration forms 3 3.90%
To know polling station details 1 1.30%
Total 77 100.00%
1.31%
3.27%
95.41%
Yes
Don’t know
No
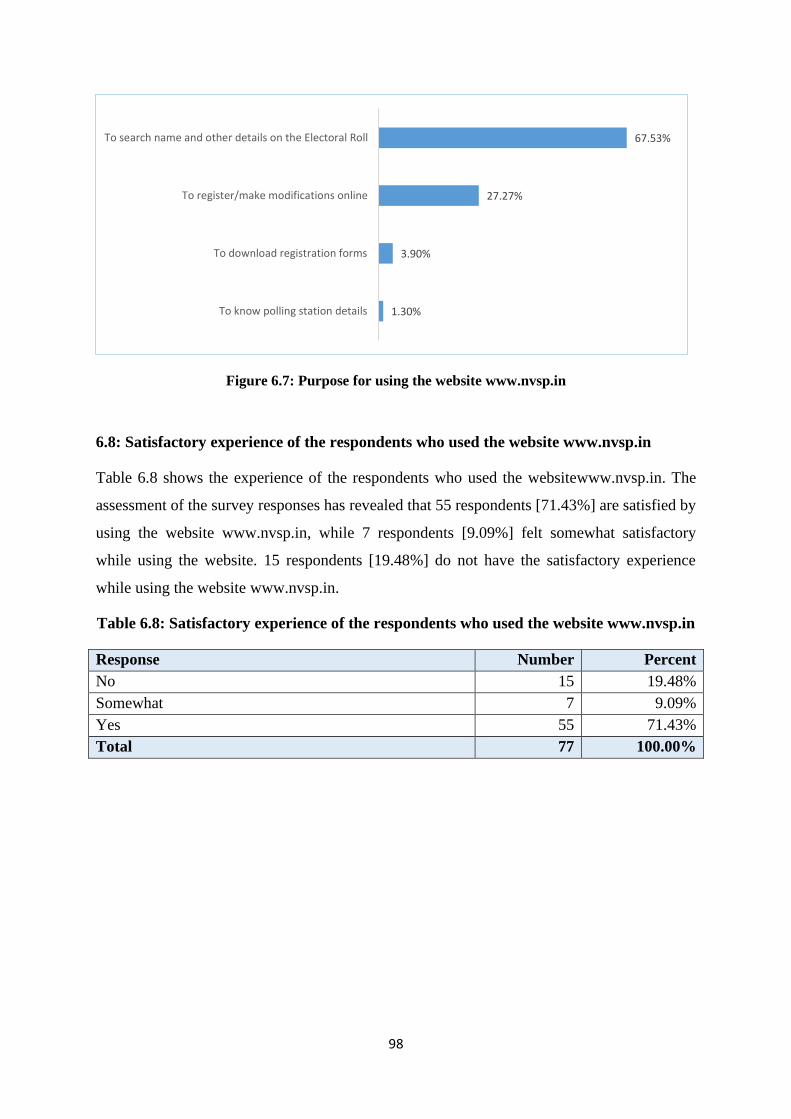
98
Figure 6.7: Purpose for using the website www.nvsp.in
6.8: Satisfactory experience of the respondents who used the website www.nvsp.in
Table 6.8 shows the experience of the respondents who used the websitewww.nvsp.in. The
assessment of the survey responses has revealed that 55 respondents [71.43%] are satisfied by
using the website www.nvsp.in, while 7 respondents [9.09%] felt somewhat satisfactory
while using the website. 15 respondents [19.48%] do not have the satisfactory experience
while using the website www.nvsp.in.
Table 6.8: Satisfactory experience of the respondents who used the website www.nvsp.in
Response Number Percent
No 15 19.48%
Somewhat 7 9.09%
Yes 55 71.43%
Total 77 100.00%
1.30%
3.90%
27.27%
67.53%
To know polling station details
To download registration forms
To register/make modifications online
To search name and other details on the Electoral Roll

99
Figure 6.8: Satisfactory experience of the respondents who used the website www.nvsp.in
6.9: Usage of Voter Helpline No 1950 or used the Voter Helpline App
Table 6.9 shows the details of the respondents who have used respondents who have used
Voter Helpline No 1950 or used the Voter Helpline App. Out of 5863 respondents, only 19
respondents have used Voter Helpline No. 1950 and Voter Helpline App. The assessment of
the survey responses has revealed that 99.68% of the respondents have not used Voter
Helpline No. 1950 or Voter Helpline App. 7 respondents [0.12%] have used Voter Helpline
No. 1950 and 11 respondents [0.19%] have used Voter Helpline App.
Table 6.9: Usage of voter helpline number and App.
Response Number Percent
None of the two 5844 99.68%
Voter Helpline No. 1950 7 0.12%
Voter Helpline App only 11 0.19%
Both of them 1 0.02%
Total 5863 100.00%
No, 15, 20%
Somewhat, 7, 9%
Yes, 55, 71%
No
Somewhat
Yes

100
Figure 6.9: Usage of voter helpline number and App.
6.10: Purpose for using the Voter Helpline No 1950 or Voter Helpline App
Table 6.10 shows the information about the purpose for which the respondents used the Voter
Helpline No. 1950 or the Voter Helpline App. The assessment of the survey responses has
revealed that out of the total 19 respondents, 12 respondents [63.16%] used the service to
know about registration or voting process, 4 respondents [21.05%] used the service to verify
the name on the voter list, 2 respondents [10.53%] used the service to know the polling
station, and 1 respondent [5.26%] used the service to register a complaint.
Table 6.10: Purpose for using the Voter Helpline Number and App.
Response Number Percent
To know about registration or voting process 12 63.16%
To verify name on voter list 4 21.05%
To know my polling station 2 10.53%
To register a complaint 1 5.26%
Total 19 100.00%
Voter Helpline No. 1950, 7
Voter Helpline App only, 11
Both of them, 1
Voter Helpline No. 1950 Voter Helpline App only Both of them

101
Figure 6.10: Purpose for using helpline number and App.
6.11: Satisfactory experience of respondents who used Voter Helpline No. 1950 or Voter
Helpline App.
Table 6.11 shows the experience of the respondent who has used Voter Helpline No. 1950 or
Voter Helpline App. The assessment of the survey responses has revealed that 68.42% of the
respondents who have used Voter Helpline No. 1950 or Voter Helpline App have a
satisfactory experience. About 21.05% of the respondents said that the experience was not
satisfactory while 10.53% of the respondents said that that experience was somewhat
satisfactory.
Table 6.11: Satisfactory experience of respondents who used Voter Helpline No. 1950 or
Voter Helpline App.
Response Number Percent
No 4 21.05%
Somewhat 2 10.53%
Yes 13 68.42%
Total 19 100.00%
5.26%
10.53%
21.05%
63.16%
To register a complaint
To know my polling station
To verify name on voter list
To know about registration or voting process

102
Figure 6.11: Satisfactory experience of respondents who used Voter Helpline No. 1950 or Voter
Helpline App.
Conclusion
Election Commission of India works hard to create awareness among the people by providing
material, audio and video messages, helpline numbers, helpline app., etc. The main aim is to
create the awareness among people about the electoral process and to ensure maximum
participation during the elections to choose the representatives. Majority of the
respondentsrecall the campaign run by the Election Commission of India. They received
information about the elections through TV and other activities such as rallies, Prabhat
Pheris, loudspeaker announcements, posters, hoardings, publicity materials, etc. The
information about the availability of helpline number, helpline app, cVIGIL App is negligible
among the respondents.
No, 4, 21%
Somewhat, 2, 11%
Yes, 13, 68%
No
Somewhat
Yes

103
CHAPTER- 7
INVOLVEMENT OF PERSONS WITH DISABILITIES
(PWDs) IN THE ELECTION
Introduction
Persons with special abilities form a small and integral part of the society. Election
Commission of India has undertaken several measures to increase the participation of PwDs
in the elections. This part of the report aims to understand the issues faced by PwDs during
registration and voting process.
7.1: Information about households who have members with special abilities in their
family
Table 7.1 shows the details about the households who have members with special abilities in
their family. Results show that the highest number of respondents with disabilities are related
to disability in movement followed by disability in seeing, speech, and hearing.
Table 7.1: Information about households who have members with special abilities in
their family
Family with disabled persons Number Percent
Disability in hearing 2 0.03%
Disability in movement 42 0.72%
Disability in seeing 36 0.61%
Disability in speech 5 0.09%
Families without disabled persons 5778 98.55%
Grand Total 5863 100.00%
The details given below are based on the information obtained from the PwDs (n = 85).
7.2: Information received by PwDs which aimed at participation during the elections
Table 7.2 shows the information about the material (publicity/voter edutainment) obtained by
the PwDs which aimed at their participation during the elections. The results show that
76.47% of the respondents have not received such information. However, 23.53% of the

104
respondents said that they have received the publicity or voter edutainment material. It shows
that the efforts made by Election Commission of India to disseminate the information to the
target audience remains ineffective.
Table 7.2:Information (publicity/voter edutainment material) received by PwDs which
aimed at participation during the elections
Response Number Percent
Yes 20 23.53%
No 65 76.47%
Grand Total 85 100.00%
Figure 7.1:Information (publicity/voter edutainment material) received by PwDs which aimed
at participation during the elections
7.3: Interaction of Booth Level Officers with PwDs
Table 7.3 shows the information about the interaction of Booth Level Officers with the
PwDs. The results show that 63.53% of the respondents have interacted with the Booth Level
Officers of their area, while 36.47 said that they never interacted with the Booth Level
Officers.
Table 7.3: Interaction of Booth Level Officers with PwDs
Response Number Percent
Yes 54 63.53%
No 31 36.47%
Grand Total 85 100.00%
23.53%
76.47%
Yes
No

105
Figure 7.2: Interaction of Booth Level Officers with PwDs
7.4: Experience of PwDs during the process of registration
Table 7.4 shows the experience faced by the PwDs during the process of registration. Results
show that 49.41% of the respondents found the process easy, followed by 43.53% of the
PwDs who found the registration process neither easy nor difficult. Around 6% of the
respondents found the registration process difficult.
Table 7.4: Experience of PwDs during the process of registration
Response Number Percent
Easy 42 49.41%
Neither easy nor difficult 37 43.53%
Difficult 6 5.88%
Grand Total 85 100.00%
Figure 7.3: Experience of PwDs during the process of registration
36.47%
63.53%
No
Yes
5.88%
43.53%
49.41%
Difficult
Neither easy nor difficult
Easy
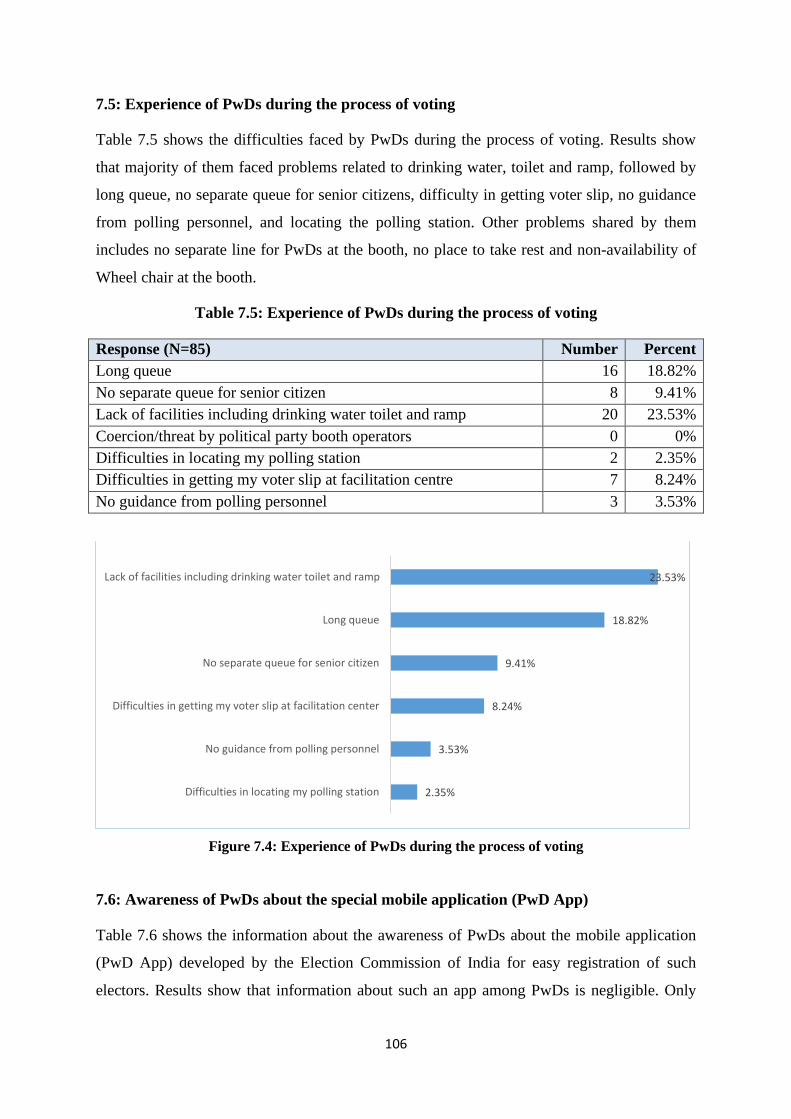
106
7.5: Experience of PwDs during the process of voting
Table 7.5 shows the difficulties faced by PwDs during the process of voting. Results show
that majority of them faced problems related to drinking water, toilet and ramp, followed by
long queue, no separate queue for senior citizens, difficulty in getting voter slip, no guidance
from polling personnel, and locating the polling station. Other problems shared by them
includes no separate line for PwDs at the booth, no place to take rest and non-availability of
Wheel chair at the booth.
Table 7.5: Experience of PwDs during the process of voting
Response (N=85) Number Percent
Long queue 16 18.82%
No separate queue for senior citizen 8 9.41%
Lack of facilities including drinking water toilet and ramp 20 23.53%
Coercion/threat by political party booth operators 0 0%
Difficulties in locating my polling station 2 2.35%
Difficulties in getting my voter slip at facilitation centre 7 8.24%
No guidance from polling personnel 3 3.53%
Figure 7.4: Experience of PwDs during the process of voting
7.6: Awareness of PwDs about the special mobile application (PwD App)
Table 7.6 shows the information about the awareness of PwDs about the mobile application
(PwD App) developed by the Election Commission of India for easy registration of such
electors. Results show that information about such an app among PwDs is negligible. Only
2.35%
3.53%
8.24%
9.41%
18.82%
23.53%
Difficulties in locating my polling station
No guidance from polling personnel
Difficulties in getting my voter slip at facilitation center
No separate queue for senior citizen
Long queue
Lack of facilities including drinking water toilet and ramp

107
3.53% of the applicants are aware of such an app, while 96.47% of the respondents are not
aware of such a mobile app.
Table 7.6: Awareness of PwDs about the special mobile application (PwD App)
Response Number Percent
Yes 3 3.53%
No 82 96.47%
Grand Total 85 100.00%
Figure 7.5: Awareness of PwDs about the special mobile application (PwD App)
Conclusion
The majority of the PwDs respondents have not received any material (publicity/voter
edutainment) that aimed at their participation during the elections. They have not faced
difficulty during the registration process but faced difficulty during voting. Their awareness
about the special mobile application (PwD App) is negligible.
3.53%
96.47%
Yes
No

108
CHAPTER- 8
INDUCEMENT
Introduction
This section of the report reflects upon the instances of inducement/offers given to the public
to lure them to give their vote to a specific person or a party. The results show that such
instances of inducement/offers are very less, and the elections are not affected by such
inducement/offers.
8.1: Information about the inducements/offers given to influence voters
Table 8.1 shows the details about the inducements/offers given to influence voters during the
previous elections. The results show that 95.99% of the voters have not received such offers,
while 4.01% of the voters said that they received such offers.
Table 8.1: Information about the inducements/offers given to influence voters
Response Number Percent
Yes 235 4.01%
No 5628 95.99%
Grand Total 5863 100.00%
Figure 8.1: Information about the inducements/offers given to influence voters
4.01%
95.99%
Yes
No
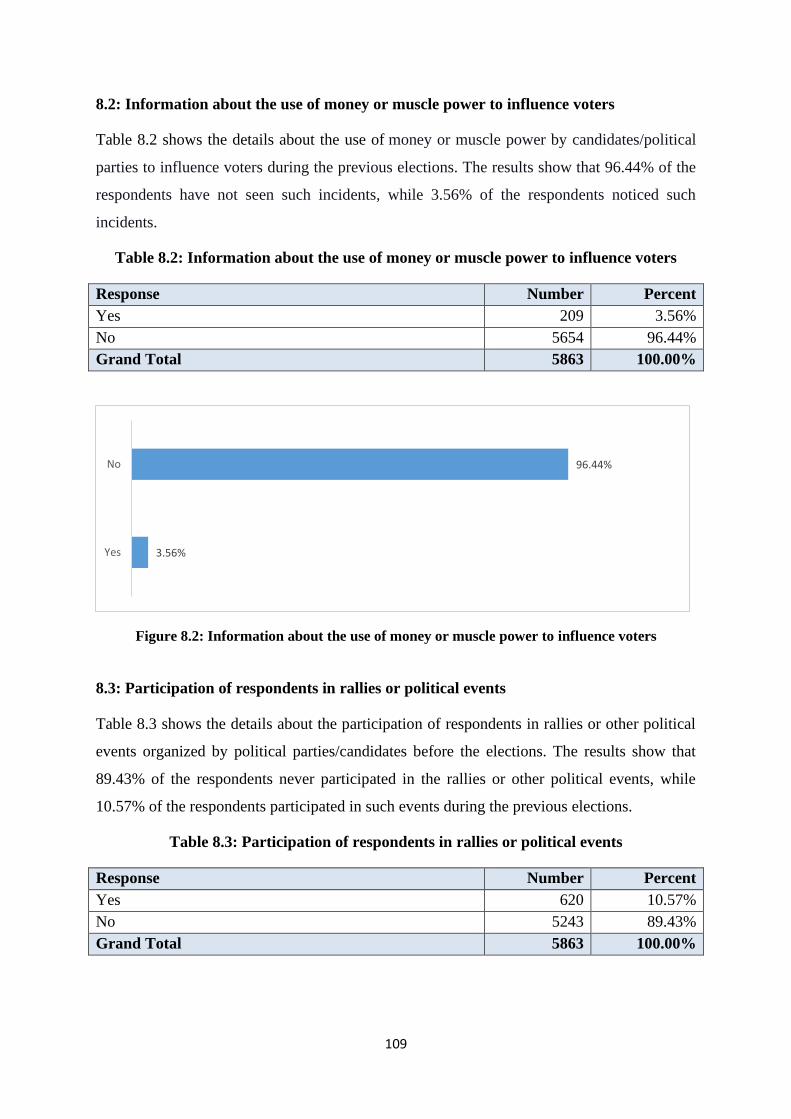
109
8.2: Information about the use of money or muscle power to influence voters
Table 8.2 shows the details about the use of money or muscle power by candidates/political
parties to influence voters during the previous elections. The results show that 96.44% of the
respondents have not seen such incidents, while 3.56% of the respondents noticed such
incidents.
Table 8.2: Information about the use of money or muscle power to influence voters
Response Number Percent
Yes 209 3.56%
No 5654 96.44%
Grand Total 5863 100.00%
Figure 8.2: Information about the use of money or muscle power to influence voters
8.3: Participation of respondents in rallies or political events
Table 8.3 shows the details about the participation of respondents in rallies or other political
events organized by political parties/candidates before the elections. The results show that
89.43% of the respondents never participated in the rallies or other political events, while
10.57% of the respondents participated in such events during the previous elections.
Table 8.3: Participation of respondents in rallies or political events
Response Number Percent
Yes 620 10.57%
No 5243 89.43%
Grand Total 5863 100.00%
3.56%
96.44%
Yes
No

110
Figure 8.3: Participation of respondents in rallies or political events
8.4: Expenditure incurred to participate in the rallies or political events
Table 8.4 shows the details of whether the respondents or political party bore the expenditure
of respondents to participate in the rallies or political events during the previous elections.
The results show that in 86.45% of the instances, the organizing party has taken care of the
expenditure. However, in 13.55% of the instances, the respondents incurred the expenditure
themselves.
Table 8.4: Expenditure incurred to participate in the rallies or political events
Response Number Percent
Own expense 84 13.55%
Organizing party 536 86.45%
Grand Total 620 100.00%
Figure 8.4: Expenditure incurred to participate in the rallies or political events
8.5: Types of inducements used to lure respondents during the previous elections
Table 8.5 shows the details about the various types of inducements used to lure respondents
during the previous elections. Majority of the respondents could recall the distribution of food
packets, followed by distribution of coupons for free Diesel, Petrol, LPG, Kerosene,
distribution of liquor, distribution of cash for construction of toilets, hand pumps and buying
10.57%
89.43%
Yes
No
13.55%
86.45%
Own expense
Organizing party

111
of mobile phones and laptops, distribution of cash among women through self-help groups,
funding of local club to organize cricket/football matches, distribution of Purse, Bangles,
Vanity Case among women, and distribution of TV, Radio, Projector, etc. for small groups/
communities/schools.
Table 8.5: Types of inducements used to lure respondents during the previous elections
Response (N=5863) Number Percent
Distributing cash among women through self-help groups 142 2.42%
Funding of local club to organize cricket / football
matches 84 1.43%
Distributing TV, Radio, Projector etc. for small groups/
communities/schools 19 0.32%
Distributing Purse, Bangles, Vanity Case among women 71 1.21%
Distributing liquor 190 3.24%
Distributing food packets 746 12.72%
Distributing coupons for free Diesel, Petrol, LPG,
Kerosene 219 3.74%
Distributing cash for construction of toilets, hand pumps
and buying of mobile phones and laptops 183 3.12%
Figure 8.5: Types of inducements used to lure respondents during the previous elections
Conclusion
Cases to lure the voters by giving certain types of inducements or offers, by the use of
money, or muscle power are negligible. Majority of the participants do not prefer to attend
rallies or events organized by the political parties.
0.32%
1.21%
1.43%
2.42%
3.12%
3.24%
3.74%
12.72%
Distributing TV, Radio, Projector etc. for small groups/communities/schools
Distributing Purse, Bangles, Vanity Case among women
Funding of local club to organize cricket / footballmatches
Distributing cash among women through self-help groups
Distributing cash for construction of toilets, hand pumpsand buying of mobile phones and laptops
Distributing liquor
Distributing coupons for free Diesel, Petrol, LPG,Kerosene
Distributing food packets

112
CHAPTER- 9
CONCLUSIONS AND RECOMMENDATIONS
This chapter provides overall conclusions and recommendations based on the findings of the
survey. The main objectives of the study entitled, “Conduction of Baseline Survey of Citizens
in Bihar for Assembly Election – 2020” includes assessing the voters’ awareness about
enrolment procedure, eligibility, and EPIC, identifying key factors responsible for the
participation of voters in the elections, understanding the awareness and attitude of the voters
regarding assembly election, identifying the exposure of SVEEP interventions to the voters,
analysing the challenges faced by persons with disabilities (PwDs) during registration and
voting, and assessing the use of inducements on the voters during elections.
The outcome of the survey helps in understanding the current situation before the assembly
election. The perception, awareness, information, and understanding of the voters in Bihar
will help the Election Commission of India to design effective campaigns and take policy
measures that will strengthen the bond between voter and Election Commission of India.
Understanding the knowledge, attitude, and reasons for voting or not voting in the election
helps to design the targeted behavioural change campaigns. The main aim of such campaigns
and policy interventions is to increase voters’ participation in elections, improving the
awareness and knowledge of voters, and making the SVEEP interventions effective. The
outcome of the survey will also help the Election Commission of India to undertake structural
measures to improve the efficiency and effectiveness of the election process.
Please find below the important conclusions that came out of the current study.
Socio-Economic Demographic Profile
• Educational distribution of the respondents shows that those who are illiterate
(28.11%) constitute the highest share among the total respondents followed by
primary school (22.92%), high school (20.01%), and higher secondary (14.96%)
educated individuals respectively.
• Occupation-wise distribution of respondents had the highest proportion of
Laborer/Cultivator/Agriculture and Allied Activities (36.55%) followed by

113
homemaker (30.89%), own enterprise (11.63%), private service (8.32%), government
service (4.45%), and students (2.71%) respectively.
• Marital status-wise distribution of the respondents shows that the highest proportion
of respondents are married (89.77%) followed by respondents who are not married
(6.69%), and widowed (3.31%) respectively.
• Social group distribution of respondents shows that OBC respondents (50.69%) take a
major share among the total respondents followed by Others (27.63%), SC (19.00%),
and ST (2.68%) respectively.
• The reading habits of the respondents reveal that the respondents who do not read the
newspaper or magazine at all (53.11%) constitute the highest proportion followed by
respondents who read almost every day (30.51%).
• The listening habits of the respondents reveal that the majority of the respondents
(86.25%) do not listen to the radio at all which is followed by the respondents
(6.16%) who listen to the radio almost every week.
• The watching habits of the respondents reveal that the respondents who watch
Television almost every day (67.68%) constitute the highest proportion followed by
respondents who do not watch Television at all (25.28%).
• The internet usage habits of the respondents reveal that the respondents who do not
use the internet at all (49.86%) constitute the highest proportion followed by
respondents who use the internet almost every day (42.71%).
• Respondents prefer to talk to friends/family/relatives (40.7%) to get news on election
and politics. At the aggregate level, Media exposure of the respondents shows that
Television (31.18%) is the major medium in diffusing elected related information
followed by information sharing by newspaper/magazines (23.95%), and mobile
phone (2.51%).
• Due to the COVID-19 pandemic, a number of respondents (3.16%) came back to their
homes in Bihar.
• The information about the enrolment of the respondents who returned back due to
COVID-19 reveals that the majority (87.03%) of them have their names in the
electoral roll. Out of these respondents, a majority (98.14%) of them are enrolled in
Bihar.

114
• The information about the willingness of the respondents who returned back due to
COVID-19 reveals that the majority (98.38) of them wish to vote in the upcoming
assembly elections.
• The information about the willingness of the respondents who were staying at their
home (well before the origin of the COVID-19 pandemic) shows that the majority
(88.13%) of them wish to vote in the upcoming assembly elections.
• Respondents prefer to have sanitizers (91.57%), masks (85.42%), markings on the
ground to maintain social distancing (77.86%), soap and water (65.07%), and thermal
screening (44.91%) at the polling booth on the day of voting.
Voter Registration
Election Commission of India offers online voter registration for Indian citizens who have
attained the age of 18 on the qualifying date (1st of January of the year of revision of electoral
roll). Citizen, can enrol himself/herself as General Voter and fill Form 6 online at National
Voters’ Service Portal. Registered voters should also check their enrolment status. This study
has assessed several aspects related to the voter registration and the conclusions are given
below-
• Out of the 5863 respondents in this study who were registered in the voter list, 98.46
percent possess their voter ID card.
• Approximately 19% respondents who don’t have voter card are not aware about the
process of getting this card and the same number of respondents have specified that
they have lost their card.
• Assessment of the awareness about the “Voter’s List” reveals that 94% (Total 5497)
respondents are aware of “Voter’s List”.
• The assessment of enrollment status of the respondents reveals that 98.73%
respondent’s name have been currently enrolled/ included in the voter’s list
• The assessment of reasons behind non-enrollment discovers that 31.20% did not know
about the process of enrollment.
• Assessment of awareness of enrollment requirement reveals that 63.53% respondents
were informed about the enrollment status by their area’s BLO.
• Assessment of perceived correctness of enrollment shows that about 97.1%
respondents have confirmed that their name and other details have been correctly
enrolled.

115
• A research question was administered in the survey asking each eligible respondent
about if any members in their family who are 18+ years of age and not registered.
About 96% respondents have confirmed that all eligible members have been correctly
enrolled in the voter’s list.
• Similarly, a research question was administered in the survey asking each eligible
respondent reasons behind having member(s) in their family who are 18+ years of age
and not registered. About 36% respondents have confirmed that the lengthy process
forbids them from being enrolled in the voter’s list.
• The Assessment of participant’s knowledge about the enrollment center’s location
reveals that about 80% respondents have confirmed that they contacted the BLO to
get enrolled in the voter’s list.
• The Assessment of participant’s knowledge about the EPIC (Election Card) in the
study reveals that more than 98% of respondents of this study are aware of the
EPIC/Election card.
• The assessment of the availability and custody of the EPIC (Election Card) with
participants highlights that about 96% respondents have confirmed that they have
their EPIC (Election card) safe with them
• This study has also assessed of the issuing date of the EPIC (Election Card) of
participants which shows that about 39% respondents have confirmed that they got
their EPIC (Election card) before last assembly elections
• A research question was administered in the study survey asking each eligible
respondent about in how many days they got the custody of their EPIC (Election card)
which reveals that about 21% respondents have confirmed that they got their EPIC
(Election card) within six months.
• About 61% respondents have confirmed that they got their EPIC (Election card)
easily without any major problem
• About 53% respondents have confirmed that the procedure is long, while 25% of
respondents have specified that the concerning officials are unfriendly
• The Assessment of substitutes of the EPIC (Election Card) – alternative IDs reveals
that about 44% respondents have given ‘no response’ while 27.8% have specified
‘Voter’s slip’ as an alternative
116
• The Assessment of the participant’s awareness about local person appointed for
assisting in enrolment reveals that about 86% respondents have confirmed that they
know that Govt. /Election office has appointed local persons to help for enrolment.
• About 91.56% respondents have clearly confirmed that they know that Govt./Election
office has appointed “Booth Level Officer” to help for enrolment
• In the current study, a research question was administered for assessment of the
respondents’ awareness about the Polling booth’s location which has confirmed that
about 99% respondents have specified that they know their polling booth’s location
Knowledge, Attitude, Behaviour, Belief, and Practices
This study assesses existing awareness level, belief, perception and ongoing practices of
voters regarding their readiness of participation of registered voters in previous elections of
Bihar. It is conducted to help understand the knowledge, attitude, practices, behaviour and
faith of voters of the state in existing system across the demographic features. Following
conclusions can be drawn from the study.
• Assessment of Voting in the last Assembly Elections reveals that 91.86% reported
that they had cast their vote during the last Assembly elections
• The study surveyed each eligible respondent about their voting participation in the last
Parliamentary Elections. Out of the 5,386 survey respondents, more than 92%reported
that they had cast their vote during the last Parliamentary Elections
• When asked about the reasons for not casting their vote in the last general elections
from respondents who didn’t vote in last general elections, most such respondents
(35%) reported that they were not in their constituency on the day of voting. This
result corresponds to high out-migration of people for seasonal employment to other
regions in India.
• An assessment of different reasons behind voter participation in previous elections
reveals that the main reason was “awareness of the voters about their voting rights”
(81.15% respondents have specified this reason). Further, about 31% respondents
reported that they participated in the voting because the “candidate was good”. Also,
“receiving the voter slip before the polling day” is also an important reason as more
than 56% voters have reported this factor behind their participation. Sympathizing
with a particular political party (11%) and enabling environment (free and fair)

117
created by Election Commission of India (31%) were also significant reasons for
voters’ participation in previous elections
• Majority of the survey respondents (93.37%) said that their overall experience was
convenient on the day of voting. About 2.76% people said that they had to face some
inconvenience while voting.
• Candidate’s honesty and experience stands the most prominent reason for selecting a
candidate as more than 54% respondents have reported these factors.
• 18.49% respondents have reported that one or more eligible voter in their family have
not voted in the last elections.
• When the assessment of the reasons for not voting by eligible voters in the
respondent’s family was done, we identified multiple reasons. More than 54%
respondents reported that the voters in their family were not in town. Further, about
10% respondents reported that the eligible voters were not having electoral photo ID
card while 23% reported that their names were not listed on the electoral roll
• A research question was administered in the survey asking each eligible respondent
about the factors influencing their voting preference and it is discovered that about
44.48% respondents have confirmed that their voting preference is based on the
candidate.
• This study has assessed multiple factors that influence high voter turnout. In response
to question related to factors influencing high voter turnout in respondent’s area, 58%
respondents reported that the good candidate was the main reason for this. Further,
30% reported that because of a particular party wave there was high voter turnout in
their area. Dissatisfaction from government or candidate was not very significant
reason as only a few respondents reported this factor.
• Majority of the survey respondents (78.48%) said that their overall experience was
good on the day of voting.
• When asked about security arrangements during elections, 86% respondents reported
that the arrangements were adequate.
• When asked about deployment of police force during elections, more than 80%
respondents reported that the arrangements were adequate.
• A research question was administered in the study survey asking each eligible
respondent about the behavior of the polling staff at the polling booth during last

118
election. About 78.94% respondents have confirmed that the behavior of the polling
staff at the polling booth during elections was good.
• About 78.41% respondents have confirmed that they did not face any problem at the
polling booth during elections
• When asked about difficulties faced by people on the day of voting, 72% respondents
said that they experienced long queues at the polling booths while 26.51% people
indicated the lack of arrangements for drinking water, toilets and ramp for differently
abled voters. 15.47% respondents during the survey also pointed the absence of
separate queue for senior citizens
Voter awareness and attitudes
• It is observed that around 87.02% of the respondents are aware of the minimum age of
registration to be a voter.
• The awareness about the qualifying date for registration in the electoral list is very
low. The majority of the respondents (60.69%) do not know the qualifying date for
registration followed by respondents who said 1st January (20.88%) and 18th birthday
(18.44%).
• The awareness about the National Voters’ Day is very low. The majority of the
respondents (90.09%) do not know when the National Voters’ Day is celebrated. Only
6.07% of the sampled respondents are rightly aware of the National Voters’ Day as
January 25th.
• Though the NOTA option is present for the past few years, the significant proportion
of the respondents (42.44%) are not aware of such an option. However, a majority of
the respondents (44.53%) are aware of the NOTA option.
• The majority of the respondents (52.98%) are not aware of the presence of Braille
provision on EVMs followed by the respondents (25.19%) who said that they saw it
when they voted.
• The majority of the respondents (51.92%) are aware of the VVPAT followed by the
respondents (32.03%) who said that they are unaware of VVPAT.
• Respondents have a positive opinion for the statements, “Every vote counts”,
“Elections are conducted freely and fairly in India”, “Voting should be made
compulsory”, and “EVMs provide accurate results”.

119
• Respondents have a mixed opinion for the statement, “The influence of money and
muscle is increasing in elections”.
• Respondents have a negative opinion for the statements, “Women should consult male
members or elders before voting in elections”, “Voting is cumbersome chore”, and “I
do not intend to vote in the upcoming elections”.
• The awareness about the priority access of the elderly and electors with disabilities
during voting is low. The majority of the respondents (58.25%) are unaware of the
priority access of the elderly and electors with disabilities during voting.
• The awareness about the availability of special volunteers to assist the elderly and
electors with disabilities during voting is low. A majority of the respondents (69.50%)
are unaware of the availability of special volunteers to assist the elderly and electors
with disabilities during voting.
• The awareness about the Assured Minimum Facilities for voters at the polling stations
is low. A majority of the respondents (66.38%) are unaware of the Assured Minimum
Facilities for voters at the polling stations.
• The awareness about the Postal Ballot facility for voters above 80 years is extremely
low. A majority of the respondents (92.68%) are unaware of the Postal Ballot facility
for voters above 80 years.
• The awareness about the Postal Ballot facility for voters who are in the essential
services is extremely low. A majority of the respondents (86.68%) are unaware of the
Postal Ballot facility for voters who are in the essential services.
Exposure to SVEEP interventions
• The majority of the respondents (67.20%) could recall the campaign run by the
Election Commission of India while 25.02% percent of the respondents said that they
do not recall any campaigns.
• The majority of the respondents (50.84%) receive information about the elections
through TV advertisements and programs followed by activities such as Rallies,
Prabhat Pheris, and loudspeaker announcements (37.39%), Posters, hoardings and
publicity materials (36.67%), and newspapers or magazines (22.46%) respectively.
• The traditional way of dissemination of election-related information such as radio,
advertisement in cinemas, Cultural/entertainment programs, Government offices
120
circular, NGO and Civil society Group, SMS, Pledge letters, Sankalp Patras through
school students in the family are not much used by the respondents.
• The majority of the respondents (54.03%) received the information or the message
“Voting is my right and duty”, followed by “Date of voting and schedules” by 47.55%
of the respondents, and “Cast vote as per choice and without taking any inducement”
by 34.68% of the respondents.
• The information or messages about, “Voter helpline 1950 or Voter Helpline App”,
and “cVIGIL App related” are not recalled by the voters.
• The majority of the respondents recalled the taglines, “Desh ka Mahatyohar” and “No
Voter to be Left Behind/Koi Matdata Na chootey”. However, 82.81% of the
respondents do not recall the tagline, “≠ Go Register, ≠ Go verify or ≠ Go Vote”.
• A significant number of respondents identified or recalled the celebrities who gave
messages related to elections. M. S. Dhoni (33.26%) seems to be the most appealing/
motivating followed by Aamir Khan (20.50%), Saina Nehwal (10.93%), Mary Kom
(7.78%), Pankaj Tripathi (2.83%), and Santosh Yadav (1.69%).
• The majority of the respondents (95.41%) have not used the Election
Commission/Chief Electoral Officer website. Only 1.31% of the respondents have
used the official website. Respondents used the website to search their name and other
details on the Electoral Roll, register/ make modifications online, download
registration forms, and to know polling station details. Respondents recall having
satisfactory experience using the website.
• The majority of the respondents (99.68%) have not used Voter Helpline No. 1950 or
Voter Helpline App. A very small number of respondents used them to know about
the registration or voting process, to verify the name on the voter list, to know the
polling station, and to register a complaint. Respondents recall having satisfactory
experience using the Voter Helpline No. 1950 or used the Voter Helpline App.
Involvement of Persons with Disabilities (PwDs) in Election
• Majority of the PwDs respondents (76.47%) have not received any material
(publicity/voter edutainment) facilitating their participation during the elections.
• Booth Level Officers have interacted with the majority of the PwDs respondents
(63.53%).

121
• PwDs respondents have faced no difficulty during the process of registration. The
majority of the PwDs respondents found the process to be easy (49.41%) or neither
easy nor difficult (43.53%). Only 5.88% of the PwDs respondents found the process
to be difficult.
• PwDs respondents have faced few difficulties during the process of voting. The
majority of the PwDs respondents faced the lack of facilities including drinking water,
toilet, and ramp, followed by the presence of long queue at the polling booth, no
separate queue for senior citizens, difficulty in getting voter slip, and unavailability of
a wheelchair at the polling booth.
• Awareness of PwDs about the special mobile application (PwD App) is negligible.
The majority of the PwDs respondents (96.47%) are not aware of the availability of
special mobile application (PwD App).
Inducement
• Cases to lure the voters by giving certain types of inducements or offers are
negligible. Around 96% of the respondents have reported that they have not received
any type of inducement in the previous elections.
• Cases to lure the voters by the use of money or muscle power are negligible. Around
96.44% of the respondents have reported that they have not received any money or
threat in the previous elections.
• Information about the participation of respondents in rallies or political events shows
that the majority of the respondents (89.43) do not attend rallies or political events.
Only 10.57% of the respondents attend rallies or political events. Out of which
13.55% of the respondents incurred their expenses and for the remaining 86.45% of
the respondents the organizing party incurred the expenses.
Recommendations
• It is recommended that the ECI should lay greater thrust on its efforts to communicate
with the electors. Certain key parameters may be developed to ensure that the
audience understand what the Commission wishes to communicate.
• In view of the minimal use of the digital platforms developed for the electors by ECI,
awareness drives may be intensified for enhanced use of the NVSP portal, cVIGIL
app, PwD app, and other related apps.

122
• The ECI may step-up its efforts to train electors on the use of EVM machine.
• Targeted awareness campaigns to increase the participation of female voters in rural
areas is required. Areas where voting percentage among women is low should be
identified and a special drive may be taken up to educate the voters. Presence of
women staff at such polling booths is expected to increase the participation of female
voters.
• Updating of the electoral roll is a continuous process and the Election Commission of
India does it regularly. Strengthening of such an effort is required. The research team
also recommends simplification of the process of addition, modification, or deletion
of names and other details in the electoral roll. Better coordination among various
block and district-level functionaries such as BLOs, Deputy Election Officer and the
agency responsible for management of the digital platform is the key.
• Poor and illiteratemigrants face enormous difficulty in getting enrolled as they are not
able to provide adequate documents. The ECI may contemplate running special drive
for such people to add their names in the voter list of their current location.
• It is suggested to run special awareness campaigns at the polling booths where the
voters boycotted the elections. If it deems fit, the Commission may extend its efforts
in understanding the reasons of boycott and in taking up such issues with the
provincial government for enhanced voter turnout in future.
• Multi-lingual campaigns are considered to be more effective way of communication.
ECI should intensify such efforts. While preparing elector awareness materials for
posters, hoardings or loudspeaker announcements, it should be kept in mind that the
information reaches the voter in his/her native language.
• For conduction of elections in COVID-19 pandemic period, provision of soap&
water, face mask, hand sanitizer, thermal screening and markings on the ground to
ensure social distancing is recommended. This apart, sitting arrangements for
pregnant ladies and elderly voters, and presence of ramp, wheelchair, etc. for
differently-abled voters shall create positive environment for higher voter turnout.
• The ECI may augment its efforts in organizing special campaigns in schools and
colleges to educate young minds about their rights and duties as a voter. National
Voters’ Day may be celebrated at theeducational institutionsand officials from
Election Department may visit there to educate the students about the electoral

123
process. These programs shall help in spreading awareness and reducing
misconceptions about the electoral process in the minds of future voters.
• NGOs and groups of motivated students can participate along with the government
officials to raise awareness about the election process. The ECI may intensify such
awareness efforts. Special drive may be conducted to identify differently-abled
electors and inform them about the options such as Braille on EVMs, usage of Sign
Language and availability of ramp and wheelchair at the polling booths.
• In the entire gamut of election, role of BLO has been identified to be very important.
His/her active role in the area is reflected in enhanced voter turnout at the polling
booths. It is expected that he/she:
• knows the electors currently enrolled at the polling booth
• visits the households and educate them about the electoral process
• actively helps in updating the voter list
• helps the PwD candidates in registration and voting
• ensures that voters are aware about the location of their polling booth
• distributes voter slips well before the election day
• With the ever growing stress on use of digital platforms for discharging duties and
responsibilities of public governance and with the widening of internet and mobile
phone user base of the State, it is envisioned to create a new digital platform with
the following enabling facilities:
• Application for a new voter card
• Application for the modifications required [if any] in the voter card
• Uploading of the scanned copies of the documents for verification
• Getting information/update about the application status in native language
by SMS/e-mail
• Providing feedback on the awareness programs being run by ECI to help
the Commissionunderstand whether the campaign is effective or not
For content and information uploading on the portal, dynamic controls may be
given to the Election Department officials as per their designation. In addition,
dashboardscan be created to help officials to understand the current status of the
new applications, modifications or deletions in the electoral roll, etc.It is also
suggested that the BLO can act as the designated person to do entry on the portal
in case the voter is not capable of using digital platform. BLOsmay be trained

124
specifically to use the platform. The Election Department may conduct special
drives to create awareness about this new platform.
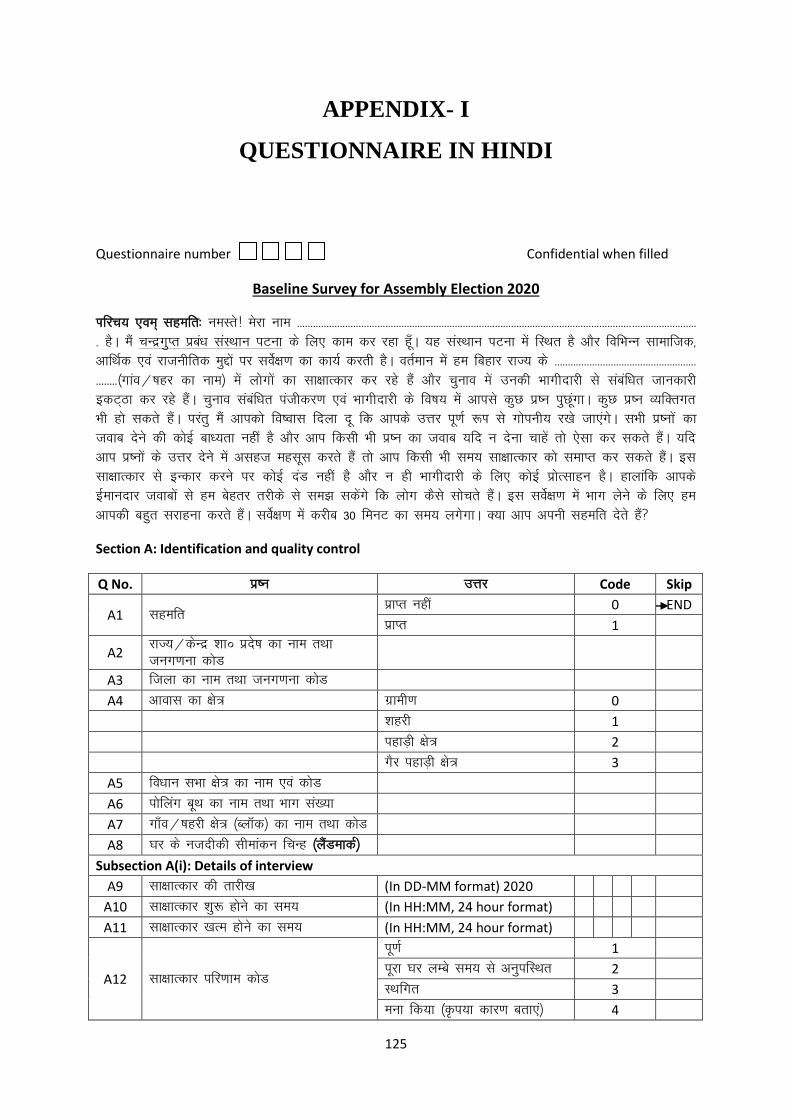
125
APPENDIX- I
QUESTIONNAIRE IN HINDI
Questionnaire number Confidential when filled
Baseline Survey for Assembly Election 2020
Ikfjp; ,oe~ lgefr% ueLrs! esjk uke ----------------------------------------------------------------------------------------------------------------------------- ------------------------
- gSA eSa pUnzxqIr izca/k laLFkku iVuk ds fy, dke dj jgk gw¡A ;g laLFkku iVuk esa fLFkr gS vkSj fofHkUUk lkekftd]
vkfFkZd ,oa jktuhfrd eqíksa ij losZ{k.k dk dk;Z djrh gSA orZeku esa ge fcgkj jkT; ds -----------------------------------------------------
--------¼xkao@’kgj dk uke½ esa yksxksa dk lk{kkRdkj dj jgs gSa vkSj pquko es a mudh Hkkxhnkjh ls lacaf/kr tkudkjh
bdV~Bk dj jgs gSaA pquko lacaf/kr iathdj.k ,oa Hkkxhnkjh ds fo"k; esa vkils dqN iz’u iqNwaxkA dqN iz’u O;fDrxr
Hkh gks ldrs gSaA ijarq eSa vkidks fo’okl fnyk nw fd vkids mÙkj iw.kZ :Ik ls xksiuh; j[ks tk,axsA lHkh iz’uk sa dk
tokc nsus dh dksbZ ck/;rk ugha gS vkSj vki fdlh Hkh iz’u dk tokc ;fn u nsuk pkgsa rks ,slk dj ldrs gSaA ;fn
vki iz’uksa ds mÙkj nsus esa vlgt eglwl djrs gSa rks vki fdlh Hkh le; lk{kkRdkj dks lekIr dj ldrs gSaA bl
lk{kkRdkj ls bUdkj djus ij dksbZ naM ugha gS vkSj u gh Hkkxhnkjh ds fy, dksbZ izksRlkgu gSA gkykafd vkids
bZekunkj tokcksa ls ge csgrj rjhds ls le> ldsaxs fd yksx dSls lksprs gSaA bl losZ{k.k esa Hkkx ysus ds fy, ge
vkidh cgqr ljkguk djrs gSaA losZ{k.k esa djhc 30 feuV dk le; yxsxkA D;k vki viuh lgefr nsrs gSa\
Section A: Identification and quality control
Q No. iz’u mÙkj Code Skip
A1 lgefr izkIr ugha 0 END
izkIr 1
A2 jkT;@dsUnz 'kkŒ izns’k dk uke rFkk
tux.kuk dksM
A3 ftyk dk uke rFkk tux.kuk dksM
A4 vkokl dk {ks= xzkeh.k 0 'kgjh 1
igkM+h {ks= 2
xSj igkM+h {ks= 3
A5 fo/kku lHkk {ks= dk uke ,oa dksM
A6 iksfyax cwFk dk uke rFkk Hkkx la[;k
A7 xk¡o@’kgjh {ks= ¼CykWd½ dk uke rFkk dksM
A8 ?kj ds utnhdh lhekadu fpUg ¼ySaMekdZ½
Subsection A(i): Details of interview
A9 lk{kkRdkj dh rkjh[k (In DD-MM format) 2020
A10 lk{kkRdkj 'kq: gksus dk le; (In HH:MM, 24 hour format)
A11 lk{kkRdkj [kRe gksus dk le; (In HH:MM, 24 hour format)
A12 lk{kkRdkj ifj.kke dksM
iw.kZ 1
iwjk ?kj yEcs le; ls vuqifLFkr 2
LFkfxr 3
euk fd;k ¼Ñi;k dkj.k crk,a½ 4

126
?kj@vkokl [kkyh 5
?kj@vkokl dk iÙkk ugha pyk 6
A13 losZ djusokys dk uke rFkk igpku dksM
A14 i;Zos{kd dk uke rFkk igpku dksM
Subsection A(ii): Quality control
A15 fQYM % fiNyh tk¡p ¼Back check½ ugha 0
gk¡ 1
A16 fQYM % tk¡p ¼Scrutiny½ ugha 0
gk¡ 1
A17 MkVk baVªh % nksgjh izfof"V ¼Double entry½ ugha 0
gk¡ 1
Section B: Selection of respondent
Q No. Question Response Code
B1 vkidks ysdj bl ?kj esa lkekU;r% fdrus
yksx fuokl djrs gSa\
B2 fdrus yksx 18 lky ls vf/kd mez ds gS\
¼1 tuojh 2020 rd½
Subsection B(i): Household (HH) roster
uksV% ?kj ds eqf[k;k ls izkjaHk djrs gq, 18 o"kZ ls cM+s oSls lHkh O;fDr;ksa dh lwph cuk;sa tks fd leku NRk~ ,oe~
leku pwYgk lk>k djrs gSaA Household (HH) Roster (B3) esa dh x;h izfof"V;ksa dh la[;k B2 ds leku gksuh
pkfg,A
B3 B4 B5 B6 B7 B8 B9 B10 B11 Øe
laΠUkke ?kj ds
eqf[k;k
ds lkFk
laca/k
fyax mez
¼o"kZ esa½ fodykax fiNys
lky esa
iyk;u
fiNys
yksdlHkk
pquko esa
oksV fn;k
fiNys
fo/kku
lHkk esa
oksV fn;k 1 01
2
3
4
5
6
7
8
CODE LIST FOR HH ROSTER:

127
B5 Relationship with HH head: Head =01; Wife/husband=02; Son/Daughter=03;
Daughter-in-law/Son-in law=04; Grandchild=05; Father/Mother=06;
Brother/Sister=07; Father-in-law/Mother-in-law=08; Nephew/Niece=09;
Brother-in-law/Sister-in- law=10; other relatives=11; Servant/Others=12
B6 Sex: Male=1; Female=2; Third gender =3
B8 Disabled: No=0; Yes (in seeing)=1; Yes(in speech)2; Yes(in hearing)=3;Yes(in movement)=4;
B9 Migrated in last 1 year: No=0; Yes=1
B10 & B11Voted in last Lok Sabha/Assembly election: No=0; Yes=1
Subsection B (ii): Kish grid
iz'ukoyh ds vafre vad ?kj esa ;ksX; mÙkjnkrkvksa dh dqy la[;k
1 2 3 4 5 6 7 8
0 1 2 2 4 3 6 5 4
1 1 1 3 1 4 1 6 5
2 1 2 1 2 5 2 7 6
3 1 1 2 3 1 3 1 7
4 1 2 3 4 2 4 2 8
5 1 1 1 1 3 5 3 1
6 1 2 2 2 4 6 4 2
7 1 2 1 4 1 2 6 4
8 1 1 2 1 2 3 7 5
9 1 1 2 1 2 3 7 5
INSTRUCTIONS TO SELECT RESPONDENTS FROM KISH GRID: Look at the last of the questionnaire
number on the cover page. This is the row number you should circle. Check the total number of
eligible respondents from the household roster or B2. This is the column number you should circle.
Find the box where the circled row and the circled column meet and circle the number that appears
in the box. Record this in B12. This is the selected respondent to whom you should administer the
questionnaire. For example, if the household questionnaire number is ‘3716’, go to row 6 and circle
the row number (‘6’). If there are three people eligible for an interview in the household (it does not
matter if they are available for interview or not), go to column 3 and circle the column number (‘3’).
Draw lines from row 6 and column 3 and find the box where the two meet, and circle the number in
it (‘2’). This means you have to select the second eligible person.
Q No. Question Response Code Skip
B12 fd'k xzhM ls pquh x;h la[;k fd’k xzhM ls dksM dh izfof"V
B13 pqus x;s mÙkjnkrk dh Øe la[;k ?kj ds jksLVj ls dksM@B3 dh izfof"V
Section C: Voter registration

128
Q.
No. Question Response Code
C1 D;k vkids ikl ernkrk dkMZ gS\
¼;fn ernkrk ds :Ik esa iathÑr gS½
gk¡ 1
Ukgha 2
C2 ;fn ugha] rks D;ksa\
eq>s irk ugha bl dkMZ dks dSls izkIr d:a 1
eq>ls [kks x;k 2
fuokZpu foHkkx ls [kks x;k 3
QksVks f[kapokus dk le; ugha fey ldk 4
tc dkMZ cu jgk Fkk rks tkudkjh ugha feyh 5
le; dh deh 6
cksf>y izfØ;k 7
ernkrk dkMZ ikus ds fy, bPNqd ugha gSa 8
C3 D;k vki ^ernkrk lwph* ds ckjs esa tkurs gSa\
gk¡ 1
Ukgha 2
dg ugha ldrs@ugha tkurs 3
C4
;fn Q-3 ds fy, gk¡] rks D;k vkidk uke
ernkrk lwph esa ukekafdr@’kkfey fd;k x;k gS\
gk¡ 1
Ukgha 2
dg ugha ldrs@ugha tkurs 3
C5 ;fn Q-3 ds fy, ugha] rks D;k dkj.k Fkk\
bldh tkudkjh ugha Fkh 1
ugha crk;k x;k Fkk 2
ugha dg ldrs@ugha tkurs 3
:fp ugha Fkh 4
C6 ;fn Q-4 ds fy, gk¡] rks vkidks dSls irk pyk
fd vkids uke dk ukekadu gksuk gS\
nksLrksa@fj’rsnkjksa 1
lekpkj i= 2
LFkkuh; leqnk; ds usrk 3
ch-,y-vks- 4
Vsyhfotu 5
jsfM;ks 6
iksLVj@gksfMax vkfn 7
dg ugha ldrs 8
C7 ;fn Q-4 ds fy, gk¡] rks D;k vkidk uke
ernkrk lwph esa lgh fy[kk x;k Fkk\
gk¡ 1
Ukgha 2
dg ugha ldrs@ugha tkurs 3
C8 D;k vkids ifjokj esa ,sls lnL; gSa tks 18$ o"kZ
ds gSa vkSj iathÑr ugha gSa\
gk¡ 1
Ukgha 2
C9 ;fn Q-8 ds fy, gk¡]rks mudk uke ernkrk lwph
esa ugha gksus ds dkj.k D;k gS\
tkx:drk dh deh 1
fnypLih dh deh 2
oS/k nLrkostkas dh deh 3
yach ¼dfBu½ izfØ;k 4
?kj ls nwj ij fcgkj esa jgrs gSa 5
fcgkj ds ckgj jgrs gSa 6
C10 D;k vki tkurs gSa fd ernkrk ds :Ik esa dgka
iathÑr gksuk gS\
ch-,y-vks- ds ekè;e ls 1
iapk;r dk;kZy; 2

129
ch-Mh-;ks- 3
CykWd dk;kZy; 4
dysDVj dk;kZy; 5
ernkrk lgk;rk dsUnz@ernkrk dsUnz@lh,llh 6
C11 D;k vki EPIC ¼bysD’ku dkMZ½ ls voxr gSa\
gk¡ 1
ugha 2
dg ugha ldrs 3
C12 D;k vkids ikl vkidk EPIC ¼bysD’ku dkMZ½
gS\
gk¡ 1
ugha 2
C13 ;fn Q-12 ds fy, gk¡] rks vkidks EPIC dc
cuk;k x;k Fkk\
fiNys fo/kkulHkk pquko ls igys 1
fiNys fo/kkulHkk pquko ds ckn 2
fiNys yksdlHkk pquko ds ckn 3
;kn ugha 4
C14 EPIC dks izkIr djus esa vkidks fdrus fnu yxsa?
15 fnuksa ds Hkhrj 1
1 eghus ds Hkhrj 2
Ng eghus ds Hkhrj 3
irk ugha 4
C15 D;k vkids fy, EPIC ysuk vklku Fkk\
gk¡ 1
ugha 2
dg ugha ldrs@;kn ugha 3
C16 ;fn Q-15ds fy, ugha] rks EPIC izkIr djrs
le; vkius D;k eq[; leL;k,a ns[kha\
yach izfØ;k 1
foHkkxh; deZpkjh;ksa dh v:ph 2
lacaf/kr dk;kZy; dh nwjh 3
dg ugha ldrs 4
C17
;fn vkids ikl EPIC ugha gS] rks vkius fiNys
pqukoksa esa ernku ds fy, fdl oSdfZYid vkbZMh
dk mi;ksx fd;k Fkk\
Mªkbfoax ykblsal 1
jk'ku dkMZ 2
cSad [kkrk 3
ernkrk iphZ 4
vU; dksbZ 5
C18
D;k vki tkurs gSa fd ljdkj@pquko dk;kZy; us
ukekadu ds fy, LFkkuh; O;fDr;ksa dks fu;qDr
fd;k gS\
gk¡ 1
ugha 2
C19 ;fn Q-18 ds fy, gk¡ rks mudk inuke D;k gS\
cwFk Lrj ds vf/kdkjh 1
leqnk; usrk 2
pquko ,tsaV 3
dg ugha ldrs@;kn ugha@tkudkjh ugha 4
C20 D;k mUgksaus vkids ?kj@dk;kZy; dk nkSjk fd;k
gS\
gk¡ 1
ugha 2
dg ugha ldrs@;kn ugha 3
C21 D;k vki tkurs gSa fd vkidk iksfyax cwFk dgka
gS\
gk¡ 1
ugha 2
Section D: ELECTIONS – KNOWLEDGE, ATTITUDE, BEHAVIOUR, BELIEF, AND PRACTICES
Q. Question Response Code

130
No.
D1 D;k vkius fiNys fo/kkulHkk pquko esa
ernku fd;k Fkk\
gk¡ 1
ugha 2
D2 D;k vkius 2019 ds lalnh; pquko esa
ernku fd;k Fkk\
gk¡ 1
ugha 2
D3
;fn Q1 vkSj Q2 esa ugha rks D;k
leL;k,a Fkh\
(,d ls vf/kd fodYi fpfUgr fd, tk
ldrs gSa)
esjs ikl oksVj vkbZMh dkMZ ugha Fkk 1
eSa viuk ernku dsUnz dks ugha tkurk Fkk 2
ernku dsUnz nwjh ij Fkk ¼esjs ikl ifjogu dh leL;k
Fkh½
3
yach drkj vkSj esjs ikl le; ugha Fkk 4
jktuhfrd iz.kkyh ¼;k pqukoh yksdra=½ esa dksbZ fo’okl
ughs gS
5
oksV ugha fn;k D;ksafd leqnk;@/kkfeZd usrk us ,slk dgk 6
ifjokj ds eqf[k;k us oksV u nsus dh ckr dgh 7
yksdra= ds j[kj[kko ds fy, ernku vko’;d ugha gS 8
dksbZ vPNk mEehnokj ugha Fkk 9
mEehnokj esjh ilan@leqnk; dk ugha Fkk 10
eSa oksV nsuk ugha pkgrk gw¡ D;ksafd dqN Hkh ugha cnysxk 11
eSa vius fuokZpu {ks= esa ugha Fkk 12
eq>s ernku ds fnu Hkh ernkrk iphZ ugha feyh 13
eSa ernku dsUnz ij tkus ls Mjrk Fkk 14
esjk uke ernkrk lwph esa ugha Fkk 15
vU; fufnZ"V djsa ----------------- 16
D4
;fn Q1 vkSj Q2 esa gk¡]rks D;k
leL;k,a Fkh\
(,d ls vf/kd fodYi fpfUgr fd, tk
ldrs gSa)
eSa ,d jktuhfrd ny ls lgkuqHkwfr j[krk gw¡ 1
/kedh ;k t+cjnLrh ds dkj.k oksV Mkyk 2
ifjokj ds eqf[k;k us ernku djus ds fy, dgk 3
nksLrksa ls izHkkfor gksdj ernku fd;k 4
,d fo’ks"k mEehnokj@ny dks gjkuk pkgrk Fkk 5
;g esjk drZO;@vf/kdkj Fkk 6
pquko vk;ksx }kjk ckj&ckj vihy vkSj foKkiu ds dkj.k 7
pquko vk;ksx }kjk cuk, x, Lora= vkSj fu"i{k pqukoh
okrkZoj.k dks Lk{ke djus ds dkj.k
8
esjk uke ernkrk lwph esa ntZ gks x;k 9
eq>s ernkrk iphZ feyh 10
mEehnokj vPNk Fkk 11
mEehnokj esjh ialn] leqnk; vkSj /keZ dk Fkk 12
mEehnokj eq>ls O;fDrxr :Ik ls feyus vk, 13
iSlk@’kjkc dh is’kd’k dh xbZ Fkh 14
vU; fufnZ"V djsa ----------- 15
D5 fiNys pquko esa ernku ds le; vkidk
dSlk vuqHko Fkk\
lqfo/kktud 1
vlqfo/kktud 2
;kn ugha 3
D6 fiNys pquko ds nkSjku ftl mEehnokj
dks vkius oksV fn;k mUkesaa vkidks D;k
O;fDrxr :Ik ls tkurk gw¡ 1
vuqHko 2

131
ilan Fkk\ bZekunkjh 3
izfrc)rk 4
esjh tkrh@leqnk; ls gS 5
esjh ilan dh ikVhZ ls lacaf/kr gS 6
vU; fufnZ"V djsa -----
D7
ernku djus ;ksX; dksbZ ,sls ifjokj ds
lnL; Hkh gSa ftUgksaus ernku ugha
fd;k\
gk¡ 1
ugha 2
tkudkjh ugha@;kn ugha 3
D8 vxj Q7 esa gk¡] rks laHkkfor dkj.k
fufnZ"V djsa--
muds ikl oksVj vkbZMh dkMZ ugha Fkk 1
os ernku dsUnz dks ugha tkurs Fks 2
ernku dsUnz nwjh ij Fkk ¼muds ikl ifjogu dh leL;k
Fkh½
3
yach drkj vkSj muds ikl le; ugha Fkk 4
jktuhfrd iz.kkyh ¼;k pqukoh yksdra=½ esa dksbZ fo’okl
ughs gS
5
oksV ugha fn;k D;ksafd leqnk; ;k /kkfeZd usrk us euk
fd;k
6
ifjokj ds eqf[k;k us oksV u nsus dh ckr dgh 7
yksdra= ds j[kj[kko ds fy, ernku vko’;d ugha gS 8
dksbZ vPNk mEehnokj ugha Fkk 9
mEehnokj mudh ilan@leqnk; dk ugha Fks 10
og oksV nsuk ugha pkgrs Fks D;ksafd dqN Hkh ugha cnysxk 11
os vius fuokZpu {ks= esa ugha Fks 12
mudks pquko ds fnu Hkh ernkrk iphZ ugha feyk 13
os ernku dsUnz ij tkus ls Mjrs Fks 14
mudk uke ernkrk lwph esa ugha Fkk 15
vU; fufnZ"V djsa ----- 16
D9 lcls izHkko’kkyh dkjd dkSu lk gS tks
vkids ernku dks izHkkfor djrk gS\
ifjokj 1
tkfr 2
/keZ 3
mEehnokj 4
jktuhfrd ny 5
vU; dksbZ 6
D10 mPp ernku izfr’kr dk lcls
egRoir.kZ dkjd D;k gS\
/ku 'kfDr 1
cy 'kfDr 2
/ku rFkk cy 'kfDr 3
vPNk mEehnokj 4
jktuhfrd ny 5
vU; 6
D11 vki fiNys pquko esa vius vuqHko dk
o.kZu dSls djsaxs\
cgqr vPNk 1
vPNk 2
T;knk vPNk ugha 3
[kjkc 4
dg ugha ldrs@ugha tkurs 5
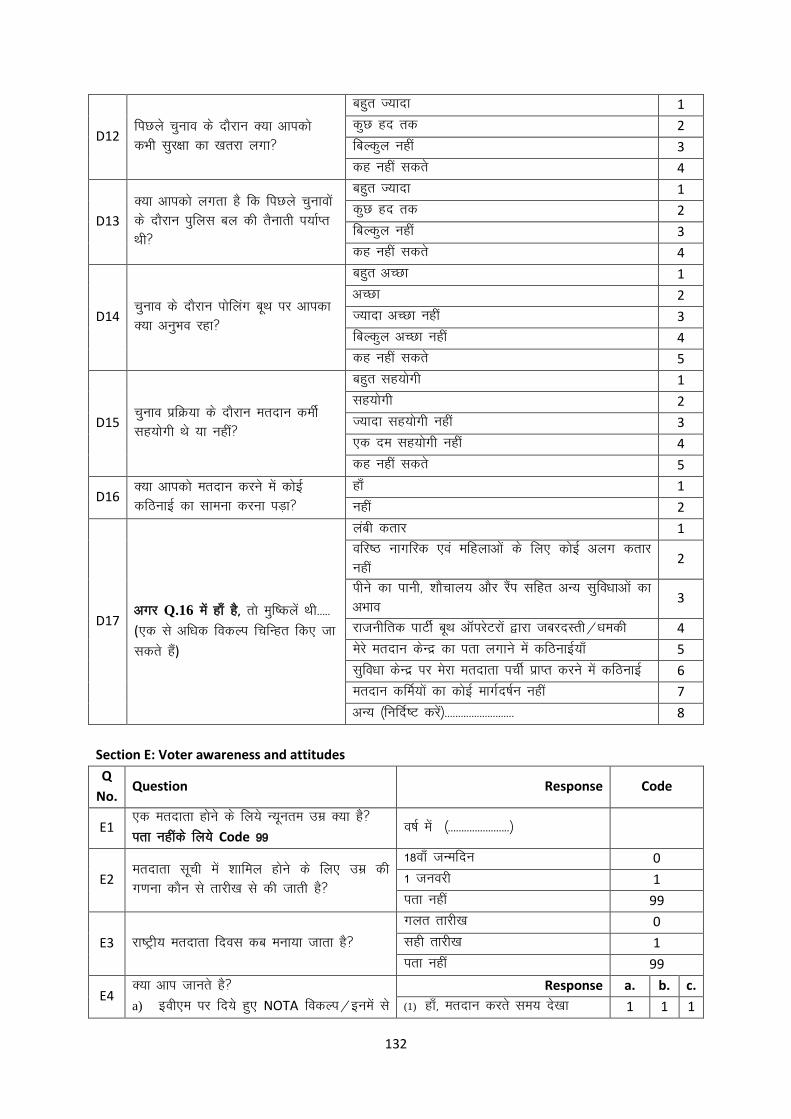
132
D12 fiNys pquko ds nkSjku D;k vkidks
dHkh lqj{kk dk [krjk yxk\
cgqr T;knk 1
dqN gn rd 2
fcYdqy ugha 3
dg ugha ldrs 4
D13
D;k vkidks yxrk gS fd fiNys pqukoksa
ds nkSjku iqfyl cy dh rSukrh i;kZIr
Fkh\
cgqr T;knk 1
dqN gn rd 2
fcYdqy ugha 3
dg ugha ldrs 4
D14 pquko ds nkSjku iksfyax CkwFk ij vkidk
D;k vuqHko jgk\
cgqr vPNk 1
vPNk 2
T;knk vPNk ugha 3
fcYdqy vPNk ugha 4
dg ugha ldrs 5
D15 pquko izfØ;k ds nkSjku ernku dehZ
lg;ksxh Fks ;k ugha\
cgqr lg;ksxh 1
lg;ksxh 2
T;knk lg;ksxh ugha 3
,d ne lg;ksxh ugha 4
dg ugha ldrs 5
D16 D;k vkidks ernku djus esa dksbZ
dfBukbZ dk lkeuk djuk iM+k\
gk¡ 1
ugha 2
D17
vxj Q.16 esa gk¡ gS] rks eqf’dysa Fkh-----
(,d ls vf/kd fodYi fpfUgr fd, tk
ldrs gSa)
yach drkj 1
ofj"B ukxfjd ,oa efgykvksa ds fy, dksbZ vyx drkj
ugha 2
ihus dk ikuh] 'kkSpky; vkSj jSai lfgr vU; lqfo/kkvksa dk
vHkko 3
jktuhfrd ikVhZ cwFk vkWijsVjksa }kjk tcjnLrh@/kedh 4
esjs ernku dsUnz dk irk yxkus esa dfBukbZ;k¡ 5
lqfo/kk dsUnz ij esjk ernkrk iphZ izkIr djus esa dfBukbZ 6
ernku dfeZ;ksa dk dksbZ ekxZn’kZu ugha 7
vU; ¼fufnZ"V djsa½-------------------------- 8
Section E: Voter awareness and attitudes
Q
No. Question Response Code
E1 ,d ernkrk gksus ds fy;s U;wure mez D;k gS\
irk ughads fy;s Code 99 o"kZ esa ¼-----------------------½
E2 ernkrk lwph esa 'kkfey gksus ds fy, mez dh
x.kuk dkSu ls rkjh[k ls dh tkrh gS\
18ok¡ tUefnu 0
1 tuojh 1
irk ugha 99
E3 jk"Vªh; ernkrk fnol dc euk;k tkrk gS\
xyr rkjh[k 0
lgh rkjh[k 1
irk ugha 99
E4 D;k vki tkurs gS\
a) boh,e ij fn;s gq, NOTA fodYi@buesa ls
Response a. b. c.
(1) gk¡] ernku djrs le; ns[kk 1 1 1
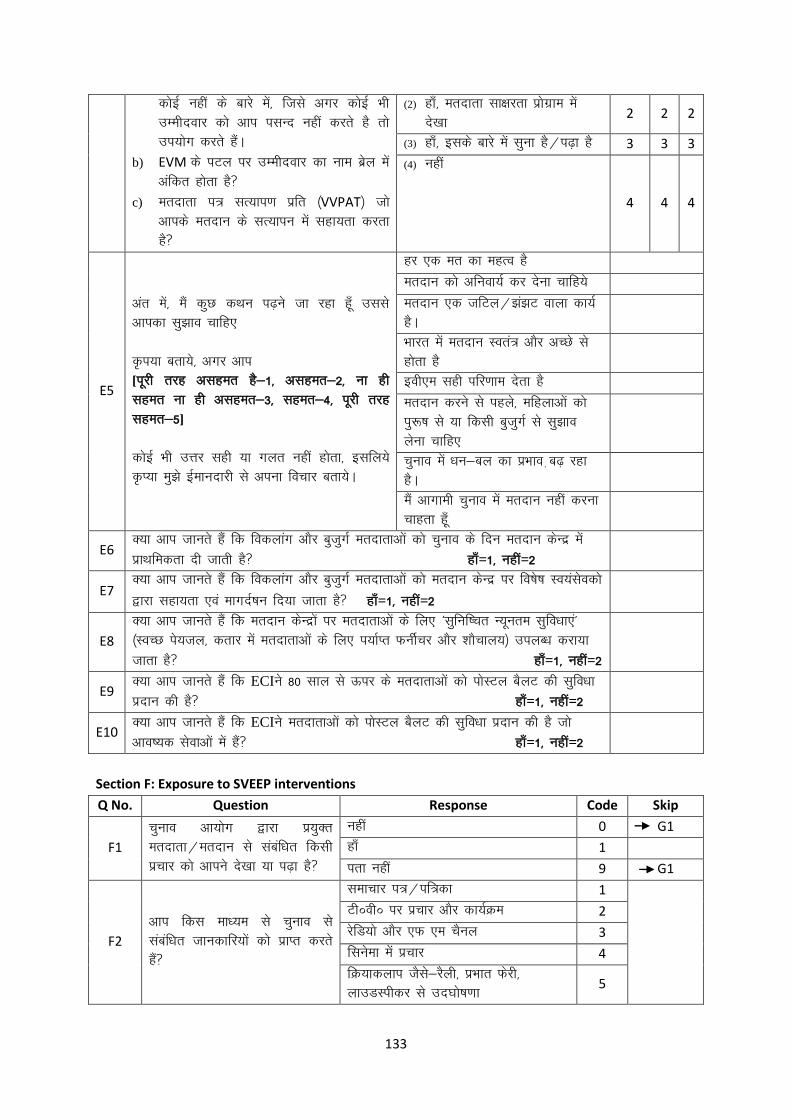
133
dksbZ ugha ds ckjs esa] ftls vxj dksbZ Hkh
mEehnokj dks vki ilUn ugha djrs gS rks
mi;ksx djrs gSaA
b) EVM ds iVy ij mEehnokj dk uke czsy esa
vafdr gksrk gS\
c) ernkrk i= lR;ki.k izfr ¼VVPAT½ tks
vkids ernku ds lR;kiu esa lgk;rk djrk
gS\
(2) gk¡] ernkrk lk{kjrk izksxzke esa
ns[kk 2 2 2
(3) gk¡] blds ckjs eas lquk gS@i<+k gS 3 3 3
(4) ugha
4 4 4
E5
var esa] eSa dqN dFku i<+us tk jgk gw¡ mlls
vkidk lq>ko pkfg,
Ñi;k crk;s] vxj vki
[iwjh rjg vlger gS&1] vlger&2] uk gh
lger uk gh vlger&3] lger&4] iwjh rjg
lger&5]
dksbZ Hkh mÙkj lgh ;k xyr ugha gksrk] blfy;s
ÑI;k eq>s bZekunkjh ls viuk fopkj crk;sA
gj ,d er dk egRo gS
ernku dks vfuok;Z dj nsuk pkfg;s
ernku ,d tfVy@>a>V okyk dk;Z
gSA
Hkkjr esa ernku Lora= vkSj vPNs ls
gksrk gS
boh,e lgh ifj.kke nsrk gS
ernku djus ls igys] efgykvksa dks
iq:"k ls ;k fdlh cqtqxZ ls lq>ko
ysuk pkfg,
pquko esa /ku&cy dk izHkko +c<+ jgk
gSA
eSa vkxkeh pquko esa ernku ugha djuk
pkgrk gw¡
E6 D;k vki tkurs gSa fd fodykax vkSj cqtqxZ ernkrkvksa dks pquko ds fnu ernku dsUnz esa
izkFkfedrk nh tkrh gS\ gk¡=1] ugha=2
E7 D;k vki tkurs gSa fd fodykax vkSj cqtqxZ ernkrkvksa dks ernku dsUnz ij fo’ks"k Lo;alsodks
}kjk lgk;rk ,oa ekxnZ’ku fn;k tkrk gS\ gk¡=1] ugha=2
E8
D;k vki tkurs gSa fd ernku dsUnzksa ij ernkrkvksa ds fy, ^lqfuf’pr U;wure lqfo/kk,a*
¼LoPN is;ty] drkj esa ernkrkvksa ds fy, i;kZIr QuhZpj vkSj 'kkSpky;½ miyC/k djk;k
tkrk gS\ gk¡=1] ugha=2
E9 D;k vki tkurs gSa fd ECIus 80 lky ls Åij ds ernkrkvksa dks iksLVy cSyV dh lqfo/kk
iznku dh gS\ gk¡=1] ugha=2
E10 D;k vki tkurs gSa fd ECIus ernkrkvksa dks iksLVy cSyV dh lqfo/kk iznku dh gS tks
vko’;d lsokvksa esa gSa\ gk¡=1] ugha=2
Section F: Exposure to SVEEP interventions
Q No. Question Response Code Skip
F1
pquko vk;ksx }kjk iz;qDr
ernkrk@ernku ls lacaf/kr fdlh
izpkj dks vkius ns[kk ;k i<+k gS\
ugha 0 G1
gk¡ 1
irk ugha 9 G1
F2
vki fdl ek/;e ls pquko ls
lacaf/kr tkudkfj;ksa dks izkIr djrs
gSa\
lekpkj i=@if=dk 1
VhŒohŒ ij izpkj vkSj dk;ZØe 2
jsfM;ks vkSj ,Q ,e pSuy 3
flusek esa izpkj 4
fØ;kdyki tSls&jSyh] izHkkr Qsjh]
ykmMLihdj ls mn?kks"k.kk 5

134
lkaLÑfrd@euksjatu dk;ZØe 6
ljdkjh dk;kZy; ds fn’kk&funsZ’k 7
iksLVj] gkWfMZx vkSj izpkj dh oLrq,¡ 8
xSj&ljdkjh laLFkk vkSj LFkkuh; lkekftd
lewg 9
baVjusV@lks’ky fefM;k@okV~lvi 10
,l ,e ,l (SMS) 11
?kj esa Ldwyh cPpksa ds }kjk 'kiFk
i=@ladYi i= 12
ernku dsUnz ij 13
vU; ¼Ñi;k fufnZ"V djsa½
F3
vkidks dkSu&dkSu ls ernkrk
lwpuk@laokn feyk\
*,d ls vf/kd dksM laHko
ernku dh rkjh[k rFkk dk;ZØe 01
≠ ernku esjk vf/kdkj vkSj dÙkZO; gS 02
≠ LosPNk ls ernku djuk gS vkSj fcuk
fdlh izyksHku ds 03
≠ Go Register or Register 04
≠ Go verify or verify name in voter
list 05
oksV nsus ds fy, ekU; 12 igpku nLrkost 06
ernku dsUnz ij feyus okyh lqfo/kk 07
cqtqxZ vkSj fodykax ds fy; ernku djus
esa izkFkfedrk 08
ernkrk lsok 1950 ;k ernku lsok ,Ii 09
cVIGIL ,Ii ls lacaf/kr 10
jk"Vªh; ernkrk lsok iksVZy ¼NVSP½ 11
vU; ¼fufnZ"V djsa½ ----
F4
pquko ds le; ds fdlh VSxykbu
dks ;kn dj ldrs gS\
¼gk¡ ds fy;s 1 uk ds fy;ss 0½
¼jkT; fo’ks"k VSxykbu dks crkus ds
fy;s cksys½
a. ns'k dk egkR;kSgkj
b. dksbZ ernkrk uk NwVs
c.≠jftLVj djks ≠lR;kiu djks ≠oksV
djks
vU; ¼fufnZ"V djsa½ ----
F5
vki fdlh gfLr@psgjs dks ;kn
dj ldrs gSa] tks ernku ds fy;s
dksbZ laokn fn;k gks\
¼gk¡ ds fy;s 1] uk ds fy;s 0½
a. ,eŒ,lŒ /kksuh
b. eSjh dkSe
c. lkbZuk usgoky
d. vkfej [kku
e. iadt f=ikBh
f. larks"k ;kno
F6 vkius www.NVSP.IN dk dHkh
mi;ksx fd;k gS\
ugha 0 F9
gk¡ 1
irk ugha 9 F9
F7 gk¡] rks fdl mís’; ds fy;s
csolkbZV dk mi;ksx fd;k\
ernkrk lwph esa uke rFkk vU; tkudkjh
<+w<+us ds fy;s 1
iathdj.k djus ds fy;s@vkWuykbZu
ifjorZu djus ds fy;s 2
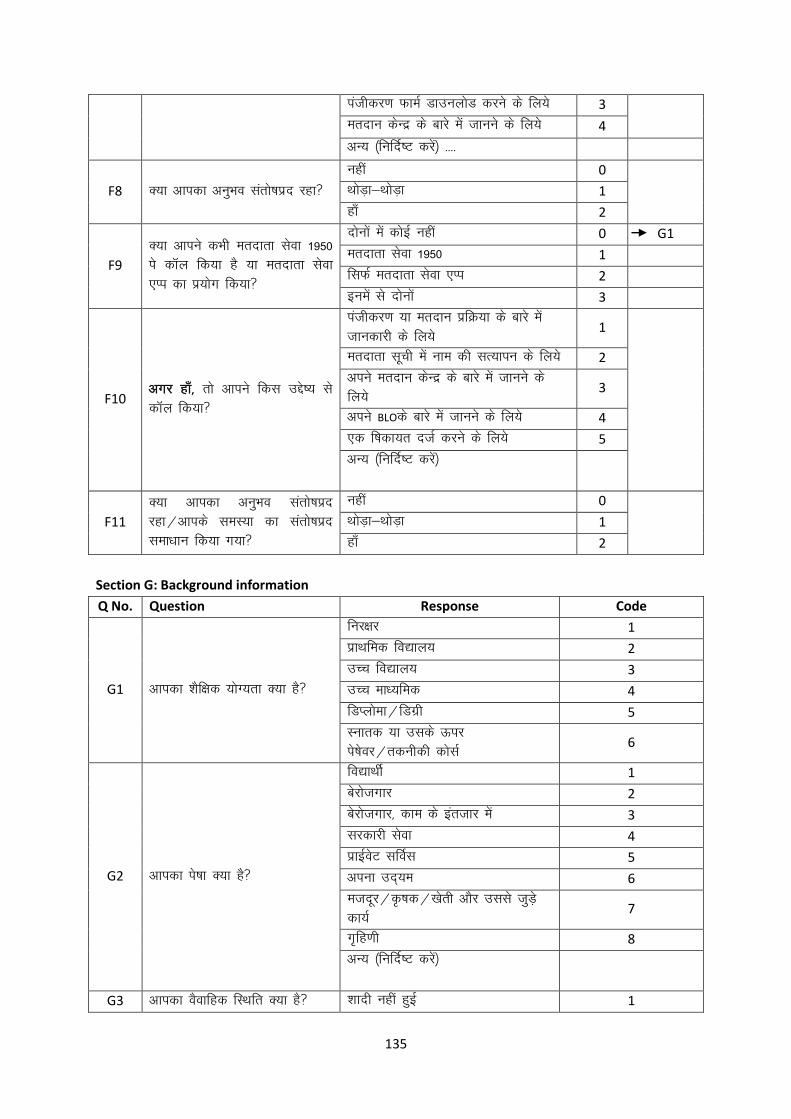
135
iathdj.k QkeZ MkmuyksM djus ds fy;s 3
ernku dsUnz ds ckjs esa tkuus ds fy;s 4
vU; ¼fufnZ"V djsa½ ----
F8 D;k vkidk vuqHko larks"kizn jgk\
ugha 0
FkksM+k&FkksM+k 1
gk¡ 2
F9
D;k vkius dHkh ernkrk lsok 1950
is dkWy fd;k gS ;k ernkrk lsok
,Ii dk iz;ksx fd;k\
nksuksa esa dksbZ ugha 0 G1
ernkrk lsok 1950 1
flQZ ernkrk lsok ,Ii 2
buesa ls nksuksa 3
F10 vxj gk¡] rks vkius fdl mís’; ls
dkWy fd;k\
iathdj.k ;k ernku izfØ;k ds ckjs esa
tkudkjh ds fy;s 1
ernkrk lwph esa uke dh lR;kiu ds fy;s 2
vius ernku dsUnz ds ckjs esa tkuus ds
fy;s 3
vius BLOds ckjs esa tkuus ds fy;s 4
,d f’kdk;r ntZ djus ds fy;s 5
vU; ¼fufnZ"V djsa½
F11
D;k vkidk vuqHko larks"kizn
jgk@vkids leL;k dk larks"kizn
lek/kku fd;k x;k\
ugha 0
FkksM+k&FkksM+k 1
gk¡ 2
Section G: Background information
Q No. Question Response Code
G1 vkidk 'kSf{kd ;ksX;rk D;k gS\
fuj{kj 1
izkFkfed fo|ky; 2
mPp fo|ky; 3
mPp ek/;fed 4
fMIyksek@fMxzh 5
Lukrd ;k mlds Åij
is’ksoj@rduhdh dkslZ 6
G2 vkidk is’kk D;k gS\
fo|kFkhZ 1
csjkstxkj 2
csjkstxkj] dke ds bartkj esa 3
ljdkjh lsok 4
izkbZosV lfoZl 5
viuk mn~;e 6
etnwj@Ñ"kd@[ksrh vkSj mlls tqM+s
dk;Z 7
x`fg.kh 8
vU; ¼fufnZ"V djsa½
G3 vkidk oSokfgd fLFkfr D;k gS\ 'kknh ugha gqbZ 1

136
'kknh gqbZ] xkSuk ugha 2
'kknh’kqnk 3
fo/kok 4
vyxko@rykd 5
G4 vkidk lkekftd oxZ dkSu lk gS\
vuqlwfpr tkfr 1
vuqlwfpr tutkfr 2
vU; fiNM+k oxZ 3
vU; 4
G5
vki fdruh ckj % mÙkjnkrk a. b. c. d.
a) lekpkj ;k if=dk i<+rs gSa\ (1) yxHkx jkst 1 1 1 1
b) jsfM;ks lqurs gS\ (2) de ls de lIrkg esa ,d ckj 2 2 2 2
c) Vsyhfotu\ (3) lIrkg esa ,d ckj ls de 3 3 3 3
d) baVjusV ¼Qslcqd] okV~l ,Ii ---
vkfn½
(4) dHkh ugha 4 4 4 4
G6
pquko ds le; esa vki dkSu ls
ek/;e ij pquko rFkk jktuhfrd
lekpkj izkIr djus ds fy;s Hkjkslk
djrs gS\
lekpkj i=@eSxthu 1
Vsyhfotu 2
jsfM;ks 3
baVjusV 4
eksckbZy Qksu 5
ifjokj@lacaf/k@fe= 6
vU; ¼fufnZ"V djsa½
G7 D;k vki COVID-19 ds izHkko ds
dkj.k okil ?kj ykSV vk, gSa\
gk¡ 1
ugha 2
G8
;fn G7 esa gk¡ gS] rks D;k vki [kqn
dks ernku lwph esa ukeafdr djk;s
gS\
gk¡ 1
ugha 2
G9 ;fn G8 esa gk¡ gS] rks vki dgka
ukekafdr gS\
fcgkj 1
og LFkku tgka vki dke dj jgs Fksa 2
G10
;fn G7 esa gk¡ gS] rks D;k vki
vkxkeh fo/kkulHkk pquko esa ernku
djus ds bPNqd gSa
gk¡ 1
ugha 2
G11
;fn G7 esa ugha gS] rks D;k vki
vkxkeh fo/kkulHkk pquko esa ernku
djus ds bPNqd gSa
gk¡ 1
ugha 2
G12
pquko ds fnu ernku dsUnz ij
COVID-19ls tqM+s fdu ,gfr;krh
mik;ksa dh vis{kk j[krs gaS\
¼,d ls vf/kd fodYi fpfUgr fd,
tk ldrs gSa½
drkj esa dgka ij [kM+k gksuk gS] ;g
tkuus ds fy, tehu ij fu’kku 1
lkcqu vkSj ikuh dh miyC/krk 2
lSfuVkbt+j dh miyC/krk 3
ekLd dh miyC/krk 4
ernku dsUnz ij FkeZy LØhfuax 5
vU; lq>ko ------------------------ 6
Section H: Only for Persons with Disabilities (PwDs)

137
Q.
No. Question Response Code
H1 D;k vki PwD dh Hkkxhnkjh ds mís’; ls fdlh Hkh
izpkj@ernkrk edutainment lkexzh esa vk, gSa\
gk¡ 1
ugha 2
H2 D;k vkids }kjk {ks= ds ch,yvks ls laidZ fd;k x;k gS\ gk¡ 1
ugha 2
H3
vki iathdj.k dh izfØ;k dk ewY;kadu dSls djrs gSa\
vklku 1
u vklku vkSj u gh eqwf’dy 2
eqf'dy 3
;fn fodYi 3 pquk tkrk gS] rks Ñi;k iathdj.k dh
izfØ;k esa vkusokyh dfBukb;ksa ds ckjs esa foLrkj ls crk,aA
H4
Ñi;k ernku dh izfØ;k esa vkusokyh dfBukb;ksa ds ckjs esa
foLrkj ls crk,aA
(,d ls vf/kd fodYi fpfUgr fd, tk ldrs gSa)
yach drkj 1
ofj"B ukxfjd ds fy, dksbZ vyx
drkj ugha 2
ihus dk ikuh 'kkSpky; vkSj jSai lfgr
lqfo/kkvksa dk vHkko 3
jktuhfrd ikVhZ cwFk vkWijsVjksa }kjk
tcjnLrh@/kedh 4
esjs ernku dsUnz dk irk yxkus esa
dfBukbZ;k¡ 5
lqfo/kk dsUnz ij esjk ernkrk iphZ izkIr
djus esa dfBukbZ 6
ernku dfeZ;ksa dk dksbZ ekxZn’kZu ugha 7
vU; ¼fufnZ"V djsa½-------------------------- 8
H5
D;k vki PwD ds vklku iathdj.k ds fy, vk;ksx }kjk
fodflr fo’ks"k eksckby ,fIyds’ku ¼PwD ,si½ ds ckjs esa
tkurs gSa\
gk¡ 1
ugha 2
Section I: Inducement
Q.
No. Question Response Code
I1 D;k ernku dks izHkkfor djus ds fy, fdlh ny ds
}kjk izyksHku fn;k x;k Fkk\
gk¡ 1
ugha 2
I2
D;k fiNys pquko ds nkSjku ernkrkvksa dks izHkkfor djus
ds fy, mEehnokjksa@jktuhfrd nyksa }kjk /ku
'kfDr@ckgqcy dk mi;ksx fd;k x;k Fkk\
gk¡ 1
ugha 2
I3 D;k vki jktuhfrd nyksa@mEehnokjksa }kjk vk;ksftr
jSfy;ksa esa Hkkx ysrs gSa\
gk¡ 1
ugha 2
I4 ;fn I3 esa gk¡ gS] rks mu jSfy;ksa esa Hkkx ysus ij gksus
okys [kpZ dk ogu dkSu djrk gS\
Lo;a 1
vk;kstudÙkkZ 2
I5
fiNys pquko esa ernkrkvksa dks yqHkkus ds fy, fuEu esa
ls dkSu ls izyksHku fn, x, Fks\
(,d ls vf/kd fodYi fpfUgr fd, tk ldrs gSa)
Lo;a lgk;rk lewgksa ds ekè;e ls
efgykvksa ds chp udnh forfjr djuk
1
fØdsV@QVckWy eSpksa ds vk;kstu ds
fy, LFkkuh; DyCk dh QafMax
2

138
NksVs lewgksa@leqnk;ksa@Ldwyksa ds fy,
Vhoh] jsfM;ks] izkstsDVj vkfn forfjr
djuk
3
efgykvksa ds chp ilZ] pwf++M+;k¡] oSfuVh
dsl forfjr djuk
4
'kjkc ckaVuk 5
[kkus dk iSdsV forfjr djuk 6
fu%’kqYd Mhty] isVªksy] ,yihth] dsjkslhu
ds fy, dwiu forfjr djuk
7
'kkSpky; fuekZ.k] gSaM iEi] eksckbZy Qksu
vkSj ySiVkWi [kjhnus ds fy, uxr
forfjr djuk
8
vU; dksbZ] fufnZ"V djsa ----------------------------- 9
APPENDIX - II
PHOTOGRAPHS TAKEN DURING THE FIELD STUDY

139
140

141
142

143

144

145
146
147

148
149

150

151

152