progress on the modernisation of the european pv …
TRANSCRIPT

Citation: Pearsall, Nicola, Atanasiu, Bogdan and Zdanowicz, Tadeusz (2008) Progress on the modernisation of the European PV system monitoring guidelines. In: 23rd European Photovoltaic Solar Energy Conference, 1-5 September 2008, Valencia, Spain.
URL:
This version was downloaded from Northumbria Research Link: http://nrl.northumbria.ac.uk/6473/
Northumbria University has developed Northumbria Research Link (NRL) to enable users to access the University’s research output. Copyright © and moral rights for items on NRL are retained by the individual author(s) and/or other copyright owners. Single copies of full items can be reproduced, displayed or performed, and given to third parties in any format or medium for personal research or study, educational, or not-for-profit purposes without prior permission or charge, provided the authors, title and full bibliographic details are given, as well as a hyperlink and/or URL to the original metadata page. The content must not be changed in any way. Full items must not be sold commercially in any format or medium without formal permission of the copyright holder. The full policy is available online: http://nrl.northumbria.ac.uk/policies.html
This document may differ from the final, published version of the research and has been made available online in accordance with publisher policies. To read and/or cite from the published version of the research, please visit the publisher’s website (a subscription may be required.)
brought to you by COREView metadata, citation and similar papers at core.ac.uk
provided by Northumbria Research Link

PROGRESS ON THE MODERNISATION OF THE EUROPEAN PV SYSTEM MONITORING GUIDELINES
N. M. Pearsall1, B. Atanasiu 2 and T. Zdanowicz3
1Northumbria Photovoltaics Applications Centre, Northumbria University, Newcastle upon Tyne, UK2European Commission Jo int Research Centre, Insitute for Energy, Ispra, Italy
3University of Wrocław, Poland
ABSTRACT: In the context of a rapid development of the PV market, both in terms of capacity and the type ofapplications, the EC-funded Integrated Project PERFORMANCE is developing a modernised set of guidelines for themonitoring of PV system performance. The completed guidelines will be easily accessible for all interested parties,from system designers to system users and/or financiers, and will provide guidance on both the measurement of PVsystems and the analysis of their performance. This paper discusses progress on the development of the web-basedguidelines package, including the approach to allow custom guidelines to be generated for a wide range of users, thedevelopment of a failure modes effects analysis tailored to the monitoring process and the opportunity for industryinput to the final development phase.Keywords: Monitoring, PV System, Performance
1 INTRODUCTION
The rapid development of the PV market, in terms ofcapacity, types of application and range of marketplayers, has led to the requirement for an expanded rangeof monitoring protocols and services to meet the differentmarket needs. Advances in the industry have outstrippedthe available standards and guidelines for themeasurement and assessment of system performance. Inthis context, the EC-funded Integrated ProjectPERFORMANCE [1] is developing a modernised set ofguidelines for the monitoring of PV system performance.The completed guidelines will be easily accessible for allinterested parties, from system designers to system usersand/or financiers. The objectives are: To provide a tool for decision making in regard to the
level and complexity of monitoring for differentsystem types
To validate the best practices currently in use by theindustry and use these as the basis for the modernisedguidelines
To develop new guidelines where insufficientguidance exists
To enable both existing companies and those enteringthe PV market to provide suitable monitoringservices consistent with the expectations of thesystem user.The paper will describe the approach to modernising
the guidelines to achieve these objectives and discuss theprogress to date and the programme for completion andimplementation.
2 PV SYSTEM MONITORING REQUIREMENTSAND PRACTICES
There has been rapid growth in the PV market overthe last decade with an estimated cumulative installedcapacity of 9 GWp globally by the end of 2007, aroundhalf of that installed in Europe [2] . The applicationsrange from small (a few 100W) to large (several tens ofMW) and from domestic systems, either grid connectedor stand alone, to power stations installed as part ofutility or private investment initiatives.
Whilst different users operate their systems under
different technical and fiscal conditions, they all have arequirement for high performance throughout the lifetimeof the system and a need to identify system losses (due tooperational issues or faults) within a timescaleappropriate to the economic losses associated withreduced output. Whilst fault identification may be moreurgent for a large system operating under a feed-in tariffwhere the loss of output has severe financialconsequences, it is nevertheless important that the smalluser also has the opportunity to identify and rectifylosses. It is worth noting that it is not only faulty orsubstandard equipment or design that causes problems,but that substantial losses can be incurred due tooperational issues such as shading or problems with gridconnection that may arise or worsen during the course ofsystem operation. To put it simply, systems operatingbelow a reasonable standard are a wasted opportunity interms of energy contribution. Losses directly impact theeconomic viability of the system and users who feel thatthey are not getting the output promised areunderstandably poor ambassadors for the promotion ofthe technology.
The PV industry has developed a number ofapproaches to provide the monitoring services required inan expanding market. These include: Monitoring services for large installations included
within a maintenance package and offering faultidentification and rectification within a definedperiod (offered by many of the major installers – e.g.the maintenance and monitoring services offered byPhoenix Solar AG and Conergy);
Monitoring systems including analysis softwarespecifically designed for PV systems, for purchasefrom specialist companies or as part of the inverterpackage;
Comparison web sites where owners of small systemscan check their output against similar systems in thesame area;
Monitoring services for small systems based onsatellite-derived irradiation data, in some casesincluding automatic fault detection (e.g. commercialservices based on the results of the PVSAT-2 project[3]).These commercially available systems and services
have been developed in response to customer need, but
23rd European Photovoltaic Solar Energy Conference, 1-5 September 2008, Valencia, Spain
3208
the procedures and quality are not underpinned bystandards or guidelines that reflect the developments ofthe market place or the monitoring services themselves.
System monitoring designed to identify faults andtheir causes and thereby minimise output losses can begenerally likened to insurance. The more extensive thepackage, and thus the more costly to implement, thefaster faults should be able to be recognized and thelower should be the overall loss of output. However,small system users often do not have the experience ofPV or other similar systems that would let them make arational decision about the level of “insurance” to choosewith respect to the monitoring services on offer. Theguidelines will also provide information on the level ofdetection that can be obtained for different levels ofmonitoring to inform customer decisions. Clearly therealso needs to be some consideration of the likelihood ofloss, as well as the ability to detect that loss, and this isdiscussed further later in this paper.
Since the guidelines update needs to reflect bestpractice in the existing monitoring services offered by theindustry as well as being a generic technical reference fornew entrants to the market place, the developmentincludes strong consultation with industry over theimplementation phase, as described later.
3 THE IMPLEMENTATION OF THE MONITORINGGUIDELINES
The overall concept of the updated guidelines waspresented at the European Photovoltaic Solar EnergyConference in Milan in 2007 [4] and the work has nowprogressed to the implementation of the guidelines intheir web-based format. The initial implementation hasbeen designed to establish functionality and suitability ofthe approach to meet the requirements described aboveand has included consultation with a number of expertsexternal to the project. This phase will result in thepreparation of a more extensive version that can beassessed in depth by the PV industry early in 2009, so asto ensure that it meets their needs in terms of monitoring
guidance.The first version of the guidelines has been
implemented in Excel to allow ease of consultation anddevelopment, but no decision has yet been made on thefinal software platform to be used. In the first instance, itis necessary to have an open and easily accessibleimplementation so as to be able to ensure that allinterested parties can input to the composition of theguidelines. For the final version, the functionality andease of updating are key attributes.
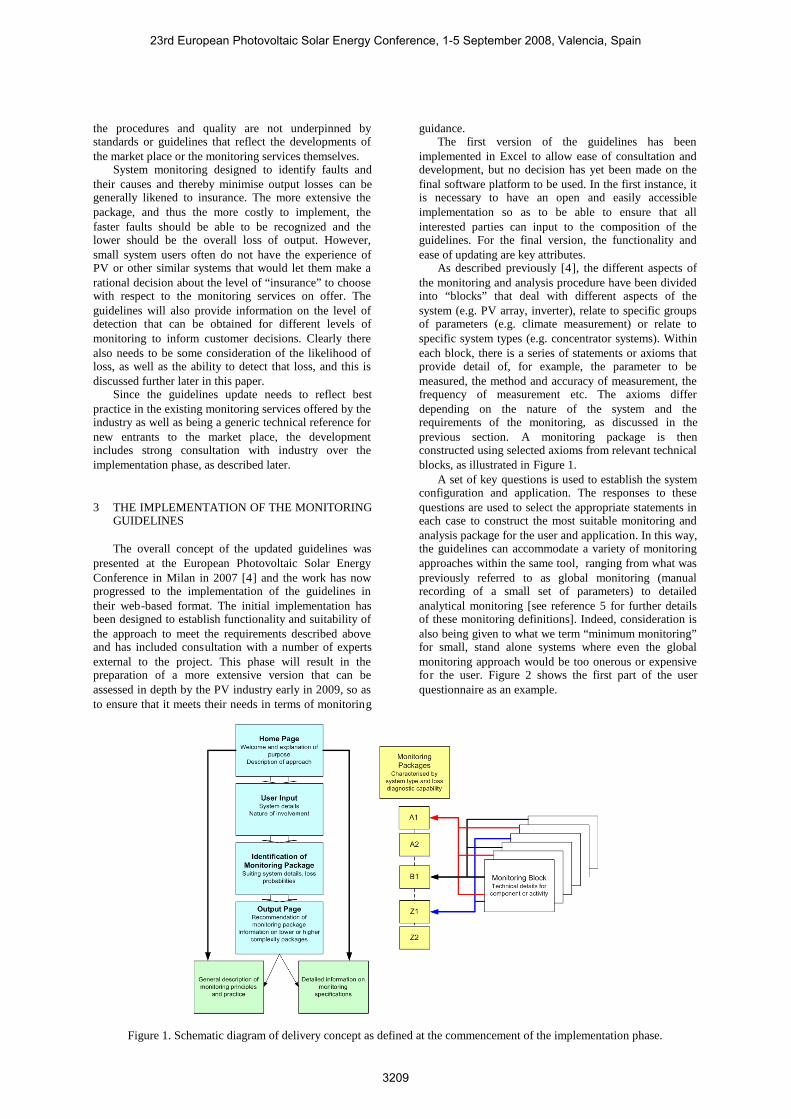
As described previously [4], the different aspects ofthe monitoring and analysis procedure have been dividedinto “blocks” that deal with different aspects of thesystem (e.g. PV array, inverter), relate to specific groupsof parameters (e.g. climate measurement) or relate tospecific system types (e.g. concentrator systems). Withineach block, there is a series of statements or axioms thatprovide detail of, for example, the parameter to bemeasured, the method and accuracy of measurement, thefrequency of measurement etc. The axioms differdepending on the nature of the system and therequirements of the monitoring, as discussed in theprevious section. A monitoring package is thenconstructed using selected axioms from relevant technicalblocks, as illustrated in Figure 1.
A set of key questions is used to establish the systemconfiguration and application. The responses to thesequestions are used to select the appropriate statements ineach case to construct the most suitable monitoring andanalysis package for the user and application. In this way,the guidelines can accommodate a variety of monitoringapproaches within the same tool, ranging from what waspreviously referred to as global monitoring (manualrecording of a small set of parameters) to detailedanalytical monitoring [see reference 5 for further detailsof these monitoring definitions]. Indeed, consideration isalso being given to what we term “minimum monitoring”for small, stand alone systems where even the globalmonitoring approach would be too onerous or expensivefor the user. Figure 2 shows the first part of the userquestionnaire as an example.
Figure 1. Schematic diagram of delivery concept as defined at the commencement of the implementation phase.
23rd European Photovoltaic Solar Energy Conference, 1-5 September 2008, Valencia, Spain
3209

Figure 2. Screen capture from the user questionnaire page of the monitoring guidelines.
The construction of the guidelines is simple andfunctional. Each axiom in each technical block isassigned a predefined number through which it can beidentified. The answers to the key questions are alsoassigned numbers that cross-reference directly to thenumbered axioms. Where necessary, sub-questions areprovided to refine the answer and define the specificmonitoring requirements. Axioms in different technicalblocks can have the same number assigned, provided thatthey apply to the same type and application of system andso are called correctly. Assuming that the Guidelines area concatenation of axioms, the string of numbersproduced as a consequence of the responses to the userquestions is a unique way to identify the monitoringframe and the user profile. A brief example of how thissystem functions is given opposite.
Let us now consider how this leads to the guidelinesproduction with a further example. One of the mostimportant measurements for determining system losses isthat of the solar irradiation falling on the array.Knowledge of the irradiation level allows system yieldover a given period to be compared with expected valuesand the system efficiency to be calculated. Considerationof the way output varies as a function of irradiance levelcan identify losses due to operation thresholds, incorrectsizing of the inverters or, in some cases, temperatureeffects. Comparison of the shape of the output profilewith that of the irradiance profile can identify losses dueto shading or inverter outages. The accuracy ofmeasurement of the irradiance level has a direct influenceon the level of loss that can be identified and on theability to determine the cause of that loss.
Example: In the following example, which considersquestion number five in the current guidelines, twodifferent possible answers exist depending on the natureof the system.
Each answer has a corresponding number: Grid-connected, number 2 Stand-alone, number 3 Blank space, number 1Note: The blank space is included for initialisation ofeach question when the user first accesses the guidelines.Leaving the answer blank will result in an error messagereminding the user to complete all questions before theguidelines can be displayed.
Reporting each question with the relative numberaccording to the answer, the "DNA" string will be thenproduced.
The complete questionnaire string is compared with thepre-defined code of axioms. Specific monitoringguidelines can then be produced depending on this"DNA" axioms selection.
23rd European Photovoltaic Solar Energy Conference, 1-5 September 2008, Valencia, Spain
3210
Existing guidelines [5, 6] describe the measurementof irradiance in the plane of the array and generallyrequire this to be done on-site by a reference cell(calibrated in accordance with IEC 60904-2 or 60904-6as appropriate) or a pyranometer. The EC guidelines [5]stress the importance of aligning the reference cellprecisely with the plane of the array. Clearly, a suitablycalibrated, correctly aligned and well maintainedirradiance sensor mounted close to the PV array in anunshaded position gives the greatest accuracy ofmeasurement and thus the highest possibility of lossdetermination. However, the expense of purchase,installation and maintenance may be prohibitive for smallsystems (based on the comparison with the expectedvalue of any losses) and a poorly maintained sensor onsite may be of less use than a correctly maintained sensorelsewhere.
Various other options exist. In some cases, wheremultiple systems are installed on a single site (e.g. ahousing estate), it may be possible to install a centralsensor that can be used for all of the systems and alsomaintained centrally, provided that there is not too muchvariation in array orientation. Alternatively, a sensor onanother site or a central measurement service can beused. In this case, the measurement is usually for thehorizontal plane and some errors are incurred by thetranslation of the value to the array plane. Finally, it isnow possible to obtain irradiation values derived fromsatellite data, again for the horizontal plane.
Studies of the accuracy of satellite data compared toground based measurements for the USA indicate that theuncertainty of the satellite data is lower than that forground based sensors once the distance to the groundbased measurement is in the 20-50 km range (dependingon the frequency of measurement) [7]. Clearly, this willdepend on the location, since it will vary with climate,but gives an indication of the distance at which it wouldbecome more favourable to consider satellite derived datafrom an appropriate source. Nevertheless, the higheruncertainty of satellite data compared to on-sitemeasurements means that larger percentage losses will beincurred before the existence of the fault is identified,typically around 17% in summer months and higher inwinter months [3].
The guidelines must reflect all these issues withoutbeing too complex and whilst providing clear guidance.Thus, each section will start with a series of genericstatements describing the measurement in question andcommon to all packages. They will then provideinformation on the specific recommendation (or a choiceof options only if this is appropriate). However, the userwill have the possibility of viewing other monitoringoptions if they wish to consider other approaches. Table1 gives an example of the statements for the irradiationmeasurement issues discussed above, concentrating onlyon measurements on-site for individual arrays, off-sitemeasurements from meteorological stations and satellitederived data. It should be noted that these are notnecessarily the final versions of the wording since theindustry consultation has not yet been completed, butthey are indicative of the approach.
The recommendations will be selected according tosystem type and size and economic factors relating to the
value of the electricity generated. Whilst the above tableconsiders only the initial statements for one of themeasurements, consistency will be ensured across alltechnical blocks so that the desired accuracy ofmeasurement and analysis is maintained.
4 PERFORMANCE ANALYSIS
Clearly, it is not sufficient to simply measure theperformance data, but guidance must also be provided inrelation to the analysis of those data to allowidentification of the existence of an unacceptable loss andinvestigation of the cause of that loss. The currentguidelines [6, 8] describe the determination of the mainperformance indicators of the PV array, including: Array and system efficiencies Capture and system losses Array, reference and final yields Performance ratio Monitoring and outage fractions PV energy contribution in the form of array fraction
They also provide some suggestions as to how todisplay these quantities graphically. However, they donot provide any guidance as to what these values shouldbe numerically, how to identify when losses are higherthan they should be and how to use the monitoring datato identify the causes.
The updated guidelines will include a much expandedinformation set in regard to analysis, again separated intostatements that relate directly to the nature of the systemand the data measurement already recommended.Guidance will also be given on how to check the data forconsistency and errors in advance of analysis, so as to aidthe interpretation of the indicators obtained.
Current monitoring systems have fewer constraintson the amount and frequency of data measurement thanwhen the existing standards were written, due to the rapiddevelopment of low cost memory for data storage. Whilstit is not often cost effective to analyse data at short timeintervals as a matter of course, interrogating these datawhen a fault or loss is observed can speed up theidentification of the cause and thus the elimination of thatfault or loss.
We can illustrate the effect of measurement frequencywith a simple example. Figure 3 shows two graphs basedon the same measurement data taken for a June day for a2.2kWp domestic PV system in the UK. This system hastwo identical sub-arrays each connected to its owninverter. The irradiance in the plane of the array and theAC output power of the PV system were measured at oneminute intervals. In the top graph, these data have beenused to produce hourly averages of the two parametersand the resulting plot shows approximate agreementbetween the irradiance and the power output with nospecific indication of problems. However, plotting the 1-minute measurements, as in the lower graph, clearlyshows periods when both inverters were off during theday and close inspection reveals times when only oneinverter is operating. In this particular case, the cause washigh grid voltage rather than an inverter fault.
23rd European Photovoltaic Solar Energy Conference, 1-5 September 2008, Valencia, Spain
3211

Table 1. Example of statement construction for irradiance measurement. Statements with an ID number of 0 will be includedin all monitoring packages. Statements with other ID numbers will be called as required depending on the responses to theuser questions. For space reasons, only some of the statements included in the description of irradiance measurement aregiven in the table below and some of the explanatory details are omitted . (Note that the ID numbers shown here do not relateto the possible answers to the question given in the example box earlier.)
ID No. Statement0 Irradiance data representative of the values in the plane of the array are required for use in the performance
analysis of the PV system. If these are not available, it will restrict the possibilities for identification of lossesand their cause.
0 Horizontal data may also be recorded to permit comparisons with standard meteorological data from otherlocations. (see note (a) below)
0 The in plane irradiance may be (a) measured on site, (b) measured at another site chosen to be representativeor (c) derived from remote measurements (e.g. from satellite data), depending on precision requirements
0 An on-site measurement will provide the highest level of precision, provided that appropriate calibration,installation and maintenance procedures have been carried out.
1 Irradiance measurements, whether on or off site, should be made using a calibrated reference device orpyranometer.
1 If used, reference devices shall be calibrated and maintained in accordance with IEC 60904-2 or IEC 60904-6as appropriate and, where possible, should be spectrally matched to the monitored PV array.
1 The accuracy of the irradiance sensors, including signal conditioning, shall be better than 5% of the readingand the temporal stability shall be better than 0.5% per year.
2 For on-site measurements, the sensor should be mounted so that the detector surface is in the same plane as thearray and at a location representative of the irradiance conditions of the array. The sensor should be positionedwhere it is unshaded at all times (regardless of whether the PV array is partially shaded at any time) and in alocation where it can be accessed for cleaning at the required intervals.
2 Where the PV array consists of more than one sub-array of differing orientation, sensors shall be located in-plane will each sub-array.
3 The reference site should be chosen to be representative of the PV system site in terms of location and climate(this aspect still to be fully defined including the definition of the maximum distance between sites).
3 It is likely that reference site measurements will be for the horizontal plane. For all measurements not in theplane of the array of the system under consideration, an approved method of translation to in-plane valuesmust be used (details to be defined).
4 Where available, satellite-derived solar data may be used to infer the irradiation received by the PV array. Thisapproach is most suited to small PV systems where the expense or technical aspects of on-site measurementcannot be justified. The precision with which losses can be identified will be lower than for on-sitemeasurements correctly performed and may be lower than for off-site ground-based measurements dependingon the distance between the measurement and system sites.
4 The satellite-derived data should be obtained from a recognised and named source, where one of the satellitefunctions is specifically to return solar data to the required accuracy (details to be agreed with current dataproviders).
4 Since satellite derived measurements will be for the horizontal plane, an approved method of translation to in-plane values must be used (details to be defined).
Notes to Table 1:(a) Horizontal measurements may also be used to verify the method of translation to an inclined surface in appropriate
circumstances.
23rd European Photovoltaic Solar Energy Conference, 1-5 September 2008, Valencia, Spain
3212

Figure 3(a). Comparison of AC power output and irradiance in the plane of the array for a 2.2 kWp domestic PV system inthe UK on a June day. The curves are based on hourly averages of data measured at one minute intervals.
Figure 3(b). Comparison of AC power output and irradiance in the plane of the array for the same system as in Fig. 3(a) andfor the same day. The curves are based on the data measured at one minute intervals.
23rd European Photovoltaic Solar Energy Conference, 1-5 September 2008, Valencia, Spain
3213

Recording and displaying the frequent measurementdata allows a rapid identification of an operationalproblem and some information on the likely cause,although this has to be balanced against the time taken toinspect the graphs. The guidelines will consider howfrequently to measure and store data, how to display thedata on a routine basis so that it demonstrates any majorfaults on the system and what additional analysis mightbe possible using the stored data.
One of the most powerful approaches for identifyinglosses is direct comparison of similar systems on adjacentsites or sub-systems in a large installation. The guidelineswill make recommendations for the way in which thisapproach could be implemented where appropriate, forexample, the number of sub-systems to be monitored andthe parameters to be measured.
Direct comparison of measured parameters on thesame system but at different times (of day or season) canalso be used to determine losses, particularly due toshading or temperature effects. Again, guidance will begiven as to what should be compared, at what intervalsand how to interpret the results.
5 ESTABLISHING PROBABILITY OF LOSS
The determination of the most appropriatemonitoring package depends on the value of theelectricity produced and the probability that output losseswill be incurred, in just the same way that the choice ofthe level of, say, house contents insurance, depends onthe value of those contents and the probability that theywill be lost or damaged. The determination of theprobability of loss is perhaps the most challenging part ofthis project since the field data to support thedetermination are not readily available in the openliterature (and perhaps may not be available in a usableform even within the industry).
The approach taken has been to commence a FailureModes Effects Analysis (FMEA) at the system level withspecific reference to the ability of the monitoring andanalysis process to reduce the overall loss due to anyspecified failure mode (where the term failure includesreduced output as well as system breakdown). FMEA is astructured approach to identifying failure modes andestimating their associated risk and is commonly used inprocess industries for minimising risk and improvingproduct yields. In this case, the aim of the FMEA is toprovide a detailed consideration of individual failuremodes and to assess the relative importance of eachmode. The modes with the highest potential loss shouldbe addressed first and less important modes only includedwhere costs allow.
Three numerical indices are used to generate a RiskPriority Number (RPN). These relate to: Severity – the magnitude of the loss if this failure
mode occurs Occurrence – the likelihood that this mode will occur
in a specified period
Monitoring – the effectiveness of the monitoring andanalysis in detecting and diagnosing the cause of theperformance lossClearly, the first two indices have high values for
serious and commonly occurring failure modes, whilstthe monitoring index is a low value for successfulidentification and diagnosis. In the first version of theFMEA, the monitoring index is determined from twosub-indices, one relating to whether the monitoring canidentify that a fault exists and the other relating to howeasily the cause of that fault can be determined from themonitored data. For example, most monitoring schemescan determine low system output, but not all causes canbe identified from a small number of parameters or fromvalues aggregated over long periods. Thus, thedetermination of the existence of a fault does notnecessarily mean that the cause can be determined.
The first version assumes that the indices are all ofequal weighting and are assigned values between 5 and100. Note that zero values would result in a RPN value ofzero which is meaningless in the context of the FMEA.Any failure mode scoring zero for severity has, byimplication, no effect on system output. Any modescoring zero for occurrence is hypothetical only (i.e. doesnot occur in practice). The project team believe that it isnot useful to attempt to quantify the index to an accuracyof more than 5 (i.e. values of 5, 10, 15 etc.) and even thismay imply an accuracy that is not possible in practice.
The occurrence can be linked to the percentageprobability of occurrence in a specified period (nominallythe system lifetime, but modified for failure modesassociated with the end of life of components). Theseverity can be linked to the percentage loss of outputarising from an undetected fault and the severity indexcan be determined by a technical consideration of thesystem (e.g. in relation to component failure) or by fieldexperience (e.g. shading effects). The monitoring indexcan be determined from direct consideration of themonitoring and analysis possibilities of any specifiedmonitoring package.
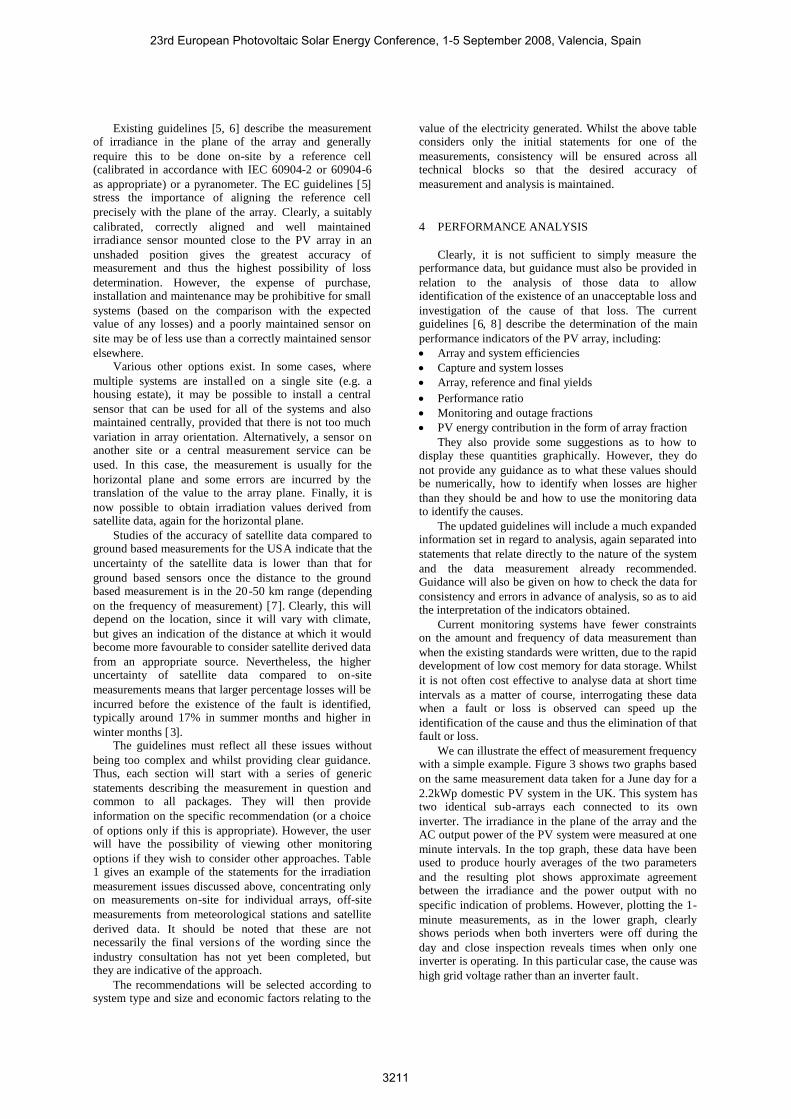
Table 2 shows a simple example of an FMEA entryfor one possible fault, the failure of a component in theinverter that leads to inverter shutdown for a gridconnected PV system. Only selected columns have beenincluded for clarity. The full FMEA also considersinteraction between fault mechanisms and some otherdescriptive information. The indices presented are forillustration only and are not expected to be the finalvalues assigned. Only three monitoring possibilities areincluded here, these being no monitoring of any kind,visual inspection only and monitoring of the electricalparameters of the system according to the existinganalytical monitoring guidelines. In the final FMEA,different categories of electrical monitoring will beconsidered reflecting the analytical possibilities describedearlier, particularly relating to the parameters measuredand the frequency of measurement.
23rd European Photovoltaic Solar Energy Conference, 1-5 September 2008, Valencia, Spain
3214
Table 2. Example of FMEA entry for loss mechanism for a grid-connected PV system. The Risk Priority Number iscalculated from the following formula: RPN = OI x SI x average (DI1, DI2) / 1000. The factor of 1000 is only to provide anumber that is easily interpreted and has no physical meaning. See main text for an explanation of the values provided. (NB.The values given are for illustration of the method only and should not be taken as indicative of actual field performance).
Ref.No.
PotentialCause(s) ofFailure or
FaultOccurrence
Notes
OccurrenceIndex(OI)
PotentialEffects ofFailure
SeverityIndex(SI)
ProcessControls
DetectionIndex(DI1)
DiagnosisIndex(DI2)
RiskPriorityNumber
1Componentfailure ininverter
Most likelyin first year
andtowardsend of
inverter life
20No outputfrom PVsystem
100
Noinspection
100 100 200
Visualinspection 50 70 120
Electricalmonitoring
10 30 40
The example table has an occurrence index of 20,which indicates an expectation that, on average, 20% ofsystems will suffer from this problem in the specifiedperiod. The occurrence notes relate to any specialfeatures of the occurrence. In this case, we would expectthat the likelihood of the fault occurring would be highestin the first year of operation (due to faulty components orunsuitably high stress factors) or towards the end of lifeof the component. Thus, it may be useful to considermodification of the monitoring procedure to ensure morefrequent checking in these periods.
In this case, the severity index is straightforward. Weassume that the component failure leads to shutdown ofthe inverter, reducing the output of the PV system tozero. The severity index is therefore 100 (i.e. 100% of theoutput is lost whilst the fault continues).
The detection and diagnosis indices are separatedsince it is possible to observe the fault (zero systemoutput) without being able to establish its cause. Here,the more successful the detection or diagnosis, the loweris the index, resulting in a lower Risk Priority Numberwhen all indices are multiplied. Clearly, for no inspectionof the system, the indices for detection and diagnosis areboth 100. For visual inspection, it is possible to observe(from a meter or directly from the inverter) that there isno output from the system and checking of the inverterwill then establish that as the problem, although there isno way of determining the factors leading up to failure.The index value depends on how often the system ischecked (as it does with all forms of monitoring). For theelectrical monitoring approach, detection isstraightforward and easy to see from any data set, but theability to diagnose the cause then depends on the datameasured.
The final Risk Priority Number is the product of allthree indices (where the detection and diagnosis indiceshave first been averaged to provide the monitoringindex). In the example, it can be seen that comparingelectrical monitoring to an approach with no systemchecking reduces the Risk Priority Number by a factor of5. The full FMEA allows numerical comparison of theeffectiveness of various monitoring approaches, so as todetermine the most cost efficient monitoring process for aparticular system. However, perhaps the most usefulaspect of the FMEA is to allow comparison of the effectof various loss mechanisms, so as to identify the oneswhich require most attention in the monitoring process.
Clearly, the value of the occurrence index is the mostdifficult to estimate and is key to determining the mostcost-effective monitoring process. There are two
approaches to determining the index or probability ofoccurrence. Probability is usually determined from thelong-run relative frequency of the event occurrence,based either on theoretical or experimentalconsiderations. In appropriate cases, reliability testingdata from manufacturer tests or from a designated testingcentre may also be used. In the case of faults in PVsystems, the experimental or field data are obviously ofmost relevance in determining the value for specificfaults or families of faults. This approach is empiricallybased and known as the frequentist approach toprobability.
Secondly, there is the Bayesian approach where asubjective probability, which is a personal belief that aparticular event will occur, is defined. This is usuallytaken to be the belief of someone with sufficient expertisefor this to be a reasonable assessment. In cases, where thenumerical data are insufficient to establish a probabilityon the basis of field measurements, it may be necessary touse subjective probabilities. In these instances, theexpertise of the participants, especially those involved incommercial installations, must be used to establishreasonable starting points. The probability values canthen be revised as more field data becomes available.This will need to be the practice for any future newcomponents or technical advances in components forwhich little field data are available.
It is intended to derive both the severity andoccurrence indices by consultation with the industry,arriving at a consensus based on confidential responses torequests to provide best estimates of the indices fordifferent failure modes. These estimates will combineboth the frequentist and Bayesian approaches asnecessary.
The determination of the probability of occurrence ofa fault will be necessary for each fault or, in some cases,group of faults. The simplest assumption is that thedifferent faults are independent, i.e. that the occurrenceof one fault does not make it more or less likely that asecond fault would occur. Clearly, this is not actually thecase with faults that are initiated or exacerbated bycertain operating conditions, for example, componentsusceptibility to high temperatures or power surges fromthe grid. Allowance will need to be made for faults thatare interdependent or that both depend on the sameexternal variable. These inter-dependencies can beassessed from an understanding of fault occurrences inPV system components.
Given that reliability is a function of system type andapplication, as well as the detail of the individual
23rd European Photovoltaic Solar Energy Conference, 1-5 September 2008, Valencia, Spain
3215

components, individual probability values will need to beassigned for different system categories and these canthen be used to determine the level of monitoringrequired in each case. However, for a representativeprobability value, sufficient input data are required toallow for any systematic influences. Thus, there is atrade-off between the number of categories chosen andthe validity of the probability value derived. As before,advice will be sought from industry before finalising thevalues.
6 PROGRAMME FOR IMPLEMENTATION
At the time of preparation of this paper, the initialversion of the delivery package has been prepared and thedetailed guidelines themselves are being constructedblock by block. As has been discussed several timesearlier in the paper, it is vital that the guidelines reflectboth the best practice in the industry in regard tomonitoring and reasonable decisions based on existingexperience of probability of loss. The guidelines mustalso be adopted by the industry as a whole if they are tobe used to their full potential in the reduction ofavoidable losses in energy production of commercialsystems.
An extended period of industry consultation isplanned, starting with a workshop under the Performanceproject in late October 2008 and moving onto a testingphase with interested industry partners in the first sixmonths of 2009. It is intended that the full guidelines intheir first edition will be available at the end of 2009when the Performance project comes to a close. Initialimplementation is expected to be on the JRC web site,but the permanent site for the guidelines is still to bedetermined depending on the final format.
7 SUMMARY
Within the EU project PERFORMANCE, updatedmonitoring guidelines for PV systems are beingdeveloped. This paper has discussed the development ofthe first implementation of those guidelines, describinghow they will address the needs of different users andsystem types by selecting relevant statements based onthe answers to a user questionnaire. The guidelinesinclude consideration of how monitored data can be usedto detect and diagnose losses, significantly extending theinformation provided in current standards and guidelines.
A major factor in determining the monitoringapproach, and hence the detailed guidelines, for aparticular system is cost effectiveness. More intensivemonitoring and analysis results in more effectiverecognition of avoidable losses but also generally resultsin higher costs. The approach to quantifying lossprobabilities via a Failure Modes Effects Analysis hasalso been described.
The project now moves into an industry consultationphase to determine the current best practice in terms oflevels of monitoring and allow this to be reflected in thefinished guidelines, which are expected to be publishedby the end of 2009. Once available, they can be used on avoluntary basis to underpin monitoring activities andservices offered by the industry and are expected to inputto the updating of IEC monitoring standards.
8 ACKNOWLEDGEMENT
The PERFORMANCE Integrated Project is fundedby the Sixth Framework Programme of R&D (FP6) of theEuropean Union under contract number SES-019718.The project is co-ordinated by the Fraunhofer Institutefor Solar Energy Systems, Freiburg, Germany.
The authors would like to acknowledge thecontribution of the other partners in Subproject 3 ofPerformance for their input to the development of theguidelines, together with the members of the EuropeanPV Monitoring Expert Group convened by JRC as part ofthis project.
9 REFERENCES
1. Further information on the PERFORMANCE projectcan be found at www.pv-performance.org
2. European Photovoltaic Industries Association,“Global Market Outlook for Photovoltaics until2012”, February 2008, available from www.epia.org
3. A. Drews et al, Solar Energy, vol. 81, 2007, p.548-564
4. H. Scholz, N. M. Pearsall, T. Zdanowicz, Proc. of the22nd European Photovoltaic Solar EnergyConference, Milan, 2007, p. 2922-2929
5. Guidelines for the Assessment of Photovoltaic Plants,Document A – Photovoltaic System Monitoring, ed.G. Blaesser and D. Munro, EUR 16338 EN, 1995
6. IEC 61724, Photovoltaic system performancemonitoring – Guidelines for measurement, dataexchange and analysis, IEC 1998
7. F. Vignola, P. Harlan, R. Perez and M. Kmiecik,Proceedings of the 34th ASES Annual Conference,2005
8. Guidelines for the Assessment of Photovoltaic Plants,Document A – Analysis and Presentation ofMonitoring Data, ed. G. Blaesser and D. Munro,EUR 16339 EN, 1995
23rd European Photovoltaic Solar Energy Conference, 1-5 September 2008, Valencia, Spain
3216