progress in materials science · 2019-12-14 · superhydrophobicity, self-cleaning, low adhesion,...
TRANSCRIPT

Progress in Materials Science 56 (2011) 1–108
Contents lists available at ScienceDirect
Progress in Materials Science
journa l homepage : www.e lsev ie r . com/ loca te /pmatsc i
Natural and biomimetic artificial surfacesfor superhydrophobicity, self-cleaning, low adhesion,and drag reduction
Bharat Bhushan *, Yong Chae JungNanoprobe Laboratory for Bio- & Nanotechnology and Biomimetics (NLB2), The Ohio State University,201 W. 19th Avenue, Columbus, OH 43210-1142, USA
a r t i c l e i n f o a b s t r a c t
Article history:Received 10 October 2008Received in revised form 4 April 2010Accepted 25 April 2010
0079-6425/$ - see front matter � 2010 Elsevier Ltdoi:10.1016/j.pmatsci.2010.04.003
* Corresponding author.E-mail address: [email protected] (B. Bhusha
Nature has developed materials, objects, and processes that func-tion from the macroscale to the nanoscale. The emerging field ofbiomimetics allows one to mimic biology or nature to developnanomaterials, nanodevices, and processes which provide desir-able properties. Hierarchical structures with dimensions of fea-tures ranging from the macroscale to the nanoscale areextremely common in nature to provide properties of interest.There are a large number of objects including bacteria, plants, landand aquatic animals, and seashells with properties of commercialinterest. Certain plant leaves, such as Lotus leaves, are known tobe superhydrophobic and self-cleaning due to the hierarchicalroughness of their leaf surfaces. The self-cleaning phenomenon iswidely known as the ‘‘Lotus effect.” These surfaces with high con-tact angle and low contact angle hysteresis with a self-cleaningeffect also exhibit low adhesion and drag reduction for fluid flow.In this article, the theoretical mechanisms of the wetting of roughsurfaces are presented followed by the characterization of naturalleaf surfaces. The next logical step is to realize superhydrophobicsurfaces based on understanding of the leaves. Next, a comprehen-sive review is presented on artificial superhydrophobic surfacesfabricated using various fabrication techniques and the influenceof micro-, nano- and hierarchical structures on superhydro-phobicity, self-cleaning, low adhesion, and drag reduction.
� 2010 Elsevier Ltd. All rights reserved.
d. All rights reserved.
n).

2 B. Bhushan, Y.C. Jung / Progress in Materials Science 56 (2011) 1–108
Contents
1. Introduction . . . . . . . . . . . . . . . . . . . . . . . . . . . . . . . . . . . . . . . . . . . . . . . . . . . . . . . . . . . . . . . . . . . . . . . . . . 3
1.1. Definitions and applications . . . . . . . . . . . . . . . . . . . . . . . . . . . . . . . . . . . . . . . . . . . . . . . . . . . . . . . . 51.2. Natural superhydrophobic, self-cleaning, low adhesion, and drag reduction surfaces . . . . . . . . . . 61.3. Roughness-induced superhydrophobicity, self-cleaning, low adhesion, and drag reduction . . . . . 71.4. Scope of the article . . . . . . . . . . . . . . . . . . . . . . . . . . . . . . . . . . . . . . . . . . . . . . . . . . . . . . . . . . . . . . . 92. Modeling of contact angle for a liquid in contact with a rough surface . . . . . . . . . . . . . . . . . . . . . . . . . . . 9
2.1. Contact angle definition . . . . . . . . . . . . . . . . . . . . . . . . . . . . . . . . . . . . . . . . . . . . . . . . . . . . . . . . . . . 92.2. Heterogeneous interfaces and the Wenzel and Cassie–Baxter equations . . . . . . . . . . . . . . . . . . . 102.2.1. Limitations of the Wenzel and Cassie equations . . . . . . . . . . . . . . . . . . . . . . . . . . . . . . . 142.2.2. Range of applicability of the Wenzel and Cassie equations . . . . . . . . . . . . . . . . . . . . . . . 16
2.3. Contact angle hysteresis . . . . . . . . . . . . . . . . . . . . . . . . . . . . . . . . . . . . . . . . . . . . . . . . . . . . . . . . . . 192.4. Stability of a composite interface and role of hierarchical structure . . . . . . . . . . . . . . . . . . . . . . . 202.5. The Cassie–Baxter and Wenzel wetting regime transition . . . . . . . . . . . . . . . . . . . . . . . . . . . . . . . 23
3. Lotus effect surfaces in nature . . . . . . . . . . . . . . . . . . . . . . . . . . . . . . . . . . . . . . . . . . . . . . . . . . . . . . . . . . 26
3.1. Plant leaves . . . . . . . . . . . . . . . . . . . . . . . . . . . . . . . . . . . . . . . . . . . . . . . . . . . . . . . . . . . . . . . . . . . . 263.2. Characterization of superhydrophobic and hydrophilic leaf surfaces . . . . . . . . . . . . . . . . . . . . . . 273.2.1. Experimental techniques . . . . . . . . . . . . . . . . . . . . . . . . . . . . . . . . . . . . . . . . . . . . . . . . . . 273.2.2. SEM micrographs . . . . . . . . . . . . . . . . . . . . . . . . . . . . . . . . . . . . . . . . . . . . . . . . . . . . . . . . 273.2.3. Contact angle measurements. . . . . . . . . . . . . . . . . . . . . . . . . . . . . . . . . . . . . . . . . . . . . . . 283.2.4. Surface characterization using an optical profiler . . . . . . . . . . . . . . . . . . . . . . . . . . . . . . 303.2.5. Surface characterization, adhesion and friction using an AFM . . . . . . . . . . . . . . . . . . . . 323.2.6. Role of the hierarchical roughness . . . . . . . . . . . . . . . . . . . . . . . . . . . . . . . . . . . . . . . . . . 36
4. How to make a surface for superhydrophobicity, self-cleaning, low adhesion, and drag reduction. . . . 37
4.1. Roughening to create one-level structure . . . . . . . . . . . . . . . . . . . . . . . . . . . . . . . . . . . . . . . . . . . . 394.2. Coating to create one-level hydrophobic structures . . . . . . . . . . . . . . . . . . . . . . . . . . . . . . . . . . . . 404.3. Methods to create two-level (hierarchical) structures . . . . . . . . . . . . . . . . . . . . . . . . . . . . . . . . . . 415. Fabrication and characterization of micro-, nano- and hierarchical structured surfaces. . . . . . . . . . . . . 42
5.1. Experimental techniques . . . . . . . . . . . . . . . . . . . . . . . . . . . . . . . . . . . . . . . . . . . . . . . . . . . . . . . . . 425.1.1. Contact angle, surface roughness, and adhesion. . . . . . . . . . . . . . . . . . . . . . . . . . . . . . . . 425.1.2. Droplet evaporation studies. . . . . . . . . . . . . . . . . . . . . . . . . . . . . . . . . . . . . . . . . . . . . . . . 435.1.3. Bouncing droplet studies . . . . . . . . . . . . . . . . . . . . . . . . . . . . . . . . . . . . . . . . . . . . . . . . . . 435.1.4. Vibrating droplet studies . . . . . . . . . . . . . . . . . . . . . . . . . . . . . . . . . . . . . . . . . . . . . . . . . . 435.1.5. Microdroplet condensation and evaporation studies using ESEM . . . . . . . . . . . . . . . . . . 435.1.6. Generation of submicron droplets . . . . . . . . . . . . . . . . . . . . . . . . . . . . . . . . . . . . . . . . . . . 445.1.7. Waterfall/jet tests . . . . . . . . . . . . . . . . . . . . . . . . . . . . . . . . . . . . . . . . . . . . . . . . . . . . . . . . 465.1.8. Wear and friction tests. . . . . . . . . . . . . . . . . . . . . . . . . . . . . . . . . . . . . . . . . . . . . . . . . . . . 47
5.2. Micro- and nanopatterned polymers . . . . . . . . . . . . . . . . . . . . . . . . . . . . . . . . . . . . . . . . . . . . . . . . 47
5.2.1. Contact angle measurements. . . . . . . . . . . . . . . . . . . . . . . . . . . . . . . . . . . . . . . . . . . . . . . 485.2.2. Effect of submicron droplet . . . . . . . . . . . . . . . . . . . . . . . . . . . . . . . . . . . . . . . . . . . . . . . . 495.2.3. Scale dependence on adhesive force . . . . . . . . . . . . . . . . . . . . . . . . . . . . . . . . . . . . . . . . . 505.3. Micropatterned Si surfaces . . . . . . . . . . . . . . . . . . . . . . . . . . . . . . . . . . . . . . . . . . . . . . . . . . . . . . . . 51
5.3.1. Cassie–Baxter and Wenzel transition criteria . . . . . . . . . . . . . . . . . . . . . . . . . . . . . . . . . . 525.3.2. Contact angle measurements. . . . . . . . . . . . . . . . . . . . . . . . . . . . . . . . . . . . . . . . . . . . . . . 545.3.3. Observation of transition during the droplet evaporation . . . . . . . . . . . . . . . . . . . . . . . . 575.3.4. Scaling of the Cassie–Baxter and Wenzel transition for different series . . . . . . . . . . . . . 595.3.5. Contact angle hysteresis and wetting/dewetting asymmetry . . . . . . . . . . . . . . . . . . . . . 605.3.6. Observation of transition during the bouncing droplet . . . . . . . . . . . . . . . . . . . . . . . . . . 635.3.7. Observation and measurement of contact angle using ESEM . . . . . . . . . . . . . . . . . . . . . 675.4. Ideal surfaces with hierarchical structure . . . . . . . . . . . . . . . . . . . . . . . . . . . . . . . . . . . . . . . . . . . . 695.5. Hierarchical structured surfaces with wax platelets and tubules . . . . . . . . . . . . . . . . . . . . . . . . . 69
5.5.1. Nanostructures with various platelet crystal densities . . . . . . . . . . . . . . . . . . . . . . . . . . 755.5.2. The influence of hierarchical structure with wax platelets on the superhydrophobicity 775.5.3. The influence of hierarchical structure with wax tubules on the superhydrophobicity 805.5.4. Self-cleaning efficiency of hierarchical structured surfaces . . . . . . . . . . . . . . . . . . . . . . . 865.5.5. Observation of transition during the bouncing droplet . . . . . . . . . . . . . . . . . . . . . . . . . . 865.5.6. Observation of transition during the vibrating droplet . . . . . . . . . . . . . . . . . . . . . . . . . . 88
5.6. Mechanically durable CNT-composite hierarchical structured surfaces. . . . . . . . . . . . . . . . . . . . . 93

B. Bhushan, Y.C. Jung / Progress in Materials Science 56 (2011) 1–108 3
5.6.1. The influence of CNT-composite hierarchical structure on the superhydrophobicity . . 965.6.2. Durability of various surfaces in waterfall/jet tests . . . . . . . . . . . . . . . . . . . . . . . . . . . . . 965.6.3. Durability of various surfaces in AFM and ball-on-flat tribometer tests. . . . . . . . . . . . . 99
6. Closure . . . . . . . . . . . . . . . . . . . . . . . . . . . . . . . . . . . . . . . . . . . . . . . . . . . . . . . . . . . . . . . . . . . . . . . . . . . . 102References . . . . . . . . . . . . . . . . . . . . . . . . . . . . . . . . . . . . . . . . . . . . . . . . . . . . . . . . . . . . . . . . . . . . . . . . . 103
1. Introduction
Biologically inspired design, adaptation, or derivation from nature is referred to as ‘biomimetics.’ Itmeans mimicking biology or nature. Biomimetics is derived from the Greek word biomimesis. Theword was coined by polymath Otto Schmitt in 1957, who, in his doctoral research, developed a phys-ical device that mimicked the electrical action of a nerve. Other words used include bionics (coined in1960 by Jack Steele of Wright-Patterson Air Force Base in Dayton, OH), biomimicry, and biognosis. Thefield of biomimetics is highly interdisciplinary. It involves the understanding of biological functions,structures, and principles of various objects found in nature by biologists, physicists, chemists, andmaterial scientists, and the design and fabrication of various materials and devices of commercialinterest by engineers, material scientists, chemists, and others. The word biomimetics first appearedin Webster’s dictionary in 1974 and is defined as ‘the study of the formation, structure or function ofbiologically produced substances and materials (as enzymes or silk) and biological mechanisms andprocesses (as protein synthesis or photosynthesis) especially for the purpose of synthesizing similarproducts by artificial mechanisms which mimic natural ones’ [22].
Nature has gone through evolution over the 3.8 Gyr since life is estimated to have appeared on theEarth [83]. Nature has evolved objects with high performance using commonly found materials. Thesefunction on the macroscale to the nanoscale. The understanding of the functions provided by objectsand processes found in nature can guide us to imitate and produce nanomaterials, nanodevices, andprocesses [22].
There are a large number of objects, including bacteria, plants, land and aquatic animals, and sea-shells, with properties of commercial interest. Fig. 1 shows a montage of some examples from nature[22]. Some leaves of water-repellent plants, such as Nelumbo nucifera (Lotus), are known to be super-hydrophobic and self-cleaning due to hierarchical roughness (microbumps superimposed with ananostructure) and the presence of a hydrophobic wax coating [143,10,196,47,25,22,116,118]. Waterdroplets on these surfaces readily sit on the apex of nanostructures because air bubbles fill in the val-leys of the structure under the droplet. Therefore, these leaves exhibit considerable superhydrophob-icity (Fig. 1a). Two strategies used for catching insects by plants for digestion are having stickysurfaces or sliding structures. As an example, for catching insects using sticky surfaces, the glandsof the carnivorous plants of the genus Pinguicula (butterworts) and Drosera (sundew), shown inFig. 1b, secrete adhesives and enzymes to trap and digest small insects, such as mosquitoes and fruitflies [118]. Pond skaters (Gerris remigis) have the ability to stand and walk upon a water surface with-out getting wet (Fig. 1c). Even the impact of rain droplets with a size greater than the pond skater’ssize does not make it immerse in the water. Gao and Jiang [77] showed that the special hierarchicalstructure of the pond skater’s legs, which are covered by large numbers of oriented tiny hairs(microsetae) with fine nanogrooves and covered with cuticle wax, makes the leg surfaces superhydro-phobic, is responsible for the water resistance, and enables them to stand and walk quickly on thewater surface. A gecko is the largest animal that can produce high (dry) adhesion to support its weightwith a high factor of safety. Gecko skin is comprised of a complex hierarchical structure of lamellae,setae, branches, and spatula [4,80,19]. The attachment pads on two feet of the Tokay gecko have anarea of approximately 220 mm2 (Fig. 1d). Approximately 3 � 106 setae on their toes can produce aclinging ability of approximately 20 N (vertical force required to pull a lizard down a nearly vertical(85�) surface) and allow them to climb vertical surfaces at speeds of over 1 m/s, with the capabilityto attach or detach their toes in milliseconds [19]. Shark skin, which is a model from nature for alow drag surface, is covered by very small individual tooth-like scales called dermal denticles (littleskin teeth), ribbed with longitudinal grooves (aligned parallel to the local flow direction of the water).

Fig. 1. Montage of some examples from nature: (a) Lotus effect [34], (b) glands of carnivorous plant secrete adhesive to trapinsects [118], (c) pond skater walking on water [77], (d) gecko foot exhibiting reversible adhesion [80], (e) scale structure ofshark reducing drag [176], (f) wings of a bird in landing approach, (g) spiderweb made of silk material [8], and (h) antireflectivemoth’s eye [82].
4 B. Bhushan, Y.C. Jung / Progress in Materials Science 56 (2011) 1–108
These grooved scales reduce the formation of vortices present on a smooth surface, resulting in watermoving efficiently over their surface [12]. An example of scale structure on the right front of a Gala-pagos shark (Carcharhinus galapagensis) is shown in Fig. 1e [176]. Birds consist of several consecutiverows of covering feathers on their wings, which are flexible (Fig. 1f). These movable flaps develop thelift. When a bird lands, a few feathers are deployed in front of the leading edges of the wings, whichhelp to reduce the drag on the wings. The spider generates silk fiber and has a sufficient supply of rawmaterial for its silk to span great distances [97,8]. Spiderweb is a structure built of a one-dimensionalfiber (Fig. 1g). The fiber is very strong and continuous and is insoluble in water. The web can hold asignificant amount of water droplets, and it is resistant to rain, wind, and sunlight [180,8]. The eyesof moths are antireflective to visible light and consist of hundreds of hexagonally organized nanoscop-ic pillars, each approximately 200 nm in diameter and height, which result in a very low reflectancefor visible light (Fig. 1h) [82,141]. These nanostructures’ optical surfaces make the eye surface nearlyantireflective in any direction.
This article focuses on water-repellent surfaces such as the Lotus leaf (Fig. 1a), which exhibitssuperhydrophobicity, self-cleaning, low adhesion, and drag reduction.

B. Bhushan, Y.C. Jung / Progress in Materials Science 56 (2011) 1–108 5
1.1. Definitions and applications
The primary parameter that characterizes wetting is the static contact angle, which is defined asthe angle that a liquid makes with a solid. The contact angle depends on several factors, such as sur-face energy, surface roughness, and its cleanliness [2,92,15,17,21,157]. If the liquid wets the surface(referred to as wetting liquid or hydrophilic surface), the value of the static contact angle is0 6 h 6 90�, whereas if the liquid does not wet the surface (referred to as a non-wetting liquid orhydrophobic surface), the value of the contact angle is 90� < h 6 180�. The term hydrophobic/philic,which was originally applied only to water (‘‘hydro-” means ‘‘water” in Greek), is often used to de-scribe the contact of a solid surface with any liquid. The term ‘‘oleophobic/philic” is used with regardto wetting by oil and organic liquids. The term ‘‘amphiphobic/philic” is used for surfaces that are bothhydrophobic/philic and oleophobic/philic. Surfaces with high energy, formed by polar molecules, tendto be hydrophilic, whereas those with low energy and built of non-polar molecules tend to behydrophobic.
Surfaces with a contact angle of less than 10� are called superhydrophilic, while surfaces with acontact angle between 150� and 180� are called superhydrophobic. In fluid flow, in order to havelow drag and for applications requiring the self-cleaning feature, in addition to the high contact angle,superhydrophobic surfaces should also have very low water contact angle hysteresis. Water dropletsroll off (with some slip) on these surfaces and take contaminants with them, providing the self-clean-ing ability known as the ‘‘Lotus effect.” The contact angle at the front of the droplet (advancing contactangle) is greater than that at the back of the droplet (receding contact angle), resulting in contact anglehysteresis (CAH), which is the difference between the advancing and receding contact angles, repre-senting two stable values. It occurs due to surface roughness and surface heterogeneity. Contact anglehysteresis reflects the irreversibility of the wetting/dewetting cycle. It is a measure of energy dissipa-tion during the flow of a droplet along a solid surface. At a low value of CAH, the droplets may roll inaddition to slide, which facilitates removal of contaminant particles. Surfaces with low contact anglehysteresis have a low water roll-off (tilt) angle, which denotes the angle to which a surface must betilted for roll off of water drops [72,110,27,153,157–159,33]. Surfaces with CAH or a low tilting angleof less than <10� are generally referred to as self-cleaning surfaces. Self-cleaning surfaces are of inter-est in various applications, including self-cleaning windows, windshields, exterior paints for buildingsand navigation ships, utensils, roof tiles, textiles, solar panels, and applications requiring anti-foulingand a reduction of drag in fluid flow, e.g., in micro/nanochannels.
Superhydrophobic surfaces can also be used for energy conservation and conversion [164–166]. Re-cent advances in superhydrophobic surfaces make such applications possible. Several concepts can beused. First, the hydrophobic/philic properties of a surface significantly affect the capillary adhesionforce that, in turn, affects friction and energy dissipation during the sliding contact of solid surfaces.Selection of a proper superhydrophobic surface allows the reduction of energy dissipation. Second,superhydrophobic and superoleophobic surfaces can be used for fuel economy. Third, the recently dis-covered effect of reversible superhydrophobicity provides potential for new ways of energy conver-sion such as the microscale capillary engine.
Wetting may lead to the formation of concave shaped menisci at the interface between hydrophilicsolid bodies during static or sliding contact. These menisci develop a negative pressure leading to anintrinsic attractive force which increases adhesion and friction (Fig. 2). In some cases, the wet friction
Fig. 2. A schematic diagram of condensed water vapor from the environment forming meniscus bridges at asperity contactswhich lead to an intrinsic attractive force.

6 B. Bhushan, Y.C. Jung / Progress in Materials Science 56 (2011) 1–108
force can be greater than the dry friction force, which is usually undesirable [15,17,18,20,21]. On theother hand, high adhesion is desirable in some applications, such as adhesive tapes and adhesion ofcells to biomaterial surfaces; therefore, enhanced wetting would be desirable in these applications.Numerous applications, such as magnetic storage devices and micro/nanoelectromechanical systems(MEMS/NEMS), require surfaces with low adhesion and stiction [28,13,14,16,18,20,21]. As the size ofthese devices decreases, surface forces tend to dominate over the volume forces, and adhesion andstiction constitute a challenging problem for proper operation of these devices. This makes the devel-opment of superhydrophobic surfaces with non-adhesive characteristics crucial for many of theseemerging applications.
1.2. Natural superhydrophobic, self-cleaning, low adhesion, and drag reduction surfaces
In the 1990s, biologists and materials scientists started to study natural superhydrophobic sur-faces. Among them are the leaves of water-repellent plants such as Nelumbo nucifera (Lotus) andColocasia esculenta, which have high contact angles with water (Fig. 3) [143,10,196,47,25,22,116,118]. The leaf surface is very rough due to so-called papillose epidermal cells, which form papillaeor microasperties. In addition to the microscale roughness, the surface of the papillae is also rough,with nanoscale asperities composed of three-dimensional epicuticular waxes which are long chainhydrocarbons and hydrophobic. The waxes of Lotus exist as tubules, but on other leaves, waxes existalso in the form of platelets or other morphologies [116,118]. The hierarchical structure of these leaveshas been studied by Burton and Bhushan [47] and Bhushan and Jung [25]. The water droplets on thesesurfaces readily sit on the apex of the nanostructures because air bubbles fill in the valleys of thestructure under the droplet. Therefore, these leaves exhibit considerable superhydrophobicity. Staticcontact angle and contact angle hysteresis of a Lotus leaf are about 164� and 3�, respectively[34,119]. The water droplets on the leaves remove any contaminant particles from their surfaces whenthey roll off, leading to self-cleaning [143]. It has been reported that all superhydrophobic and self-cleaning leaves consist of an intrinsic hierarchical structure [116,118]. Hierarchical structure providesair pocket formation, leading to the lowest contact area of an applied water droplet (Fig. 4), resultingin the reduction of contact angle hysteresis, tilt angle, and adhesive force [27,157,34]. Other examples
Fig. 3. SEM micrographs (shown at three magnifications) of Lotus (Nelumbo nucifera) leaf surface which consists ofmicrostructure formed by papillose epidermal cells covered with 3-D epicuticular wax tubules on surface, which createnanostructure, and image of water droplet sitting on the Lotus leaf [34].

Fig. 4. Schematic and wetting of the four different surfaces. The largest contact area between the droplet and the surface isgiven in flat and microstructured surfaces, but is reduced in nanostructured surfaces and is minimized in hierarchical structuredsurfaces.
B. Bhushan, Y.C. Jung / Progress in Materials Science 56 (2011) 1–108 7
of biological objects include water striders (Gerris remigis) [77] and mosquito (Culex pipiens) eyes [81].Their hierarchical structures are responsible for superhydrophobicity. Duck feathers and butterflywings also provide superhydrophobicity [22]. Their corrugated surfaces provide air pockets that pre-vent water from completely touching the surface.
1.3. Roughness-induced superhydrophobicity, self-cleaning, low adhesion, and drag reduction
One of the ways to increase the hydrophobic or hydrophilic properties of a surface is to increasesurface roughness, so roughness-induced hydrophobicity or hydrophilicity has become the subjectof extensive investigations. Wenzel [199] suggested a simple model predicting that the contact angleof a liquid with a rough surface is different from that with a smooth surface. Cassie and Baxter [49]showed that a gaseous phase including water vapor, commonly referred to as ‘‘air” in the literature,may be trapped in the cavities of a rough surface, resulting in a composite solid–liquid–air interface,as opposed to the homogeneous solid–liquid interface. These two models describe two possiblewetting regimes or states: the homogeneous (Wenzel) and the composite (Cassie–Baxter) regimes.Johnson and Dettre [99] showed that the homogeneous and composite interfaces correspond to thetwo equilibrium states of a droplet. Many authors have investigated the stability of artificial superhy-drophobic surfaces and showed that whether the interface is homogeneous or composite may dependon the history of the system, in particular whether the liquid was applied from the top or condensed atthe bottom [38,134,135,125,168,87]. Extrand [72] pointed out that whether the interface ishomogeneous or composite depends on roughness structure and droplet size. It has also been sug-gested that the hierarchical roughness, composed by superposition of two roughness patterns at dif-ferent length scales [88,169,189,153–159,162,165,166], and fractal roughness [184,159] may enhancesuperhydrophobicity.
Herminghaus [88] showed that certain self-affine profiles may result in superhydrophobic surfaceseven for wetting liquids, if the local equilibrium condition for the triple line (line of contact betweensolid, liquid and air) is satisfied. Nosonovsky and Bhushan [150,151] pointed out that such configura-tions, although formally possible, are likely to be unstable. Nosonovsky and Bhushan [151,152] pro-posed a probabilistic model for wetting of rough surfaces with a certain probability associated withevery equilibrium state. According to their model, the overall contact angle with a two-dimensionalrough profile is calculated by assuming that the overall configuration of a droplet occurs as a resultof superposition of numerous metastable states. The probability-based concept is consistent withthe experimental data [26,27,30–32,34–36,101–103,105,119], which suggests that the transition be-tween the composite and homogeneous interfaces is gradual, rather than instant. Nosonovsky andBhushan [153,154,156–163] have identified mechanisms which lead to the destabilization of the com-posite interface, namely the capillary waves, condensation and accumulation of nanodroplets, and sur-face inhomogeneity. These mechanisms are scale dependent, with different characteristic lengthscales. To effectively resist these scale-dependent mechanisms, a multiscale (hierarchical) roughnessis required. High asperities resist the capillary waves, while nanobumps prevent nanodroplets fromfilling the valleys between asperities and pin the tripe line in case of a hydrophilic spot.

8 B. Bhushan, Y.C. Jung / Progress in Materials Science 56 (2011) 1–108
Various criteria have been formulated to predict the transitions from a metastable composite stateto a wetted state. Extrand [74] formulated the transition criterion referred to as the contact line den-sity criterion, which was obtained by balancing the droplet weight and the surface forces along thecontact line. Patankar [168] proposed a transition criterion based on energy balance. There is an en-ergy barrier in going from a higher energy Cassie–Baxter droplet to a lower energy Wenzel droplet.The most probable mechanism is that the decrease in the gravitational potential energy during thetransition helps in overcoming the energy barrier. This energy barrier was estimated by consideringan intermediate state in which the water fills the grooves below the contact area of a Cassie–Baxterdroplet but the liquid–solid contact is yet to be formed at the bottom of the valleys. These criteriawere tested on selected experiments from the literature [37,167,204,87]. Bhushan et al. [30] and Noso-novsky and Bhushan [155,156] found that the transition occurs at a critical value of the spacing factor,a non-dimensional parameter which is defined as the diameter of the pillars divided by the pitch dis-tance between them for patterned surfaces and its ratio to the droplet size. Bhushan and Jung [26,27],Jung and Bhushan [101–103] proposed the transition criterion based on the pitch distance betweenthe pillars and the curvature of the droplet governed by the Laplace equation, which relates thepressure inside the droplet to its curvature. In addition, the transition can occur by applying externalpressure to the droplet, or by the impact of a droplet on the patterned surfaces [178,125,11,177,103,105,163].
Contact angle on selected patterned surfaces has been measured to understand how the transitionbetween the Cassie–Baxter regime and Wenzel regime occurs. Evaporation studies are useful in char-acterizing the wetting behavior because droplets with various sizes can be created to evaluate thetransition criterion on a given patterned surface [43,179,69,138,101,102,153,155,158,160,161,31,34,35,36]. It has been reported that the wetting state changes from the Cassie–Baxter to Wenzelstate as the droplet becomes smaller than a critical value on patterned surfaces during evaporation.Another important phenomenon related to wetting behavior is the bouncing of droplets. When a drop-let hits a surface, it can bounce, spread, or stick. In practical applications of superhydrophobic surfaces,surfaces should maintain their ability to repel penetrating droplets under dynamic conditions. Jungand Bhushan [103] and Nosonovsky and Bhushan [163] showed that the transition can occur by theimpact of a droplet on a given patterned surface at a critical velocity with a critical geometricparameter.
An environmental scanning electron microscope (ESEM) can be used to condense or evaporatewater droplets on surfaces by adjusting the pressure of the water vapor in the specimen chamberand the temperature of the cooling stage. Transfer of the water droplet has been achieved by a spe-cially designed micro-injector device on wool fibers and then imaged at room temperature in ESEM[63]. Images of water droplets show strong topographic contrast in ESEM such that reliable contactangle measurements can be made on the surfaces [188]. Water condensation and evaporation studieson patterned surfaces were carried out by Jung and Bhushan [102] and Nosonovsky and Bhushan[153,155,158,160,161] where the change of static contact angle and contact angle hysteresis was re-lated with the surface roughness.
It has been demonstrated experimentally that roughness changes contact angle in accordance withthe Wenzel model or Cassie–Baxter model, dependent upon whether the surface is hydrophilic orhydrophobic. Yost et al. [205] found that roughness enhances wetting of a copper surface with Sn–Pb eutectic solder, which has a contact angle of 15–20� for a smooth surface. Shibuichi et al. [184]measured the contact angle of various liquids (mixtures of water and 1,4-dioxane) on alkylketenedimmer (AKD) substrate (contact angle not larger than 109� for a smooth surface). They found thatfor wetting liquids, the contact angle decreases with increasing roughness, whereas for non-wettingliquids it increases. Semal et al. [181] investigated the effect of surface roughness on contact anglehysteresis by studying a sessile droplet of squalane spreading dynamically on multilayer substrates(behenic acid on glass) and found an increase in microroughness slows the rate of droplet spread. Erbilet al. [70] measured the contact angle of polypropylene (contact angle of 104� for smooth surface) andfound that the contact angle increases with increasing roughness. Burton and Bhushan [46] measuredcontact angle with roughness of patterned surfaces and found that in the case of hydrophilic surfaces,it decreases with increasing roughness, and for hydrophobic surfaces, it increases with increasingroughness. Bhushan and Jung [26,27], Jung and Bhushan [100–103], Bhushan et al. [30–32,34–36],

B. Bhushan, Y.C. Jung / Progress in Materials Science 56 (2011) 1–108 9
and Koch et al. [119] studied the influence of micro-, nano- and hierarchical structures, created by rep-lication of micropatterns and by self-assembly of hydrophobic alkanes and plant wax, on static contactangle, contact angle hysteresis, tilt angle and air pocket formation, adhesive force as well as efficiencyof self-cleaning. They showed that for micro-, nano- and hierarchical structures, the introduction ofroughness increased the hydrophobicity of the surfaces. A hierarchical structure composed of a micro-structure with a superimposed nanostructure of hydrophobic waxes led to superhydrophobicity withstatic contact angles of 173� and low contact angle hysteresis of 2�. Jung and Bhushan [106] producedmechanically durable carbon nanotubes (CNT) composite hierarchical structures with a static contactangle of 170� and a contact angle hysteresis of 2� by replication of a micropatterned silicon surfaceusing an epoxy resin and by deposition of the CNT composite using a spray method. They showed thatthe CNT composite structure had high mechanical strength and wear resistance from the uniform dis-tribution and strong bonding of CNT on substrates.
1.4. Scope of the article
In this article, numerical models which provide relationships between roughness and contact angleand contact angle hysteresis as well as the Cassie–Baxter and Wenzel regime transition are discussed.The role of microbumps and nanobumps is examined by analyzing the surface characterization ofhydrophobic and hydrophilic leaves on the micro- and nanoscale. Along with measuring and charac-terizing surface roughness, the contact angle and adhesion and friction properties of these leaves arealso considered. The knowledge gained by examining these properties of the leaves and by quantita-tively analyzing the surface structure will help in the design of superhydrophobic and self-cleaningsurfaces. Next, the techniques of producing superhydrophobic surfaces are described. Micro-, nano-and hierarchical patterned structures have been fabricated using soft lithography, photolithography,and techniques which involve the replication of micropatterns, self-assembly of hydrophobic alkanesand plant waxes, and a spray coating of carbon nanotubes. They have been characterized to validatethe models and to provide design guidelines for superhydrophobic and self-cleaning surfaces. To fur-ther examine the effect of meniscus force and real area of contact, scale dependence is considered withthe use of AFM tips of various radii. To investigate how the effects of droplet size and impact velocityinfluence the transition, evaporation and bouncing studies are conducted on silicon surfaces patternedwith pillars of two different diameters and heights and with varying pitch values and deposited with ahydrophobic coating. In order to generate submicron droplets, an atomic force microscopy-basedtechnique using a modified nanoscale dispensing probe is presented. An ESEM study on the wettingbehavior for a microdroplet with about 20 lm radius on the micropatterned Si surfaces is presented.For the durability of the various fabricated surfaces, the loss of superhydrophobicity as well as wearand friction is investigated.
2. Modeling of contact angle for a liquid in contact with a rough surface
2.1. Contact angle definition
The surface atoms or molecules of liquids or solids have fewer bonds with neighboring atoms, andtherefore, they have higher energy than similar atoms and molecules in the interior. This additionalenergy is characterized quantitatively by the surface tension or free surface energy c, which is equalto the work that is required to create a unit area of the surface at a constant pressure and temperature.The unit of c is J/m2 or N/m, and it can be interpreted either as energy per unit surface area or as ten-sion force per unit length of a line at the surface. When a solid is in contact with liquid, the molecularattraction will reduce the energy of the system below that for the two separated surfaces. This is ex-pressed by the Dupré equation
WSL ¼ cSA þ cLA � cSL ð1Þ
where WSL is the work of adhesion per unit area, cSA and cSL are the surface energies of the solid againstair and liquid, and cLA is the surface energy of liquid against air [2,92,15].

10 B. Bhushan, Y.C. Jung / Progress in Materials Science 56 (2011) 1–108
If a liquid droplet is placed on a solid surface, the liquid and solid surfaces come together underequilibrium at a characteristic angle called the static contact angle h0 (Fig. 5). This contact anglecan be determined by minimizing the net surface free energy of the system [2,92,15]. The total energyEtot is given by [150,157]
Etot ¼ cLAðALA þ ASLÞ �WSLASL ð2Þ
where ASL and ALA are the contact areas of the liquid with the solid and air, respectively. It is assumedthat the droplet of density q is smaller than the capillary length, (cLA/qg)1/2, so that the gravitationalpotential energy can be neglected. It is also assumed that the volume and pressure are constant, sothat the volumetric energy does not change. At the equilibrium dEtot = 0, which yields
cLAðdALA þ dASLÞ �WSLdASL ¼ 0 ð3Þ
For a droplet of constant volume, it is easy to show using geometrical considerations, that
dALA=dASL ¼ cos h0 ð4Þ
Combining Eqs. (1), (3), and (4), the well-known Young equation for the contact angle is obtained
cos h0 ¼cSA � cSL
cLAð5Þ
Eq. (5) provides an expression for the static contact angle for given surface energies. Note thatalthough we use the term ‘‘air,” the analysis does not change in the case of another gas, such as watervapor.
2.2. Heterogeneous interfaces and the Wenzel and Cassie–Baxter equations
In this section, we introduce and discuss the equations that govern the contact angle of liquid witha rough surface and heterogeneous interface.
We first consider a water droplet on a rough surface with a homogeneous interface. The interfacearea increases with respect to that for a smooth surface. Using the surface force balance and empiricalconsiderations, the contact angle of a water droplet upon a rough solid surface, h, is related to thatupon a smooth surface, h0 for a homogeneous interface (Fig. 6a), through the non-dimensional surfaceroughness factor, Rf > 1, equal to the ratio of the surface area, ASL, to its flat projected area, AF [199]
cos h ¼ dALA
dAF¼ ASL
AF
dALA
dASL¼ Rf cos h0 ð6Þ
where
Rf ¼ASL
AFð7Þ
This is called the Wenzel equation. The dependence of the contact angle on the roughness factor ispresented in Fig. 7a for different values of h0. The Wenzel model predicts that a hydrophobic surface(h0 > 90�) becomes more hydrophobic with an increase in Rf, while a hydrophilic surface (h0 < 90�)
Fig. 5. Schematic of liquid droplet in contact with a smooth solid surface (contact angle, h0).

Fig. 6. Schematics of configurations described by the (a) Wenzel equation for the homogeneous interface (Eq. (6)), (b) Cassie–Baxter equation for the composite interface with air pockets (Eq. (9)), and (c) the Cassie equation for the homogeneous interface(Eq. (10)) [160].
B. Bhushan, Y.C. Jung / Progress in Materials Science 56 (2011) 1–108 11
becomes more hydrophilic with an increase in Rf [150,100]. As an example, Fig. 7b shows a geometrywith square-based hemispherically-topped pyramidal asperities with a rounded top, which has com-plete packing. The size and shape of the asperities can be optimized for a desired roughness factor.
In a similar manner, for a surface composed of two fractions, one with the fractional area f1 and thecontact angle h1 and the other with f2 and h2, respectively (so that f1 + f2 = 1), the contact angle for theheterogeneous interface is given by the Cassie equation [49]
cos h ¼ f1 cos h1 þ f2 cos h2 ð8Þ
For the case of a composite interface (Fig. 6b), consisting of a solid–liquid fraction (f1 = fSL, h1 = h0)and liquid–air fraction (f2 = fLA = 1 � fSL, cos h2 = �1), combining Eqs. (7) and (8) yields the Cassie–Bax-ter equation [49]
cos h ¼ Rf f SL cos h0 � 1þ fSL
or cos h ¼ Rf cos h0 � fLAðRf cos h0 þ 1Þð9Þ
The opposite limiting case of cos h2 = 1 (h2 = 0� corresponds to the water-on-water contact) yieldsthe Cassie equation [157,160]
cos h ¼ 1þ fSLðcos h0 � 1Þ ð10Þ
Eq. (10) is used sometimes for the homogeneous interface instead of Eq. (6), if the rough surface iscovered by holes filled with water [65] (Fig. 6c).

Fig. 7. (a) Contact angle for rough surface (h) as a function of the roughness factor (Rf) for various contact angles of the smoothsurface (h0), and (b) schematic of square-based hemispherically-topped pyramidal asperities with complete packing [150].
12 B. Bhushan, Y.C. Jung / Progress in Materials Science 56 (2011) 1–108
Two situations in wetting of a rough surface should be distinguished: the homogeneous interfacewithout any air pockets shown in Fig. 6a (called the Wenzel interface, since the contact angle is givenby the Wenzel equation or Eq. (6)), and the composite interface with air pockets trapped between therough details as shown in Fig. 6b (called the Cassie or Cassie–Baxter interface, since the contact angleis given by Eq. (9)).
Eq. (9) for the composite interface was derived using Eqs. (6) and (8), and it could also be obtainedindependently. For this purpose, two sets of interfaces are considered: a liquid–air interface with theambient and a flat composite interface under the droplet, which itself involves solid–liquid, liquid–air,and solid–air interfaces. For fractional flat geometrical areas of the solid–liquid and liquid–airinterfaces under the droplet, fSL and fLA (fSL = 1 � fLA), the flat area of the composite interface is[150,157]
AF ¼ fSLAF þ fLAAF ¼ Rf ASL þ fLAAF ð11Þ
In order to calculate the contact angle in a manner similar to the derivation of Eq. (6), the differen-tial area of the liquid–air interface under the droplet, fLAdAF, should be subtracted from the differentialof the total liquid–air area dALA, which yields the Cassie–Baxter equation (Eq. (9)),
cos h ¼ dALA � fLAdAF
dAF¼ ASL
AF
dALA
dASL� fLA ¼ Rf f SL cos h0 � fLA ¼ Rf cos h0 � fLAðRf cos0 þ 1Þ
The dependence of the contact angle on the roughness factor and fractional liquid–air area forhydrophilic and hydrophobic surfaces with a composite interface (Fig. 8a) is presented in Fig. 8b.

Fig. 8. (a) Schematic of formation of a composite solid–liquid–air interface for rough surface, (b) contact angle for rough surface(h) as a function of the roughness factor (Rf) for various fLA values on the hydrophilic surface and the hydrophobic surface, and(c) fLA requirement for a hydrophilic surface to be hydrophobic as a function of the roughness factor (Rf) and h0 [100].
B. Bhushan, Y.C. Jung / Progress in Materials Science 56 (2011) 1–108 13
According to Eq. (9), even for a hydrophilic surface, the contact angle increases with an increase offLA. At a high value of fLA, a surface can become hydrophobic; however, the value required may be

14 B. Bhushan, Y.C. Jung / Progress in Materials Science 56 (2011) 1–108
unachievable, or the formation of air pockets may become unstable. Using the Cassie–Baxter equa-tion, the value of fLA at which a hydrophilic surface could turn into a hydrophobic one is given as[100]
fLA PRf cos h0
Rf cos h0 þ 1for h0 < 90� ð12Þ
Fig. 8c shows the value of fLA requirement as a function of Rf for four surfaces with different contactangles, h0. Hydrophobic surfaces can be achieved above a certain fLA value as predicted by Eq. (12). Theupper part of each contact angle line is the hydrophobic region. For the hydrophobic surface, contactangle increases with an increase in fLA both for smooth and rough surfaces.
Based on Nosonovsky and Bhushan [157,166], spreading of a liquid over a rough solid surface con-tinues until simultaneously Eq. (5) (the Young equation) is satisfied locally at the triple line and thesurface area is minimum over the entire liquid–air interface. The minimal surface area condition statesthat the sum of the inverse of the principal radii of curvature, R1 and R2 of the liquid surface, along thetwo mutually orthogonal planes (mean curvature), is constant at any point, which governs the shapeof the liquid–air interface. The same condition is also the consequence of the Laplace equation, whichrelates pressure change through an interface, DP, with its mean curvature,
1R1þ 1
R2¼ DP
cLAð13Þ
Note that at the thermodynamic equilibrium (when condensation and evaporation occurs at thesame speed), DP is dependent on the partial vapor pressure. For contact with saturated vapor themean curvature of the liquid–air interface is zero at equilibrium. A convex interface (1/R1 + 1/R2 > 0)results in evaporation prevailing over condensation; this is why small droplets tend to evaporate.However, a concave interface (1/R1 + 1/R2 < 0) results in condensation of saturated vapor prevailingover evaporation. Since the condensation prevails, a concave interface may be in thermodynamic equi-librium with undersaturated vapor. This is why concave menisci tend to condense even when the rel-ative humidity is less than 100% [157,166].
2.2.1. Limitations of the Wenzel and Cassie equationsBased on Nosonovsky and Bhushan [157,160], the Cassie equation (Eq. (8)) is based on the assump-
tion that the heterogeneous surface is composed of well-separated distinct patches of different mate-rial, so that the free surface energy can be averaged. It has been argued also that when the size of thechemical heterogeneities is very small (of atomic or molecular dimensions), the quantity that shouldbe averaged is not the energy, but the dipole moment of a macromolecule [93], and Eq. (8) should bereplaced by [160]
ð1þ cos hÞ2 ¼ f1ð1þ cos h1Þ2 þ f2ð1þ cos h2Þ2 ð14Þ
Experimental studies of polymers with different functional groups showed a good agreement withEq. (14) [192].
Based on Nosonovsky and Bhushan [157,160], later investigations put the Wenzel and Cassie equa-tions into a thermodynamic framework; however, they also showed that there is no one single value ofthe contact angle for a rough or heterogeneous surface [99,134,130]. The contact angle can be in arange of values between the receding contact angle, hrec, and the advancing contact angle, hadv. The sys-tem tends to achieve the receding contact angle when liquid is removed (for example, at the rear endof a moving droplet), whereas the advancing contact angle is achieved when the liquid is added (forexample, at the front end of a moving droplet) (Fig. 9a). When the liquid is neither added nor removed,the system tends to have a static or ‘‘most stable” contact angle, which is given approximately by Eqs.(5), (6), (8), and (10).
The contact angle provided by Eqs. (5), (6), (8), and (10) is a macroscale parameter, so it is calledsometimes ‘‘the apparent contact angle.” Based on Nosonovsky and Bhushan [157,159], the actual an-gle, under which the liquid–air interface comes in contact with the solid surface at the micro- andnanoscale, can be different. There are several reasons for that. First, water molecules tend to form a

Fig. 9. (a) Liquid droplet in contact with rough surface with liquid is added or removed (advancing and receding contact anglesare hadv and hrec, respectively) and (b) tilted surface profile (tilt angle, a with a moving liquid droplet).
B. Bhushan, Y.C. Jung / Progress in Materials Science 56 (2011) 1–108 15
thin layer upon the surfaces of many materials. This is because of a long-distance van der Waals adhe-sion force that creates the so-called disjoining pressure [66]. This pressure is dependent upon the li-quid layer thickness and may lead to the formation of stable thin films. In this case, the shape of thedroplet near the triple line (line of contact of the solid, liquid and air, to be shown later in Fig. 11)transforms gradually from the spherical surface into a precursor layer, and thus the nanoscale contactangle is much smaller than the apparent contact angle. In addition, adsorbed water monolayers andmultilayers are common for many materials. Second, even carefully prepared atomically smooth sur-faces exhibit a certain roughness and chemical heterogeneity. Water tends first to cover the hydro-philic spots with high surface energy and low contact angle [52]. The tilt angle due to roughnesscan also contribute to the apparent contact angle. Third, the very concept of the static contact angleis not well defined. For practical purposes, the contact angle, which is formed after a droplet is gentlyplaced upon a surface and stops propagating, is considered the static contact angle. However, depos-iting the droplet involves adding liquid while leaving it involves evaporation, so it is difficult to avoiddynamic effects. Fourth, for small droplets and curved triple lines, the effect of the contact line tensionmay be significant. Molecules at the surface of a liquid or solid phase have higher energy because theyare bonded to fewer molecules than those in the bulk. This leads to surface tension and surface energy.In a similar manner, molecules at the concave surface and, especially, at the edge have fewer bondsthan those at the surface, which leads to line tension and curvature dependence of the surface energy.This effect becomes important when the radius of curvature is comparable with the so-called Tolman’slength, normally of the molecular size [3]. However, the triple line at the nanoscale can be curved sothat the line tension effects become important [171]. The contact angle, taking into account for thecontact line effect, for a droplet with radius R is given by cos h = cos h0 + 2s/(RcLA), where s is the con-tact line tension, and h0 is the value given by the Young equation [42]. Thus while the contact angle is aconvenient macroscale parameter, wetting is governed by interactions at the micro- and nanoscale,
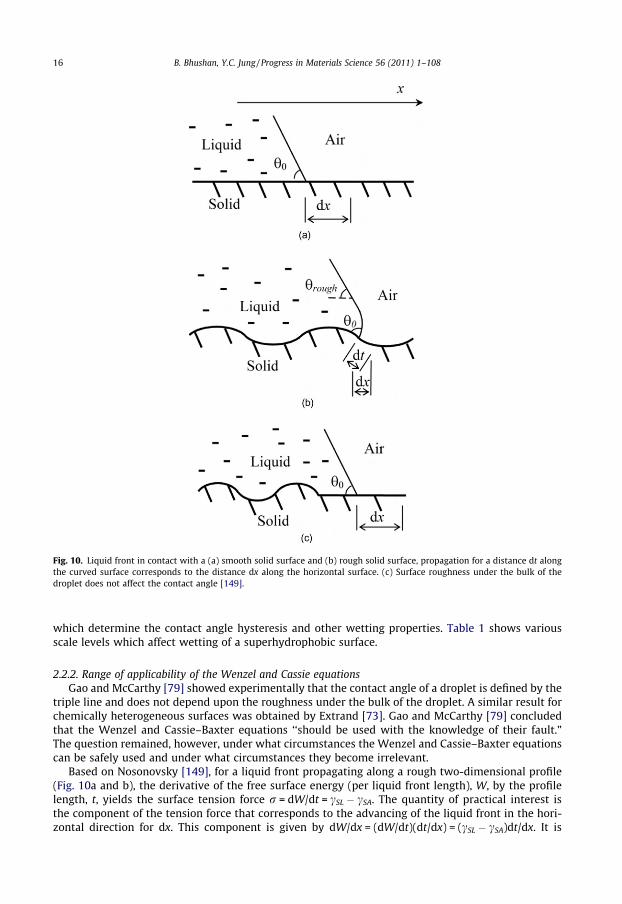
Fig. 10. Liquid front in contact with a (a) smooth solid surface and (b) rough solid surface, propagation for a distance dt alongthe curved surface corresponds to the distance dx along the horizontal surface. (c) Surface roughness under the bulk of thedroplet does not affect the contact angle [149].
16 B. Bhushan, Y.C. Jung / Progress in Materials Science 56 (2011) 1–108
which determine the contact angle hysteresis and other wetting properties. Table 1 shows variousscale levels which affect wetting of a superhydrophobic surface.
2.2.2. Range of applicability of the Wenzel and Cassie equationsGao and McCarthy [79] showed experimentally that the contact angle of a droplet is defined by the
triple line and does not depend upon the roughness under the bulk of the droplet. A similar result forchemically heterogeneous surfaces was obtained by Extrand [73]. Gao and McCarthy [79] concludedthat the Wenzel and Cassie–Baxter equations ‘‘should be used with the knowledge of their fault.”The question remained, however, under what circumstances the Wenzel and Cassie–Baxter equationscan be safely used and under what circumstances they become irrelevant.
Based on Nosonovsky [149], for a liquid front propagating along a rough two-dimensional profile(Fig. 10a and b), the derivative of the free surface energy (per liquid front length), W, by the profilelength, t, yields the surface tension force r = dW/dt = cSL � cSA. The quantity of practical interest isthe component of the tension force that corresponds to the advancing of the liquid front in the hori-zontal direction for dx. This component is given by dW/dx = (dW/dt)(dt/dx) = (cSL � cSA)dt/dx. It is

Fig. 11. A liquid droplet in contact with a solid surface – smooth surface, contact angle h0 rough surface; and a surface withsharp edges. For a droplet moving from left to right on a sharp edge (shown by arrow), the contact angle at a sharp edge maytake any value between the contact angle with the horizontal and inclined planes. This effect results in the difference betweenadvancing (hadv = h0 + a) and receding (hrec = h0 � a) contact angles [150].
Table 1Wetting of a superhydrophobic surface as a multiscale process [155,159].
Scale level Characteristiclength
Parameters Phenomena Interface
Macroscale Droplet radius(mm)
Contact angle, droplet radius Contact anglehysteresis
2-D
Microscale Roughness detail(lm)
Shape of the droplet, position of theliquid–air interface (h)
Kinetic effects 3-D solid surface, 2-Dliquid surface
Nanoscale Molecularheterogeneity(nm)
Molecular description Thermodynamic anddynamic effects
3-D
B. Bhushan, Y.C. Jung / Progress in Materials Science 56 (2011) 1–108 17

18 B. Bhushan, Y.C. Jung / Progress in Materials Science 56 (2011) 1–108
noted that the derivative dt/dx is equal to Wenzel’s roughness factor (Rf) in the case when the rough-ness factor is constant throughout the surface. Therefore, the Young equation Eq. (5), which relates thecontact angle with solid, liquid, and air interface tensions, is modified as [149]
Table 2Summasurfacesin vario
Expe
GaoM[7
Extra
Bhus[3
Barb[7
cLA cos h ¼ Rf ðcSA � cSLÞ ð15Þ
The empirical Wenzel equation (Eq. (6)) is a consequence of Eq. (15) combined with the Youngequation.
Nosonovsky [149] showed that for a more complicated case of a non-uniform roughness, given bythe profile z(x), the local value of derivative, r(x) = dt/dx = (1 + (dz/dx)2)1/2 matters. In the cases thatwere studied experimentally by Gao and McCarthy [79] and Extrand [73], the roughness was present(r > 1) under the bulk of the droplet, but there was no roughness (r = 0) at the triple line, and the con-tact angle was given by Eq. (6) (Fig. 10c). In the general case of a 3-D rough surface z(x, y), the rough-ness factor can be defined as a function of the coordinates r(x, y) = (1 + (dz/dx)2 + (dz/dy)2)1/2.
Eq. (6) is valid for uniformly rough surfaces, that is, surfaces with r = const, and for non-uniformlyrough surfaces the generalized Wenzel equation is formulated to determine the local contact angle (afunction of x and y) with rough surfaces at the triple line [149,157,158]
cos h ¼ rðx; yÞ cos h0 ð16Þ
The difference between the Wenzel equation (Eq. (6)) and the Nosonovsky–Bhushan equation (Eq.(16)) is that the latter is valid for a non-uniform roughness with the roughness factor as the function ofthe coordinates. Eq. (16) is consistent with the experimental results of the scholars who showed thatroughness beneath the droplet does not affect the contact angle, since it predicts that only roughnessat the triple line matters. It is also consistent with the results of the researchers who confirmed theWenzel equation (for the case of the uniform roughness) and of those who reported that only the tripleline matters (for non-uniform roughness). A summary of experimental results for uniform and non-uniform rough and chemically heterogeneous surfaces is shown in Table 2.
The Cassie equation for the composite surface can be generalized in a similar manner introducingthe spatial dependence of the local densities, f1 and f2 of the solid–liquid interface with the contactangle, as a function of x and y, given by [149]
cos hcomposite ¼ f1ðx; yÞ cos h1 þ f2ðx; yÞ cos h2 ð17Þ
where f1 + f2 = 1, h1 and h2 are contact angles of the two components.According to Nosonovsky [149], the important question remains, what should be the typical size of
roughness/heterogeneity details in order for the generalized Wenzel and Cassie equations (Eqs. (16)
ry of experimental results for uniform and non-uniform rough and chemically heterogeneous surfaces. For non-uniform, the results shown for droplets larger than the islands of non-uniformity. Detailed quantitative values of the contact angleus sets of experiments can be found in the referred sources [149].
riment Roughness/hydropobicity atthe triple line andat the rest of thesurface
Roughness atthe bulk (underthe droplet)
Experimental contactangle (compared withthat at the rest of thesurface)
Theoreticalcontact angle,Wenzel/Cassieequations
Theoreticalcontactangle,generalizedWenzel–Cassie(Eqs. (16) and(17))
andcCarthy9]
Hydrophobic Hydrophilic Not changed Decreased Not changedRough Smooth Not changed Decreased Not changedSmooth Rough Not changed Increased Not changed
nd [73] Hydrophilic Hydrophobic Not changed Increased Not changedHydrophobic Hydrophilic Not changed Decreased Not changed
han et al.0]
Rough Rough Increased Increased Increased
ieri et al.]
Rough Rough Increased Increased Increased

B. Bhushan, Y.C. Jung / Progress in Materials Science 56 (2011) 1–108 19
and (17)) to be valid? Some scholars have suggested that roughness/heterogeneity details should becomparable with the thickness of the liquid–air interface and thus ‘‘the roughness would have to beof molecular dimensions to alter the equilibrium conditions” [9], whereas others have claimed thatroughness/heterogeneity details should be small compared with the linear size of the droplet[99,130,26,27,100–103,30,7]. The interface in the analysis proposed earlier is an idealized 2-D object,which has no thickness. In reality, the triple line zone has two characteristic dimensions: the thickness(of the order of molecular dimensions) and the length (of the order of the droplet size).
According to Nosonovsky and Bhushan [157,158], the apparent contact angle, given by Eqs. (16)and (17), may be viewed as the result of averaging of the local contact angle at the triple line overits length, and thus the size of the roughness/heterogeneity details should be small compared tothe length (and not the thickness) of the triple line [158]. A rigorous definition of the generalized equa-tion requires the consideration of several length scales. The length dx needed for averaging of the en-ergy gives the length over which the averaging is performed to obtain r(x, y). This length should belarger than roughness details. However, it is still smaller than the droplet size and the length scaleat which the apparent contact angle is observed (at which local variations of the contact angle levelout). Since of these lengths (the roughness size, dx, the droplet size) the first and the last are of prac-tical importance, we conclude that the roughness details should be smaller than the droplet size.When the liquid–air interface is studied at the length scale of roughness/heterogeneity details, the lo-cal contact angle, h0, is given by Eqs. (6)–(10). The liquid–air interface at that scale has perturbationscaused by the roughness/heterogeneity, and the scale of the perturbations is the same as the scale ofthe roughness/heterogeneity details. However, when the same interface is studied at a larger scale, theeffect of the perturbation vanishes, and apparent contact angle is given by Eqs. (16) and (17) (Fig. 10c).This apparent contact angle is defined at the length scale for which the small perturbations of the li-quid–air interface vanish, and the interface can be treated as a smooth surface. The values of r(x, y),f1(x, y), f2(x, y) in Eqs. (16) and (17) are average values over an area (x, y) with a size larger than a typ-ical roughness/heterogeneity detail size. Therefore, the generalized Wenzel and Cassie equations canbe used at the scale at which the effect of the interface perturbations vanish, or, in other words, whenthe size of the solid surface roughness/heterogeneity details is small compared with the size of theliquid–air interface, which is of the same order as the size of the droplet [158].
Nosonovsky and Bhushan [157,160] used the surface energy approach to find the domain of valid-ity of the Wenzel and Cassie equations (uniformly rough surfaces) and generalized it for a more com-plicated case of non-uniform surfaces. The generalized equations explain a wide range of existingexperimental data, which could not be explained by the original Wenzel and Cassie equations.
2.3. Contact angle hysteresis
Contact angle hysteresis is another important characteristic of a solid–liquid interface. Contact an-gle hysteresis occurs due to surface roughness and heterogeneity. Although for surfaces with rough-ness carefully controlled on the molecular scale it is possible to achieve contact angle hysteresis as lowas <1� [85], hysteresis cannot be eliminated completely, since even atomically smooth surfaces have acertain roughness and heterogeneity. Contact angle hysteresis is a measure of energy dissipation dur-ing the flow of a droplet along a solid surface. Low contact angle hysteresis results in a very low waterroll-off angle, which denotes the angle to which a surface may be tilted for roll-off of water drops (i.e.,very low water contact angle hysteresis) [72,110,26,27,101,102] (Fig. 9b). Low water roll-off angle isimportant in liquid flow applications such as in micro/nanochannels and surfaces with self-cleaningability.
Certain conclusions about the relationship of contact angle hysteresis to roughness can be made. Itis known that the energy gained for surfaces during contact is greater than the work of adhesion forseparating the surfaces, due to so-called adhesion hysteresis. Factors that affect contact angle hyster-esis include adhesion hysteresis, surface roughness, and inhomogeneity. Bhushan et al. [30] and Noso-novsky and Bhushan [154] assumed that contact angle hysteresis is equal to the adhesion hysteresisterm and the term corresponding to the effect of roughness, Hr. They further noted that adhesion hys-teresis can be assumed to be proportional to the fractional solid–liquid area (1 � fLA). Using Eq. (9), the

20 B. Bhushan, Y.C. Jung / Progress in Materials Science 56 (2011) 1–108
difference of cosines of the advancing and receding angles is related to the difference of those for anominally smooth surface, hadv0 and hrec0, as
cos hadv � cos hrec ¼ Rf ð1� fLAÞðcos hadv0 � cos hrec0Þ þ Hr ð18Þ
The first term in the right-hand part of the equation, which corresponds to the inherent contactangle hysteresis of a smooth surface, is proportional to the fraction of the solid–liquid contact area,1 � fLA. The second term, Hr, is the effect of surface roughness, which is equal to the total perimeterof the asperity per unit area, or in other words, to the length density of the triple line [30]. Thus Eq.(18) involves both the term proportional to the solid–liquid interface area and to the triple line length.It is observed from Eqs. (9) and (18) that increasing fLA ? 1 results in increasing the contact angle(cos h ? �1, h ? p) and decreasing the contact angle hysteresis (cos hadv � cos hrec ? 0). In the limit-ing case of very small solid–liquid fractional contact area under the droplet, when the contact angleis large (cos h � �1 + (p � h)2/2, sin h � h � p) and where the contact angle hysteresis is small(hadv � h � hrec), based on Eqs. (9) and (18) [154],
p� h ¼ffiffiffiffiffiffiffiffiffiffiffiffiffiffiffiffiffiffiffiffiffiffiffiffiffiffiffiffiffiffiffiffiffiffiffiffiffiffiffiffiffiffiffiffiffiffiffiffiffiffiffi2ð1� fLAÞðRf cos h0 þ 1Þ
qð19Þ
hadv � hrec ¼ ð1� fLAÞRfcos ha0 � cos hr0
� sin h¼
ffiffiffiffiffiffiffiffiffiffiffiffiffiffi1� fLA
p� �Rf
cos hr0 � cos ha0ffiffiffiffiffiffiffiffiffiffiffiffiffiffiffiffiffiffiffiffiffiffiffiffiffiffiffiffiffiffiffiffiffi2ðRf cos h0 þ 1Þ
p ð20Þ
For the homogeneous interface, fLA = 0, whereas for the composite interface fLA is a non-zero num-ber. It is observed from Eqs. (19) and (20) that for a homogeneous interface, increasing roughness(high Rf) leads to increasing the contact angle hysteresis (high values of hadv � hrec), while for the com-posite interface, an approach to unity of fLA provides both high contact angle and small contact anglehysteresis [100,30,154,156]. Therefore, the composite interface is desirable for self-cleaning.
A sharp edge can pin the line of contact of the solid, liquid, and air (also known as the ‘‘triple line”)at a position far from stable equilibrium, i.e., at contact angles different from h0 [71]. This effect is illus-trated in the bottom sketch of Fig. 11, which shows a droplet propagating along a solid surface withgrooves. Based on Nosonovsky and Bhushan [150,157], at the edge point, the contact angle is not de-fined and can have any value between the values corresponding to contact with the horizontal andinclined surfaces. For a droplet moving from left to right, the triple line will be pinned at the edgepoint until it will be able to proceed to the inclined plane. As it is observed from Fig. 11, the changeof the surface slope (a) at the edge is the cause of the pinning. Because of the pinning, the value ofthe contact angle at the front of the droplet (dynamic maximum advancing contact angle or hadv = -h0 + a) is greater than h0, whereas the value of the contact angle at the back of the droplet (dynamicminimum receding contact angle or hrec = h0 � a) is smaller than h0. A hysteresis domain of the dy-namic contact angle is thus defined by the difference hadv � hrec. The liquid can travel easily alongthe surface if the contact angle hysteresis is small. It is noted that the static contact angle lies withinthe hysteresis domain; therefore, increasing the static contact angle up to the values of a superhydro-phobic surface (approaching 180�) will also result in a reduction of the contact angle hysteresis. In asimilar manner, contact angle hysteresis can also exist even if the surface slope changes smoothly,without sharp edges. There is an analogy between the two mechanisms leading to contact angle hys-teresis (energy dissipation at the solid–liquid interface and pinning of the triple line) and dissipationmechanisms of dry friction (adhesion and deformation) [148].
2.4. Stability of a composite interface and role of hierarchical structure
Stability of the composite interface is an important issue. Even though it may be geometrically pos-sible for the system to become composite, it may be energetically profitable for the liquid to penetrateinto the valleys between asperities and form a homogeneous interface. Marmur [134] formulated geo-metrical conditions for a surface under which the energy of the system has a local minimum and thecomposite interface may exist. Patankar [168] pointed out that whether the homogeneous or compos-ite interface exists depends on the system’s history, i.e., on whether the droplet was formed at the sur-face or deposited. However, the above-mentioned analyses do not provide an answer to which of thetwo possible configurations, homogeneous or composite, will actually form.

B. Bhushan, Y.C. Jung / Progress in Materials Science 56 (2011) 1–108 21
Based on Nosonovsky and Bhushan [154,157], formation of a composite interface is also a multi-scale phenomenon which depends upon the relative sizes of the liquid droplet and roughness details.The composite interface is fragile and can be irreversibly transformed into the homogeneous interface,thus damaging superhydrophobicity. In order to form a stable composite interface with air pockets be-tween solid and liquid, the destabilizing factors such as capillary waves, nanodroplet condensation,surface inhomogeneity, and liquid pressure should be avoided. First, the capillary waves at the li-quid–air interface may destabilize the composite interface. Due to an external perturbation, a standingcapillary wave can form at the liquid–air interface. If the amplitude of the capillary wave is greaterthan the height of the asperity, the liquid can touch the valley between the asperities, and if the angleunder which the liquid comes in contact with the solid is greater than h0, it is energetically profitablefor the liquid to fill the valley [150,151]. When the composite interface is destroyed and space be-tween the asperities is filled with water, it is highly unlikely that the composite interface will beformed again because the transition from the non-composite solid–liquid interface to a compositeinterface would require a large activation energy. Such a transition has never been observed. The effectof capillary waves is more pronounced for small asperities with height comparable with wave ampli-tude. Second, nanodroplets may condensate and accumulate in the valleys between asperities andeventually destroy the composite interface. Cheng et al. [56] observed condensation of submicronsized droplets on a Lotus leaf surface and found that droplets tend to condense at areas adjacent tobumps (i.e., in the valleys) and have a contact angle of less than 90�, whereas larger droplets havehigher contact angles, thus demonstrating that the contact angle is scale dependent. The scale effectis observed for small droplets or at small distances near the triple line. Scale dependence of the contactangle has been reported by Nosonovsky and Bhushan [154,157]. At nanoscale distances from the tripleline the liquid touches the solid under a much lower contact angle. Third, even hydrophobic surfacesare usually not chemically homogeneous and can have hydrophilic spots. It is known from experi-ments that for droplets of submicron size, the value of the contact angle is usually smaller than fordroplets at the macroscale [125]. Checco et al. [52] suggested that surface inhomogeneity is respon-sible for this scale effect, since nanodroplets tend to sit at the highest free surface energy (most hydro-philic) spots and thus have lower contact angles. Their phenomenological numerical simulationsshowed good agreement with experimental data.
For high fLA, a nanopattern is desirable because whether a liquid–air interface is generated dependsupon the ratio of distance between two adjacent asperities and droplet radius. Furthermore, asperitiescan pin liquid droplets and thus prevent liquid from filling the valleys between asperities. High Rf canbe achieved by both micropatterns and nanopatterns. Nosonovsky and Bhushan [153–159,162] havedemonstrated that a combination of microroughness and nanoroughness (multiscale roughness) withconvex surfaces can help resist the destabilization by pinning the interface. It also helps in preventingthe gaps between the asperities from filling with liquid, even in the case of a hydrophilic material. Theeffect of roughness on wetting is scale dependent, and mechanisms that lead to destabilization of acomposite interface are also scale dependent. To effectively resist these scale-dependent mechanisms,it is expected that a multiscale roughness is optimum for superhydrophobicity.
Nosonovsky [147] considered a two-dimensional structure with rectangular pillars of height h andwidth a separated by distance b, covered with small semi-circular bumps (convex) and grooves (con-cave) of radius r (Fig. 12a). If the distance between the pillars is small in comparison with the capillarylength, the effect of gravity is negligible, it can be assumed that the liquid–air interface is a horizontalplane, and its position is characterized by the vertical coordinate z. The free energy is given by [147]
W ¼ ASLcSL þ ASAcSA þ ALAcLA ¼ rLcLAðsina� a cos h0Þ; 0 < z < h ð21Þ
where a = a cos((r � z)/r) + 2pN is the angle corresponding to vertical position of the interface z, N isthe number of ridges or grooves, and L is length of the grooves in the y-direction, which is requiredbased on the dimensional considerations. The dependence is presented in Fig. 12b, for the cases ofhydrophobic (h0 = 150�) and hydrophilic (h0 = 30�) materials for both the convex surface (with bumps)and concave surface (with grooves). It is seen that for the convex surface, there are many states of sta-ble equilibrium (shown in Fig. 12a with dotted lines), separated by energy barriers which correspondto every ridge, whereas for the concave surface equilibrium states are unstable. Therefore, the ridgescan pin the triple line and thus lead to a composite interface. In the case of a hydrophilic surface, each

Fig. 12. Two-dimensional pillars with semi-circular bumps/grooves. (a) Schematics of the structure. The bumps may pin thetriple line, because an advance of the LA interface results in decrease of the contact angle (h < h0), making equilibrium stable.Grooves provide with equilibrium positions, which satisfy the Young equation, however, the equilibrium is unstable, because anadvance of the LA interface results in increase of the contact angle (h > h0). (b) Energy profiles for configurations in (a) withbumps and grooves for hydrophilic (h0 = 30�) and hydrophobic (h0 = 150�) materials. Energy (normalized by LrcLA) is shown as afunction of vertical position of the interface z (normalized by the radius of bumps/grooves r). Bumps result in stableequilibriums (energy minima), whereas grooves result in unstable equilibriums (energy maxima) [147].
22 B. Bhushan, Y.C. Jung / Progress in Materials Science 56 (2011) 1–108
lower position of the equilibrium state corresponds to a lower value of W, therefore, when the liquidadvances from one equilibrium state to the next, the total energy decreases, and thus liquid’s advanceis energetically profitable. When the liquid reaches the bottom of the valley and completely fills thespace between the pillars forming a homogeneous interface, the total energy decreases dramaticallyby the value of [147]
DW ¼ bLðcSA þ cLA � cSLÞ ¼ bLcLAð1þ cos h0Þ ð22Þ
The opposite transition from a homogeneous interface to a composite interface requires high acti-vation energy DW and is thus unlikely, making the transition from composite interface to homoge-neous interface irreversible. If the distance between the pillars b is much greater than r, the energybarriers which separate the equilibrium states, 2prLcLA cos h0, will be relatively small compared toDW, and low activation energy will be required for the liquid to spread and propagate from one equi-librium state to the other [154,156].
For the interface to be stable, the value of the contact angle should decrease when the liquid–airinterface advances, whereas for receding liquid the contact angle should increase. For a two-dimen-sional surface, the change of angle is equal to the change of the slope of the surface, and whetherthe configuration is stable or not depends on the sign of curvature of the surface. As indicated earlier,the convex surface (with bumps) leads to a stable interface, whereas a concave surface (with grooves)leads to an unstable interface. This approach was suggested for creating superoleophobic surfaces,since the surface tension of oil and organic liquids is much lower than that of water, and it is difficultto create a surface not wetted by oil [193]. Since oleophilic surfaces in air (solid–oil–air system) canbecome superoleophobic when immersed in water (solid–oil–water system), underwater superoleop-hobicity has potential for self-cleaning anti-fouling surfaces for ships.

B. Bhushan, Y.C. Jung / Progress in Materials Science 56 (2011) 1–108 23
An experiment suggesting that the sign of curvature is indeed important for hydrophobicity wasconducted by Sun et al. [189]. They produced both a positive and a negative replica of a Lotus leaf sur-face by nanocasting using poly(dimethylsiloxane), which has a contact angle with water of about 105�.This value is close to the contact angle of the wax which covers Lotus leaves (about 103� as reported byKamusewitz et al. [107]). The positive and negative replicas have the same roughness factor and thusshould produce the same contact angle in the case of a homogeneous interface, according to Eq. (6);however, the values of surface curvature are opposite. The value of contact angle for the positive rep-lica was found to be 160� (same as for Lotus leaf), while for the negative replica it was only 110�. Thisresult suggests that the high contact angle for Lotus leaf is due to the composite, rather than homo-geneous interface, and that the sign of surface curvature indeed plays a critical role in the formationof the composite interface.
2.5. The Cassie–Baxter and Wenzel wetting regime transition
Since superhydrophobicity requires a stable composite interface, it is important to understand thedestabilization mechanisms for the Cassie–Baxter and Wenzel wetting transition. Based on Nosonov-sky and Bhushan [157,160], it is known from experimental observations that the transition from theCassie–Baxter to Wenzel regime can be an irreversible event. Whereas such a transition can be in-duced, for example, by applying pressure or force to the droplet [103,163], electric voltage [122,5],light for a photocatalytic texture [75], and vibration [41], the opposite transition is never observed.Several approaches have been proposed for investigation of the transition between the Cassie–Baxterand Wenzel regimes, referred to as ‘‘the Cassie–Wenzel transition.” It has been suggested that thetransition takes place when the net surface energy of the Wenzel regime becomes equal to that ofthe Cassie–Baxter regime, or, in other words, when the contact angle predicted by the Cassie–Baxterequation is equal to that predicted by the Wenzel equation. Lafuma and Quere [125] noticed that incertain cases the transition does not occur even when it is energetically profitable, and consideredsuch a Cassie–Baxter state metastable. Extrand [73] suggested that the weight of the droplet is respon-sible for the transition and proposed the contact line density model, according to which the transitiontakes place when the weight exceeds the surface tension force at the triple line. Patankar [168] sug-gested that which of the two states is realized may depend upon how the droplet was formed, that isupon the history of the system. Quere [175] also suggested that the droplet curvature (which dependsupon the pressure difference between the inside and the outside of the droplet) governs the transition.Nosonovsky and Bhushan [151] suggested that the transition is a dynamic process of destabilizationand identified possible destabilizing factors. It has been also suggested that the curvature of multiscaleroughness defines the stability of the Cassie–Baxter wetting regime [153,154,156–158,160,161,147,148] and that the transition is a stochastic gradual process [150,94,40,41]. Numerous experimen-tal results support many of these approaches, however, it is not clear which particular mechanismprevails.
Based on Nosonovsky and Bhushan [157,160], there is an asymmetry between the wetting anddewetting processes, since less energy is released during wetting than the amount required for dew-etting due to adhesion hysteresis. Adhesion hysteresis is one of the reasons that leads to contact anglehysteresis, and it also results in the hysteresis of the Wenzel and Cassie–Baxter state transition. Fig. 13shows the contact angle of a rough surface as a function of surface roughness parameter, given by Eq.(9). Here it is assumed that Rf � 1 for a Cassie–Baxter regime with a stable composite interface, and theliquid droplet sits flat over the surface. It is noted that at a certain point, the contact angles given bythe Wenzel and Cassie–Baxter equations are the same, and Rf = (1 � fLA) � fLA/cos h0. At this point, thelines corresponding to the Wenzel and Cassie–Baxter regimes intersect. This point corresponds to anequal net energy of the Cassie–Baxter and Wenzel regimes. For a lower roughness (e.g., larger pitchbetween the asperities) the Wenzel state is more energetically profitable, whereas for a higher rough-ness the Cassie–Baxter regime is more energetically profitable.
It is observed from Fig. 13 that an increase of roughness may lead to the transition between theWenzel and Cassie–Baxter regimes at the intersection point. With decreasing roughness, the systemis expected to transit to the Wenzel state. However, experiments [26,27,101–103,30,7] show that,despite the energy in the Wenzel regime being lower than that in the Cassie–Baxter regime, the

Fig. 13. Wetting hysteresis for a superhydrophobic surface. Contact angle as a function of roughness. The stable Wenzel state (i)can transform into the stable Cassie state with increasing roughness (ii). The metastable Cassie state (iii) can abruptly transform(iv) into the stable Wenzel state. The transition i–ii corresponds to equal Wenzel and Cassie states free energies, whereas thetransition iv corresponds to a significant energy dissipation and thus it is irreversible [160].
24 B. Bhushan, Y.C. Jung / Progress in Materials Science 56 (2011) 1–108
transition does not necessarily occur, and the droplet may remain in the metastable Cassie–Baxter re-gime. This is because there are energy barriers associated with the transition, which occurs due todestabilization by dynamic effects (such as waves and vibration) [157,160].
In order to understand contact angle hysteresis and the transition between the Cassie–Baxter andWenzel regimes, Nosonovsky and Bhushan [157,160] analyzed the shape of the free surface energyprofile. The free surface energy of a droplet upon a smooth surface as a function of the contact anglehas a distinct minimum which corresponds to the most stable contact angle. As shown in Fig. 14a, themacroscale profile of the net surface energy allows us to find the contact angle (corresponding to en-ergy minimums); however it fails to predict the contact angle hysteresis and Cassie–Baxter and Wen-zel transition, which are governed by micro- and nanoscale effects. As soon as microscale substrateroughness is introduced, the droplet shape cannot be considered as an ideal truncated sphere any-more, and energy profiles have multiple energy minimums, corresponding to the location of the asper-ities (Fig. 14b). The microscale energy profile (solid line) has numerous energy maxima and minimadue to surface asperities. While exact calculation of the energy profile for a 3-D droplet is complicated,a qualitative shape may be obtained by assuming a periodic sinusoidal dependence [99], superim-posed upon the macroscale profile, as shown in Fig. 14b [157,160]. Thus the advancing and recedingcontact angles can be identified as the maximum and minimum possible contact angles correspondingto energy minimum points. However, the transition between the Wenzel and Cassie–Baxter branchesstill cannot be explained. Note also that Fig. 14b explains qualitatively the hysteresis due to the kineticeffect of the asperities, but not the inherited adhesion hysteresis, which is characterized by the molec-ular length scale and cannot be captured by the microscale model.
Based on Nosonovsky and Bhushan [157,160], the energy profile as a function of the contact angledoes not provide information on how the transition between the Cassie–Baxter and Wenzel regimesoccurs, because their two states correspond to completely isolated branches of the energy profile inFig. 14a and b. However, the energy may depend not only upon the contact angle, but also upon mi-cro/nanoscale parameters, such as for example the vertical position of the liquid–air interface underthe droplet, h (assuming that the interface is a horizontal plane) or similar geometrical parameters(assuming a more complicated shape of the interface). In order to investigate the Wenzel and Cas-sie–Baxter transition, Nosonovsky and Bhushan [157,160] studied the dependence of the energy uponthese parameters. They assume that the liquid–air interface under the droplet is a flat horizontalplane. When such air layer thickness or the vertical position of the liquid–air interface, h, is intro-duced, the energy can be studied as a function of the droplet’s shape, the contact angle, and h(Fig. 14c). For an ideal situation, the energy profile has an abrupt minimum at the point correspondingto the Wenzel state, which corresponds to the sudden net energy change due to the destruction of thesolid–air and liquid–air interfaces (cSL � cSA � cLA = �cLA(cos h + 1) times the interface area) (Fig. 14c).

Fig. 14. Schematics of net free energy profiles. (a) Macroscale description; energy minimums correspond to the Wenzel andCassie states. (b) Microscale description with multiple energy minimums due to surface texture. Largest and smallest values ofthe energy minimum correspond to the advancing and receding contact angles. (c) Origin of the two branches (Wenzel andCassie) is found when a dependence of energy upon h (air layer thickness or vertical position of the liquid–air interface) isconsidered for the microscale description (solid line) and nanoscale imperfectness (dashed line) [160]. When the nanoscaleimperfectness is introduced, it is observed that the Wenzel state corresponds to an energy minimum and the energy barrier forthe Wenzel–Cassie transition is much smaller than for the opposite transition.
B. Bhushan, Y.C. Jung / Progress in Materials Science 56 (2011) 1–108 25
In a more realistic case, the liquid–air interface cannot be considered horizontal due to nanoscaleimperfectness or dynamic effects such as the capillary waves [151]. A typical size of the imperfectness

26 B. Bhushan, Y.C. Jung / Progress in Materials Science 56 (2011) 1–108
is much smaller than the size of details of the surface texture and thus belongs to the molecular scalelevel. The height of the interface, h, can now be treated as an average height. The energy dependenceupon h is now not as abrupt as in the idealized case. For example, for the ‘‘triangular” shape as shownin Fig. 14c, the Wenzel state may become the second attractor for the system. It is seen that there aretwo equilibriums which correspond to the Wenzel and Cassie–Baxter regimes, with the Wenzel statecorresponding to a much lower energy level. The energy dependence upon h governs the transitionbetween the two states, and it is observed that a much larger energy barrier exists for the transitionfrom Wenzel to Cassie–Baxter regime than for the opposite transition. This is why the first transitionhas never been observed experimentally [155].
To summarize, the contact angle hysteresis and Cassie–Baxter and Wenzel transition cannot bedetermined from the macroscale equations and are governed by micro- and nanoscale phenomena[157,160].
3. Lotus effect surfaces in nature
Many biological surfaces are known to be superhydrophobic and self-cleaning. In this section, wewill discuss various plant leaves, their roughness and wax coatings in relation to their hydrophobic/hydrophilic and self-cleaning properties.
3.1. Plant leaves
Hydrophobic and water-repellent abilities of many plant leaves have been known for a long time.Scanning electron microscope (SEM) studies since the 1970s have revealed that the hydrophobicity ofthe leaf surface is related to its microstructure. The outer cells covering a plant, especially the leaf, arecalled epidermis cells. The epidermis in all plant surfaces is covered by a thin extracelluar membrane,called cuticle. The plant cuticle is a composite material mainly built up of a cutin network and hydro-phobic waxes [10,116,118]. The chemical structure of the epicuticular waxes has been studied exten-sively by plant scientists and lipid chemists in recent decades [6,96]. The epicuticular waxes can beeither thin with a 2-D structure or thick with a 3-D structure or a combination thereof. It is believedthat waxes diffuse through the cuticle via a lipidic pathway [120]. After diffusion of the wax, the tubu-lar wax morphologies grow by crystallization or self-assembly. The plants are able to repair the waxlayer by self-assembly.
The hydrophobicity of the leaves is related to another important effect, the ability to remain cleanafter being immersed in dirty water, known as self-cleaning. This ability is best known for the Lotus(Nelumbo nucifera) leaf that is considered by some Asian cultures as ‘‘sacred” due to its purity. Not sur-prisingly, the ability of Lotus-like surfaces for self-cleaning and water-repellency was dubbed the ‘‘Lo-tus effect.” As far as the biological implications of the Lotus effect, self-cleaning plays an importantrole in the defense against pathogens binding to the leaf surface. Many spores and conidia of patho-genic organisms – most fungi – require water for germination and can infect leaves only in the pres-ence of water.
Neinhuis and Barthlott [143] systematically studied surfaces and wetting properties of about 200water-repellent plants (for a comprehensive review, see [116,118]). Among the epidermal relief fea-tures are the papillose epidermal cells either with every epidermal cell forming a single papilla or cellsbeing divided into papillae. The scale of the epidermal relief ranged from 5 lm in multipapillate cellsto 100 lm in large epidermal cells. Some cells also are convex (rather than having real papillae) and/orhad hairs (trichomes). Neinhuis and Barthlott [143] also found various types and shapes of wax crys-tals at the surface. Also see Koch et al. [116,118]. Interestingly, the hairy surfaces with a thin film ofwax exhibited water-repellency for short periods (minutes), after which water penetrated betweenthe hairs, whereas hairs with a thick film led to strong water-repellency. The wax crystal createsnanoroughness, in addition to the microroughness created by the papillae. Apparently, roughnessplays the dominant role in the Lotus effect.
The SEM study reveals that the Lotus leaf surface is covered by ‘‘bumps,” more exactly called papil-lae (papillose epidermal cells), which, in turn, are covered by an additional layer of epicuticular waxes

B. Bhushan, Y.C. Jung / Progress in Materials Science 56 (2011) 1–108 27
[10]. The wax is present in crystalline tubules, composed of a mixture of long-chain aliphatic com-pounds, principally nonacosanol and nonacosanediols [113,116,118]. The wax is hydrophobic with awater contact angle of about 95–110�, whereas the papillae provide the tool to magnify the contactangle based on the Wenzel model, discussed in the preceding section. The experimental value ofthe static water contact angle with the Lotus leaf was reported about the 164� [34,119]. Indeed, takingthe papillae density of 3400/mm2, the average radius of the hemisphereical asperities r = 10 lm andthe aspect ratio h/r = 1, provides, based on Eq. (6), the value of the roughness factor Rf � 4 [150]. Takingthe value of the contact angle for wax, h0 = 104� [107], the calculation with the Wenzel equation yieldsh = 165�, which is close to the experimentally observed values [150]. However, the simple Wenzelmodel may be not sufficient to explain the Lotus effect, as the roughness structure forms a compositeinterface. Moreover, its structure has hierarchical roughness. So, a number of more sophisticated mod-els have been developed to study the role of hierarchical roughness on contact angle [153–162]. Aqualitative explanation for self-cleaning is that on a smooth surface contamination particles aremainly redistributed by a water droplet; on a rough surface they adhere to the droplet and are re-moved from the leaves when the droplet rolls off.
3.2. Characterization of superhydrophobic and hydrophilic leaf surfaces
In order to understand the mechanisms of hydrophobicity in plant leaves, a comprehensive compar-ative study of superhydrophobic and hydrophilic leaf surfaces and their properties was carried out byBhushan and Jung [25] and Burton and Bhushan [47]. Below is a discussion of the findings of the study.
3.2.1. Experimental techniquesThe static contact angles were measured using a Rame–Hart model 100 contact angle goniometer
with droplets of deionized (DI) water [47,25]. Droplets of about 5 lL in volume (with diameter of aspherical droplet about 2.1 mm) were gently deposited on the substrate using a microsyringe forthe static contact angle. All measurements were made by five different points for each sample at22 ± 1 �C and 50 ± 5% RH. The measurement results were reproducible within ±3�.
An optical profiler (NT-3300, Wyko Corp., Tuscon, AZ) was used to measure surface roughness fordifferent surface structures [47,25]. A greater Z-range of the optical profiler of 2 mm is a distinctadvantage over the surface roughness measurements with an AFM which has a Z-range of on the orderof 7 lm, but it has only a maximum lateral resolution of approximately 0.6 lm [15,17]. A commercialAFM (D3100, Nanoscope IIIa controller, Digital Instruments, Santa Barbara, CA) was used for additionalsurface roughness measurements with a high lateral resolution (sub nm) and for adhesion and frictionmeasurements [46,25]. The measurements for surface roughness were performed with a square pyra-midal Si(1 0 0) tip with a native oxide layer which had a nominal radius of 20 nm on a rectangularSi(1 0 0) cantilever with a spring constant of 3 N m�1 in the tapping mode.
Adhesion and friction force at various relative humidities (RH) were measured using a 15 lm ra-dius borosilicate ball [15,17,21]. A large tip radius was used to measure contributions from severalmicrobumps and a large number of nanobumps. Friction force was measured under a normal loadranging from 20 to 250 nN using a 90� scan angle at the velocity of 100 lm/s in 50 lm and at a velocityof 4 lm/s in 2 lm scans. The quantitative measurement of friction force was calibrated by the methoddescribed by Bhushan [21]. The normal load was varied (20–250 nN), and a friction force measure-ment was taken at each increment. By plotting the friction force as a function of normal load, an aver-age coefficient of friction was obtained from the slope of the fit line of the data. The adhesive force wasmeasured using the force distance curve approach. In this technique, the AFM tip is brought into con-tact with the sample by extending the piezo vertically, then retracting the piezo and calculating theforce required to separate the tip from the sample. The adhesive force is obtained by multiplyingthe cantilever spring constant with the cantilever deflection during the retraction between zero valueand the maximum negative value. The method is described in detail by Bhushan [15,17,21].
3.2.2. SEM micrographsFig. 15 shows the SEM micrographs of two superhydrophobic leaves – Lotus (Nelumbo nucifera) and
elephant ear or taro plant (Colocasia esculenta), referred to as Lotus and Colocasia, respectively – and

Fig. 15. Scanning electron micrographs of the relatively rough, water-repellent leaf surfaces of Nelumbo nucifera (Lotus) andColocasia esculenta and the relatively smooth, wettable leaf surfaces of Fagus sylvatica and Magnolia grandiflora [25].
28 B. Bhushan, Y.C. Jung / Progress in Materials Science 56 (2011) 1–108
two hydrophilic leaves – beech (Fagus sylvatica) and Magnolia (Magnolia grandiflora), referred to as Fa-gus and Magnolia, respectively [25]. Lotus and Colocasia are characterized by papillose epidermal cellsresponsible for the creation of papillae or microbumps on the surfaces, and an additional layer of 3-Depicuticular waxes which are a mixture of very long chain fatty acids molecules (compounds withchains >20 carbon atoms) and create nanostructure on the entire surface. Fagus and Magnolia arecharacterized by rather flat tabular cells with a thin wax film with a 2-D structure [10]. The leavesare not self-cleaning, and contaminant particles from ambient are accumulated, which make themhydrophilic.
3.2.3. Contact angle measurementsFig. 16a shows the contact angles for the superhydrophobic and hydrophilic leaves before and after
applying acetone. The acetone was applied in order to remove any wax present on the surface. As aresult, for the superhydrophobic leaves, the contact angle dramatically reduced, whereas for the

Fig. 16. Contact angle measurements and calculations for the leaf surfaces, (a) before and after removing surface layer as well ascalculated values, and (b) fresh and dried leaves. The contact angle on a smooth surface for the four leaves was obtained usingthe roughness factor calculated [25].
B. Bhushan, Y.C. Jung / Progress in Materials Science 56 (2011) 1–108 29
hydrophilic leaves, the contact angle was almost unchanged. It is known that there is a 2-D very thinwax layer on the hydrophilic leaves, which introduces little roughness. In contrast, superhydrophobicleaves are known to have a thin 3-D wax layer on their surface consisting of nanoscale roughness overmicroroughness created by the papillae, which results in a hierarchical roughness. The combination ofthis wax and the roughness of the leaf creates a superhydrophobic surface.
Bhushan and Jung [25] calculated the contact angles for leaves with smooth surfaces using theWenzel equation and the calculated Rf and the contact angle of the four leaves. The results are pre-sented in Fig. 16a. The approximate values of Rf for Lotus and Colocasia are 5.6 and 8.4 and for Fagusand Magnolia are 3.4 and 3.8, respectively. Based on the calculations, the contact angles on smoothsurfaces were approximately 99� for Lotus and 96� for Colocasia. For both Fagus and Magnolia, thecontact angles for the smooth surfaces were found to be approximately 86� and 88�. A further discus-sion on the effect of Rf on the contact angle will be presented later.
Fig. 16b shows the contact angles for both fresh and dried states for the four leaves. There is a de-crease in the contact angle for all four leaves when they are dried. For Lotus and Colocasia, this de-crease is present because it is found that a fresh leaf has taller bumps than a dried leaf (data to bepresented later), which will give a larger contact angle, according to the Wenzel equation. Whenthe surface area is at a maximum compared to the footprint area, as with a fresh leaf, the roughness

30 B. Bhushan, Y.C. Jung / Progress in Materials Science 56 (2011) 1–108
factor will be at a maximum and will only reduce when shrinking has occurred after drying. To under-stand the reason for the decrease of contact angle after drying of hydrophilic leaves, dried Magnolialeaves were also measured using an AFM. It is found that the dried leaf (peak–valley (P–V)height = 7 lm, mid-width = 15 lm, and peak radius = 18 lm) has taller bumps than a fresh leaf (P–V height = 3 lm, mid-width = 12 lm, and peak radius = 15 lm), which increases the roughness, andthe contact angle decreases, leading to a more hydrophilic surface. The mid-width is defined as thewidth of the bump at a height equal to half of peak to mean line value.
3.2.4. Surface characterization using an optical profilerThe use of an optical profiler allows measurements to be made on fresh leaves which have a large
P–V distance. Three different surface height maps for superhydrophobic and hydrophilic leaves areshown in Figs. 17 and 18 [25]. In each figure, a 3-D map and a flat map along with a 2-D profile ina given location of the flat 3-D map are shown. A scan size of 60 lm � 50 lm was used to obtain asufficient amount of bumps to characterize the surface but also to maintain enough resolution toget an accurate measurement.
The structures found with the optical profiler correlate well with the SEM images shown in Fig. 15.The bumps on the Lotus leaf are distributed on the entire surface, but the Colocasia leaf shows a verydifferent structure to that of the Lotus. The surface structure for Colocasia not only has bumps similarto Lotus, but also surrounding each bump is a ridge that keeps the bumps separated. With these ridges,the bumps have a hexagonal (honeycomb) packing geometry that allows for the maximum number ofbumps in a given area. The bumps of Lotus and both bumps and ridges of Colocasia contribute to thesuperhydrophobic nature since they both increase the Rf factor and result in air pockets between thedroplet of water and the surface. In Fagus and Magnolia height maps, short bumps can be seen on thesurface. This means that with decreased bump height, the probability of air pocket formation de-creases, and bumps have a less beneficial effect on the contact angle.
As shown in 2-D profiles of superhydrophobic and hydrophilic leaves in Figs. 17 and 18, a curve hasbeen fitted to each profile to show exactly how the bump shape behaves. For each leaf a second ordercurve fit has been given to the profiles to show how closely the profile is followed. By using the secondorder curve fitting of the profiles, the radius of curvature can be found [25,47].
Fig. 17. Surface height maps and 2-D profiles of hydrophobic leaves using an optical profiler. For Lotus leaf, a microbump isdefined as a single, independent microstructure protruding from the surface. For Colocasia leaf, a microbump is defined as thesingle, independent protrusion from the leaf surface, whereas a ridge is defined as the structure that surrounds each bump andis completely interconnected on the leaf. A curve has been fitted to each profile to show exactly how the bump shape behaves.The radius of curvature is calculated from the parabolic curve fit of the bump [25].

Fig. 18. Surface height maps and 2-D profiles of hydrophilic leaves using an optical profiler. For Fagus and Magnolia leaves, amicrobump is defined as a single, independent microstructure protruding from the surface. A curve has been fitted to eachprofile to show exactly how the bump shape behaves. The radius of curvature is calculated from the parabolic curve fit of thebump [25].
B. Bhushan, Y.C. Jung / Progress in Materials Science 56 (2011) 1–108 31
Using these optical surface height maps, different statistical parameters of bumps and ridges can befound to characterize the surface: P–V height, mid-width, and peak radius [15,17]. Table 3 shows thesequantities found in the optical height maps for the four leaves. Comparing the superhydrophobic andhydrophilic leaves, it can be seen that the P–V height for bumps of Lotus and Colocasia is much tallerthan that for the bumps of Fagus and Magnolia. The peak radius for the bumps of Lotus and Colocasiais also smaller than that for the bumps of Fagus and Magnolia. However, the values of mid-width forthe bumps of the four leaves are similar.
Table 3Microbump and nanobump map statistics for hydrophobic and hydrophilic leaves, measured both fresh and dried leaves using anoptical profiler and AFM [25].
Leaf Microbump scan size (50 � 50 lm) Nanobump Scan size (2 � 2 lm)
P–V height(lm)
Mid-width(lm)
Peak radius(lm)
P–V height(lm)
Mid-width(lm)
Peak radius(lm)
LotusFresh 13* 10* 3* 0.78** 0.40** 0.15**
Dried 9** 10** 4** 0.67** 0.25** 0.10**
ColocasiaFresh Bump 9* 15* 5* 0.53** 0.25** 0.07**
Ridge 8* 7* 4* 0.68** 0.30** 0.12**
Dried Bump 5** 15** 7** 0.48** 0.20** 0.06**
Ridge 4** 8** 4** 0.57** 0.25** 0.11**
FagusFresh 5* 10* 15* 0.18** 0.04** 0.01**
4** 5** 10**
MagnoliaFresh 4* 13* 17* 0.07** 0.05** 0.04**
3** 12** 15**
* Data measured using optical profiler.** Data measured using AFM.

32 B. Bhushan, Y.C. Jung / Progress in Materials Science 56 (2011) 1–108
3.2.5. Surface characterization, adhesion and friction using an AFM3.2.5.1. Comparison of two AFM measurement techniques. To measure topographic images of the leafsurfaces, both the contact and tapping modes were first used [25]. Fig. 19 shows surface height mapsof dried Lotus obtained using the two techniques. In the contact mode, local height variation for Lotusleaf was observed in 50 lm scan size. However, little height variation was obtained in a 2 lm scaneven at loads as low as 2 nN. This could be due to the substantial frictional force generated as theprobe scanned over the sample. The frictional force can damage the sample. The tapping mode tech-nique allows high-resolution topographic imaging of sample surfaces that are easily damaged, looselyheld to their substrate, or difficult to image by other AFM techniques [15,17]. As shown in Fig. 19, with
Fig. 19. Surface height maps showing the top scan and bottom scan in a 50 lm scan size and the bump peak scan selected in a2 lm scan size for a Lotus leaf using an AFM in contact mode and tapping mode. Two methods were used to determine asuitable method to obtain high resolution of nanotopography for a Lotus leaf [25].

B. Bhushan, Y.C. Jung / Progress in Materials Science 56 (2011) 1–108 33
the tapping mode technique, the soft and fragile leaves can be imaged successfully. Therefore tappingmode technique was used to examine the surface roughness of the superhydrophobic and hydrophilicleaves using an AFM.
3.2.5.2. Surface characterization. The AFM has a Z-range on the order of 7 lm, and cannot be used formeasurements in a conventional way because of the high P–V distances of a Lotus leaf. Burton andBhushan [47] developed a new method to fully determine the bump profiles. In order to compensatefor the large P–V distance, two scans were made for each height: one measurement that scans the tops
Fig. 20. Surface height maps and 2-D profiles showing the top scan and bottom scan of a dried Lotus leaf in 50 lm scan(because the P–V distance of a dried Lotus leaf is greater than the Z-range of an AFM), and the top scan of both fresh and driedLotus in a 2 lm scan [25]. Splicing technique was used to determine the bump profiles. In order to compensate for the large P–Vdistance, the total height of the bumps is embedded within the top scan and bottom scan.

34 B. Bhushan, Y.C. Jung / Progress in Materials Science 56 (2011) 1–108
of the bumps and another measurement that scans the bottom or valleys of the bumps. The totalheight of the bumps is embedded within the two scans. Fig. 20 shows the 50 lm surface height mapsobtained using this method [25]. The 2-D profiles in the right side column take the profiles from thetop scan and the bottom scan for each scan size and splice them together to get the total profile of theleaf. The 2 lm surface height maps for both fresh and dried Lotus can also be seen in Fig. 20. This scanarea was selected on the top of a microbump obtained in the 50 lm surface height map. It can be seenthat nanobumps are randomly and densely distributed on the entire surface of Lotus.
Bhushan and Jung [25] also measured the surface height maps for the hydrophilic leaves in both50 lm and 2 lm scan sizes as shown in Fig. 21. For Fagus and Magnolia, microbumps were foundon the surface, and the P–V distance of these leaves is lower than that of Lotus and Colocasia. It can
Fig. 21. Surface height maps and 2-D profiles of Fagus and Magnolia using an AFM in both 50 lm and 2 lm scans [25].

B. Bhushan, Y.C. Jung / Progress in Materials Science 56 (2011) 1–108 35
be seen in the 2 lm surface height maps that nanobumps selected on the peak of the microbump havean extremely low P–V distance.
Using the AFM surface height maps, different statistical parameters of bumps and ridges can be ob-tained: P–V height, mid-width, and peak radius. These quantities for the four leaves are listed in Ta-ble 3. It can be seen that the values correlate well with the values obtained from optical profiler scansexcept for the bump height, which decreases by more than half because of leaf shrinkage.
3.2.5.3. Adhesive force and friction. Adhesive force and coefficient of friction of superhydrophobic andhydrophilic leaves using AFM are presented in Fig. 22 [25]. For each type of leaf, adhesive force mea-surements were made for both fresh and dried leaves using a 15 lm radius tip. It is found that thedried leaves had a lower adhesive force than the fresh leaves. Adhesive force arises from severalsources in changing the presence of a thin liquid film, such as an adsorbed water layer that causesmeniscus bridges to build-up around the contacting and near-contacting bumps as a result of surfaceenergy effects [15,17]. When the leaves are fresh there is moisture within the plant material thatcauses the leaf to be soft, and when the tip comes into contact with the leaf sample, the sample willdeform, and a larger real area of contact between the tip and sample will occur, and the adhesive forcewill increase. After the leaf has dried, the moisture that was in the plant material is gone, and there isnot as much deformation of the leaf when the tip comes into contact with the leaf sample. Hence, theadhesive force is decreased because the real area of contact has decreased.
The adhesive force of Fagus and Magnolia is higher than that of Lotus and Colocasia. The reason isthat the real area of contact between the tip and leaf surface is expected to be higher in hydrophilicleaves than in superhydrophobic leaves. In addition, the Fagus and Magnolia are hydrophilic and havea high affinity to water. The combination of high real area of contact and affinity to water are respon-sible for higher meniscus forces [15,17]. The coefficient of friction was only measured on a dried plant
Fig. 22. Adhesive force for fresh and dried leaves, and the coefficient of friction for dried leaves for 50 lm and 2 lm scan sizesfor hydrophobic and hydrophilic leaves. All measurements were made using an AFM with 15 lm radius borosilicate tip.Reproducibility for both adhesive force and coefficient of friction is ±5% for all measurements [25].

36 B. Bhushan, Y.C. Jung / Progress in Materials Science 56 (2011) 1–108
surface with the same sliding velocity (10 lm/s) in different scan sizes rather than including the freshsurface because the P–V was too large to scan back and forth with the AFM to obtain friction force. Asexpected, the coefficient of friction for superhydrophobic leaves is lower than that for hydrophilicleaves due to the real area of contact between the tip and leaf sample, similar to the adhesive forceresults. When the scan size from microscale to nanoscale decreases, the coefficient of friction also de-creases in each leaf. The reason for such dependence is the scale dependent nature of the roughness ofthe leaf surface. Figs. 20 and 21 show AFM topography images and 2-D profiles of the surfaces for dif-ferent scan sizes. The scan size dependence of the coefficient of friction has been reported previously[172,121,190].
3.2.6. Role of the hierarchical roughnessThe approximation of the roughness factor for the leaves on the micro- and nanoscale was made
using AFM scan data [25]. Roughness factors for various leaves are presented in Table 4. As mentionedearlier, the open space between asperities on a surface has the potential to collect air, and its proba-bility appears to be higher in nanobumps as the distance between bumps in the nanoscale is smallerthan those in microscale. Using roughness factor values, along with the contact angles (h) from bothsuperhydrophobic and hydrophilic surfaces, 153� and 152� in Lotus and Colocasia, and 76� and 84� inFagus and Magnolia, respectively, the contact angles (h0) for the smooth surfaces can be calculatedusing the Wenzel equation (Eq. (6)) for microbumps and the Cassie–Baxter equation (Eq. (9)) for nano-bumps. Contact angle (Dh) calculated using Rf on the smooth surface can be found in Table 4. It can beseen that the roughness factors and the differences (Dh) between h and h0 on the nanoscale are higherthan those in the microscale. This means that nanobumps on the top of a microbump increase contactangle more effectively than microbumps. In the case of hydrophilic leaves, the values of Rf and Dhchange very little on both scales.
Based on the data in Fig. 22, the coefficient of friction values in the nanoscale are much lower thanthose in the microscale. It is clearly observed that friction values are scale dependent. The height of abump and the distance between bumps in microscale is much larger than those in nanoscale, whichmay be responsible for larger values of friction force on the microscale.
One difference between microbumps and nanobumps for surface enhancement of water-repellencyis the effect on contact angle hysteresis, in other words, the ease with which a droplet of water can rollon the surface. It has been stated earlier that contact angle hysteresis decreases and contact angle in-creases due to the decreased contact with the solid surface caused by the air pockets beneath thedroplet. The surface with nanobumps has a high roughness factor compared with that of microbumps.With large distances between microbumps, the probability of air pocket formation decreases and is
Table 4Roughness factor and contact angle (Dh = h � h0) calculated using Rf on the smooth surface for hydrophobic and hydrophilic leavesmeasured using an AFM, both microscale and nanoscale [25].
Leaf (contact angle) Scan size State Rf Dh (deg)
Lotus (153�) 50 lm Dried 5.6 54*
2 lm Fresh 20 61**
Dried 16 60**
Colocasia (152�) 50 lm Dried 8.4 56*
2 lmbump
Fresh 18 60**
Dried 14 59**
2 lm ridge Fresh 18 60**
Dried 15 59**
Fagus (76�) 50 lm Fresh 3.4 �10*
2 lm Fresh 5.3 2**
Magnolia (84�) 50 lm Fresh 3.8 �4*
2 lm Fresh 3.6 14**
* Calculations made using Wenzel equation.** Calculations made using Cassie–Baxter equation. We assume that the contact area between the droplet and air is the half ofthe whole area of the rough surface.
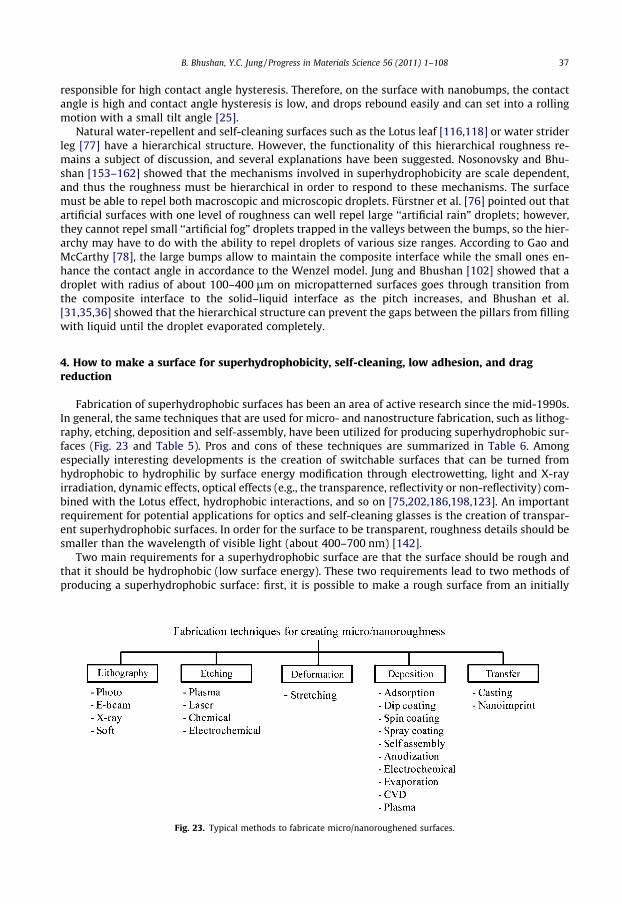
B. Bhushan, Y.C. Jung / Progress in Materials Science 56 (2011) 1–108 37
responsible for high contact angle hysteresis. Therefore, on the surface with nanobumps, the contactangle is high and contact angle hysteresis is low, and drops rebound easily and can set into a rollingmotion with a small tilt angle [25].
Natural water-repellent and self-cleaning surfaces such as the Lotus leaf [116,118] or water striderleg [77] have a hierarchical structure. However, the functionality of this hierarchical roughness re-mains a subject of discussion, and several explanations have been suggested. Nosonovsky and Bhu-shan [153–162] showed that the mechanisms involved in superhydrophobicity are scale dependent,and thus the roughness must be hierarchical in order to respond to these mechanisms. The surfacemust be able to repel both macroscopic and microscopic droplets. Fürstner et al. [76] pointed out thatartificial surfaces with one level of roughness can well repel large ‘‘artificial rain” droplets; however,they cannot repel small ‘‘artificial fog” droplets trapped in the valleys between the bumps, so the hier-archy may have to do with the ability to repel droplets of various size ranges. According to Gao andMcCarthy [78], the large bumps allow to maintain the composite interface while the small ones en-hance the contact angle in accordance to the Wenzel model. Jung and Bhushan [102] showed that adroplet with radius of about 100–400 lm on micropatterned surfaces goes through transition fromthe composite interface to the solid–liquid interface as the pitch increases, and Bhushan et al.[31,35,36] showed that the hierarchical structure can prevent the gaps between the pillars from fillingwith liquid until the droplet evaporated completely.
4. How to make a surface for superhydrophobicity, self-cleaning, low adhesion, and dragreduction
Fabrication of superhydrophobic surfaces has been an area of active research since the mid-1990s.In general, the same techniques that are used for micro- and nanostructure fabrication, such as lithog-raphy, etching, deposition and self-assembly, have been utilized for producing superhydrophobic sur-faces (Fig. 23 and Table 5). Pros and cons of these techniques are summarized in Table 6. Amongespecially interesting developments is the creation of switchable surfaces that can be turned fromhydrophobic to hydrophilic by surface energy modification through electrowetting, light and X-rayirradiation, dynamic effects, optical effects (e.g., the transparence, reflectivity or non-reflectivity) com-bined with the Lotus effect, hydrophobic interactions, and so on [75,202,186,198,123]. An importantrequirement for potential applications for optics and self-cleaning glasses is the creation of transpar-ent superhydrophobic surfaces. In order for the surface to be transparent, roughness details should besmaller than the wavelength of visible light (about 400–700 nm) [142].
Two main requirements for a superhydrophobic surface are that the surface should be rough andthat it should be hydrophobic (low surface energy). These two requirements lead to two methods ofproducing a superhydrophobic surface: first, it is possible to make a rough surface from an initially
Fig. 23. Typical methods to fabricate micro/nanoroughened surfaces.

Table 5Typical materials and corresponding techniques to produce micro/nanoroughness.
Material Technique Contactangle(deg)
Notes Source
Teflon Plasma 168 Zhang et al. [207], Shiuet al. [187]
Fluorinated block polymer solution Casting underhumid environment
160 Transparent Yabu and Shimomura[203]
PFOS Electro- andchemicalpolymerization
152 Reversible(electricpotential)
Xu et al. [202]
PDMS Laser treatment 166 Khorasani et al. [109]PS–PDMS block copolymer Electrospining >150 Ma et al. [113]PS, PC, PMMA Evaporation >150 Bormashenko et al. [39]PS nanofiber Nanoimprint 156 Lee et al. [129]Polyaniline nanofiber Chemical
polymerization175 Chiou et al. [57]
PET Oxygen plasmaetching
>150 Teshima et al. [191]
Organo-triethoxysilanes Sol–gel 155 Reversible(temperature)
Shirtcliffe et al. [186]
Al Chemical etching >150 Qian and Shen [173]Copper Electrodeposition 160 Hierarchical Shirtcliffe et al. [185]Si Photolithography 170 Bhushan and Jung [26]Si E-beam lithography 164 Martines et al. [137]Si X-ray lithography >166 Furstner et al. [76]PS, PMMA AFM
nanolithographyMartin et al. [136],Cappella and Bonaccurso[50]
Si Casting 158 Plant leafreplica
Sun et al. [189], Fürstneret al. [76]
Si (Black Si) Plasma etching >150 For liquid flow Jansen et al. [95]Silica Sol–gel 150 Hikita et al. [89], Shang
et al. [182]Silica Layer-by-layer
assembly160 Hierarchical Zhao et al. [213]
Polyelectrolyte multilayer surfaceovercoated with silicananoparticles
Self-assembly 168 Zhai et al. [206]
Epoxy resin with synthetic and plantwaxes
Replication andself-assembly
173 Hierarchical Bhushan et al.[31,32,35,36], Koch et al.[119]
Nano-silica spheres Dip coating 105 Klein et al. [112]Silica colloidal particles in PDMS Spin coated 165 Hierarchical Ming et al. [140]Au clusters Electrochemical
deposition>150 Zhang et al. [208]
Carbon nanotubes Chemical vapordeposition
>165 Lau et al. [127]
Carbon nanotubes Chemical vapordeposition
159 Hierarchical Huang et al. [91]
Carbon nanotubes Replication andspray coating
170 Hierarchical Jung and Bhushan [106]
ZnO, TiO2 Nanorods Sol–gel >150 Reversible (UVirradiation)
Feng et al. [75]
38 B. Bhushan, Y.C. Jung / Progress in Materials Science 56 (2011) 1–108
hydrophobic material and, second, to modify a rough hydrophilic surface by modifying surface chem-istry or applying a hydrophobic material upon it. Note that roughness is usually a more critical prop-erty than the low surface energy, since both moderately hydrophobic and very hydrophobic materialscan exhibit similar wetting behavior when roughened.

Table 6Pros and cons of various fabrication techniques.
Techniques Pros Cons
Lithography Accuracy, large area Slow process, high costEtching Fast Chemical contamination, less controlDeposition Flexibility, cheap Can be high temperature, less controlSelf-assembly Flexibility, cheap Require suitable precursor
B. Bhushan, Y.C. Jung / Progress in Materials Science 56 (2011) 1–108 39
4.1. Roughening to create one-level structure
Lithography is a well-established technique, applied for creating a large area of periodic micro/nan-opatterns. It includes photo, E-beam, X-ray, and soft lithography. Bhushan and Jung [26] producedmicropatterned Si using photolithography. To obtain a sample that is hydrophobic, a self-assembledmonolayer (SAM) of 1,1,-2,2,-tetrahydroperfluorodecyltrichlorosilane (PF3) was deposited on the sam-ple surfaces using a vapor phase deposition technique. They obtained a superhydrophobic surfacewith a contact angle up to 170�. Martines et al. [137] fabricated ordered arrays of nanopits and nano-pillars by using electron beam lithography. They obtained a superhydrophobic surface with a staticcontact angle of 164� and contact angle hysteresis of 1� for a surface consisting of tall pillars withcusped tops after hydrophobization with octadecyltrichlorosilane (OTS). Fürstner et al. [76] createdsilicon wafers with regular patterns of spikes by X-ray lithography. The wafer was hydrophobizedby sputtering a layer of gold and subsequent immersion in a hexadecanethiol solution. AFM can beused in nanolithography to produce a nanostructure with the aid of solvent [50] or electro field[136] on polystyrene (PS) and polymethylmethacrylate (PMMA), respectively. Jung and Bhushan[100] created low aspect ratio asperities (LAR, 1:1 height-to-diameter ratio), high aspect ratio asper-ities (HAR, 3:1 height-to-diameter ratio), and a Lotus pattern (replica from the Lotus leaf), all on aPMMA surface using soft lithography. A self-assembled monolayer (SAM) of perfluorodecyltriethox-ysilane (PFDTES) was deposited on the patterned surfaces using a vapor phase deposition technique.
One well-known and effective way to make rough surfaces is etching using either plasma, laser,chemical, or electrochemical techniques [132]. Jansen et al. [95] etched a silicon wafer using a fluo-rine-based plasma by utilizing the black silicon method to obtain isotropic, positively, and negativelytapered as well as vertical walls with smooth surfaces. Coulson et al. [62] described an approach inplasma chemical roughening of poly(tetrafluoroethylene) (PTFE) substrates followed by the depositionof low surface energy plasma polymer layers, which give rise to high repellency towards polar andnon-polar probe liquids. A different approach was taken by Shiu et al. [187], who treated a Teflon filmwith oxygen plasma and obtained a superhydrophobic surface with a contact angle of 168�. Fluori-nated materials have a limited solubility, which makes it difficult to roughen them. However, theymay be linked or blended with other materials, which are often easier to roughen, in order to makesuperhydrophobic surfaces. Teshima et al. [191] obtained a transparent superhydrophobic surfacefrom a poly(ethylene terephthalate) (PET) substrate via selective oxygen plasma etching followedby plasma-enhanced chemical vapor deposition using tetramethylsilane (TMS) as the precursor.Khorasani et al. [109] produced porous polydimethylsiloxane (PDMS) surfaces with the contact angleof 175� using CO2-pulsed laser etching method as an excitation source for surface. Qian and Shen [173]described a simple surface roughening method by dislocation selective chemical etching on polycrys-talline metals such as aluminum. After treatment with fluoroalkylsilane, the etched metallic surfacesexhibited superhydrophobicity. Xu et al. [202] fabricated a reversible superhydrophobic surface with adouble-roughened perfluorooctanesulfonate (PFOS) doped conducting polypyrrole (PPy) film by acombination of electropolymerization and chemical polymerization. Reversibility was achieved byswitching between superhydrophobic doped or oxidized states and superhydrophilicity dedoped orneutral states with changing the applied electrochemical potential.
A stretching method can be used to produce a superhydrophobic surface. Zhang et al. [207]stretched a Teflon film and converted it into fibrous crystals with a large fraction of void space inthe surface, leading to high roughness and the superhydrophobicity.

40 B. Bhushan, Y.C. Jung / Progress in Materials Science 56 (2011) 1–108
Deposition methods can also be used to make a substrate rough. There are several ways to make arough surface including adsorption, dip coating, electrospinning, anodization, electrochemical, evapo-ration, chemical vapor deposition (CVD), and plasma. Solidification of wax can be used to produce asuperhydrophobic surface. Shibuichi et al. [184] used alkylketene dimer (AKD) wax on a glass plateto spontaneously form a fractal structure in its surfaces. They obtained a surface with a contact anglelarger than 170� without any fluorination treatments. Klein et al. [112] obtained superhydrophobicsurfaces by simply dip coating a substrate with a slurry containing nano-silica spheres, which adheredto the substrate after a low temperature heat treatment. After reaction of the surface with a fluor-oalkyltrichlorosilane, the hydrophobicity increased with a decreasing area fraction of spheres. Maet al. [133] produced block copolymer poly(styrene-b-dimethylsiloxane) fibers with submicrometerdiameters in the range 150–400 nm by electrospinning from a solution in tetrahydrofuran anddimethylformamide. They obtained superhydrophobic nonwoven fibrous mats with a contact angleof 163�. Shiu et al. [187] produced self-organized close-packed superhydrophobic surfaces by spin-coating the monodispersed polystyrene beads solution on a substrate surface. Abdelsalam et al. [1]studied the wetting of structured gold surfaces formed by electrodeposition through a template ofsubmicrometer spheres and discussed the role of the pore size and shape in controlling wetting. Bor-mashenko et al. [39] used evaporated polymer solutions of polystyrene (PS), polycarbonate (PC), andpolymethylmethacrylate (PMMA) dissolved in chlorinated solvents, dichloromethane (CH2Cl2), andchloroform (CHCl3), to obtain self-assembled structure with hydrophobic properties. Chemical/phys-ical vapor deposition (CVD/PVD) has been used for the modification of surface chemistry as well. Lauet al. [127] created superhydrophobic carbon nanotube forests by modifying the surface of verticallyaligned nanotubes with plasma-enhanced chemical vapor deposition (PECVD). Superhydrophobicitywas achieved down to the microscopic level where essentially spherical, micrometer-sized waterdroplets can be suspended on top of the nanotube forest. Zhu et al. [214] and Huang et al. [91] pre-pared surfaces with two-scale roughness by the controlled growth of carbon nanotube (CNT) arraysby CVD. Zhao et al. [212] also synthesized vertically aligned multiwalled carbon nanotube (MWCNT)arrays by chemical vapor deposition on Si substrates using a thin film of iron (Fe) as catalyst layer andaluminum (Al) film.
Attempts to create superhydrophobic surfaces by casting and nanoimprint methods have been suc-cessful. Yabu and Shimomura [203] prepared a porous superhydrophobic transparent membrane bycasting a fluorinated block polymer solution under humid environment. Transparency was achievedbecause the honeycomb-patterned films had a sub-wavelength pore size. Sun et al. [189] reported ananocasting method to make a superhydrophobic PDMS surface. They first made a negative PDMStemplate using a Lotus leaf as an original template and then used the negative template to make a po-sitive PDMS template – a replica of the original Lotus leaf. Zhao et al. [211] prepared a superhydropho-bic surface by casting a micellar solution of a copolymer poly(styrene-b-dimethylsiloxane) (PS–PDMS)in humid air based on the cooperation of vapor-induced phase separation and surface enrichment ofPDMS block. Lee et al. [129] produced vertically aligned PS nanofibers by using nanoporous anodicaluminum oxide as a replication template in a heat- and pressure-driven nanoimprint pattern transferprocess. As the aspect ratio of the polystyrene (PS) nanofibers increased, the nanofibers could notstand upright but formed twisted bundles resulting in a three-dimensionally rough surface with a con-tact angle of about 155�.
4.2. Coating to create one-level hydrophobic structures
Modifying the surface chemistry with a hydrophobic coating widens the potential applications ofsuperhydrophobic surfaces. There are several ways to modify the chemistry of a surface includingsol–gel, dip coating, self-assembly, electrochemical and chemical/physical vapor deposition. Shirtcliffeet al. [186] prepared porous sol–gel foams from organo-triethoxysilanes which exhibited switchingbetween superhydrophobicity and superhydrophilicity when exposed to different temperatures.Hikita et al. [89] used colloidal silica particles and fluoroalkylsilane as the starting materials and pre-pared a sol–gel film with superliquid-repellency by hydrolysis and condensation of alkoxysilane com-pounds. Feng et al. [75] produced superhydrophobic surfaces using ZnO nanorods by sol–gel method.They showed that superhydrophobic surfaces can be switched into hydrophilic surfaces by alternation

B. Bhushan, Y.C. Jung / Progress in Materials Science 56 (2011) 1–108 41
of ultraviolet (UV) irradiation. Shang et al. [182] did not blend low surface energy materials in the sols,but described a procedure to make transparent superhydrophobic surfaces by modifying silica-basedgel films with a fluorinated silane. In a similar way, Wu et al. [201] made a microstructured ZnO-basedsurface via a wet chemical process and obtained superhydrophobicity after coating the surface withlong-chain alkanoic acids. Chiou et al. [57] fabricated polyaniline nanofibers using chemical oxidativepolymerization to produce uniform aligned nanofibers and treated with CF4 plasma treatment to cre-ate superhydrophobic surfaces with a contact angle of 175�.
Zhai et al. [206] used a layer-by-layer (LBL) self-assembly technique to create a poly(allylaminehydrochloride)/poly(acrylic acid) (PAH/PAA) multilayer which formed a honeycomb-like structureon the surface after an appropriate combination of acidic treatments. After cross-linking the structure,they deposited silica nanoparticles on the surface via alternating dipping of the substrates into anaqueous suspension of the negatively charged nanoparticles and an aqueous PAH solution, followedby a final dipping into the nanoparticle suspension. Superhydrophobicity was obtained after the sur-face was modified by a chemical vapor deposition of (tridecafluoro-1,1,2,2-tetrahydrooctyl)-1-trichlo-rosilane followed by a thermal annealing.
Zhang et al. [208] showed that the surface covered with dendritic gold clusters, which was formedby electrochemical deposition onto an indium tin oxide (ITO) electrode modified with a polyelectro-lyte multilayer, showed superhydrophobic properties after further deposition of a n-dodecanethiolmonolayer. Han et al. [86] described the fabrication of Lotus leaf-like superhydrophobic metal surfacesby using electrochemical reaction of Cu or Cu–Sn alloy plated on steel sheets with sulfur gas, and sub-sequent perfluorosilane treatment. Chemical bath deposition (CBD) has also been used to make nano-structured surfaces, thus, Hosono et al. [90] fabricated a nanopin film of brucite-type cobalt hydroxide(BCH) and achieved the contact angle of 178� after further modification of lauric acid (LA). Shi et al.[183] described the use of galvanic cell reaction as a facile method to chemically deposit Ag nanostruc-tures on the p-silicon wafer on a large scale. When the Ag covered silicon wafer was further modifiedwith a self-assembled monolayer of n-dodecanethiol, a superhydrophobic surface was obtained with acontact angle of about 154� and a tilt angle lower than 5�.
4.3. Methods to create two-level (hierarchical) structures
Two-level (hierarchical) roughness structures are typical for superhydrophobic surfaces in nature,as was discussed above. Recently, many efforts have been devoted to fabricating these hierarchicalstructures in various ways. Shirtcliffe et al. [185] prepared a hierarchical (double-roughened) coppersurface by electrodeposition from acidic copper sulfate solution onto flat copper and a patterning tech-nique of coating with a fluorocarbon hydrophobic layer. Another way to obtain a rough surface forsuperhydrophobicity is assembly from colloidal systems. Ming et al. [140] prepared a hierarchical(double-roughened) surface consisting of silica-based raspberry-like particles. First is the attachmentof epoxy and amino groups onto the silica microparticles of about 700 nm and nanoparticles of about70 nm, respectively, using established synthetic procedures. Two suspensions in ethanol are created,one with microparticles and another one with nanoparticles. In the next step, the suspension with thesilica microparticles is added dropwise to the suspension with the nanoparticles. The nanoparticlesattach to the microparticles due to the reaction between the epoxy and amino groups present onthe surface of the particles. Then, the suspension is centrifuged to separate any unreacted particles.A next step involves depositing these micro/nanostructured particles into an epoxy film (on silicon).Finally, since the resulting micro/nanoparticle surface is initially hydrophilic, it is made hydrophobicby a deposition of monoepoxy-end-capped poly(dimenthylsiloxane) (PDMS). Northen and Turner[146] fabricated arrays of flexible silicon dioxide platforms supported by single high aspect ratio sil-icon pillars down to 1 lm in diameter and with heights up to �50 lm. When these platforms werecoated with polymeric organorods of approximately 2 lm tall and 50–200 nm in diameter, it showedthat the surface is highly hydrophobic with a water contact angle of 145�. Chong et al. [59] fabricatedhierarchically ordered nanowire arrays with periodic voids at the microscale and hexagonally packednanowires at the nanoscale. This hierarchical surface was created by selective electrodeposition usingnanoporous anodic alumina as a template and a porous gold film as a working electrode that is pat-terned by microsphere monolayers. Wang et al. [197] also developed a novel precursor hydrothermal

42 B. Bhushan, Y.C. Jung / Progress in Materials Science 56 (2011) 1–108
redox method with Ni(OH)2 as the precursor to fabricate a hierarchical structure consisting of nickelhollow microspheres with nickel nanoparticles in situ. The created hierarchical hollow structureexhibited enhanced coercivity and remnant magnetization as compared with hollow nickel submi-crometer spheres, hollow nickel nanospheres, bulk nickel, and free Ni nanoparticles.
Kim et al. [111] fabricated a hierarchical structure which looks like the same structures as the Lotusleaf. First, the nanoscale porosity was generated by anodic aluminum oxidation, and then, the anod-ized porous alumina surface was replicated by polytetrafluoroethylene. The polymer sticking phenom-enon during the replication created the sub-microstructures on the negative polytetrafluoroethylenenanostructure replica. The contact angle of the created hierarchical structure was about 160� and thetilting angle is less than 1�. del Campo and Greiner [64] reported that SU-8 hierarchical patterns com-prising of features with lateral dimensions ranging from 5 mm to 2 mm and heights from 10 to500 lm were obtained by photolithography, which comprises of a step of layer-by-layer exposurein soft contact printed shadow masks which are embedded into the SU-8 multilayer. Bhushan et al.[31,32,35,36] and Koch et al. [119] produced hierarchical structures by replication of a micropatternedsilicon surface and Lotus leaf microstructure using an epoxy resin and by self-assembly of syntheticand plant waxes as thin hydrophobic three-dimensional crystals to create hydrophobic nanostruc-tures. The fabrication technique used is a low cost two step process, which provides flexibility inthe fabrication of a variety of hierarchical structures. They showed that a hierarchical structure hasa high propensity of air pocket formation and leads to a static contact angle of 173� and contact anglehysteresis and tilt angle of �2�. Zhao et al. [213] fabricated a hierarchical structure by using layer-by-layer assembly of silica nanoparticles on a microsphere-patterned polyimide precursor substrate com-bined with the fluoroalkylsilane treatment. The microstructures were created by replica molding ofpolyamide using two-dimensional PS microsphere arrays. They obtained a superhydrophobic surfacewith a static contact angle of 160� and sliding angle of less than 10�. Cortese et al. [61] applied plasmaCF4 treatment on micropattern PDMS and obtained contact angle of 170�. Kuan et al. [124] produced ahierarchical structure by imprinting ZnO precursor films using gratings with 830 nm and 50 lmdimensions. They achieved a contact angle of 141� by nanostructures deposited on sawtooth patternswithout modifying the surface chemistry. Jung and Bhushan [106] produced mechanically durableCNT-composite hierarchical structures with a static contact angle of 170� and a contact angle hyster-esis of 2� by replication of a micropatterned silicon surface using an epoxy resin and by deposition ofthe CNT composite using a spray method. They showed that CNT composite structure had highmechanical strength and wear resistance led from the uniform distribution and strong bonding ofCNT on substrates.
5. Fabrication and characterization of micro-, nano- and hierarchical structured surfaces
In this section, we will discuss experimental measurements of the wetting properties of micro-,nano- and hierarchical patterned surfaces.
5.1. Experimental techniques
5.1.1. Contact angle, surface roughness, and adhesionThe static and dynamic (advancing and receding) contact angles were measured using a Rame–Hart
model 100 contact angle goniometer and droplets of DI water [46,26,27,100,101,31,32,35,36,119]. Formeasurement of the static contact angle, the droplet size should be smaller than the capillary length,but larger than the dimension of the structures present on the surfaces. Droplets of about 5 lL in vol-ume (with the diameter of a spherical droplet about 2.1 mm) were gently deposited on the substrateusing a microsyringe for measurement of the static contact angle. The advancing and receding contactangles were measured by the addition and removal of water from a DI water sessile droplet using amicrosyringe. The contact angle hysteresis was calculated as the difference between the measuredadvancing and receding contact angles, and the tilt angle was measured by using a simple tilting stage[26,27,31,32,35,36,119]. All measurements were made at five different points for each sample at22 ± 1 �C and 50 ± 5% RH. The measurements were reproducible to within ±3�.

B. Bhushan, Y.C. Jung / Progress in Materials Science 56 (2011) 1–108 43
For surface roughness measurement, an optical profiler (NT-3300, Wyko Corp., Tuscon, AZ) wasused for different surface structures [47,25,26,27]. The optical profiler has one advantage due to itsgreater Z-range (2 mm) over an AFM (Z-range about 7 lm), but it has a maximum lateral resolutionof only approximately 0.6 lm [15,17]. Experiments were performed using three different radii tipsto study the effect of scale dependence. Large radii atomic force microscope (AFM) tips were primarilyused in this study. A borosilicate ball with 15 lm radius and a silica ball with 3.8 lm radius weremounted on a gold-coated triangular Si3N4 cantilever with a nominal spring constant of 0.58 N m�1.A square pyramidal Si3N4 tip with a nominal radius of 30–50 nm on a triangular Si3N4 cantilever witha nominal spring constant of 0.58 N m�1 was used for the smaller radius tip. Adhesive force was mea-sured using the force distance curve approach described earlier [15,17,21].
5.1.2. Droplet evaporation studiesDroplet evaporation was observed and recorded by a digital camcorder (Sony, DCRSR100) with a
10� optical and 120� digital zoom for every run of the experiment. Then the decrease in the diameterof the droplets with time was determined [101,102,31,35]. The frame speed of the camcorder was0.03 s per frame. An objective lens placed in front of the camcorder during recording gave a total mag-nification of 10–20 times. Droplet diameter as small as a few hundred microns could be measuredwith this method. Droplets were gently deposited on the substrate using a microsyringe, and thewhole process of evaporation was recorded. Images obtained were analyzed using Imagetool� soft-ware (University of Texas Health Science Center) for the contact angle. To find the dust trace remain-ing after droplet evaporation, an optical microscope with a charge-coupled device (CCD) camera(Nikon, Optihot-2) was used. All measurements were made in a controlled environment at 22 ± 1 �Cand 45 ± 5% RH [101–103,31,35,36].
5.1.3. Bouncing droplet studiesThe process of dynamic impact was recorded by a high speed camera (Kodak Ektapro HS Motion
Analyzer, Model 4540) operated at 500 frames/s for each experimental run and then measuring thedynamic impact behavior of the droplet as a function of time. The impact velocity was calculatedby varying the droplet release height. The size of the droplet was the same as that of a droplet forthe static contact angle. All measurements were made in a controlled environment at 22 ± 1 �C and45 ± 5% RH [103].
5.1.4. Vibrating droplet studiesThe process of dynamic behavior was obtained by a system producing vertical vibrations [105]. The
system consists of an electrodynamic shaker (Labworks Inc. Model ET-126A/B) connected with a sig-nal generator and power amplifier, a digital camcorder (Sony, DCRSR100, Tokyo, Japan) with an objec-tive lens, and a lamp (Digital Instruments Inc. Model F0–50) for a light source. The specimen wasplaced on the top of the shaker, and a droplet was gently deposited using a microsyringe. The sizeof the droplet was the same as that of a droplet for the static contact angle as reported earlier. Thevibration frequency was controlled between 0 and 300 Hz at 0.4 mm amplitude for measurement ofthe resonance frequency of a droplet. For wetting behavior of a droplet on the surface, a frequencyof 30 Hz, which was less than the resonance frequency, was chosen, and the vibration amplitudewas controlled between 0 and 3 mm. The vibration time applied to the droplet was 1 min for eachexperiment. All measurements were made in a controlled environment at 22 ± 1 �C and 45 ± 5% RH[105].
5.1.5. Microdroplet condensation and evaporation studies using ESEMA Philips XL30 ESEM equipped with a Peltier cooling stage was used to study smaller droplets
[102]. ESEM uses a gaseous secondary electron detector (GSED) for imaging. The ESEM column isequipped with a multistage differential pressure-pumping unit. The pressure in the upper part isabout 10�6–10�7 Torr, but a pressure of about 1–15 Torr can be maintained in the observationchamber. When the electron beam (primary electrons) ejects secondary electrons from the surfaceof the sample, the secondary electrons collide with gas molecules in the ESEM chamber, which in turnacts as a cascade amplifier, delivering the secondary electron signal to the positively biased GSED.

44 B. Bhushan, Y.C. Jung / Progress in Materials Science 56 (2011) 1–108
The positively charged ions are attracted toward the specimen to neutralize the negative charge pro-duced by the electron beam. Therefore, the ESEM can be used to examine electrically isolated speci-mens in their natural state. In ESEM, adjusting the pressure of the water vapor in the specimenchamber and the temperature of the cooling stage allows the water to condense on the sample inthe chamber. For the measurement of the static and dynamic contact angles on patterned surfaces,video images were recorded. The voltage of the electron beam was 15 kV, and the distance of the spec-imen from the final aperture was about 8 mm. If the angle of observation is not parallel to the surface,the electron beam is not parallel to the surface but inclined at an angle, this will produce a distortionin the projection of the droplet profile. A mathematical model to calculate the real contact angle fromthe ESEM images was used to correct the tilting of the surfaces during imaging [44,102].
5.1.6. Generation of submicron dropletsIn order to generate submicron droplets, Jung and Bhushan [104] developed an AFM-based
technique using a modified nanoscale dispensing (NADIS) probe as shown in Fig. 24. NADIS probewas fabricated from modifying a commercially available silicon nitride (Si3N4) cantilever (OlympusOMCL-RC800) with lengths of 100 and 200 lm, spring constants of 0.8 and 0.1 N/m, and resonance fre-quencies of 68.94 and 122.02 kHz, respectively (Swiss Center for Electronics and Microtechnology).The probe consisted of a loading area (30 lm diameter) for the liquid on the upper side of the canti-lever. The loading area was produced by removing the material locally in and around the tip with areflective gold layer using focused ion beam milling. The remaining gold was made hydrophobic using
Fig. 24. (a) Schematic of modified nanoscale dispensing (NADIS) probe for generation of submicron size droplets. The loadedliquid is limited to the loading area (30 lm diameter circle), (b) scanning electron micrograph of tip in side view and bottomview with different aperture sizes (500 nm and 200 nm) at its apex [104].

B. Bhushan, Y.C. Jung / Progress in Materials Science 56 (2011) 1–108 45
hexadecanethiol (in liquid phase) whereas the bare silicon nitride in the milling area remained hydro-philic. The hydrophilic–hydrophobic transition prevents spreading of the loaded liquid over the entirecantilever.
A droplet of a certain volume V is deposited on the surface. Fig. 25 shows an idealized sphericalcapped droplet. Based on the thickness of the droplet h and contact diameter d, the contact angle isobtained by the following equation for a simple spherical capped geometry of droplet [104]
Fig. 25.droplet
h ¼ sin�1 3d
2 3Vph2 þ h� �
0@
1A ð23Þ
For calculation of the contact angle of the droplet, we use the following three steps:
(1) For the measurement of the volume of a droplet deposited on the surface, the change in reso-nance frequency of the cantilever before and after depositing the droplet on the surface is mea-sured. The resonance frequency of the cantilever is measured by performing a frequency sweepof the voltage driven oscillations by thermal tune method [60].
(2) For the measurement of the thickness of a droplet deposited on the surface, the distancebetween the tip snap-in and the position where the tip is in contact with the surface is mea-sured in the force calibration mode.
(3) For the measurement of the contact diameter between a droplet and surface, the image of thedroplet after evaporation is measured using a Si tip.
For the thickness of a droplet deposited on the surface, the force distance curve was used[15,17,21]. The droplet was deposited in the first approach. The force distance curve was obtained dur-ing a second approach to measure the thickness of the droplet [23,53,131]. The cantilever deflection isplotted on the vertical axis against the Z-position of the piezo scanner in a force distance curve asshown in Fig. 26. The measurement starts at a large separation (point A), where there is no deflectionof the cantilever. As the piezo moves to the sample, a sudden mechanical instability occurs betweenpoint B and point C, and the droplet jumps into contact with the tip and wicks up around the tip toform a meniscus. The cantilever bends downward because of the attractive meniscus force actingon the tip. As the piezo further approaches the surface, the deflection of the cantilever increases whilethe tip travels the thickness of the droplet and eventually contacts the underlying surface at point D,and the cantilever starts to bend upward. Once the piezo reaches the end of its designated ramp size atpoint E, it is retracted to its starting position. The tip goes beyond zero deflection and enters the adhe-sion region. At point F, the elastic force of the cantilever becomes equivalent to the adhesive force,causing the cantilever to snap back to point G. As the tip travels in the liquid, it is deflected as well.The tip deflection occurs in the same direction as the piezo travels for the AFM used in this study.The liquid film thickness (h) is the sum of the travel distance of the piezo (described as h1 inFig. 26) and the deflection of cantilever (described as h2 in Fig. 26). Though previous studies show thath overestimates the actual liquid film thickness, it still provides a good measurement of the thicknessof droplet [23,53,131].
The resolution of volume (mass), thickness, and contact diameter was about 1 � 10�4 lm3 (0.12 fg),0.1 nm, and <1 nm, respectively. The resolution of volume was calculated with the measured data of
Droplet of liquid in contact with a surface, contact angle h. The thickness of droplet is h. The contact diameter betweenand surface is d. The radius of curvature of droplet is r [104].

Fig. 26. Force calibration plot for a droplet with 1.1 lm contact diameter on Si surface. The h is a measure of droplet thicknesson the surface.
46 B. Bhushan, Y.C. Jung / Progress in Materials Science 56 (2011) 1–108
the shift in the resonance frequency of the cantilever from 122.01 to 122.02 kHz during the evapora-tion time of 10 min. The resolutions of thickness and contact diameter measurements were from thecalibration data of the z piezo and x–y piezo by AFM vendor (Veeco), respectively. The accuracy of vol-ume, thickness, and contact diameter measurement was about ±10%, 10% and <1 nm, respectively.
5.1.7. Waterfall/jet testsTo investigate durability of the created surfaces in long-term exposure to water and different ki-
netic energies of water, a setup was constructed to provide a waterfall/jet flow as shown in Fig. 27[106]. The water from the laboratory faucet flowed through a pipe. Specimens were fixed on the stageby using a double-sided adhesive tape. Specimens are placed 2 mm below the four holes in the pipe. Inorder to minimize flow interruption on the specimens, the runoff plate was tilted to 45�. Waterfall/jetexperiments are composed of two different setups. First, water pressure was fixed at 10 kPa, and thenspecimens were exposed for 24 h. Next, in order to apply different kinetic energies of the water, thewater pressure was controlled between 0 and 45 kPa. The exposure time applied to the specimenswas 20 min for each experiment. During the tests, the change of static contact angle was measuredusing droplets of about 5 lL in volume (with radius of a spherical droplet about 1 mm) gently depos-ited on the substrate using a microsyringe. For contact angle hysteresis, the advancing and recedingcontact angles were measured at the front and back of the droplet moving along the tilted surface,respectively. The image of the droplet is obtained by a digital camcorder (Sony, DCRSR100, Tokyo, Ja-pan) with a 10� optical and 120� digital zoom. Images obtained were analyzed using Imagetool� soft-ware (University of Texas Health Science Center) for the contact angle.
Fig. 27. Schematics of waterfall/jet setup shown in front and side views [106].

B. Bhushan, Y.C. Jung / Progress in Materials Science 56 (2011) 1–108 47
5.1.8. Wear and friction testsTo investigate the durability of structured surfaces, wear tests on the surfaces were performed
using a commercial AFM (D3100, Nanoscope IIIa controller, Digital Instruments, Santa Barbara, CA)[106]. With the AFM in contact mode, the surfaces were worn using a 15 lm radius borosilicate ballthat was mounted on a triangular Si3N4 cantilever with a nominal spring constant of 0.58 N m�1. Wearscars with dimensions of 50 � 50 lm2 were created and scanned for 1 cycle at two different loads of100 nN and 10 lN. In order to analyze the changes in the morphology of structured surfaces beforeand after wear tests, surface height maps were obtained in dimensions of 100 � 100 lm2 using asquare pyramidal Si(1 0 0) tip with a native oxide layer which has a nominal radius of 20 nm on a rect-angular Si(1 0 0) cantilever with a spring constant of 3 N m�1 and at a natural frequency of 76 kHz intapping mode.
In order to investigate durability at a high load, macroscale wear and friction tests on the struc-tured surfaces were conducted based on an established procedure of using a ball-on-flat tribometerunder reciprocating motion [106]. A sapphire ball with a diameter of 3 mm and surface finish of about2 nm RMS was fixed on a stationary holder. A normal load of 10 mN was applied, and the frictionalforces were measured with semiconductor strain gauges, which were then digitized and collectedon a computer. Typical test conditions were: stroke length = 800 lm, average linear speed = 1 mm/s,temperature = 22 ± 1 �C, and relative humidity = 45 ± 5%. Wear was characterized by imaging theresulting scar with an optical microscope with a CCD camera (Nikon, Optihot-2) before and after weartests. The number of cycles to failure was determined by identifying the point where a sudden changein the friction force is observed.
5.2. Micro- and nanopatterned polymers
Jung and Bhushan [100] studied two types of polymers: poly(methyl methacrylate) (PMMA) andpolystyrene (PS). PMMA and PS were chosen because they are widely used in MEMS/NEMS devices.Both hydrophilic and hydrophobic surfaces can be produced by using these two polymers, as PMMAhas polar (hydrophilic) groups with high surface energy while PS has electrically neutral and non-polar(hydrophobic) groups with low surface energy. Furthermore, a PMMA structure can be madehydrophobic by treating it appropriately, for example by coating with a hydrophobic self-assembledmonolayer (SAM).
Four types of surface patterns were fabricated from PMMA: a flat film, low aspect ratio asperities(LAR, 1:1 height-to-diameter ratio), high aspect ratio asperities (HAR, 3:1 height-to-diameter ratio),and a replica of the Lotus leaf (the Lotus pattern). Two types of surface patterns were fabricated fromPS: a flat film and the Lotus pattern. Fig. 28 shows SEM images of the two types of nanopatternedstructures, LAR and HAR, and the one type of micropatterned structure, Lotus pattern, all on a PMMAsurface [46,100]. Both micro- and nanopatterned structures were manufactured using soft lithogra-phy. For nanopatterned structures, PMMA film was spin-coated on the silicon wafer. A UV-cured moldof polyurethane acrylate (PUA) resin with nanopatterns of interest was made which enables one tocreate sub-100-nm patterns with a high aspect ratio [58]. The mold was placed on the PMMA film,and a slight pressure of �10 g/cm2 (�1 kPa) was applied and annealed at 120 �C. Finally, the PUA moldwas removed from PMMA film. For micropatterned structures, a polydimethylsiloxane (PDMS) moldwas first made by casting PDMS against a Lotus leaf, followed by heating. Then, the mold was placedon the PMMA and PS film to create a positive replica of Lotus leaf. As shown in Fig. 28, it can be seenthat only microstructures exist on the surface of Lotus pattern [100].
Since PMMA by itself is hydrophilic, in order to obtain a hydrophobic sample, a self-assembledmonolayer (SAM) of perfluorodecyltriethoxysilane (PFDTES) was deposited on the sample surfacesusing a vapor phase deposition technique. PFDTES was chosen because of its hydrophobic nature.The deposition conditions for PFDTES were 100 �C temperature, 400 Torr pressure, 20 min depositiontime, and 20 min annealing time. The polymer surface was exposed to an oxygen plasma treatment(40 W, O2 187 Torr, 10 s) prior to coating [29]. The oxygen plasma treatment is necessary to oxidizeany organic contaminants on the polymer surface and to also alter the surface chemistry to allowfor enhanced bonding between the SAM and the polymer surface.

Fig. 28. Scanning electron micrographs of the two nanopatterned polymer surfaces (shown using two magnifications to seeboth the asperity shape and the asperity pattern on the surface) and the micropatterned polymer surface (Lotus pattern, whichhas only microstructures on the surface) [46,100].
48 B. Bhushan, Y.C. Jung / Progress in Materials Science 56 (2011) 1–108
5.2.1. Contact angle measurementsJung and Bhushan [100] measured the static contact angle of water with the micro- and nanopat-
terned PMMA and PS structures; see Fig. 29. Since the Wenzel roughness factor is the parameter thatoften determines wetting behavior, the roughness factor was calculated, and it is presented in Table 7for various samples. The data show that the contact angle of the hydrophilic materials decreases withan increase in the roughness factor, as predicted by the Wenzel model. When the polymers werecoated with PFDTES, the film surface became hydrophobic. Fig. 29 also shows the contact angle forvarious PMMA samples coated with PFDTES. For a hydrophobic surface, the standard Wenzel modelpredicts an increase of contact angle with roughness factor, which is what happens in the case of pat-terned samples. The calculated values of the contact angle for various micro- and nanopatterned sam-ples based on the contact angle of the smooth film and Wenzel equation are also presented. Themeasured contact angle values for the Lotus pattern were comparable with the calculated values,whereas for the LAR and HAR patterns they are higher. It suggests that nanopatterns benefit fromair pocket formation. For the PS material, the contact angle of the Lotus pattern also increased withincreased roughness factor.

Fig. 29. Contact angles for various micro- and nanopatterned surfaces on PMMA and PS polymers and calculated values usingWenzel equation [100].
Table 7Roughness factor for micro- and nanopatterned polymers [100].
LAR HAR Lotus
Rf 2.1 5.6 3.2
B. Bhushan, Y.C. Jung / Progress in Materials Science 56 (2011) 1–108 49
5.2.2. Effect of submicron dropletWetting phenomena have been well studied and understood at the macroscale; however, micro-
and nanoscale wetting mechanisms require further investigation. The actual contact angle, underwhich the liquid–vapor interface comes in contact with the solid surface at the micro- and nanoscale,is known to decrease with decreasing droplet size [170,52]. Jung and Bhushan [104] measured thecontact angle of micro- and nanodroplets on various surfaces based on the contact diameter, thick-ness, and volume of droplets measured using the atomic force microscopy-based technique. The con-tact angle for different droplet sizes on various surfaces is summarized in Fig. 30. The data for themicrodroplets with 2.4–8.1 lm diameter and nanodroplets with 0.22–1.1 lm diameter were com-pared with conventional contact angle measurements obtained with a droplet with 2.1 mm diameter(5 lL volume). The measured values of micro- and nanodroplets using an AFM were found to be lowerthan those of the macrodroplet [170,52]. There are several reasons for the scale dependence, such asthe effect of contact line tension of a three-phase system (solid–liquid–vapor), which is the excess free

Fig. 30. Contact angle measurements for different droplet sizes on various surfaces [104].
50 B. Bhushan, Y.C. Jung / Progress in Materials Science 56 (2011) 1–108
energy of a solid–liquid–vapor system per unit length of the contact line [170,52,174,156]. Anotherreason can be surface heterogeneity [52]. For a thin fluid film present on a surface, disjoining pressureof a film is repulsive, analogous to the repulsive van der Waals force across a film, and it causes a filmto spread on surfaces. It decreases with the liquid layer thickness [92]. This pressure may lead to asmaller contact angle at the nanoscale.
5.2.3. Scale dependence on adhesive forceJung and Bhushan [100] found that scale dependence of adhesion and friction forces are important
for this study because the tip/surface interface area changes with size. The meniscus force will changedue to either changing tip radius, the hydrophobicity of the sample, or the number of contacting andnear-contacting points. Fig. 31 shows the dependence of the tip radius and hydrophobicity on theadhesive force for PMMA and PFDTES coated on PMMA [100]. When the radius of the tip is changed,the contact angle of the sample is changed, and asperities are added to the sample surface, the adhe-sive force will change due to the change in the meniscus force and the real area of contact.
The two plots in Fig. 31 show the adhesive force on a linear scale for the different surfaces withvarying tip radius. The left bar chart in Fig. 31 is for hydrophilic PMMA film, Lotus pattern, LAR,and HAR, and shows the effect of tip radius and hydrophobicity on adhesive force. For increasing ra-dius, the adhesive force increases for each material. With a larger radius, the real area of contact andthe meniscus contribution increase, resulting in increased adhesion. The right bar chart in Fig. 31shows the results for PFDTES coated on each material. These samples show the same trends as the filmsamples, but the increase in adhesion is not as dramatic. The hydrophobicity of PFDTES on materialreduces meniscus forces, which in turn reduces adhesion from the surface. The dominant mechanism
Fig. 31. Scale dependent adhesive force for various micro- and nanopatterned surfaces measured using AFM tips of various radii[100].

B. Bhushan, Y.C. Jung / Progress in Materials Science 56 (2011) 1–108 51
for the hydrophobic material is real area of contact and not meniscus force, whereas with hydrophilicmaterial there is a combination of real area of contact and meniscus forces [100].
5.3. Micropatterned Si surfaces
Micropatterned surfaces produced from single-crystal silicon (Si) by photolithography and coatedwith a self-assembled monolayer (SAM) were used by Jung and Bhushan [101–103] in their study. Sil-icon has traditionally been the most commonly used structural material for micro/nanocomponents. ASi surface can be made hydrophobic by coating it with a SAM. One of the purposes of this investigationwas to study the transition from the Cassie–Baxter to Wenzel regime by changing the distance be-tween the pillars. To create micropatterned Si, two series of nine samples each were fabricated usingphotolithography [7]. Series 1 had 5-lm diameter and 10-lm height flat-top, cylindrical pillars withdifferent pitch values (7, 7.5, 10, 12.5, 25, 37.5, 45, 60, and 75) lm, and series 2 had 14-lm diameterand 30-lm height flat-top, cylindrical pillars with different pitch values (21, 23, 26, 35, 70, 105, 126,168, and 210) lm. The pitch is the spacing between the centers of two adjacent pillars. The SAM of1,1,-2,2,-tetrahydroperfluorodecyltrichlorosilane (PF3) was deposited on the Si sample surfaces usinga vapor phase deposition technique [7]. PF3 was chosen because of the hydrophobic nature of the sur-face. The thickness and root mean square (RMS) roughness of the SAM of PF3 were 1.8 nm and0.14 nm, respectively [108].
An optical profiler was used to measure the surface topography of the micropatterned surfaces[26,27,102,103]. One sample each from the two series was chosen to characterize the surfaces. Twodifferent surface height maps can be seen for the micropatterned Si in Fig. 32. In each case, a 3-Dmap and a flat map along with a 2-D profile in a given location of the flat 3-D map are shown. A scansize of 100 lm � 90 lm was used to obtain a sufficient amount of pillars to characterize the surfacebut also to maintain enough resolution to get an accurate measurement.
Let us consider the geometry of flat-top, cylindrical pillars of diameter D, height H, and pitch P, dis-tributed in a regular square array as shown in Fig. 32. For the special case of a droplet size much larger
Fig. 32. Surface height maps and 2-D profiles of the micropatterned surfaces using an optical profiler [26].

52 B. Bhushan, Y.C. Jung / Progress in Materials Science 56 (2011) 1–108
than P (of interest in this study), a droplet contacts the flat-top of the pillars forming the compositeinterface, and the cavities are filled with air. For this case, fLA ¼ 1� pD2
4P2 ¼ 1� fSL. Further assume thatthe flat tops are smooth with Rf = 1. The contact angles for the Wenzel and Cassie–Baxter regimes aregiven by Eqs. (6) and (9) [26]
Fig. 33Cassie–
Wenzel : cos h ¼ 1þ pDH
P2
� �cos h0 ð24Þ
Cassie—Baxter : cos h ¼ pD2
4P2 ðcos h0 þ 1Þ � 1 ð25Þ
Geometrical parameters of the flat-top, cylindrical pillars in series 1 and 2 are used for calculatingthe contact angle for the above-mentioned two cases. Fig. 33 shows the plot of the predicted values ofthe contact angle as a function of pitch between the pillars for the two cases. The Wenzel and Cassie–Baxter equations present two possible equilibrium states for a water droplet on the surface. This indi-cates that there is a critical pitch below which the composite interface dominates and above which thehomogeneous interface dominates the wetting behavior. Therefore, one needs to find the critical pointthat can be used to design superhydrophobic surfaces. Furthermore, even in cases where the liquiddroplet does not contact the bottom of the cavities, the water droplet can be in a metastable stateand can become unstable, with the transition from the Cassie–Baxter to Wenzel regime occurring ifthe pitch is large.
5.3.1. Cassie–Baxter and Wenzel transition criteriaA stable composite interface is essential for the successful design of superhydrophobic surfaces.
However, the composite interface is fragile, and it may transform into the homogeneous interface.
. Calculated static contact angle as a function of geometric parameters for a given value of h0 using the Wenzel andBaxter equations for two series of the micropatterned surfaces with different pitch values [26].

B. Bhushan, Y.C. Jung / Progress in Materials Science 56 (2011) 1–108 53
What triggers the transition between the regimes remains a subject of argument, although a numberof explanations have been suggested. Nosonovsky and Bhushan [154] have studied destabilizing fac-tors for the composite interface and found that a convex surface (with bumps) leads to a stable inter-face and high contact angle. Also, they have suggested the effects of a droplet’s weight and curvatureamong the factors which affect the transition.
Bhushan and Jung [26,27] and Jung and Bhushan [101–103] investigated the effect of droplet cur-vature on the Cassie–Baxter and Wenzel regime transition. First, they considered a small water dropletsuspended on a superhydrophobic surface consisting of a regular array of circular pillars with diam-eter D, height H, and pitch P as shown in Fig. 34. The local deformation for small droplets is governedby surface effects rather than gravity. The curvature of a droplet is governed by the Laplace equation,which relates the pressure inside the droplet to its curvature [2]. Therefore, the curvature is the sameat the top and at the bottom of the droplet [156]. For the micropatterned surface considered here, themaximum droop of the droplet occurs in the center of the square formed by the four pillars as shownin Fig. 34a. Therefore, the maximum droop of the droplet (d) in the recessed region can be found in themiddle of two pillars which are diagonally across as shown in Fig. 34b, which is ð
ffiffiffi2p
P � DÞ2=ð8RÞ. If thedroop is greater than the depth of the cavity, then the droplet will just contact the bottom of the cav-ities between pillars. If it is much greater, transition from the Cassie–Baxter to Wenzel regime occurs
Fig. 34.The madroop o
ðffiffiffi2p
P � DÞ2=R P H ð26Þ
To investigate the dynamic effect of a bouncing water droplet on the Cassie–Baxter and Wenzelregime transition, Jung and Bhushan [103] considered a water droplet hitting a superhydrophobic
A liquid droplet suspended on a superhydrophobic surface consisting of a regular array of circular pillars. (a) Plan view.ximum droop of droplet occurs in the center of square formed by four pillars. (b) Side view in section A–A. The maximumf droplet (d) can be found in the middle of two pillars which are diagonally across [101].

54 B. Bhushan, Y.C. Jung / Progress in Materials Science 56 (2011) 1–108
surface as shown in Fig. 34. As the droplet hits the surface at velocity V, a liquid–air interface belowthe droplet is formed when the dynamic pressure is less than the Laplace pressure. The Laplace pres-sure can be written as
pL ¼ 2c=R ¼ 16cd=ðffiffiffi2p
P � DÞ2 ð27Þ
where c is the surface tension of the liquid–air interface, and the dynamic pressure of the droplet isequal to
pd ¼12qV2 ð28Þ
where q is the mass density of the liquid droplet. If the maximum droop of the droplet (d) is largerthan the height of pillar (H), the droplet contacts the bottom of the cavities between pillars. Determi-nation of the critical velocity at which the droplet touches the bottom is obtained by equating the La-place pressure to the dynamic pressure. To develop a composite interface, velocity should be smallerthan the critical velocity given as
V <
ffiffiffiffiffiffiffiffiffiffiffiffiffiffiffiffiffiffiffiffiffiffiffiffiffiffiffiffi32cH
qðffiffiffi2p
P � DÞ2
sð29Þ
Furthermore, in the case of large distances between the pillars, the liquid–air interface can easily bedestabilized due to dynamic effects. This leads to the formation of the homogeneous solid–liquidinterface [154].
Nosonovsky and Bhushan [163] used the energy barrier approach to study the Cassie–Baxter andWenzel transition. The energy barrier is given by the product of height of the pillars, H, pillar perim-eter, pD, pillar density, 1/P2, and the area, A0, required to initiate the transition, and the correspondingchange in the surface energy
DE ¼ A0pHD
P2 ðcSL � cSAÞ ¼ �A0pHD
P2 cLA cos h0 ð30Þ
where A0 is p(R sin h)2.For a short pitch, the net energy of the Cassie–Baxter state is lower than that of the Wenzel state,
whereas for larger pitch values, the energy of the Wenzel state is lower (Fig. 14c). However, due to theenergy barriers, a metastable Cassie–Baxter state with a higher energy than the Wenzel state may befound.
The energy barrier of the Cassie–Baxter and Wenzel transition can be estimated as the kinetic en-ergy of the droplet. The kinetic energy of a droplet of radius R0, mass m, and density q with the velocityV is given by
Ekin ¼ð4=3ÞpqR3V2
2ð31Þ
5.3.2. Contact angle measurementsIn order to study the effect of pitch value on the transition from Cassie–Baxter to Wenzel regime,
the static contact angles were measured on the micropatterned Si coated with PF3, and the data areplotted as a function of pitch between the pillars in Fig. 35a [26,27,101–103]. A dotted line representsthe transition criteria range obtained using Eq. (26). The flat Si coated with PF3 showed a static contactangle of 109�. The contact angle of selected micropatterned surfaces is much higher than that of theflat surfaces. It first increases with an increase in the pitch values, then drops rapidly to a value slightlyhigher than that of the flat surfaces. In the first portion, it jumps to a high value of 152� correspondingto a superhydrophobic surface and continues to increase to 170� at a pitch of 45 lm in series 1 and126 lm in series 2 because open air space increases with an increase in pitch, responsible for propen-sity of air pocket formation. The sudden drop at about a pitch value of 50 lm in series 1 and 150 lm inseries 2 corresponds to the transition from the Cassie–Baxter to the Wenzel regime. In series 1, thevalue predicted from the curvature transition criteria (Eq. (26)) is a little higher than the experimental

Fig. 35. (a) Static contact angle (a dotted line represents the transition criteria range obtained using Eq. (26) and (b) contactangle hysteresis and tilt angle as a function of geometric parameters for two series of the micropatterned surfaces with differentpitch values for a droplet with 1 mm in radius (5 lL volume). Data at zero pitch correspond to a flat sample [26,101].
B. Bhushan, Y.C. Jung / Progress in Materials Science 56 (2011) 1–108 55
observations. However, in series 2, there is a good agreement between the experimental data and thevalues theoretically predicted by Jung and Bhushan [101–103] for the Cassie–Baxter and Wenzeltransition.

56 B. Bhushan, Y.C. Jung / Progress in Materials Science 56 (2011) 1–108
Fig. 35b shows contact angle hysteresis and tilt angle as a function of pitch between the pillars[26,27]. Both angles are comparable. The flat Si coated with PF3 showed a contact angle hysteresisof 34� and tilt angle of 37�. The angle first increases with an increase of pitch value, which has todo with pinning of the droplet at the sharp edges of the micropillars. Fig. 36 shows droplets on micr-opatterned Si with 5-lm diameter and 10-lm height pillars with different pitch values. The asymmet-rical shape of the droplet signifies pinning. The pinning on the micropatterned surfaces can beobserved as compared to the flat surface. The micropatterned surface with low pitch (7 lm) has morepinning than the micropatterned surface with high pitch (37.5 lm), because the micropatterned sur-face with low pitch has more sharp edges in contact with a droplet. As the pitch increases, there is ahigher propensity of air pocket formation and fewer numbers of sharp edges per unit area, which isresponsible for sudden drop in the angle. The lowest contact angle hysteresis and tilt angle are 5�and 3�, respectively, which were observed on the micropatterned Si with 45 lm of series 1 and
Fig. 36. Optical micrographs of droplets on the inclined micropatterned surfaces with different pitch values. The images weretaken when the droplet started to move down. Data at zero pitch correspond to a flat sample [26].

B. Bhushan, Y.C. Jung / Progress in Materials Science 56 (2011) 1–108 57
126 lm of series 2. Above a pitch value of 50 lm in series 1 and 150 lm in series 2, the angle increasesvery rapidly because of transition to the Wenzel regime.
These results suggest that air pocket formation and the reduction of pinning in the micropatternedsurface play an important role for a surface with both low contact angle hysteresis and tilt angle[26,27]. Hence, to create superhydrophobic surfaces, it is important that they are able to form a stablecomposite interface with air pockets between solid and liquid.
5.3.3. Observation of transition during the droplet evaporationIn order to study the effect of droplet size on the transition from a composite state to a wetted
state, Jung and Bhushan [101,102] performed droplet evaporation experiments to observe the Cas-sie–Baxter and Wenzel transition on two different micropatterned Si surfaces coated with PF3. Theseries of four images in Fig. 37 show the successive photos of a droplet evaporating on the two micr-opatterned surfaces. The initial radius of the droplet was about 700 lm, and the time interval betweenfirst two photos was 180 s and between the latter two was 60 s. In the first three photos, the droplet isshown in a Cassie–Baxter state, and its size gradually decreases with time. However, as the radius ofthe droplet reached 360 lm on the surface with 5-lm diameter, 10-lm height, and 37.5-lm pitch pil-lars, and 423 lm on the surface with 14-lm diameter, 30-lm height, and 105-lm pitch pillars, thetransition from the Cassie–Baxter to Wenzel regime occurred, as indicated by the arrow. The lightpasses below the first droplet, indicating that air pockets exist, so that the droplet is in the Cassie–Bax-ter state. However, an air pocket is not visible below the last droplet, so it is in the Wenzel state. Thiscould result from an impalement of the droplet in the micropatterned surface, characterized by asmaller contact angle.
Fig. 37. Evaporation of a droplet on two different micropatterned surfaces. The initial radius of the droplet is about 700 lm, andthe time interval between first two photos was 180 s and between the latter two was 60 s. As the radius of droplet reaches360 lm on the surface with 5-lm diameter, 10-lm height, and 37.5-lm pitch pillars, and 420 lm on the surface with 14-lmdiameter, 30-lm height, and 105-lm pitch pillars, the transition from the Cassie–Baxter regime to Wenzel regime occurs, asindicated by the arrow. Before the transition, air pocket is clearly visible at the bottom area of the droplet, but after thetransition, air pocket is not found at the bottom area of the droplet [102].

58 B. Bhushan, Y.C. Jung / Progress in Materials Science 56 (2011) 1–108
To find the contact angle before and after the transition, the values of the contact angle are plottedagainst the theoretically predicted value, based on the Wenzel (calculated using Eq. (6)) and Cassie–Baxter (calculated using Eq. (9)) models. Fig. 38 shows the static contact angle as a function of geomet-ric parameters for the experimental contact angles before (circle) and after (triangle) the transitioncompared to the Wenzel and Cassie–Baxter equations (solid lines) with a given value of h0 for two ser-ies of micropatterned Si with different pitch values coated with PF3 [102]. The fit is good between theexperimental data and the theoretically predicted values for the contact angles before and aftertransition.
To prove the validity of the transition criteria in terms of droplet size, the critical radius of a dropletdeposited on the micropatterned Si with different pitch values coated with PF3 is measured during theevaporation experiment [101,102]. Fig. 39 shows the radius of a droplet as a function of geometricparameters for the experimental results (circle) compared with the transition criterion (Eq. (26)) fromthe Cassie–Baxter regime to Wenzel regime (solid lines) for two series of micropatterned Si with dif-ferent pitch values coated with PF3. It is found that the critical radius of impalement is in good quan-titative agreement with our predictions. The critical radius of the droplet increases linearly with thegeometric parameter (pitch). For the surface with small pitch, the critical radius of droplet can becomequite small.
To verify the transition, Jung and Bhushan [101,102] used another approach using dust mixed inwater. Fig. 40 presents the dust trace remaining after droplet with 1 mm radius (5 lL volume) evap-oration on the two micropatterned Si surfaces. As shown in the top image, after the transition from theCassie–Baxter regime to Wenzel regime, the dust particles remained not only at the top of the pillarsbut also at the bottom with a footprint size of about 450 lm. However, as shown in the bottom image,the dust particles remained on only a few pillars with a footprint size of about 25 lm until the end of
Fig. 38. Receding contact angle as a function of geometric parameters before (circle) and after (triangle) transition comparedwith predicted static contact angle values obtained using the Wenzel and Cassie–Baxter equations (solid lines) with a givenvalue of h0 for two series of the micropatterned surfaces with different pitch values [102].

Fig. 39. Radius of droplet as a function of geometric parameters for the experimental results (circle) compared with thetransition criteria from the Cassie–Baxter regime to Wenzel regime (solid lines) for two series of the micropatterned surfaceswith different pitch values [102].
B. Bhushan, Y.C. Jung / Progress in Materials Science 56 (2011) 1–108 59
the evaporation process. From Fig. 39, it is observed that the transition occurs at about 300 lm radiusof droplet on the 5-lm diameter and 10-lm height pillars with 37.5-lm pitch, but the transition doesnot occur on the patterned Si surface with pitch of less than about 5 lm. These experimental obser-vations are consistent with model predictions. In the literature, it has been shown that on superhydro-phobic natural Lotus, the droplet remains in the Cassie–Baxter regime during the evaporation process[209]. This indicates that the distance between the pillars should be minimized enough to improve theability of the droplet to resist sinking.
5.3.4. Scaling of the Cassie–Baxter and Wenzel transition for different seriesNosonovsky and Bhushan [153,155,156,158,160] studied the data for the Cassie–Baxter and Wen-
zel transition with the two series of surfaces using the non-dimensional spacing factor
Sf ¼DP
ð32Þ
The values of the droplet radius at which the transition occurs during the evaporation plottedagainst the spacing factor scale well for the two series of the experimental results, yielding virtuallythe same straight line. Thus the two series of micropatterned surfaces scale well with each other, andthe transition occurs at the same value of the spacing factor multiplied by the droplet radius (Fig. 41a).The physical mechanism leading to this observation remains to be determined, however, it is notedthat this mechanism is different from the one suggested by Eq. (26). The observation suggests thatthe transition is a linear one-dimensional (1-D) phenomenon and that neither droplet droop (thatwould involve P2/H) nor droplet weight (that would involve R3) are responsible for the transition,but rather linear geometric relations are involved. Note that the experimental values approximately

Fig. 40. Dust trace remained after droplet evaporation for the micropatterned surface. In the top image, the transition occurredat 360 lm radius of droplet, and in the bottom image, the transition occurred at about 20 lm radius of droplet during theprocess of droplet evaporation. The footprint size is about 450 and 25 lm for the top and bottom images, respectively [102].
60 B. Bhushan, Y.C. Jung / Progress in Materials Science 56 (2011) 1–108
correspond to the values of the ratio RD/P = 50 lm, or the total area of the pillar tops under the droplet(pD2/4)pR2/P2 = 6200 lm2.
5.3.5. Contact angle hysteresis and wetting/dewetting asymmetryContact angle hysteresis can be viewed as a result of two factors that act simultaneously. First, the
changing contact area affects the contact angle hysteresis, since a certain value of contact angle hys-teresis is inherent for even a nominally flat surface. Decreasing the contact area by increasing the pitchbetween the pillars leads to a proportional decrease of the contact angle hysteresis. This effect isclearly proportional to the contact area between the solid surface and the liquid droplet. Second,the edges of the pillar tops prevent the motion of the triple line. This roughness effect is proportionalto the contact line density, and its contribution was, in the experiment, comparable with the contactarea effect. Interestingly, the effect of the edges is much more significant for the advancing than for thereceding contact angle.
Nosonovsky and Bhushan [153,155,156,158,160] studied the wetting of two series of micropat-terned Si surfaces with different pitch values coated with PF3 based on the spacing factor (Eq. (32)).They found that the contact angle hysteresis involves two terms (Fig. 41b): the term S2
f (p/4)(cos hadv0 � cos hrec0) corresponding to the adhesion hysteresis (which is found even at a nominallyflat surface and is a result of molecular-scale imperfectness), and the term Hr / D=P2 corresponding tomicroscale roughness and proportional to the edge line density. Thus the contact angle hysteresis isgiven, based on Eq. (18) and (32), by using Rf ¼ 1þ pDH
P2 and fLA ¼ 1� pD2
4P2 ¼ 1� fSL [30,154]

Fig. 41. (a) Droplet radius, R, for the Cassie–Baxter and Wenzel transition as a function of P/D = 1/Sf. It is observed that thetransition takes place at a constant value of RD/P � 50 lm (dashed line). This shows that the transition is a linear phenomenon.(b) Contact angle hysteresis as a function of Sf for the 1st (squares) and 2nd (diamonds) series of the experiments comparedwith the theoretically predicted values of cos hadv � cos hrec = (D/P)2(p/4)(cos hadv0 � cos hrec0) + c(D/P)2, where c is a propor-tionality constant. It is observed that when only the adhesion hysteresis/interface energy term is considered (c = 0), thetheoretical values are underestimated by about a half, whereas c = 0.5 provides a good fit. Therefore, the contribution of theadhesion hysteresis is of the same order of magnitude as the contribution kinetic effects [155].
B. Bhushan, Y.C. Jung / Progress in Materials Science 56 (2011) 1–108 61
cos hadv � cos hrec ¼p4
S2f ðcos hadv0 � cos hrec0Þ þ Hr ð33Þ
Besides the contact angle hysteresis, the asymmetry of the Wenzel and Cassie–Baxter states is theresult of the wetting/dewetting asymmetry. While the fragile metastable Cassie–Baxter state is oftenobserved, as well as its transition to the Wenzel state, the opposite transition never happens. UsingEqs. (24) and (25), the contact angle with micropatterned surfaces is given by [30,154]
cos h ¼ ð1þ 2pS2f Þ cos h0 ðWenzel stateÞ ð34Þ
cos h ¼ p4
S2f ðcos h0 þ 1Þ � 1 ðCassie� Baxter stateÞ ð35Þ
For a perfect macroscale system, the transition between the Wenzel and Cassie–Baxter statesshould occur only at the intersection of the two regimes (the point at which the contact angle andnet energies of the two regimes are equal, corresponding to Sf = 0.51). It is observed, however, thatthe transition from the metastable Cassie–Baxter to stable Wenzel occurs at much lower values ofthe spacing factor 0.083 < Sf < 0.111. As shown in Fig. 42a, the stable Wenzel state (i) can transforminto the stable Cassie–Baxter state with increasing Sf (ii). The metastable Cassie–Baxter state (iii)can abruptly transform (iv) into the stable Wenzel state (i). The transition point (i–ii) correspondsto equal free energies in the Wenzel and Cassie–Baxter states. Whereas the transition (iv) correspondsto the Wenzel energy much lower than the Cassie–Baxter energy and thus involves significant energydissipation and is irreversible [155]. The solid and dashed straight lines correspond to the values of thecontact angle, calculated from Eqs. (34) and (35) using the contact angle for a nominally flat surface,h0 = 109�. The two series of the experimental data are shown with squares and diamonds.
Fig. 42b shows the values of the advancing contact angle plotted against the spacing factor(Eq. (32)). The solid and dashed straight lines correspond to the values of the contact angle for the

Fig. 42. Theoretical (solid and dashed) and experimental (squares for the 1st series, diamonds for the 2nd series) (a) contactangle as a function of the spacing factor, (b) advancing contact angle, and (c) receding contact angle and values of the contactangle observed after the transition during evaporation (blue) [155].
62 B. Bhushan, Y.C. Jung / Progress in Materials Science 56 (2011) 1–108
Wenzel and Cassie–Baxter states, calculated from Eqs. (34) and (35) using the advancing contact anglefor a nominally flat surface, hadv0 = 116� [155]. It is observed that the calculated values underesti-mate the advancing contact angle, especially for big Sf (small distance between the pillars or pitchP). This is understandable, because the calculation takes into account only the effect of the contactarea and ignores the effect of roughness and edge line density (it corresponds to Hr = 0 in Eq. (33)),while this effect is more pronounced for high pillar density (big Sf). In a similar manner, the contactangle is underestimated for the Wenzel state, since the pillars constitute a barrier for the advancingdroplet.
Fig. 42c shows the values of the contact angle after the transition took place (squares and dia-monds), as it was observed during evaporation [155]. For both series, the values almost coincide.

B. Bhushan, Y.C. Jung / Progress in Materials Science 56 (2011) 1–108 63
For comparison, the values of the receding contact angle measured for millimeter-sized water dropletsare also shown (squares and diamonds), since evaporation constitutes removing liquid, and thus thecontact angle during evaporation should be compared with the receding contact angle. The solid anddashed straight lines correspond to the values of the contact angle, calculated from Eqs. (34) and (35)using the receding contact angle for a nominally flat surface, hrec0 = 82�. Fig. 42c demonstrates a goodagreement between the experimental data and Eqs. (34) and (35).
In the analysis of the evaporation data of micropatterned surfaces, Nosonovsky and Bhushan [158]found several effects specific for the multiscale character of this process. First, they discussed theapplicability of the Wenzel and Cassie–Baxter equations for average surface roughness and heteroge-neity. These equations relate the local contact angle with the apparent contact angle of a rough/het-erogeneous surface. However, it is not obvious what should be the size of roughness/heterogeneityaveraging, since the triple line at which the contact angle is defined has two very different lengthscales: its width is of molecular size scale while its length is on the order of the size of the droplet (thatis, microns or millimeters). They presented an argument that in order for the averaging to be valid, theroughness details should be small compared to the size of the droplet (and not the molecular size).They showed that while for uniform roughness/heterogeneity the Wenzel and Cassie–Baxter equa-tions can be applied, for a more complicated case of non-uniform heterogeneity, the generalized equa-tions should be used. The proposed generalized Cassie–Baxter and Wenzel equations are consistentwith a broad range of available experimental data. The generalized equations are valid both in thecases when the classical Wenzel and Cassie–Baxter equations can be applied as well as in the caseswhen the later fail.
The macroscale contact angle hysteresis and Cassie–Baxter and Wenzel transition cannot be deter-mined from the macroscale equations and are governed by micro- and nanoscale effects, so wetting isa multiscale phenomenon [153,155,156,158,160]. The kinetic effects associated with contact anglehysteresis should be studied at the microscale, whereas the effects of adhesion hysteresis and the Cas-sie–Baxter and Wenzel transition involve processes at the nanoscale. Their theoretical arguments aresupported by the experimental data on micropatterned surfaces. The experimental study of the con-tact angle hysteresis demonstrates that two different processes are involved: the changing solid–li-quid area of contact and pinning of the triple line. The latter effect is more significant for theadvancing than for the receding contact angle. The transition between wetting states was observedfor evaporating microdroplets, and droplet radius scales well with the geometric parameters of themicropattern.
5.3.6. Observation of transition during the bouncing dropletJung and Bhushan [103] performed bouncing droplet experiments to observe how impact velocity
influences the Cassie–Baxter and Wenzel transition during the droplet hitting the surface on two dif-ferent micropatterned Si surfaces with PF3. Fig. 43 shows snapshots of a droplet with 1 mm radius hit-ting the surfaces. The impact velocity was obtained just prior to the droplet hitting the surface. Asshown in images in the first row for the two sets of surfaces, the droplet hitting the surface underan impact velocity of 0.44 m/s first deformed and then retracted, and bounced off the surface. Finally,the droplet sat on the surface and had a high contact angle, which suggests the formation of a solid–air–liquid interface. Next, they repeated the impact experiment by increasing the impact velocity. Thebounce off does not occur, and the wetting of the surface (and possibly pinning of droplet) occurred atan impact velocity of 0.88 m/s and 0.76 m/s, respectively, referred to as the critical velocity (describedearlier). The second row of the two sets of images shows the images of the droplet at the critical veloc-ity. After the droplet hit the surface, it wetted the surface (possibly the droplet was also pinned) afterthe deformation of the droplet. This is because air pockets do not exist below the droplet as a result ofdroplet impalement by the pillars, characterized by a smaller contact angle. These observations indi-cate the transition from a Cassie–Baxter to a Wenzel regime.
To identify whether one is in a Wenzel regime or a Cassie–Baxter regime, the contact angle data inthe static condition and after bounce off were plotted [103]. Fig. 44 shows the measured static contactangle as a function of geometric parameters for the droplet with 1 mm radius gently deposited on thesurface (circles) and for the droplet with 1 mm radius after hitting the surface at 0.44 m/s (triangles).The data are compared with predicted static contact angle values obtained using the Wenzel and the

Fig. 43. Snapshots of a droplet with 1 mm radius hitting on two different micropatterned surfaces. The impact velocity wasobtained just prior to the droplet hitting the surface. The pinning of droplet on the surface with 5-lm diameter, 10-lm heightand 10-lm pitch pillars, and on the surface with 14-lm diameter, 30-lm height and 26-lm pitch pillars occurred at impactvelocity of 0.88 m/s and 0.76 m/s, respectively [103].
64 B. Bhushan, Y.C. Jung / Progress in Materials Science 56 (2011) 1–108
Cassie–Baxter equations (solid lines) with a given value of h0 (109�) for a smooth surface for two seriesof the micropatterned surfaces. In the case of the droplet gently deposited on the surface, as the pitchincreases up to 45 lm of series 1 and 126 lm of series 2, the static contact angle first increases grad-ually from 152� to 170�. Then, the contact angle starts decreasing sharply. The increase in the contactangle occurs because of an increase in the roughness factor and the formation of composite surface[26]. The decrease in contact angle at pitch values higher than 60 lm for series 1 and 168 lm for series2 occurs due to the transition from composite interface to solid–liquid interface. In the case of thedroplet hitting the surface at 0.44 m/s, it is shown that the liquid–air interface can easily be destabi-lized due to dynamic impact on the surface with a pitch value higher than 12.5 lm for series 1 and70 lm for series 2, although the droplet is in the Cassie–Baxter regime when it is gently depositedon the surface. The static contact angle of the droplet after hitting at 0.44 m/s is lower than that ofthe droplet gently deposited. It can be interpreted that after hitting, the droplet contacts the bottomof the cavities between pillars and pushes out the entrapped air under the droplet, resulting in anabrupt increase of the solid–liquid surface area by dynamic impact. It will be shown in the followingparagraph that the critical velocity at which wetting occurs for series 1 and series 2 samples is equal toabout 0.44 m/s at pitch values lager than 12.5 lm and 70 lm, respectively. Thus, wetting at the veloc-ity used here is expected.
To study the validity of the transition criterion (Eq. (29)), the critical impact velocity at which wet-ting of the surface (possibly pinning of droplet) occurs was measured [103]. For calculations, the sur-face tension of the water–air interface (c) was taken at 0.073 N/m, the mass density (q) is 1000 kg/m3

Fig. 44. Measured static contact angle as a function of geometric parameters for the droplet with 1 mm radius gently depositedon the surface (circles) and for the droplet with 1 mm radius after hitting the surface at 0.44 m/s (triangles). The data arecompared with predicted static contact angle values obtained using Wenzel and Cassie–Baxter equations (solid lines) with agiven value of h0 (109�) for a smooth surface for two series of the micropatterned Si with different pitch values [103].
B. Bhushan, Y.C. Jung / Progress in Materials Science 56 (2011) 1–108 65
for water, and 1 kg m/s2 = 1 N [2]. Fig. 45 shows the measured critical impact velocity of a droplet with1 mm radius as a function of geometric parameters (triangles). The trends are compared with the pre-dicted curve (solid lines). It is found that the critical impact velocity at which wetting occurs is in goodquantitative agreement with our predictions. The critical impact velocity of the droplet decreases withthe geometric parameter (pitch). For the surface with small pitch, the critical impact velocity of drop-let can be large.
The energy barrier of the Cassie–Baxter and Wenzel transition can be estimated as the kinetic en-ergy of the droplets [163]. Fig. 46 shows the dependence of the kinetic energy corresponding to thetransition, Ekin, on DE/(A0cosh0) calculated from Eq. (30). It is observed that the dependence is closeto linear, however, the series of smaller pillars has larger energies of transition. The value of A0 is inthe range 0.11 mm2 < A0 < 0.18 mm2 for series 1 and 0.05 mm2 < A0 < 0.11 mm2 for series 2, which isof the same order as the actual area under the droplet.
These results suggest that the energy barrier for the Cassie–Baxter and Wenzel transition is givenby Eq. (30) and is proportional to the area under the droplet [163]. For droplets sitting on the surfaceor evaporating, the transition takes place when the size of the barrier decreases to the value of thevibrational energy, U. The vibrational energy of the droplet is the energy associated with the vibrationof the droplet due to surface waves, thermal vibration, etc. Assuming U = const, the proportionality ofP/D and R suggests that the energy barrier is proportional to the RD/P. This is indeed true, since thearea under the droplet A0 = p(R sin h)2. Substitutiong sin2 h = 0.1, cos h0 = cos 109� = �0.33,cLA = 0.072 J/m2 in Eq. (30) and taking the observed value RD/P = 50 lm yields an estimated value of

Fig. 45. Measured critical impact velocity of droplet with 1 mm radius as a function of geometric parameters (triangles). Thedata are compared with the criterion of impact velocity for the pinning of droplet (solid lines) for two series of themicropatterned Si with different pitch values [103].
Fig. 46. Bouncing droplets dependency of the kinetic energy of a droplet corresponding to the regime transition upon theenergy barrier calculated from Eq. (30) (squares for series 1 and diamonds for series 2). The fit (solid line) is shown forA0 = 0.12 mm2 [163].
66 B. Bhushan, Y.C. Jung / Progress in Materials Science 56 (2011) 1–108
the vibrational energy U = 1.2 � 10�10 J. The transition happens because the size of the droplet is de-creased or because the pitch between the pillars that cover the surface is increased. A different way toovercome the barrier is to hit the surface with a droplet with a certain kinetic energy.
Based on Nosonovsky and Bhushan [163], the vibrational energy U also plays a role in overcomingenergy barriers that lead to contact angle hysteresis during liquid flow [99]. To estimate the effect of
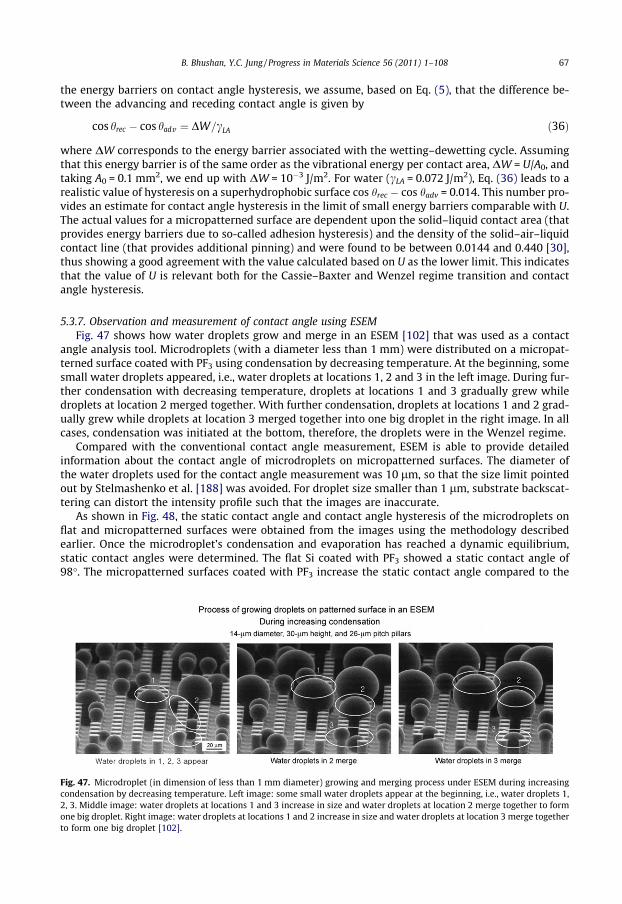
B. Bhushan, Y.C. Jung / Progress in Materials Science 56 (2011) 1–108 67
the energy barriers on contact angle hysteresis, we assume, based on Eq. (5), that the difference be-tween the advancing and receding contact angle is given by
Fig. 47conden2, 3. Mione bigto form
cos hrec � cos hadv ¼ DW=cLA ð36Þ
where DW corresponds to the energy barrier associated with the wetting–dewetting cycle. Assumingthat this energy barrier is of the same order as the vibrational energy per contact area, DW = U/A0, andtaking A0 = 0.1 mm2, we end up with DW = 10�3 J/m2. For water (cLA = 0.072 J/m2), Eq. (36) leads to arealistic value of hysteresis on a superhydrophobic surface cos hrec � cos hadv = 0.014. This number pro-vides an estimate for contact angle hysteresis in the limit of small energy barriers comparable with U.The actual values for a micropatterned surface are dependent upon the solid–liquid contact area (thatprovides energy barriers due to so-called adhesion hysteresis) and the density of the solid–air–liquidcontact line (that provides additional pinning) and were found to be between 0.0144 and 0.440 [30],thus showing a good agreement with the value calculated based on U as the lower limit. This indicatesthat the value of U is relevant both for the Cassie–Baxter and Wenzel regime transition and contactangle hysteresis.
5.3.7. Observation and measurement of contact angle using ESEMFig. 47 shows how water droplets grow and merge in an ESEM [102] that was used as a contact
angle analysis tool. Microdroplets (with a diameter less than 1 mm) were distributed on a micropat-terned surface coated with PF3 using condensation by decreasing temperature. At the beginning, somesmall water droplets appeared, i.e., water droplets at locations 1, 2 and 3 in the left image. During fur-ther condensation with decreasing temperature, droplets at locations 1 and 3 gradually grew whiledroplets at location 2 merged together. With further condensation, droplets at locations 1 and 2 grad-ually grew while droplets at location 3 merged together into one big droplet in the right image. In allcases, condensation was initiated at the bottom, therefore, the droplets were in the Wenzel regime.
Compared with the conventional contact angle measurement, ESEM is able to provide detailedinformation about the contact angle of microdroplets on micropatterned surfaces. The diameter ofthe water droplets used for the contact angle measurement was 10 lm, so that the size limit pointedout by Stelmashenko et al. [188] was avoided. For droplet size smaller than 1 lm, substrate backscat-tering can distort the intensity profile such that the images are inaccurate.
As shown in Fig. 48, the static contact angle and contact angle hysteresis of the microdroplets onflat and micropatterned surfaces were obtained from the images using the methodology describedearlier. Once the microdroplet’s condensation and evaporation has reached a dynamic equilibrium,static contact angles were determined. The flat Si coated with PF3 showed a static contact angle of98�. The micropatterned surfaces coated with PF3 increase the static contact angle compared to the
. Microdroplet (in dimension of less than 1 mm diameter) growing and merging process under ESEM during increasingsation by decreasing temperature. Left image: some small water droplets appear at the beginning, i.e., water droplets 1,ddle image: water droplets at locations 1 and 3 increase in size and water droplets at location 2 merge together to formdroplet. Right image: water droplets at locations 1 and 2 increase in size and water droplets at location 3 merge togetherone big droplet [102].

68 B. Bhushan, Y.C. Jung / Progress in Materials Science 56 (2011) 1–108
flat surface coated with PF3 due to the effect of roughness. Advancing and receding contact angleswere measured during condensation/evaporation with decreasing/increasing the temperature of thecooling stage, and the contact angle hysteresis was then calculated [102].
Fig. 49 shows contact angle hysteresis as a function of geometric parameters for the microdropletsformed in the ESEM (triangles) for two series of micropatterned Si with different pitch values coatedwith PF3. Data at zero pitch correspond to a flat Si sample. The droplets with about 20 lm radii, whichare larger than the pitch, were selected in order to look at the effect of pillars in contact with the drop-let. These data were compared with conventional contact angle measurements with the droplet with1 mm radius (5 lL volume) (circle and solid lines) [26]. When the distance between pillars increasesabove a certain value, the contact area between the micropatterned surface and the droplet decreases,resulting in a decrease of the contact angle hysteresis. Both droplets with 1 mm and 20 lm radiishowed the same trend. The contact angle hysteresis for the micropatterned surfaces with low pitchare higher compared to the flat surface due to the effect of sharp edges on the pillars, resulting in pin-ning [150]. Contact angle hysteresis for a flat surface can arise from roughness and surface heteroge-neity. For a droplet advancing forward on the micropatterned surfaces, the line of contact of the solid,
Fig. 48. Microdroplets on flat and two micropatterned surfaces using ESEM. Second set of images were taken during increasingcondensation, and the third set of images were taken during increasing evaporation. Static contact angle was measured whenthe droplet was stable. Advancing contact angle was measured after increasing condensation by decreasing the temperature ofthe cooling stage. Receding contact angle was measured after decreasing evaporation by increasing the temperature of thecooling stage [102].

Fig. 49. Contact angle hysteresis as a function of geometric parameters for the microdroplet with about 20 lm radius fromESEM (triangle) compared with the droplet with 1 mm radius (5 lL volume) (circle and solid lines) for two series of themicropatterned surfaces with different pitch values. Data at zero pitch correspond to a flat sample [102].
B. Bhushan, Y.C. Jung / Progress in Materials Science 56 (2011) 1–108 69
liquid, and air will be pinned at the edge point until it is able to move, resulting in increasing contactangle hysteresis. The contact angle hysteresis for the microdroplet from ESEM is lower as compared tothat for the droplet with 1 mm radius. The difference of contact angle hysteresis between a microdro-plet and a droplet with 1 mm radius could come from the different pinning effects, because the latterhas more sharp edges in contact with a droplet compared to the former. The results show how dropletsize can affect the wetting properties of micropatterned Si surfaces [102].
5.4. Ideal surfaces with hierarchical structure
It has been reported earlier that a hierarchical surface is needed to develop a composite interfacewith high stability. The structure of an ideal hierarchical surface is shown in Fig. 50. The asperitiesshould be high enough so that the droplet does not touch the valleys. As an example, for a structurewith circular pillars, the following relationship should hold for a composite interface;ðffiffiffi2p
P � DÞ2=R < H, Eq. (26). As an example, for a droplet with a radius on the order of 1 mm or larger,a value of H on the order of 30 lm, D on the order of 15 lm, a P on the order of 130 lm (Fig. 35) isoptimum. Nanoasperities can pin the liquid–air interface and thus prevent liquid from filling the val-leys between asperities. They are also required to support nanodroplets, which may condense in thevalleys between large asperities. Therefore, nanoasperities should have a small pitch to handle nano-droplets, less than 1 mm down to few nm radius. The values of h on the order of 10 nm and d on theorder of 100 nm can be easily fabricated.
5.5. Hierarchical structured surfaces with wax platelets and tubules
A hierarchical structure is composed of at least two levels of structuring in different length scales.Bhushan et al. [31,32,35,36] and Koch et al. [119] fabricated surfaces with a hierarchical structure with

Fig. 50. Schematic of structure of an ideal hierarchical surface. Microasperities consist of the circular pillars with diameter D,height H, and pitch P. Nanoasperities consist of pyramidal nanoasperities of height h and diameter d with rounded tops.
70 B. Bhushan, Y.C. Jung / Progress in Materials Science 56 (2011) 1–108
micropatterned epoxy replicas and Lotus leaf microstructure, and created a second level of structuringwith wax platelets and wax tubules. Platelets and tubules are the most common wax morphologiesfound in plant surfaces and exist on superhydrophobic leaves, such as Lotus and Colocasia esculentaleaves. The structures developed mimic the hierarchical structures of superhydrophobic leaves. Twosteps of the fabrication process include the production of microstructured surfaces by soft lithographyand the subsequent development of nanostructures on top by self-assembly of plant waxes and arti-ficial wax components.
A two-step molding process was used to fabricate several structurally identical copies of micropat-terned Si surface and Lotus leaves. The technique used is a fast, precise, and low cost molding processfor biological and artificial surfaces [115,117]. The technique was used to mold a microstructured Sisurface with pillars of 14 lm diameter and 30 lm height with 23 lm pitch [31,32,35,36,119], fabri-cated by photolithography [7]. Before replication of the Lotus leaf, the epicuticular wax tubules wereremoved in areas of approximately 6 cm2. For this purpose, a two-component fast hardening glue wasapplied on the upper side of the leaves and was carefully pressed onto the leaf. After hardening, theglue with the embedded waxes was removed from the leaf, and the procedure was repeated [119].The replication is a two-step molding process, in which first a negative replica of a template is gener-ated and then a positive replica is generated, as shown in Fig. 51a [36]. A polyvinylsiloxane dental waxwas applied to the surface and immediately pressed down with a glass plate. After complete harden-ing of the molding mass (at room temperature for approximately 5 min), the silicon master surfaceand the mold (negative) were separated. After a relaxation time of 30 min for the molding material,the negative replicas were filled with a liquid epoxy resin. Specimens were immediately transferredto a vacuum chamber at 750 mTorr (100 Pa) pressure for 10 s to remove trapped air and to increaseresin infiltration through the structures. After hardening at room temperature (24 h at 22 �C), the po-sitive replica was separated from the negative replica. The second step can be repeated to generate anumber of replicas. The pillars of the master surface have been replicated without any morphologicalchanges as shown in Fig. 51b [36]. The nanogrooves of a couple of hundred nm in lateral dimensionpresent on the pillars of master surface are shown to reproduce faithfully in the replica.
Bhushan et al. [31,32,35,36] and Koch et al. [119] created a nanostructure by self-assembly of syn-thetic and plant waxes deposited by thermal evaporation. The alkane n-hexatriacontane (C36H74) hasbeen used for the development of platelet nanostructures. Tubule forming waxes which were isolatedfrom leaves of Tropaeolum majus (L.) and Nelumbo nucifera, in the following referred to as T. majus andLotus, were used to create tubule structures. The chemical structure of the major components of thewax forming tubule and alkane n-hexatriacontane are shown in Table 8. The complete chemistry ofthe plant waxes used is presented in Koch et al. [113]. For a homogenous deposition of the waxesand alkane, a thermal evaporation system, as shown in Fig. 52, has been used [36]. Specimens ofsmooth surfaces (flat silicon replicas) and microstructured replicas were placed in a vacuum chamberat 30 mTorr (4 kPa), 20 mm above a heating plate loaded with waxes of n-hexatriacontane (300, 500 or1000 lg), T. majus wax (500, 1000, 1500 or 2000 lg), and Lotus wax (2000 lg) [31,32,35,36,119]. Thewax was evaporated by heating it up to 120 �C. In a vacuum chamber the evaporation from the pointsource to the substrate occurs in a straight line; thus, the amount of sublimated material is equal in ahemispherical region over the point of source [45]. In order to estimate the amount of sublimatedmass, the surface area of the half sphere was calculated by using the formula 2pr2, whereby the radius

Fig. 51. (a) Schematic of two-step molding process used to fabricate microstructure, in which at first a negative is generatedand then a positive, and (b) SEM micrographs of the master of micropatterned Si surface and positive replica fabricated from themaster surface measured at 45� tilt angle (shown using two magnifications) [36].
B. Bhushan, Y.C. Jung / Progress in Materials Science 56 (2011) 1–108 71
(r) represents the distance between the specimen to be covered and the heating plate with the sub-stance to be evaporated. The amounts of wax deposited on the specimen surfaces were 0.12, 0.2and 0.4 lg/mm2 for n-hexatriacontane, and 0.2, 0.4, 0.6 and 0.8 lg/mm2 for T. majus and 0.8 lg/mm2 for Lotus waxes, respectively.
After coating, the specimens with n-hexatriacontane were placed in a desiccator at room temper-ature for three days for crystallization of the alkanes. A stable stage was indicated by no further in-crease of crystal sizes.
For the plant waxes which are a mixture of aliphatic components, different crystallization condi-tions have been chosen. It has been reported by Niemietz et al. [144] that an increase of temperaturefrom 21 �C (room temperature) to 50 �C had a positive effect on the mobilization and diffusion of wax

Table 8Chemical structure of the major components of n-hexatriacontane, T. majus and Lotus waxes. The major component is shown first[31,35,119].
n-Hexatriacontane C36H74
Tropaeolum majus Nonacosan-10-ol
Nonacosane-4,10-diol
Lotus Nonacosane-10,15-diol
Nonacosan-10-ol
Fig. 52. Schematic of thermal evaporation system for self-assembly of a wax. Evaporation from the point source to the substrateoccurs over hemispherical region (dotted line) [36].
72 B. Bhushan, Y.C. Jung / Progress in Materials Science 56 (2011) 1–108
molecules, required for separation of the tubule forming molecules. It is also known that chemicalambient has an influence on the propensity of wax crystallization, thus the specimens with evapo-rated plant waxes (T. majus and Lotus) were stored for 3 days at 50 �C in a crystallization chamber,where they were exposed to a solvent (ethanol) in vapor phase (Fig. 53). Specimens were placed onmetal posts and a filter paper wetted with 20 mL of the solvent was placed below the specimens. Slowdiffusive loss of the solvent in the chamber was provided by placing a thin filter paper between theglass body and the lid. After evaporation of the solvent, specimens were left in the oven at 50 �C intotal for 7 days. Fig. 54 shows the nanostructures formed by Lotus wax, 7 days after wax deposition

B. Bhushan, Y.C. Jung / Progress in Materials Science 56 (2011) 1–108 73
on flat surfaces. Fig. 54a shows the nanostructure after storage at 21 �C; in these no tubules weregrown. Fig. 54b shows that Lotus waxes exposed to ethanol vapor for three days at 50 �C formedwax tubules. A detailed description of the nanostructure sizes and nanoroughness is given in thefollowing.
Flat films of n-hexatriacontane and wax tubules were made by heating the substances over theirmelting point and rapidly cooling down. This procedure interrupts the crystallization and leads tosmooth films [31,32,35,36,119].
Fig. 53. Schematic of a glass recrystallization chamber used for tubules formation. The filter paper placed at the bottom of thechamber was wetted with 20 mL of the solvent, and slow evaporation of the solvent was provided by placing a thin filter paperbetween the glass body and the cap placed above. The total volume of the chamber is about 200 cm3 [34].
Fig. 54. SEM micrographs of morphology of the Lotus wax deposited on the flat epoxy replica surface after two treatments ofspecimens measured at 45� tilt angle, (a) after 7 days at 21 �C (top), nanostructure on flat epoxy replica was found with notubules, and (b) after 7 days at 50 �C with ethanol vapor (bottom), tubular nanostructures with random orientation were foundon the surface [119].

Fig. 55. SEM micrographs taken at 45� tilt angle (shown using two magnifications) of (a) the flat surface and nanostructuresfabricated with various mass of n-hexatriacontane and (b) three-dimensional platelets forming nanostructures on the surfacefabricated with 0.2 lg/mm2 mass of n-hexatriacontane. All samples are fabricated with epoxy resin coated with n-hexatriacontane [31].
74 B. Bhushan, Y.C. Jung / Progress in Materials Science 56 (2011) 1–108

B. Bhushan, Y.C. Jung / Progress in Materials Science 56 (2011) 1–108 75
5.5.1. Nanostructures with various platelet crystal densitiesFig. 55a shows the scanning electron microscope (SEM) micrographs of a flat surface and nano-
structures fabricated with various masses of n-hexatriacontane [31]. The nanostructure is formedby three-dimensional platelets of n-hexatriacontane, as shown in detail in Fig. 55b. Platelets are flatcrystals, grown perpendicular to the substrate surface. They are randomly distributed on the surface,and their shapes and sizes show some variations. Some of the single platelets are connected to theirneighboring crystals at their lateral ends. This arrangement leads to a kind of cross-linking of the sin-gle platelets. As shown in Fig. 55b, and based on additional specimens, the platelet thickness variedbetween 50 and 100 nm, and their length varied between 500 and 1000 nm. The self-assembly ofn-hexatriacontane used here, and most long chain hydrocarbons lead to layered structures with alamellae order. In these structures, the molecular axis is orientated parallel to the substrate surface.The growth of these layers results in an ordered, crystalline 3-D structure [67]. The created nanostruc-tures are comparable to the wax crystal morphology found on superhydrophobic leaves, e.g., Colocasiaesculenta [143] and Triticum aestivum (wheat) [114]. SEM micrographs of the nanostructures fabri-cated with three different masses of n-hexatriacontane show different densities of crystals. An atomicforce microscope (AFM) was used to characterize the nanostructures. Statistical parameters of nano-structures (root mean square (RMS) height, peak to valley height, and summit density (g)) were cal-culated and are presented in Table 9 [15,17]. A summit is defined as a point whose height is greaterthan its four nearest neighboring points above a threshold value of 10% of RMS height to avoid mea-surement errors. The measurement results were reproducible within ±5%.
To study the effect of nanostructures with different crystal density on superhydrophobicity, staticcontact angle, contact angle hysteresis and tilt angle, and adhesive forces were measured [31]. Forcontact angle hysteresis, the advancing and receding contact angles were measured at the front andback of the droplet moving along the tilted surface, respectively. The data are shown in Fig. 56. Thestatic contact angle of a flat surface coated with a film of n-hexatriacontane was 91�. It showed a con-tact angle hysteresis of 87�, and the droplet still adhered at a tilt angle of 90�. Nanostructuring of flatsurfaces with n-hexatriacontane platelets creates superhydrophobic surfaces with high static contactangle and a reduction of contact angle hysteresis and tilt angle. The values are a function of crystaldensity. Fig. 57 shows a plot of static contact angle and contact angle hysteresis as a function of themass of n-hexatriacontane deposited. As the mass of n-hexatriacontane increased, the static contactangle first increased, and the contact angle hysteresis decreased. Then, above a mass of 0.2 lg/mm2,static contact angle and contact angle hysteresis gradually decreased and increased with increasingmass, respectively. The highest static contact angle and lowest contact angle hysteresis are 158�and 23� at mass of 0.2 lg/mm2. As shown in Fig. 56, adhesive force measured using a 15 lm radiusborosilicate tip in an AFM also shows a similar trend as the wetting properties. Adhesive forces ofthe nanostructured surfaces were lower than for the flat surface because the contact between thetip and surface was lower than on the flat surface, because the contact between the tip and surfacewas reduced by surface structuring [15,17].
Table 9Roughness statistics for nanostructure surface measured using an AFM (scan size 10 lm � 10 lm). Nanostructures were fabricatedwith n-hexatriacontane, T. majus and Lotus waxes [31,35,119].
RMS height (nm) Peak to valley height (nm) g (/lm2)
n-HexatriacontaneNanostructure (0.12 lg/mm2) 46 522 0.78Nanostructure (0.2 lg/mm2) 65 663 1.39Nanostructure (0.4 lg/mm2) 82 856 1.73
Tropaeolum majus waxNanostructure (0.8 lg/mm2) 180 1570 0.57
Lotus waxNanostructure (0.8 lg/mm2) 187 1550 1.47
RMS – root mean square.g – summit density.

Fig. 56. Bar chart showing the measured static contact angle, contact angle hysteresis and tilt angle; also shown are calculatedstatic contact angles obtained using Wenzel and Cassie–Baxter equations with a given value of h0, and calculated contact anglehysteresis using Cassie–Baxter equation on flat surface and nanostructures fabricated with various mass of n-hexatriacontane.The droplet on flat surface does not move along the surface even at tilt angle of 90�. The bar chart also shows adhesive forces forvarious structures, measured using a 15 lm radius borosilicate tip [31].
76 B. Bhushan, Y.C. Jung / Progress in Materials Science 56 (2011) 1–108
In order to identify wetting regimes (Wenzel or Cassie–Baxter) as well as to understand the effectof crystal density on the propensity of air pocket formation for the nanostructured surfaces, roughnessfactor (Rf) and fractional liquid–air interface (fLA) are needed. The Rf for the nanostructures was calcu-lated using the AFM map [47,25]. The calculated results were reproducible within ±5%. The Rf for the

Fig. 57. Static contact angle and contact angle hysteresis as a function of mass of n-hexatriacontane deposited onnanostructures [31].
B. Bhushan, Y.C. Jung / Progress in Materials Science 56 (2011) 1–108 77
nanostructured surfaces with masses of 0.12, 0.2 and 0.4 lg/mm2 were found to be 3.4, 4.9 and 6.8,respectively. For calculation of fLA of the nanostructures, only the higher crystals are assumed to comein contact with a water droplet. The fractional geometrical area of the top surface for the nanostruc-tures was calculated from SEM micrographs with top view (0� tilt angle). The SEM images were con-verted to high contrast black and white images using Adobe Photoshop. The increase of contrast inSEM image eliminates the smaller platelet structures, which were visible in the original SEM image.The higher crystals led to white signals in the SEM figure. The fractional geometrical area of the topnanostructured surfaces with masses of 0.12, 0.2 and 0.4 lg/mm2 was found to be 0.07, 0.15 and0.24, leading to fLA of 0.93, 0.85 and 0.76, respectively. The calculated results were reproducible within±5%. The values of static contact angle in Wenzel and Cassie–Baxter regimes for the nanostructuredsurfaces were calculated using the values of Rf and fLA and presented in Fig. 56. The values of contactangle hysteresis in Cassie–Baxter regimes for various surfaces were calculated using Eq. (20). The dataare presented in Fig. 56.
As shown in Fig 56, the experimental static contact angle and contact angle hysteresis values forthe two nanostructured surfaces with 0.2 and 0.4 lg/mm2 were comparable to the calculated valuesin Cassie–Baxter regime. The results suggest that a droplet on two nanostructured surfaces should ex-ist in the Cassie–Baxter regime. However, the experimental static contact angle and contact angle hys-teresis values for the nanostructured surface with 0.12 lg/mm2 were lower and higher than thecalculated values in Cassie–Baxter regime, respectively. It is believed that neighboring crystals areseparated at lower crystal density and any trapped air can be squeezed out. Whereas neighboringcrystals are interconnected at higher densities and air remains trapped. At highest crystal density ata mass of 0.4 lg/mm2, there is less open volume compared to that at 0.2 lg/mm2, and that explainsa droplet static contact angle going from 158� to 150� [31].
5.5.2. The influence of hierarchical structure with wax platelets on the superhydrophobicityBhushan et al. [32,36] created surfaces with n-hexatriacontane of 0.2 lg/mm2 to study the influ-
ence of hierarchical structure on superhydrophobicity. Fig. 58 shows the scanning electron microscope(SEM) micrographs of a flat surface and nano-, micro- and hierarchical structures. To study the effectof structure on superhydrophobicity, static contact angle, contact angle hysteresis and tilt angle, andadhesive forces of four structures were measured. The data are shown in Fig. 59. The static contactangle of a flat surface coated with a film of n-hexatriacontane was 91�, and increased to 158� whenn-hexatriacontane formed a nanostructure of platelets on it. The static contact angle on a flat speci-men with a microstructure was 154�, but it increased to 169� for the hierarchical surface structure.Contact angle hysteresis and tilt angle for flat, micro-and nanostructured surfaces show similar trends.The flat surface showed a contact angle hysteresis of 87�, and the droplet still adhered at a tilt angle of90�. The superhydrophobic micro- and nanostructured surfaces showed a reduction of contact anglehysteresis and tilt angle, but a water droplet still needs a tilt angle of 26� and 51�, respectively, before

Fig. 58. SEM micrographs of the flat surface, nanostructure, microstructure, and hierarchical structure measured at 45� tiltangle (shown using two magnifications). All samples are fabricated with epoxy resin coated with n-hexatriacontane [32].
78 B. Bhushan, Y.C. Jung / Progress in Materials Science 56 (2011) 1–108
sliding. Only the hierarchical surface structure with static contact angle of 169� and low contact anglehysteresis of 2� exceeds the basic criteria for superhydrophobic and self-cleaning surfaces [27]. Adhe-sive force measured using a 15 lm radius borosilicate tip in an AFM also shows a similar trend as thewetting properties. Adhesion force of the hierarchical surface structure was lower than that of bothmicro- and nanostructured surfaces because the contact between the tip and surface was lower asa result of contact area being reduced [15,17].
In order to identify wetting regimes (Wenzel or Cassie–Baxter) for the various surfaces, roughnessfactor (Rf) and fractional liquid–air interface (fLA) are needed. The Rf for the nanostructure was de-scribed earlier. The Rf for microstructure was calculated for the geometry of flat-top, cylindrical pillarsof diameter D, height H, and pitch P distributed in a regular square array. For this case, roughness fac-
tor for the microstructure, ðRf Þmicro ¼ 1þ pDHP2
� �. The roughness factor for the hierarchical structure is
the sum of (Rf)micro and (Rf)nano. The values calculated for various surfaces are summarized in Table 10.For calculation of fLA, we make the following assumptions. For the microstructure, we consider that
a droplet in size much larger than the pitch P contacts only the flat-top of the pillars in the compositeinterface, and the cavities are filled with air. For microstructure, fractional flat geometrical area of the
liquid–air interface under the droplet, ðfLAÞmicro ¼ 1� pD2
4P2
� �[27]. The fractional geometrical area of the

Fig. 59. Bar chart showing the measured static contact angle, contact angle hysteresis and tilt angle; also shown are calculatedstatic contact angles obtained using Wenzel and Cassie–Baxter equations with a given value of h0, and calculated contact anglehysteresis using Cassie–Baxter equation on various structures. The droplet on flat surface does not move along the surface evenat tilt angle of 90�. The bar chart also shows adhesive forces for various structures, measured using a 15 lm radius borosilicatetip [32].
B. Bhushan, Y.C. Jung / Progress in Materials Science 56 (2011) 1–108 79
top surface for the nanostructure was described earlier. For the hierarchical structure, the fractional
flat geometrical area of the liquid–air interface, ðfLAÞhierarchical ¼ 1� pD2
4P2
� �½1� ðfLAÞnano�. The values of
contact angle hysteresis in Cassie–Baxter regimes for various surfaces were calculated using Eq.(20). The values are summarized in Table 10.

Table 10Summary of static contact angles and contact angle hysteresis measured and calculated for droplets in Wenzel regime and Cassie–Baxter regime on the various surfaces with n-hexatriacontane using the calculated values of Rf and fLA [32,36].
Rf fLA Static contact angle (deg) Contact angle hysteresis (deg)
Measured Calculated inWenzel regime
Calculated in Cassie–Baxter regime
Measured Calculated in Cassie–Baxter regime
Flat 91 87*
Nanostructure 4.9 0.85 158 95 149 23 24Microstructure 3.5 0.71 154 94 136 36 34Hierarchical
structure8.4 0.96 169 98 164 2 12
* Advancing and receding contact angles are 141� and 54�, respectively.
80 B. Bhushan, Y.C. Jung / Progress in Materials Science 56 (2011) 1–108
The values of static contact angle in the Wenzel and Cassie–Baxter regimes for various surfaceswere calculated using the values of Rf and fLA (Table 10). As shown in Fig. 59, the experimental staticcontact angle values for the three structured surfaces were larger than the calculated values in Cassie–Baxter regime. The results suggest that the droplets on three structured surfaces were in the Cassie–Baxter regime. This indicates that the microstructure and nanostructure surface induce air pocket for-mation. For the contact angle hysteresis, there is a good agreement between the experimental dataand the theoretically predicted values for the Cassie–Baxter regime. These results show that air pocketformation in the micro- and nanostructure decreases the solid–liquid contact [119]. In hierarchicalstructured surfaces, the air pocket formation further decreases the solid–liquid contact and therebyreduces contact angle hysteresis and tilt angle [32,36].
5.5.3. The influence of hierarchical structure with wax tubules on the superhydrophobicity5.5.3.1. Morphological characterization, wettability and adhesion forces of T. majus tubules. Fig. 60a showsthe SEM micrographs of the nanostructure and hierarchical structure fabricated with two differentmasses (0.6 and 0.8 lg/mm2) of T. majus [35]. SEM micrographs show an increase in the tubuleamount on flat and microstructure surfaces after deposition of higher masses of wax. The tubules ofT. majus wax grown in an ethanol atmosphere are comparable to the wax morphology found on theleaves of T. majus. Surfaces show a homogenous distribution of the wax mass on the specimen sur-faces, and tubules provide the desired nanostructure of three-dimensional tubules on flat and micro-structure surfaces. The tubule morphology of T. majus wax is shown in detail in Fig. 60b. The tubularcrystals are hollow structures, randomly orientated on the surface and embedded into an amorphouswax layer. They are randomly distributed on the surface, and their shapes and sizes show some vari-ations. As shown in Fig. 60b, and based on additional specimens, the tubular diameter varied between100 and 300 nm, and their length varied between 300 and 1200 nm.
Atomic force microscopy (AFM) was used to characterize the nanostructure fabricated using T. ma-jus wax of 0.8 lg/mm2 after storage at 50 �C with ethanol vapor [35]. Statistical parameters of thenanostructure (root mean square (RMS) height, peak to valley height, and summit density (g)) werecalculated and are presented in Table 9 [15,17]. A summit is defined as a point whose height is greaterthan of its four nearest neighboring points above a threshold value of 10% of RMS height to avoid mea-surement errors. The measurement results were reproducible within ±5%.
To study the effect of structures with various length scales on superhydrophobicity, static contactangle, contact angle hysteresis and tilt angle, and adhesive forces of four structures produced using T.majus wax were measured [35]. Nanostructures formed on flat and microstructured surfaces were fab-ricated using T. majus wax of 0.8 lg/mm2 after storage at 50 �C with ethanol vapor. The data are shownin Fig. 61. The static contact angle of a flat surface coated with a film of T. majus wax was 112�, andincreased to 164� when T. majus wax formed a nanostructure of tubules on it. On the flat specimenwith a microstructure on it, the static contact angle was 154�, but increased to 171� for the hierarchi-cal surface structure. Contact angle hysteresis and tilt angle for flat, micro- and nanostructured sur-faces show similar trends. Flat surface showed a contact angle hysteresis of 61� and a tilt angle of86�. The microstructured surface shows a reduction of contact angle hysteresis and tilt angle, but a

Fig. 60. SEM micrographs taken at 45� tilt angle (shown using two magnifications) of (a) the nanostructure and hierarchicalstructure fabricated with two different mass (0.6 and 0.8 lg/mm2) of T. majus wax after storage at 50 �C with ethanol vapor and(b) three-dimensional tubules forming nanostructures on the surface fabricated with 0.8 lg/mm2 mass of T. majus wax afterstorage at 50 �C with ethanol vapor [35].
B. Bhushan, Y.C. Jung / Progress in Materials Science 56 (2011) 1–108 81
water droplet still needs a tilt angle of 31� before sliding. As tubules are formed on the flat and micro-structured surfaces, the nanostructured and hierarchical structure surfaces have low contact anglehysteresis of 5� and 3�, respectively. These properties are superior to plant leaves, including Lotusleaves. Adhesive force measured using a 15 lm radius borosilicate tip in an AFM also show a similartrend as the wetting properties. Adhesion force of the hierarchical surface structure was lower thanthat of micro- and nanostructured surfaces because the contact between the tip and surface was loweras a result of contact area being reduced [15,17].
To further verify the effect of hierarchical structure on the propensity of air pocket formation, Bhu-shan et al. [35] performed evaporation experiments with a droplet on microstructure and hierarchicalstructure fabricated with 0.8 lm/mm2 mass of T. majus wax with ethanol vapor at 50 �C. Fig. 62 showsthe successive photos of a droplet evaporating on two structured surfaces. On the microstructured sur-face, the light passes below the droplet and air pockets can be seen, so to start with the droplet is inthe Cassie–Baxter regime. When the radius of the droplet decreased to 425 lm, the air pockets are notvisible anymore, and the droplet is in the Wenzel regime. This transition results from an impalementof the droplet in the patterned surface, characterized by a smaller contact angle. For the hierarchicalstructure, an air pocket was clearly visible at the bottom area of the droplet throughout, and the drop-let was in a hydrophobic state until the droplet evaporated completely. It suggests that a hierarchicalstructure with nanostructures prevents liquid from filling the gaps between the pillars.

Fig. 61. Bar chart showing the measured static contact angle, contact angle hysteresis and tilt angle on various structuresfabricated with 0.8 lm/mm2 mass of T. majus wax after storage at 50 �C with ethanol vapor. The bar chart also shows adhesiveforces for various structures, measured using a 15 lm radius borosilicate tip [35].
82 B. Bhushan, Y.C. Jung / Progress in Materials Science 56 (2011) 1–108
5.5.3.2. Morphological characterization, wettability and adhesion forces of Lotus tubules. For the develop-ment of nanostructures by tubule formation, Lotus wax was used [119]. Fig. 63a shows the scanningelectron microscope (SEM) micrographs of flat surfaces with the tubules nanostructure. Microstruc-tures shown in Fig. 63b are the Lotus leaf and micropatterned Si replica covered with a Lotus wax film.Hierarchical structures were fabricated with microstructured Lotus leaf replicas and micropatterned Si

Fig. 62. Evaporation of a droplet on a microstructured- and hierarchical structured surfaces fabricated with 0.8 lm/mm2 massof T. majus wax after storage at 50 �C with ethanol vapor. The initial radius of the droplet was about 950 lm, and the timeinterval between first two photos was 180 s and between the latter was 60 s. As the radius of droplet reached 425 lm (footprint = 836 lm) on the microstructured surface, the transition from Cassie–Baxter regime to Wenzel regime occurred, asindicated by the arrow. On the hierarchical structured surface air pockets, visible at the bottom area of the droplet, exist untilthe droplet evaporated completely [34].
B. Bhushan, Y.C. Jung / Progress in Materials Science 56 (2011) 1–108 83
replicas covered with a nanostructure of Lotus wax tubules, as shown in Fig. 63c. SEM micrographsshow an overview (left column), a detail in higher magnification (middle column), and a large magni-fication of the created flat wax layers and tubules nanostructures (right column). The grown tubulesprovide the desired nanostructure on flat and microstructured surfaces. The recrystallized Lotus waxshows tubular hollow structures, with random orientation on the surfaces. Their shapes and sizesshow only a few variations. The tubular diameter varied between 100 and 150 nm, and their lengthvaried between 1500 and 2000 nm. Atomic force microscopy (AFM) was used to characterize thenanostructure of the Lotus wax tubules. The statistical parameters of the nanostructure (root meansquare (RMS) height, peak to valley height, and summit density (g)) were calculated and are presentedin Table 9.
To study the effect of Lotus wax tubule nanostructures on superhydrophobicity, static contact an-gle, contact angle hysteresis, and tilting angle were measured on flat, microstructured Lotus replica,micropatterned Si replica, and hierarchical surfaces. Hierarchical surfaces were made of the Lotus leafreplica and micropatterned Si replica with a nanostructure of wax tubules on top. Additionally, freshLotus leaves were investigated to compare the properties of the fabricated structures with the originalbiological model.
Fig. 64 shows that the highest static contact angles of 173�, lowest contact angle hysteresis of 1�,and tilting angle varying between 1� and 2� were found for the hierarchical structured Si replica. Thehierarchical structured Lotus leaf replica showed a static contact angle of 171�, and the same contactangle hysteresis (2�) and tilt angles of 1–2� as the hierarchical Si replica. Both artificial hierarchicalstructured surfaces show similar values as the fresh Lotus leaf surface investigated here with staticcontact angle of 164�, contact angle hysteresis of 3�, and a tilting angle of 3�. However, the artificialhierarchical surfaces showed higher static contact angle and lower contact angle hysteresis. Structural
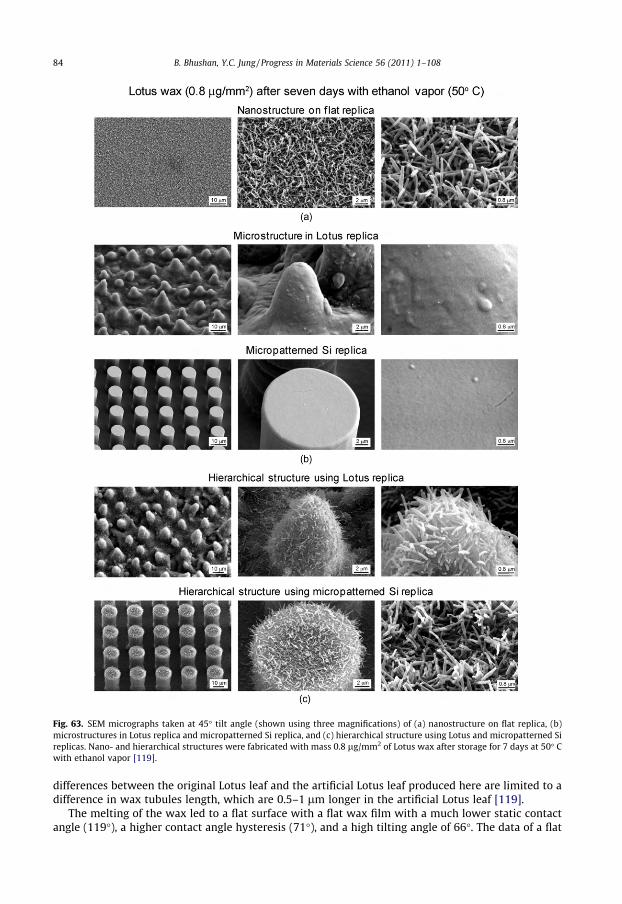
Fig. 63. SEM micrographs taken at 45� tilt angle (shown using three magnifications) of (a) nanostructure on flat replica, (b)microstructures in Lotus replica and micropatterned Si replica, and (c) hierarchical structure using Lotus and micropatterned Sireplicas. Nano- and hierarchical structures were fabricated with mass 0.8 lg/mm2 of Lotus wax after storage for 7 days at 50� Cwith ethanol vapor [119].
84 B. Bhushan, Y.C. Jung / Progress in Materials Science 56 (2011) 1–108
differences between the original Lotus leaf and the artificial Lotus leaf produced here are limited to adifference in wax tubules length, which are 0.5–1 lm longer in the artificial Lotus leaf [119].
The melting of the wax led to a flat surface with a flat wax film with a much lower static contactangle (119�), a higher contact angle hysteresis (71�), and a high tilting angle of 66�. The data of a flat

B. Bhushan, Y.C. Jung / Progress in Materials Science 56 (2011) 1–108 85
Lotus wax film on a flat replica show that the Lotus wax by itself is hydrophobic. However, it has beenstated that the wax on the Lotus leaf surface, by itself, is weakly hydrophilic [194]. We cannot confirmthis. The data presented here demonstrate that the native, flat wax of Lotus leaves, with a static con-tact angle of 119�, is hydrophobic and can turn superhydrophobic (167�) by increasing the surfaceroughness after self-assembly into three-dimensional wax tubules. The static contact angle of theLotus wax film is 119�, which is higher than that of the wax film made of T. majus of 112�. However,
Fig. 64. Bar chart showing the measured static contact angle, contact angle hysteresis and tilt angle on various structuresfabricated with 0.8 lg/mm2 of Lotus wax after storage for 7 days at 50 �C with ethanol vapor. The bar chart also shows adhesiveforces for various structures, measured using a 15 lm radius borosilicate tip. The error bar represents ±1 standard deviation[119].

86 B. Bhushan, Y.C. Jung / Progress in Materials Science 56 (2011) 1–108
films made of n-hexatriacontane showed static contact angles of only 91�. SEM investigations, madedirectly after contact angle measurements, revealed no morphological differences between thesefilms. Based on the chemical composition, it should be assumed that the non-polar n-hexatriacontanemolecules are more hydrophobic than the plant waxes, which contain high amounts of oxygen atoms.At this point these differences cannot be explained by structural or chemical differences of the films,but will be the interest for further studies.
Adhesive force measured using a 15 lm radius borosilicate tip in an AFM also shows a similar trendas the wetting properties for the artificial surfaces (Fig. 64) [119]. Adhesion force of the hierarchicalsurface structure was lower than that of micro- and nanostructured and flat surfaces because the con-tact between the tip and surface was lower as a result of the contact area being reduced. However, forthe fresh Lotus leaf, there is moisture within the plant material, which causes softening of the leaf, andso when the tip comes into contact with the leaf sample, the sample deforms, and a larger area of con-tact between the tip and sample causes an increase in the adhesive force [15,17].
5.5.4. Self-cleaning efficiency of hierarchical structured surfacesFor deposition of contamination on artificial surfaces, various structures were placed in a contam-
ination glass chamber [33]. Silicon carbide (SiC) (Guilleaume, Germany) particles in two different sizesranges of 1–10 lm and 10–15 lm were used as the contaminants. The SiC particles have been chosenbecause of their similarity in shape, sizes, and hydrophilicity to natural dirt contaminations. The num-ber of particles per area was determined by counting them from a 280 lm � 210 lm image taken byan optical microscope with a camera before and after water cleaning.
For the cleaning test, the specimens with the contaminants were subjected to water droplets ofapproximately 2 mm diameter, using two microsyringes [33]. In order to obtain a relative measureof the self-cleaning ability of hierarchical structures which exhibit the lowest contact angle hyster-esis and tilt angle as compared to other structures (flat, nanostructures, and microstructures), the tiltangle chosen for the cleaning tests was slightly above the tilt angle for the hierarchical structures.Thus experiments were performed with 10� for surfaces covered with n-hexatriacontane and 3�for surfaces with Lotus wax. The water cleaning test was carried out for 2 min (water quantity,10 mL) with nearly zero kinetic energy of droplets. For watering with nearly zero kinetic energy,the distance between the microsyringes and surface was set to 0.005 m (nearly zero impact velocity).The chosen impact velocity represents a low value compared to a natural rain shower, where a waterdroplet of 2 mm diameter can reach an impact velocity of 6 m/s (measured under controlled condi-tions) [195].
Fig. 65 shows that none of the investigated surfaces was fully cleaned by water rinsing [33]. Thedata represent the average of five different investigated areas for each experiment. For Lotus wax,which forms tubule nanostructures, and n-hexatriacontane, which forms platelet nanostructures,the same tendency of particle removal was found. With the exception of hierarchical structure onall surfaces, larger particles were removed more than small ones. Most particles (70–80%) remainedon smooth surfaces, and 50–70% of particles were found on microstructured surfaces. Most particleswere removed from the hierarchical structured surfaces, but approximately 30% of particles remained.A clear difference in particle removal, independent of particle sizes, was only found in flat and nano-structured surfaces where larger particles were removed with higher efficiency. Observations of thedroplet behavior during the movement on the surfaces showed that droplets were rolling only onthe hierarchical structured surfaces. On flat, micro- and nanostructured surfaces, the droplets first ap-plied were not moving, but the continuous application of water droplets increased the droplet vol-umes and led to a sliding of these large droplets. During this, some of the particles had beenremoved from the surfaces. However, the rolling droplets on hierarchical structures did not collectthe dirt particles trapped in the cavities of the microstructures. The data clearly shows that hierarchi-cal structures have superior cleaning efficiency.
5.5.5. Observation of transition during the bouncing dropletTo observe how the impact velocity influences the transition from the composite solid–air–liquid
interface to the homogeneous solid–liquid interface during droplet impact, Jung and Bhushan [105]performed bouncing droplet experiments on various surfaces with n-hexatriacontane and T. majus

Fig. 65. Bar charts showing the remaining particles after applying droplets with nearly zero kinetic energy on various structuresfabricated using n-hexatriacontane and Lotus wax using 1–10 lm and 10–15 lm SiC particles. The experiments on the surfaceswith n-hexatriacontane and Lotus wax were carried out on tilted stages with 10� and 3�, respectively. The error bars represent±1 standard deviation [33].
B. Bhushan, Y.C. Jung / Progress in Materials Science 56 (2011) 1–108 87
and Lotus waxes. Fig. 66 shows snapshots of a droplet with 1 mm radius hitting various surfaces fab-ricated with 0.2 and 0.4 lm/mm2 of n-hexatriacontane after storage at room temperature. The impactvelocity was obtained just prior to the droplet hitting the surface. First, on the flat surface, it was foundthat the droplet did not bounce off even though the impact velocity applied was up to 1.5 m/s. Asshown in the images in the first row for each nano-, micro- and hierarchical structured surface, thedroplet hitting the surface under an impact velocity of 0.44 m/s first deformed and then retracted,and bounced off the surface. Finally, the droplet sat on the surface and had a high contact angle, whichsuggests the formation of a solid–air–liquid interface. Next, we repeated the impact experiment byincreasing the impact velocity. As shown in the second row of images for nanostructure (0.4 lg/mm2) and microstructure, bounce off did not occur, and the wetting of the surface (and possibly pin-ning of droplet) occurred at impact velocities of 1.2 m/s and 0.77 m/s, respectively, referred to as thecritical impact velocity. This is because air pockets do not exist below the droplet as a result of droplet

88 B. Bhushan, Y.C. Jung / Progress in Materials Science 56 (2011) 1–108
impalement by the structures, characterized by a smaller contact angle. These observations indicatethe transition from the composite interface to the homogenous interface. However, as shown in thesecond row of images for nanostructure (0.2 lg/mm2) and hierarchical structure, during applying im-pact velocity of up to 1.5 m/s, the bounce off always occurred and the wetting of the surface did notoccur.
As shown in Fig. 67, the critical impact velocity of a droplet with 1 mm radius on various structuresat which wetting of the surface (possibly pinning of droplet) occurs was measured [105]. The arrowindicates that the critical impact velocity can possibly be more than 1.5 m/s, or the transition hasnot occurred. As mentioned earlier, when the mass of n-hexatriacontane increased, the static contactangle of nanostructure first increased followed by a decrease at a mass of 0.2 lg/mm2. For the criticalimpact velocity, the same trends were found. It is believed that if neighboring crystals are separatedon a sample with lower crystal density, any trapped air can be squeezed out whereas if the neighbor-ing crystals are interconnected on a sample with higher density, air remains trapped. At highest crys-tal density at a mass of 0.4 lg/mm2, there is less open volume compared to that at 0.2 lg/mm2. For allmicrostructures with n-hexatriacontane and Lotus wax, the critical impact velocities of the droplet arelower than those on nano- and hierarchical structures due to the larger distance between the pillars,and the solid–air–liquid interface can easily be destabilized from dynamic impact on the surface.Based on Eq. (29), the critical impact velocity of the droplet decreases with the geometric parameter(pitch). The theoretical critical impact velocity for microstructure using Eq. (29) is 0.5 m/s. This valueis lower than the experimental values of critical impact velocity for microstructures by about 30–50%depending on the structured surfaces. In our experiments, during applying impact velocity of up to1.5 m/s on nano- and hierarchical structures with n-hexatriacontane (0.2 lg/mm2 for nanostructure)and Lotus wax, the wetting of the surface did not occur. The data clearly shows that nano- and hier-archical structures are superior to microstructure in maintaining stable composite solid–air–liquidinterface.
To identify whether one is in a homogeneous solid–liquid interface or a composite solid–air–liquidinterface, the contact angle data in the static condition and after bounce off were measured on varioussurfaces, as shown in Fig. 68 [105]. The contact angles of the left bar for each sample were measuredusing the droplet with 1 mm radius gently deposited on the surface. The contact angles of the middleand right bars for each sample were measured using the droplet after hitting the surface at 0.44 m/sand critical or highest impact velocity. Missing bars mean that the droplet, after hitting the surface,bounced off without coming to sit on the surface. The static contact angle of the droplet after impactat 0.44 m/s is lower than that of the droplet gently deposited for all of the surfaces with n-hexatria-contane and Lotus wax. It can be interpreted that after hitting, the droplet pushes out the entrappedair of the cavities between the pillars under the droplet, resulting in an abrupt increase of the solid–liquid surface area by dynamic impact. As mentioned earlier, after hitting the surface at a critical im-pact velocity, the contact angles were close to 90� and much lower than that of the droplet gentlydeposited for nanostructures with n-hexatriacontane (0.12 and 0.4 lg/mm2) and microstructures withn-hexatriacontane and Lotus wax. Even though the droplet is in the composite interface when it isgently deposited on the surface, these observations indicate that the composite solid–air–liquid inter-face was destroyed due to dynamic impact on the surface.
5.5.6. Observation of transition during the vibrating droplet5.5.6.1. Model for the adhesion and inertia forces of the vibrating droplet. Jung and Bhushan [105] pre-sented a model for vibration. In this model, they calculate expressions for adhesion force and inertiaforce as a function of droplet properties and operating conditions. Consider a small droplet of liquiddeposited on a surface. The liquid and surface come together under equilibrium at a characteristic an-gle, called the static contact angle h, as shown in Fig. 69. When a droplet on a surface is vibrated, basedon Lamb [126], a general expression for the resonance frequency fr of a free oscillating liquid droplet isgiven as
fr ¼
ffiffiffiffiffiffiffiffiffiffiffiffiffiffiffiffiffiffiffiffiffiffiffiffiffiffiffiffiffiffiffiffiffiffiffiffinðn� 1Þðnþ 2Þc
3pqV
sð37Þ

Fig. 66. Snapshots of a droplet with 1 mm radius hitting various surfaces fabricated with 0.2 and 0.4 lg/mm2 of n-hexatriacontane after storage at room temperature. The impact velocity was obtained just prior to the droplet hitting thesurface. The pinning of droplet on the nanostructure with 0.4 lg/mm2 mass, and on the microstructure occurred at impactvelocities of 1.2 m/s and 0.77 m/s, respectively [105].
B. Bhushan, Y.C. Jung / Progress in Materials Science 56 (2011) 1–108 89
where V is the volume of the droplet, and n represents the number of modes, with 2 being the 1stmode, etc. For a spherical droplet with a radius R with the distance between the center of dropletand the solid H, the volume of droplet V is given by

Fig. 67. Bar chart showing the measured critical impact velocity of a droplet with 1 mm radius at which transition occurs onvarious structures. The arrow indicates that the critical impact velocity can possibly be more than 1.5 m/s or the transition isnot occurred [105].
90 B. Bhushan, Y.C. Jung / Progress in Materials Science 56 (2011) 1–108
V ¼ 13pðRþ HÞ2ð2R� HÞ ¼ 1
3pR3ð1� cos hÞ2ð2þ cos hÞ ð38Þ
Recent experimental studies were carried out by Noblin et al. [145] and Celestini and Kofman [51].They showed that the frequency decreases with the volume of the droplet, and the trends are com-pared with a theoretical model.
When liquid comes in contact with a surface, the energy gained for surfaces coming into contact isgreater than the energy required for their separation (or the work of adhesion) by the quantity DW,which constitutes the adhesion hysteresis [18]. For a surface, the difference between the two valuesof the interface energy (measured during loading and unloading) is given by DW. These two valuesare related to the advancing contact angle, ha, and receding contact angle, hr, of the surface. For exam-ple, a model based on Young’s equation has been used to calculate the work of adhesion from contactangle hysteresis [84,54,153,157]
cos ha � cos hr ¼DWc
ð39Þ
From Eq. (39), the dominant force (adhesion force) responsible for the separation between thedroplet and surface is given by [98,128]
FA ¼ Lcðcos ha � cos hrÞ ¼ 2R sin hðcÞðcos ha � cos hrÞ ð40Þ
where L is the length of the triple contact line, referred to as line of contact of the solid, liquid, and air.The radius of a spherical droplet, R, depends on the contact angle and can be obtained from Eq. (38).
From applying vertical vibration of a droplet on a surface, the inertia force of droplet FI is given by
FI ¼ qVAx2 ð41Þ

Fig. 68. Bar chart showing the measured static contact angle of a droplet on various surfaces. The contact angles of the left barfor each sample were measured using a droplet with 1 mm radius gently deposited on the surface. The contact angles of themiddle and right bars for each sample were measured using the droplet after hitting the surface at 0.44 m/s, and critical orhighest impact velocity [105].
Fig. 69. Droplet of liquid in contact with a solid surface – contact angle h; radius of droplet R; distance between the center ofdroplet and the solid H [105].
B. Bhushan, Y.C. Jung / Progress in Materials Science 56 (2011) 1–108 91
where A and x are the amplitude and frequency of vibration, respectively. Bormeashenko et al. [41]showed that the transition occurred at a critical value of inertia force acting on the length of a tripleline. However, if the inertia force of the droplet vibrated on the surface can overcome the adhesionforce between the droplet and surface, which DF is positive value [105],
DF ¼ FI � FA ð42Þ
the droplet can be vertically separated from the surface (bouncing off) before the composite solid–li-quid–air interface is destroyed.
5.5.6.2. Vibration study results. To estimate the resonance frequency of a droplet, a droplet on varioussurfaces was vibrated by varying the frequency with a sinusoidal excitation of relatively low

92 B. Bhushan, Y.C. Jung / Progress in Materials Science 56 (2011) 1–108
amplitude (0.4 mm) [105]. Based on Eq. (37), the experiments were performed in the 1st and 2ndmodes (n = 2 and 3). Fig. 70 shows the optical micrographs of droplets on the microstructured surfacewith n-hexatriacontane before and after vibration at an amplitude of 0.4 mm for 1st mode (n = 2) and2nd mode (n = 3) of vibration. The frequencies for the 1st mode and 2nd mode were measured to be86 Hz and 208 Hz, respectively. The resonance frequencies on various surfaces were measured, andthe data are summarized in Table 11. For comparison, the theoretical values for the two modes werecalculated using Eq. (37). For calculations, the surface tension of the water–air interface (c) was takento be 0.073 N/m, the mass density (q) was 1000 kg/m3 for water, and the volume of droplet (V) was5 lL. The theoretical values for 1st mode (n = 2) and 2nd mode (n = 3) from Eq. (37) are 110 and214 Hz, respectively. These values are similar to those of flat surfaces with n-hexatriacontane and Lo-tus wax. However, with the same volume, the resonance frequencies of the structured surfaces arelower than those of flat surfaces. Celestini and Kofman [51] showed that the resonance frequency de-pends on the contact angle of the structured surfaces, and it decreases with increasing contact angle.The hierarchical structures with highest contact angle have the lowest resonance frequency, consis-tent with the results by Celestini and Kofman [51].
To observe how the vibration of the droplet influences the transition from the composite solid–air–liquid interface to the homogeneous solid–liquid interface, Jung and Bhushan [105] performed vibrat-ing droplet experiments on various surfaces with n-hexatriacontane and Lotus wax. Fig. 71 showsoptical micrographs of droplets on various surfaces with n-hexatriacontane before and after vibratingat a frequency of 30 Hz, which is less than the resonance frequency for 1st mode (n = 2). The vibrationamplitude was increased until transition or until the droplet bounced off. First, on the flat surface, itwas found that the droplet did not change much after applying vibration at amplitudes ranging from 0to 3 mm. As shown in the images for nanostructure (0.12 lg/mm2) and microstructure, the static con-tact angles of the droplet before vibrating were 152� and 154�, respectively. After vibrating at ampli-tudes of 0.4 and 1.4 mm, the contact angles still have similar values (151� for nanostructure and 149�for microstructure), which suggests the formation of a solid–air–liquid interface. However, aftervibrating at amplitudes of 2.4 mm for nanostructure (0.12 lg/mm2) and 2.0 mm for microstructures,the static contact angles became 125� and 121�, respectively. This is because air pockets do not existbelow the droplet as a result of droplet impalement by the structures, characterized by a smaller con-tact angle. These observations indicate the transition from the composite interface to the homogenousinterface. Observations of vibration on two nanostructures (0.2 and 0.4 lg/mm2) and a hierarchicalstructure showed that the transition did not occur, but the droplet started to bounce off the surfacefrom amplitudes of 2.2, 2.4, and 0.8 mm, respectively.
To study the validity of the proposed model (Eq. (42)), the adhesive force responsible for the sep-aration between the droplet and surface and the inertia force of a droplet vibrated on various struc-tures were calculated [105]. The adhesive force was obtained from Eq. (40) using static contactangle and contact angle hysteresis. The inertia forces were obtained from Eq. (41) using the amplitudeand frequency of vibration as the transition or droplet bounce off occurred. The data are presented inFig. 72 and summarized in Table 11. As shown in Fig. 71, it was observed that the transition occurredas a result of droplet impalement by the structures by increasing the inertia force of droplet on thesurfaces. However, if the inertia force of the droplet vibrated on the surface can overcome the
Fig. 70. Optical micrographs of droplets on the microstructured surface with n-hexatriacontane before and after vibration atamplitude of 0.4 mm for 1st mode (n = 2) and 2nd mode (n = 3) of vibration. The frequencies for 1st mode and 2nd mode weremeasured to be 86 Hz and 208 Hz, respectively [105].

Table 11Summary of the measured resonance frequency at the fixed amplitude value of 0.4 mm, the calculated inertia force of a vibrateddroplet, and adhesive force between the droplet and surface on the various surfaces fabricated with n-hexatriacontane and Lotuswax. Positive value of DF means that the droplet bounced off before the transition occurs. The variation represents ±1 standarddeviation [105].
Resonance frequency(Hz)
FA (lN) FI (lN) at transition orbouncing off
DF = FI � FA (lN)
1st mode(n = 2)
2nd mode(n = 3)
n-HexatriacontaneFlat 103 271 260 ± 3.7Nanostructure (0.12 lg/mm2) 63 169 45 ± 2.2 11 �34 ± 2.2 (T)Nanostructure (0.2 lg/mm2) 50 147 10 ± 1.6 10 0 ± 1.6 (B)Nanostructure (0.4 lg/mm2) 54 149 13 ± 2.0 11 �2 ± 2.0 (B)Microstructure 86 208 21 ± 1.7 9 �12 ± 1.7 (T)Hierarchical structure 49 144 0.2 ± 0.06 3.6 3.4 ± 0.06 (B)
Lotus waxFlat 92 243 133 ± 3.3Nanostructure 47 138 0.8 ± 0.08 3.2 2.4 ± 0.08 (B)Microstructure (Lotus replica) 63 179 14 ± 1.8 11 �3 ± 1.8 (T and B)Microstructure (Micropatterned
Si replica)66 183 10 ± 1.6 10 0 ± 1.6 (B)
Hierarchical structure (Lotusreplica)
40 139 0.1 ± 0.04 3.6 3.5 ± 0.04 (B)
Hierarchical structure(Micropatterned Si replica)
38 137 0.04 ± 0.01 2.7 2.6 ± 0.01 (B)
B – bouncing off.T – transition.
B. Bhushan, Y.C. Jung / Progress in Materials Science 56 (2011) 1–108 93
adhesion force between the droplet and surface (DF is positive), the droplet can be vertically separatedfrom the surface (bouncing off) before the composite solid–liquid–air interface is destroyed. Theexperimental results for bouncing off of the droplet appear to have the same trend as the proposedmodel (Eq. (42)). It is shown that hierarchical structures have the positive value of the differencebetween the inertia force and adhesive force for droplet bounce off responsible for superior resistanceto the dynamic effects and maintain stable composite solid–air–liquid interface.
5.6. Mechanically durable CNT-composite hierarchical structured surfaces
To create nano- and hierarchical structures with a high mechanical strength, multi-walled CNTwere fabricated using catalyst-assisted chemical vapor deposition (CCVD) (Sun Nanotech Co. Ltd.,China). Iron catalyst was used to initiate growth of nanotubes using natural gas as carbon sourceand Ar/H2 as buffer gas at 750 �C. The contact angle of individual carbon nanotubes has been reportedas 60� and higher. The multi-walled CNT composites were deposited on flat epoxy resin and micro-structure using a spray method as shown in Fig. 73 [106]. Microstructures were fabricated using amicrostructured Si surface with pillars of 14 lm diameter and 30 lm height with 23 lm pitch by softlithography [34,106]. The first step of deposition of CNT composite using the spray method was to dis-perse the CNT into a solvent in order to maintain a uniform distribution. Acetone was used as a solventbecause it does not affect surface modification and is easily vaporized in ambient conditions. The dis-persion process consisted of the sonification of 200 mg CNT in 100 mL of acetone for 4 min using aBranson Digital Sonifier with a frequency of 20 kHz at amplitude of 80%. During this process, the mix-ture was exposed to ultrasonic pressure waves in a sonifier in order to disperse the CNT into smalleraggregates. To provide strong bonding between CNT and the substrate, 200 mg EPON epoxy resin1002F was added to the mixture of CNT and acetone, and then the mixture was sonificated for 4 moreminutes. Next, the sonified mixture was poured into a spray gun and sprayed onto the specimen sur-faces. The conditions for uniform deposition of the CNT on the surfaces were optimized by adjusting

Fig. 71. Optical micrographs of droplets on various surfaces with n-hexatriacontane before and after vibrating at frequency of30 Hz. The transition of a droplet on the nanostructure with 0.12 lg/mm2 mass of n-hexatriacontane and on the microstructureoccurred at amplitudes of 2.4 mm and 2.0 mm, respectively [105].
94 B. Bhushan, Y.C. Jung / Progress in Materials Science 56 (2011) 1–108
the concentration of CNT in the solvent. After spraying the CNT on the surfaces, the CNT compositestructures were then annealed at 120 �C for 3 h in order to improve the mechanical properties. Thistemperature, above the melting point (80–88 �C) and below the burning point (180 �C) of EPON epoxyresin 1002F, was selected to increase strong bonding between CNT and substrates. At this tempera-ture, the epoxy which initially covered the CNT was melted and moved to the interface betweenthe CNT and substrates, resulting in exposed CNTs which lead to high contact angle.
Fig. 74 shows the SEM micrographs of nano- and hierarchical structures fabricated with CNT [106].SEM micrographs show an overview (left column), a detail in higher magnification (middle column),

Fig. 72. Bar chart showing the calculated adhesive force responsible for the separation between the droplet and surface andinertia force of a droplet vibrated on various structures. The inertia forces were obtained as the transition or droplet bounce offoccurred. If the inertia force of the droplet vibrated on the surface can overcome the adhesion force between the droplet andsurface (DF is positive), the droplet can be vertically separated from the surface (bouncing off) before the composite solid–liquid–air interface is destroyed [105].
Fig. 73. Schematic of spray method to deposit a mixture of CNT, epoxy, and acetone on surfaces [106].
B. Bhushan, Y.C. Jung / Progress in Materials Science 56 (2011) 1–108 95
and a large magnification of the nanostructures with CNT (right column). All surfaces show a homog-enous distribution of CNT on the specimen. The CNT were well dispersed and embedded on flat andmicrostructured surfaces for the desired nanostructure. The CNT diameter varied between 10 and30 nm, and an aspect ratio varied between 160 and 200.

96 B. Bhushan, Y.C. Jung / Progress in Materials Science 56 (2011) 1–108
Lotus leaves have been the inspiration for the development of superhydrophobic and self-cleaningproducts. Therefore, as a benchmark for mechanical durability studies, Jung and Bhushan [106] usednano-, micro-, and hierarchical structures created by the self-assembly of Lotus wax with the amountsof 0.8 lg/mm2 deposited on flat epoxy resin and microstructure by thermal evaporation as shown inFig. 63.
5.6.1. The influence of CNT-composite hierarchical structure on the superhydrophobicityTo study the effect of CNT composite structures for superhydrophobicity, Jung and Bhushan [106]
measured the static contact angle and contact angle hysteresis on nano- and hierarchical structureswith CNT. For static contact angle and contact angle hysteresis, droplets of about 5 lL in volume (withthe diameter of a spherical droplet about 2.1 mm) were gently deposited on the surface using a micro-syringe. For contact angle hysteresis, the advancing and receding contact angles were measured at thefront and back of the droplet moving along the tilted surface, respectively. Fig. 75a shows that super-hydrophobicity with a static contact angle of 166� and a contact angle hysteresis of 4� was found in thenanostructured surface with CNT. After introducing CNT nanostructure on top of the micropatternedSi replica, the higher static contact angle of 170� and lower contact angle hysteresis of 2� were foundfor the hierarchical structures with CNT. Both nano- and hierarchical structures created with CNTshowed superhydrophobic and self-cleaning surface, which has a static contact angle of more than150� and contact angle hysteresis of less than 10� [106].
Fig. 75b shows that for the hierarchical structure with Lotus wax, the highest static contact anglesof 173� and lowest contact angle hysteresis of 1� were found. The recrystallized wax tubules are verysimilar to those of the original Lotus leaf, but are 0.5–1 lm longer, the static contact angle is higher,and the contact angle hysteresis is lower than reported for the original Lotus leaf (static contact angleof 164� and contact angle hysteresis of 3�) [119]. Superhydrophobicity with a static contact angle of167� and a contact angle hysteresis of 5� was also found in the nanostructured surface with Lotuswax. The microstructured surface with Louts wax layer has a static contact angle of 160�, but showsa much higher contact angle hysteresis of 29� than found in hierarchical structures. Melting of the Lo-tus wax led to a flat surface with a flat wax film and a much lower static contact angle of 119� andhigher contact angle hysteresis of 71�. The data of a flat Lotus wax film on a flat replica show thatthe Lotus wax by itself is hydrophobic [106].
5.6.2. Durability of various surfaces in waterfall/jet testsTo investigate the durability of the created surfaces in long-term exposure to water, and how dif-
ferent kinetic energies of the water hitting the surface affect wetting properties, Jung and Bhushan
Fig. 74. SEM micrographs taken at 45� tilt angle, show three magnifications of nano- and hierarchical structures fabricated withCNT after three hours at 120 �C [106].

B. Bhushan, Y.C. Jung / Progress in Materials Science 56 (2011) 1–108 97
[106] conducted waterfall/jet tests on the surfaces created with CNT and Lotus wax. First, the nano-and hierarchical structures with CNT were continuously exposed to water pressure of 10 kPa for24 h. Fig. 76a (left side) shows static contact angle and contact angle hysteresis as a function of expo-sure time. In the case of nano- and hierarchical structures with CNT, it was observed that the staticcontact angles decreased slightly but remained more than 150�, and the contact angle hysteresis in-creased slightly but remained less than 15�. Next, the nano- and hierarchical structures with CNT wereexposed to water with pressure ranging from 0 to 45 kPa for 20 min. Fig. 76a (right side) shows staticcontact angle and contact angle hysteresis as a function of water pressure. As water pressure hittingthe surfaces increased, the static contact angle and contact angle hysteresis decreased and increasedslightly, respectively, but a significant change was not found on both nano- and hierarchical structuresfor superhydrophobicity. It can be interpreted that there was no deformation of CNT structures due tostrong bonding with the substrate. As a result, superhydrophobic CNT composite structures showedgood stability of wetting properties not only from long-term exposure to water but also high waterpressure.
In order to compare durability of the created surfaces with CNT and Lotus wax, Jung and Bhushan[106] also conducted waterfall/jet tests on the flat, nano-, micro-, and hierarchical structures with Lo-tus wax. First, the surfaces with Lotus wax were continuously exposed to water pressure of 10 kPa for24 h. Fig. 76b (left side) shows static contact angle and contact angle hysteresis as a function of expo-sure time. As the exposure time increases up to 24 h, the static contact angle of all samples decreasedslightly but remained more than 150�. However, based on contact angle hysteresis data, it was foundthat after an exposure time of 10 h, the values of nano- and hierarchical structures with Lotus wax in-creased rapidly to 27� and 12� and continued to increase to 49� and 24� at the exposure time of 24 h,respectively. This indicates that a portion of the wax nanostructured area started to be damaged,resulting in inducing the pinning of the droplet at the damaged area and then increasing contact angle
Fig. 75. Bar chart showing the measured static contact angle and contact angle hysteresis on (a) nano- and hierarchicalstructures fabricated with CNT after three hours at 120 �C, and (b) various structures fabricated with 0.8 lg/mm2 of Lotus waxafter storage for 7 days at 50 �C with ethanol vapor. The error bar represents ±1 standard deviation [106].

98 B. Bhushan, Y.C. Jung / Progress in Materials Science 56 (2011) 1–108
hysteresis. Next, the surfaces with Lotus wax were exposed to the water with pressure ranging from 0to 45 kPa for 20 min. Fig. 76b (right side) shows static contact angle and contact angle hysteresis as a
Fig. 76. Static contact angle and contact angle hysteresis as a function of exposure time at water pressure of 10 kPa and waterpressure of exposure for 20 min for the droplet with a 1 mm radius (5 lL volume) gently deposited on the surfaces with (a) CNTand (b) Lotus wax. The data are reproducible within ±5% [106].

B. Bhushan, Y.C. Jung / Progress in Materials Science 56 (2011) 1–108 99
function of water pressure of exposure. As the water pressure increased up to 45 kPa, static contactangle and contact angle hysteresis of flat and microstructure with Lotus wax layer remained almostconstant. However, as the water pressure increased up to 34 kPa, the static contact angle of nano-and hierarchical structures with Lotus wax first decreased slightly, and then the contact angle starteddecreasing sharply. It was also observed that the corresponding large change in contact angle hyster-esis was found above 34 kPa. It is usually known that wax structures on the leaves can easily be in-duced by touching the leaf surface or by mechanical wear during transport of the leaves. Asexpected, it is observed that the nanostructure with Lotus wax can be damaged by water with highpressure, resulting in loss of superhydrophobicity.
5.6.3. Durability of various surfaces in AFM and ball-on-flat tribometer testsTo investigate the durability of the nanostructure fabricated using CNT, Jung and Bhushan [106]
conducted wear tests by creating 50 � 50 lm2 wear scars with a 15 lm radius borosilicate ball for1 cycle at two normal loads of 100 nN and 10 lN using AFM. Fig. 77a shows surface height mapsbefore and after wear tests for nanostructures with CNT. As the normal load of 100 nN was appliedon the nanostructure with CNT, the wear scar induced on the surface after the 100 nN normal loadtests was not found or very low, and it was also hard to quantify a wear depth on the nanostructurewith CNT scanned with a borosilicate ball. With increasing the normal load to 10 lN, it was found thatthe wear depth on the nanostructure with CNT was not significantly changed, but the morphology of
Fig. 77. Surface height maps before and after wear tests with a 15 lm radius borosilicate ball at 100 nN and 10 lN fornanostructures with (a) CNT and (b) Lotus wax using an AFM [106].

100 B. Bhushan, Y.C. Jung / Progress in Materials Science 56 (2011) 1–108
the CNT differs slightly from that before wear test. It can be interpreted that the individual CNT mightbe expected to slide or bend by the borosilicate ball applied by high normal load of 10 lN during thetest process.
For comparison, Jung and Bhushan [106] also investigated the durability of the nanostructure fab-ricated using Lotus wax by applying two normal loads of 100 nN and 10 lN using AFM. Fig. 77b showssurface height maps before and after wear tests for nanostructures with Lotus wax. As the normal loadof 100 nN was applied on the nanostructure with Lotus wax, the change in the morphology of thestructured surface was observed, and a small amount of debris was generated compared to the surfacebefore wear test, indicating that the wax nanostructure has weak mechanical strength at even smallload. With increasing the normal load to 10 lN, it was found that the depth of wear mark increased,and the nanostructure with Lotus wax was fully removed from the substrate. As expected, the nano-structure with Lotus wax exhibited the greater amount of wear compared to the nanostructure withCNT as evidenced by debris build-up around the edge of the wear test region. The damage of the struc-tured surface can cause the sticking of water droplets in the wear region, resulting in low static contactangle and high contact angle hysteresis.
In order to investigate the durability of structured surfaces at a high load, Jung and Bhushan [106]conducted conventional ball-on-flat tribometer experiments for the surfaces with CNT. Fig. 78a showsthe coefficient of friction as a function of number of cycles for the nano- and hierarchical structureswith CNT. The data are reproducible within ±5% based on three measurements. The coefficients of fric-tion on both nano- and hierarchical structures with CNT first increased slightly for 20 cycles. Such atrend can be due to the elastic bending or buckling of CNT by contacting with a sapphire ball duringthe beginning of scan, resulting in an increase of the contact area. During the entire experiment, thecoefficient of friction value of the nano- and hierarchical structures with CNT changed minimally,
Fig. 78. Coefficient of friction as a function of number of cycles using a ball-on-flat tribometer for the surfaces with (a) CNT and(b) Lotus wax at room temperature (22 ± 1 �C) and ambient air (45 ± 5% RH). The data are reproducible within ±5% based onthree measurements [106].

Fig. 79. Optical micrographs before and after wear test at 10 mN (100 cycles) using a ball-on-flat tribometer for the surfaceswith (a) CNT and (b) Lotus wax [106].
B. Bhushan, Y.C. Jung / Progress in Materials Science 56 (2011) 1–108 101

102 B. Bhushan, Y.C. Jung / Progress in Materials Science 56 (2011) 1–108
which indicates that the CNT was not being worn after 100 cycles. To investigate the change in themorphology of the surfaces after wear test, optical microscope images were obtained before and afterwear test as shown in Fig. 79a. As expected, it was observed that there is no or low wear on nano- andhierarchical structures after wear tests. No or low wear on the CNT composite structure can possiblybe due to the significant increase in the mechanical strength and wear resistance led from the uniformdistribution and strong bonding of CNT on flat epoxy resin and microstructure. The elastic bending orbuckling exhibited by CNT make them exceedingly tough materials and may be absorbing some of theforce at contact acting as a compliant spring moderating the impact of the ball on the surface[68,139,55].
Contact diameters and contact stresses of CNT at three loads used in AFM and ball-on-flat tribom-eter tests were calculated [106]. Table 12 lists the physical properties of various specimens. It is as-sumed that contacts are single-asperity elastic contacts. For this case, the contact diameter [15,17],
Table 1Typicaland bal
ElastPoissBend
Carbn
a [48b [24c [20d [21
d ¼ 23WR4E�
� �1=3
ð43Þ
where W is the total normal load, R is the asperity radius, and E* is the effective elastic modulus. Itshould be noted that contact occurs on multiple asperities, and Eq. (43) gives an approximate value.The calculated contact diameter and contact stress are presented in Table 12. The deformation of CNTappears to be elastic at the three loads applied by borosilicate ball and sapphire ball.
In order to compare the durability of the created surfaces with CNT and Lotus wax at a high load,Jung and Bhushan [106] conducted a wear study on the surfaces with Lotus wax using a conventionalball-on-flat tribometer. As shown in Fig. 78b, the coefficient of friction value of the surfaces with Lotuswax exhibited a gradual increase when the sliding cycle increases up to about 70 cycles, and then re-mains constant. This indicates that the wax nanostructure and flat wax layer could be undergoingsome wear due to weak bonding between them and the substrates. The change in the morphologyof the surfaces with Lotus wax was observed in optical microscope images as shown in Fig. 79b. Asshown in the AFM study at low loads (Fig. 77b), it is clearly observed that the flat wax layer andwax nanostructure on flat and microstructure were fully removed from the surfaces. As a result, super-hydrophobic CNT composite structures showed better mechanical durability than the structured sur-faces with Lotus wax to best withstand real world applications.
6. Closure
Biomimetics allows one to mimic biology or nature to develop materials and devices of commercialinterest by engineers. Properties of biological materials and surfaces result from a complex interplay
2physical properties of various specimens and calculated contact diameters and contact stresses at three loads used in AFMl-on-flat tribometer measurements. It is assumed that contacts are single-asperity contact [106].
Borosilicate ball with a 15 lm radius Sapphire ball with a 1.5 mm radius Carbon nanotube
ic modulus (GPa) 70a 390b 1200c
on’s ratio 0.2a 0.23b 0.2d
ing strength (GPa) 14.2c
Contact diameter (lm) Mean contact pressure (GPa)
Borosilicate ballat 100 nN
Borosilicateball at 10 lN
Sapphire ballat 10 mN
Borosilicate ballat 100 nN
Borosilicateball at 10 lN
Sapphire ballat 10 mN
onanotube
0.05 0.24 6.62 0.076 0.33 0.44
].].0].0].

B. Bhushan, Y.C. Jung / Progress in Materials Science 56 (2011) 1–108 103
between surface morphology and physical and chemical properties. Hierarchical structures withdimensions of features ranging from the macroscale to the nanoscale are extremely common in natureto provide properties of interest. There are a large number of objects including bacteria, plants, landand aquatic animals and seashells, with properties of commercial interest. This article has focusedon surfaces with superhydrophobicity, self-cleaning, low adhesion, and drag reduction, such as Lotusleaf and shark skin. The development of superhydrophobic and self-cleaning surfaces is important forbasic research as well as various applications, including self-cleaning windows, exterior paints forbuildings, navigation ships, textiles, solar panels, and applications requiring anti-fouling and a reduc-tion in fluid flow, e.g., in micro/nanochannels. These surfaces can also be used in energy conversionand conservation.
In this article, the theoretical mechanisms of wetting of rough surfaces and characterization of nat-ural and artificial surfaces with superhydrophobicity, self-cleaning, low adhesion and drag reductionhas been presented. Theoretical approaches have been presented to understand these phenomenasuch as the transition between the Wenzel and Cassie–Baxter wetting regimes, contact angle hyster-esis, the role of hierarchical roughness, and the possibility of the creation of reversible hydrophobicity.Based on learning from the theoretical background, various leaf surfaces on the micro- and nanoscalehave been characterized and attempts are made to separate out the effects of the micro- and nano-bumps and the wax on the hydrophobicity. The next logical step in realizing superhydrophobic sur-faces is to design surfaces based on understanding of the leaves. Artificial superhydrophobicsurfaces have been fabricated using various fabrication techniques. The influence of micro-, nano-and hierarchical structures on superhydrophobicity have been discussed by the investigation of staticcontact angle, contact angle hysteresis, evaporation, bouncing and vibration of a water droplet, andpropensity of air pocket formation. In addition, their influence on adhesive force as well as efficiencyof self-cleaning have been discussed. The models for the transition from Cassie–Baxter regime to Wen-zel regime have been presented. Furthermore, the durability of the various fabricated surfaces hasbeen discussed by the investigation of the loss of superhydrophobicity as well as wear and friction.
This article provides a useful guide for the development of biomimetic artificial surfaces. Hierarchi-cal structures are typical for surfaces with superhydrophobic, self-cleaning, low adhesion and dragreduction in nature. The flexible and low-cost technique demonstrates that hierarchical surfacescan be produced in the laboratory for further investigations of the properties of hierarchical structuredmaterials. A proper control of roughness constitutes the main challenge in producing a reliable hier-archical surface and furthermore the mechanisms that trigger the Cassie–Baxter and Wenzel regimetransitions still remain to be further investigated.
References
[1] Abdelsalam ME, Bartlett PN, Kelf T, Baumberg J. Wetting of regularly structured gold surfaces. Langmuir 2005;21:1753–7.[2] Adamson AV. Physical chemistry of surfaces. New York: Wiley; 1990.[3] Anisimov MA. Divergence of Tolman’s length for a droplet near the critical point. Phys Rev Lett 2007;98:035702.[4] Autumn K, Liang YA, Hsieh ST, Zesch W, Chan WP, Kenny TW, et al. Adhesive force of a single gecko foot-hair. Nature
2000;405:681–5.[5] Bahadur V, Garimella SV. Electrowetting-based control of static droplet states on rough surfaces. Langmuir
2007;23:4918–24.[6] Baker EA. Chemistry and morphology of plant epicuticular waxes. In: Cutler DF, Alvin KL, Price CE, editors. The plant
cuticle. London: Academic Press; 1982. p. 139–65.[7] Barbieri L, Wagner E, Hoffmann P. Water wetting transition parameters of perfluorinated substrates with periodically
distributed flat-top microscale obstacles. Langmuir 2007;23:1723–34.[8] Bar-Cohen Y. Biomimetics: biologically inspired technologies. Boca Raton, FL: Taylor and Francis; 2006.[9] Bartell FE, Shepard JW. Surface roughness as related to hysteresis of contact angles. J Phys Chem 1953;57:455–8.
[10] Barthlott W, Neinhuis C. Purity of the sacred lotus, or escape from contamination in biological surfaces. Planta1997;202:1–8.
[11] Bartolo D, Bouamrirene F, Verneuil E, Buguin A, Silberzan P, Moulinet S. Bouncing or sticky droplets: impalementtransitions on superhydrophobic micropatterned surfaces. Europhys Lett 2006;74:299–305.
[12] Bechert DW, Bruse M, Hage W. Experiments with three-dimensional riblets as an idealized model of shark skin. Exp Fluids2000;28:403–12.
[13] Bhushan B. Tribology and mechanics of magnetic storage systems. 2nd ed. New York: Springer-Verlag; 1996.[14] Bhushan B. Tribology issues and opportunities in MEMS. Dordrecht, Netherlands: Kluwer Academic Publishers; 1998.[15] Bhushan B. Principles and applications of tribology. New York: Wiley; 1999.

104 B. Bhushan, Y.C. Jung / Progress in Materials Science 56 (2011) 1–108
[16] Bhushan B. Modern tribology handbook, vol. 1 – Principles of tribology, vol. 2 – Materials, coatings, and industrialapplications. Boca Raton, FL: CRC Press Inc.; 2001.
[17] Bhushan B. Introduction to tribology. New York: Wiley; 2002.[18] Bhushan B. Adhesion and stiction: mechanisms, measurement techniques and methods for reduction. J Vac Sci Technol B
2003;21:2262–96.[19] Bhushan B. Adhesion of multi-level hierarchical attachment systems in gecko feet. J Adhes Sci Technol 2007;21:1213–58.[20] Bhushan B. Springer handbook of nanotechnology. 2nd ed. Heidelberg, Germany: Springer; 2007.[21] Bhushan B. Nanotribology and nanomechanics – an introduction. 2nd ed. Heidelberg, Germany: Springer-Verlag; 2008.[22] Bhushan B. Biomimetics: lessons from nature – an overview. Phil Trans R Soc A 2009;367:1445–86.[23] Bhushan B, Blackman GS. Atomic force microscopy of magnetic rigid disks and sliders and its applications to tribology.
ASME J Tribol 1991;113:452–7.[24] Bhushan B, Gupta BK. Handbook of tribology: materials, coatings, and surface treatments. New York: McGraw-Hill; 1991.[25] Bhushan B, Jung YC. Micro and nanoscale characterization of hydrophobic and hydrophilic leaf surface. Nanotechnology
2006;17:2758–72.[26] Bhushan B, Jung YC. Wetting study of patterned surfaces for superhydrophobicity. Ultramicroscopy 2007;107:1033–41.[27] Bhushan B, Jung YC. Wetting, adhesion and friction of superhydrophobic and hydrophilic leaves and fabricated micro/
nanopatterned surfaces. J Phys: Condens Matter 2008;20:225010.[28] Bhushan B, Israelachvili JN, Landman U. Nanotribology: friction, wear and lubrication at the atomic scale. Nature
1995;374:607–16.[29] Bhushan B, Hansford D, Lee KK. Surface modification of silicon and polydimethylsiloxane surfaces with vapor-phase-
deposited ultrathin fluorosilane films for biomedical nanodevices. J Vac Sci Technol A 2006;24:1197–202.[30] Bhushan B, Nosonovsky M, Jung YC. Towards optimization of patterned superhydrophobic surfaces. J R Soc Interface
2007;4:643–8.[31] Bhushan B, Koch K, Jung YC. Nanostructures for superhydrophobicity and low adhesion. Soft Matter 2008;4:1799–804.[32] Bhushan B, Koch K, Jung YC. Biomimetic hierarchical structure for self-cleaning. Appl Phys Lett 2008;93:093101.[33] Bhushan B, Jung YC, Koch K. Self-cleaning efficiency of artificial superhydrophobic surfaces. Langmuir 2009;25:3240–8.[34] Bhushan B, Jung YC, Koch K. Micro-, nano- and hierarchical structures for superhydrophobicity, self-cleaning and low
adhesion. Phil Trans R Soc A 2009;367:1631–72.[35] Bhushan B, Jung YC, Niemietz A, Koch K. Lotus-like biomimetic hierarchical structures developed by the self-assembly of
tubular plant waxes. Langmuir 2009;25:1659–66.[36] Bhushan B, Koch K, Jung YC. Fabrication and characterization of the hierarchical structure for superhydrophobicity.
Ultramicroscopy 2009;109:1029–34.[37] Bico J, Marzolin C, Quere D. Pearl drops. Europhys Lett 1999;47:220–6.[38] Bico J, Thiele U, Quéré D. Wetting of textured surfaces. Colloids Surf A 2002;206:41–6.[39] Bormashenko E, Stein T, Whyman G, Bormashenko Y, Pogreb E. Wetting properties of the multiscaled nanostructured
polymer and metallic superhydrophobic surfaces. Langmuir 2006;22:9982–5.[40] Bormashenko E, Bormashenko Y, Stein T, Whyman G, Pogreb R, Barkay Z. Environmental scanning electron microscope
study of the fine structure of the triple line and Cassie–Wenzel wetting transition for sessile drops deposited on roughpolymer substrates. Langmuir 2007;23:4378–82.
[41] Bormashenko E, Pogreb R, Whyman G, Erlich M. Cassie–Wenzel wetting transition in vibrated drops deposited on therough surfaces: is dynamic Cassie–Wenzel transition 2D or 1D affair? Langmuir 2007;23:6501–3.
[42] Boruvka L, Neumann AW. Generalization of the classical theory of capillarity. J Chem Phys 1977;66:5464–76.[43] Bourges-Monnier C, Shanahan MER. Influence of evaporation on contact angle. Langmuir 1995;11:2820–9.[44] Brugnara M, Della Volpe C, Siboni S, Zeni D. Contact angle analysis on polymethylmethacrylate and commercial wax by
using an environmental scanning electron microscope. Scanning 2006;28:267–73.[45] Bunshah RF. Handbook of deposition technologies for films and coatings: science, technology and
applications. Westwood, NJ: Applied Science Publishers; 1994.[46] Burton Z, Bhushan B. Hydrophobicity, adhesion, and friction properties of nanopatterned polymers and scale dependence
for micro- and nanoelectromechanical systems. Nano Lett 2005;5:1607–13.[47] Burton Z, Bhushan B. Surface characterization and adhesion and friction properties of hydrophobic leaf surfaces.
Ultramicroscopy 2006;106:709–19.[48] Callister WD. Materials science and engineering – an introduction. 5th ed. New York: John Wiley and Sons; 2000.[49] Cassie A, Baxter S. Wettability of porous surfaces. Trans Faraday Soc 1944;40:546–51.[50] Cappella B, Bonaccurso E. Solvent-assisted nanolithography on polystyrene surfaces using the atomic force microscope.
Nanotechnology 2007;18:155307.[51] Celestini F, Kofman R. Vibration of submillimeter-size supported droplets. Phys Rev E 2006;73:041602.[52] Checco A, Guenoun P, Daillant J. Nonlinear dependence of the contact angle of nanodroplets on contact line curvatures.
Phys Rev Lett 2003;91:186101.[53] Chen N, Bhushan B. Atomic force microscopy studies of conditioner thickness distribution and binding interactions on the
hair surface. J Microsc 2006;221:203–15.[54] Chen YL, Helm CA, Israelachvili JN. Molecular mechanisms associated with adhesion and contact angle hysteresis of
monolayer surfaces. J Phys Chem 1991;95:10736–47.[55] Chen XH, Chen CS, Xiao HN, Liu HB, Zhou LP, Li SL, et al. Dry friction and wear characteristics of nickel/carbon nanotube
electroless composite deposits. Tribol Int 2006;39:22–8.[56] Cheng YT, Rodak DE, Angelopoulos A, Gacek T. Microscopic observations of condensation of water on lotus leaves. Appl
Phys Lett 2005;87:194112.[57] Chiou N, Lu C, Guan J, Lee LJ, Epstein AJ. Growth and alignment of polyaniline nanofibres with superhydrophobic,
superhydrophilic and other properties. Nat Nanotechnol 2007;2:354–7.[58] Choi SE, Yoo PJ, Baek SJ, Kim TW, Lee HH. An ultraviolet-curable mold for sub-100-nm lithography. J Am Chem Soc
2004;126:7744–5.

B. Bhushan, Y.C. Jung / Progress in Materials Science 56 (2011) 1–108 105
[59] Chong MAS, Zheng YB, Gao H, Tan LK. Combinational template-assisted fabrication of hierarchically ordered nanowirearrays on substrates for device applications. Appl Phys Lett 2006;89:233104.
[60] Cleveland JP, Manne S, Bocek D, Hansma PK. A nondestructive method for determining the spring constant of cantileversfor scanning force microscopy. Rev Sci Instrum 1993;64:403–5.
[61] Cortese B, Amone SD, Manca M, Viola I, Cingolani R, Gigli G. Superhydrophobicity due to the hierarchical scale roughnessof PDMS surfaces. Langmuir 2008;24:2712–8.
[62] Coulson SR, Woodward I, Badyal JPS, Brewer SA, Willis C. Super-repellent composite fluoropolymer surfaces. J Phys ChemB 2000;104:8836–40.
[63] Danilatos GD, Brancik JV. Observation of liquid transport in the ESEM. In: Proceedings of the 44th annual meeting EMSA;1986. p. 678–9.
[64] del Campo A, Greiner C. SU-8: a photoresist for high-aspect-ratio and 3D submicron lithography. J Micromech Microeng2007;17:R81–95.
[65] de Gennes PG, Brochard-Wyart F, Quere D. Capillarity and wetting phenomena. Berlin: Springer; 2003.[66] Derjaguin BV, Churaev NV. Structural component of disjoining pressure. J Colloid Interface Sci 1974;49:249–55.[67] Dorset DL, Pangborn WA, Hancock AJ. Epitaxial crystallization of alkane chain lipids for electron diffraction analysis. J
Biochem Biophys Methods 1983;8:29–40.[68] Dresselhaus MS, Dresselhaus G, Avouris Ph. Carbon nanotubes: synthesis, structure, properties, and
applications. Heidelberg, Germany: Springer; 2000.[69] Erbil HY, McHale G, Newton MI. Drop evaporation on solid surfaces: constant contact angle mode. Langmuir
2002;18:2636–41.[70] Erbil HY, Demirel AL, Avci Y. Transformation of a simple plastic into a superhydrophobic surface. Science
2003;299:1377–80.[71] Eustathopoulos N, Nicholas MG, Drevet B. Wettability at high temperatures. Amsterdam: Pergamon; 1999.[72] Extrand CW. Model for contact angle and hysteresis on rough and ultraphobic surfaces. Langmuir 2002;18:7991–9.[73] Extrand CW. Contact angle hysteresis on surfaces with chemically heterogeneous islands. Langmuir 2003;19:3793–6.[74] Extrand CW. Criteria for ultralyophobic surfaces. Langmuir 2004;20:5013–8.[75] Feng XJ, Feng L, Jin MH, Zhai J, Jiang L, Zhu DB. Reversible super-hydrophobicity to super-hydrophilicity transition of
aligned ZnO nanorod films. J Am Chem Soc 2004;126:62–3.[76] Furstner R, Barthlott W, Neinhuis C, Walzel P. Wetting and self-cleaning properties of artificial superhydrophobic
surfaces. Langmuir 2005;21:956–61.[77] Gao XF, Jiang L. Biophysics: water-repellent legs of water striders. Nature 2004;432:36.[78] Gao L, McCarthy TJ. The lotus effect explained: two reasons why two length scales of topography are important. Langmuir
2006;22:2966–7.[79] Gao L, McCarthy TJ. How Wenzel and Cassie were wrong. Langmuir 2007;23:3762–5.[80] Gao H, Wang X, Yao H, Gorb S, Arzt E. Mechanics of hierarchical adhesion structures of geckos. Mech Mater
2005;37:275–85.[81] Gao X, Yan X, Yao X, Xu L, Zhang K, Zhang J, et al. The dry-style antifogging properties of mosquito compound eyes and
artificial analogues prepared by soft lithography. Adv Mater 2007;19:2213–7.[82] Genzer J, Efimenko K. Recent developments in superhydrophobic surfaces and their relevance to marine fouling: a review.
Biofouling 2006;22:339–60.[83] Gordon JE. The new science of strong materials, or why you don’t fall through the floor. 2nd ed. London, UK: Pelican–
Penguin; 1976.[84] Good RJ. A thermodynamic derivation of Wenzel’s modification of Young’s equation for contact angles; together with a
theory of hysteresis. J Am Chem Soc 1952;74:5041–2.[85] Gupta P, Ulman A, Fanfan F, Korniakov A, Loos K. Mixed self-assembled monolayer of alkanethiolates on ultrasmooth gold
do not exhibit contact angle hysteresis. J Am Chem Soc 2005;127:4–5.[86] Han JT, Jang Y, Lee DY, Park JH, Song SH, Ban DY, et al. Fabrication of a bionic superhydrophobic metal surface by sulfur-
induced morphological development. J Mater Chem 2005;15:3089–92.[87] He B, Patankar NA, Lee J. Multiple equilibrium droplet shapes and design criterion for rough hydrophobic surfaces.
Langmuir 2003;19:4999–5003.[88] Herminghaus S. Roughness-induced non-wetting. Europhys Lett 2000;52:165–70.[89] Hikita M, Tanaka K, Nakamura T, Kajiyama T, Takahara A. Superliquid-repellent surfaces prepared by colloidal silica
nanoparticles covered with fluoroalkyl groups. Langmuir 2005;21:7299–302.[90] Hosono E, Fujihara S, Honma I, Zhou H. Superhydrophobic perpendicular nanopin film by the bottom-up process. J Am
Chem Soc 2005;127:13458–9.[91] Huang L, Lau SP, Yang HY, Leong ESP, Yu SF. Stable superhydrophobic surface via carbon nanotubes coated with a ZnO thin
film. J Phys Chem 2005;109:7746–8.[92] Israelachvili JN. Intermolecular and surface forces. 2nd ed. London: Academic Press; 1992.[93] Israelachvili JN, Gee ML. Contact angles on chemically heterogeneous surfaces. Langmuir 1989;5:288–9.[94] Ishino C, Okumura K. Nucleation scenarios for wetting transition on textured surfaces: the effect of contact angle
hysteresis. Europhys Lett 2006;76:464–70.[95] Jansen H, de Boer M, Legtenberg R, Elwenspoek M. The black silicon method: a universal method for determining the
parameter setting of a fluorine-based reactive ion etcher in deep silicon trench etching with profile control. J MicromechMicroeng 1995;5:115–20.
[96] Jetter R, Kunst L, Samuels AL. Composition of plant cuticular waxes. In: Riederer M, Müller C, editors. Biology of the plantcuticle. Oxford: Blackwell Publishing; 2006. p. 145–81.
[97] Jin H-J, Kaplan DL. Mechanism of silk processing in insects and spiders. Nature 2003;424:1057–61.[98] Joanny JF, de Gennes PG. A model for contact angle hysteresis. J Chem Phys 1984;81:552–62.[99] Johnson RE, Dettre RH. Contact angle hysteresis. In: Fowkes FM, editor. Contact angle, wettability, and adhesion. Advances
in chemical series, vol. 43. Washington, DC: American Chemical Society; 1964. p. 112–35.

106 B. Bhushan, Y.C. Jung / Progress in Materials Science 56 (2011) 1–108
[100] Jung YC, Bhushan B. Contact angle, adhesion, and friction properties of micro- and nanopatterned polymers forsuperhydrophobicity. Nanotechnology 2006;17:4970–80.
[101] Jung YC, Bhushan B. Wetting transition of water droplets on superhydrophobic patterned surfaces. Scripta Mater2007;57:1057–60.
[102] Jung YC, Bhushan B. Wetting behavior during evaporation and condensation of water microdroplets on superhydrophobicpatterned surfaces. J Microsc 2008;229:127–40.
[103] Jung YC, Bhushan B. Dynamic effects of bouncing water droplets on superhydrophobic surfaces. Langmuir 2008;24:6262–9.[104] Jung YC, Bhushan B. Technique to measure contact angle of micro/nanodroplets using atomic force microscopy. J Vac Sci
Technol A 2008;26:777–82.[105] Jung YC, Bhushan B. Dynamic effects induced transition of droplets on biomimetic superhydrophobic surfaces. Langmuir
2009;25:9208–18.[106] Jung YC, Bhushan B. Mechanically durable CNT-composite hierarchical structures with superhydrophobicity, self-
cleaning, and low-drag. ACS Nano 2009;3:4155–63.[107] Kamusewitz H, Possart W, Paul D. The relation between Young’s equilibrium contact angle and the hysteresis on rough
paraffin wax surfaces. Colloids Surf A: Physicochem Eng Aspects 1999;156:271–9.[108] Kasai T, Bhushan B, Kulik G, Barbieri L, Hoffmann P. Micro/nanotribological study of perfluorosilane SAMs for antistiction
and low wear. J Vac Sci Technol B 2005;23:995–1003.[109] Khorasani MT, Mirzadeh H, Kermani Z. Wettability of porous polydimethylsiloxane surface: morphology study. Appl Surf
Sci 2005;242:339–45.[110] Kijlstra J, Reihs K, Klami A. Roughness and topology of ultra-hydrophobic surfaces. Colloids Surf A: Physicochem Eng
Aspects 2002;206:521–9.[111] Kim D, Hwang W, Park HC, Lee KH. Superhydrophobic micro- and nanostructures based on polymer sticking. Key Eng
Mater 2007;334–335:897–900.[112] Klein RJ, Biesheuvel PM, Yu BC, Meinhart CD, Lange FF. Producing super-hydrophobic surfaces with nano-silica spheres. Z
Metallkd 2003;94:377–80.[113] Koch K, Dommisse A, Barthlott W. Chemistry and crystal growth of plant wax tubules of Lotus (Nelumbo nucifera) and
Nasturtium (Tropaeolum majus) leaves on technical substrates. Crystal Growth Des 2006;6:2571–8.[114] Koch K, Barthlott W, Koch S, Hommes A, Wandelt K, Mamdouh W, et al. Structural analysis of wheat wax (Triticum
aestivum, c.v. ‘Naturastar’ L.): from the molecular level to three dimensional crystals. Planta 2006;223:258–70.[115] Koch K, Dommisse A, Barthlott W, Gorb S. The use of plant waxes as templates for micro- and nanopatterning of surfaces.
Acta Biomat 2007;3:905–9.[116] Koch K, Bhushan B, Barthlott W. Diversity of structure, morphology, and wetting of plant surfaces (invited). Soft Matter
2008;4:1943–63.[117] Koch K, Schulte AJ, Fischer A, Gorb SN, Barthlott W. A fast and low-cost replication technique for nano- and high-aspect-
ratio structures of biological and artificial materials. Bioinsp Biomim 2008;3:046002.[118] Koch K, Bhushan B, Barthlott W. Multifunctional surface structures of plants: an inspiration for biomimetics (invited).
Prog Mater Sci 2009;54:137–78.[119] Koch K, Bhushan B, Jung YC, Barthlott W. Fabrication of artificial lotus leaves and significance of hierarchical structure for
superhydrophobicity and low adhesion. Soft Matter 2009;5:1386–93.[120] Koch K, Bhushan B, Eniskat H-J, Barthlott W. Self-healing of voids in the wax coating on plant surfaces. Philos Trans R Soc
A 2009;367:1673–88.[121] Koinkar VN, Bhushan B. Effect of scan size and surface roughness on microscale friction measurements. J Appl Phys
1997;81:2472–9.[122] Krupenkin TN, Taylor JA, Schneider TM, Yang S. From rolling ball to complete wetting: the dynamic tuning of liquids on
nanostructured surfaces. Langmuir 2004;20:3824–7.[123] Krupenkin TN, Taylor JA, Wang EN, Kolodner P, Hodes M, Salamon TR. Reversible wetting–dewetting transitions on
delectrically tunable superhydrophobic nanostructured surfaces. Langmuir 2007;23:9128–33.[124] Kuan CY, Hon MH, Chou JM, Leu IC. Wetting characteristics on micro/nanostructured zinc oxide coatings. J Electrochem
Soc 2009;156:J32–6.[125] Lafuma A, Quere D. Superhydrophobic states. Nat Mater 2003;2:457–60.[126] Lamb H. Hydrodynamics. Cambridge, England: Cambridge University Press; 1932.[127] Lau KKS, Bico J, Teo KBK, Chhowalla M, Amaratunga GAJ, Milne WI, et al. Superhydrophobic carbon nanotube forests.
Nano Lett 2003;3:1701–5.[128] Lee S-W, Laibinis PE. Directed movement of liquids on patterned surfaces using noncovalent molecular adsorption. J Am
Chem Soc 2000;122:5395–6.[129] Lee W, Jin M, Yoo W, Lee J. Nanostructuring of a polymeric substrate with well-defined nanometer-scale topography and
tailored surface wettability. Langmuir 2004;20:7665–9.[130] Li W, Amirfazli A. A thermodynamic approach for determining the contact angle hysteresis for superhydrophobic
surfaces. J Colloid Interface Sci 2006;292:195–201.[131] Lodge RA, Bhushan B. Surface characterization of human hair using tapping mode atomic force microscopy and
measurement of conditioner thickness distribution. J Vac Sci Technol A 2006;24:1258–69.[132] Ma M, Hill RM. Superhydrophobic surfaces. Curr Opin Colloid Interface Sci 2006;11:193–202.[133] Ma M, Hill RM, Lowery JL, Fridrikh SV, Rutledge GC. Electrospun poly(styrene-block-dimethylsiloxane) block copolymer
fibers exhibiting superhydrophobicity. Langmuir 2005;21:5549–54.[134] Marmur A. Wetting on hydrophobic rough surfaces: to be heterogeneous or not to be? Langmuir 2003;19:8343–8.[135] Marmur A. The lotus effect: superhydrophobicity and metastability. Langmuir 2004;20:3517–9.[136] Martin C, Rius G, Borrise X, Perez-Murano F. Nanolithography on thin layers of PMMA using atomic force microscopy.
Nanotechnology 2005;16:1016–22.[137] Martines E, Seunarine K, Morgan H, Gadegaard N, Wilkinson CDW, Riehle MO. Superhydrophobicity and
superhydrophilicity of regular nanopatterns. Nano Lett 2005;5:2097–103.

B. Bhushan, Y.C. Jung / Progress in Materials Science 56 (2011) 1–108 107
[138] McHale G, Aqil S, Shirtcliffe NJ, Newton MI, Erbil HY. Analysis of droplet evaporation on a superhydrophobic surface.Langmuir 2005;21:11053–60.
[139] Meyyappan M. Carbon nanotubes – science and applications. Boca Raton, FL: CRC Press; 2005.[140] Ming W, Wu D, van Benthem R, de With G. Superhydrophobic films from raspberry-like particles. Nano Lett
2005;5:2298–301.[141] Mueller T. Biomimetics design by natures. Natl Geogr 2008;2008:68–90.[142] Nakajima A, Fujishima A, Hashimoto K, Watanabe T. Preparation of transparent superhydrophobic boehmite and silica
films by sublimation of aluminum acetylacetonate. Adv Mater 1999;11:1365–8.[143] Neinhuis C, Barthlott W. Characterization and distribution of water-repellent, self-cleaning plant surfaces. Ann Bot
1997;79:667–77.[144] Niemietz A, Wandelt K, Barthlott W, Koch K. Thermal evaporation of multi-component waxes and thermally activated
formation of nanotubules for superhydrophobic surfaces. Prog Org Coat 2009;66:221–7.[145] Noblin X, Buguin A, Brochard-Wyart F. Vibrated sessile drops: transition between pinned and mobile contact line
oscillations. Eur Phys J E 2004;14:395–404.[146] Northen MT, Turner KL. A batch fabricated biomimetic dry adhesive. Nanotechnology 2005;16:1159–66.[147] Nosonovsky M. Multiscale roughness and stability of superhydrophobic biomimetic interfaces. Langmuir 2007;23:3157–61.[148] Nosonovsky M. Model for solid–liquid and solid–solid friction for rough surfaces with adhesion hysteresis. J Chem Phys
2007;126:224701.[149] Nosonovsky M. On the range of applicability of the Wenzel and Cassie equations. Langmuir 2007;23:9919–20.[150] Nosonovsky M, Bhushan B. Roughness optimization for biomimetic superhydrophobic surfaces. Microsyst Technol
2005;11:535–49.[151] Nosonovsky M, Bhushan B. Stochastic model for metastable wetting of roughness-induced superhydrophobic surfaces.
Microsyst Technol 2006;12:231–7.[152] Nosonovsky M, Bhushan B. Wetting of rough three-dimensional superhydrophobic surfaces. Microsyst Technol
2006;12:273–81.[153] Nosonovsky M, Bhushan B. Multiscale friction mechanisms and hierarchical surfaces in nano- and bio-tribology. Mater
Sci Eng R 2007;58:162–93.[154] Nosonovsky M, Bhushan B. Hierarchical roughness makes superhydrophobic surfaces stable. Microelectron Eng
2007;84:382–6.[155] Nosonovsky M, Bhushan B. Biomimetic superhydrophobic surfaces: multiscale approach. Nano Lett 2007;7:2633–7.[156] Nosonovsky M, Bhushan B. Hierarchical roughness optimization for biomimetic superhydrophobic surfaces.
Ultramicroscopy 2007;107:969–79.[157] Nosonovsky M, Bhushan B. Multiscale dissipative mechanisms and hierarchical surfaces: friction, superhydrophobicity,
and biomimetics. Heidelberg, Germany: Springer-Verlag; 2008.[158] Nosonovsky M, Bhushan B. Roughness-induced superhydrophobicity: a way to design non-adhesive surfaces. J Phys:
Condens Matter 2008;20:225009.[159] Nosonovsky M, Bhushan B. Biologically-inspired surfaces: broadening the scope of roughness. Adv Func Mater
2008;18:843–55.[160] Nosonovsky M, Bhushan B. Patterned non-adhesive surfaces: superhydrophobicity and wetting regime transitions.
Langmuir 2008;24:1525–33.[161] Nosonovsky M, Bhushan B. Capillary effects and instabilities in nanocontacts. Ultramicroscopy 2008;108:1181–5.[162] Nosonovsky M, Bhushan B. Do hierarchical mechanisms of superhydrophobicity lead to self-organized criticality? Scripta
Mater 2008;59:941–4.[163] Nosonovsky M, Bhushan B. Energy transitions in superhydrophobicity: low adhesion, easy flow and bouncing. J Phys:
Condens Matter 2008;20:395005.[164] Nosonovsky M, Bhushan B. Superhydrophobicity for energy conversion and conservation applications. J Adhes Sci
Technol 2008;22:2105–15.[165] Nosonovsky M, Bhushan B. Multiscale effects and capillary interactions in functional biomimetic surfaces for energy
conversion and green engineering. Phil Trans R Soc A 2009;367:1511–39.[166] Nosonovsky M, Bhushan B. Superhydrophobic surfaces and emerging applications: non-adhesion, energy, green
engineering. Curr Opin Colloid Interface Sci 2009;14:270–80.[167] Oner D, McCarthy TJ. Ultrahydrophobic surfaces. Effects of topography length scales on wettability. Langmuir
2000;16:7777–8.[168] Patankar NA. Transition between superhydrophobic states on rough surfaces. Langmuir 2004;20:7097–102.[169] Patankar NA. Mimicking the lotus effect: influence of double roughness structures and slender pillars. Langmuir
2004;20:8209–13.[170] Pompe T, Herminghaus S. Three-phase contact line energetics from nanoscale liquid surface topographies. Phys Rev Lett
2000;85:1930–3.[171] Pompe T, Fery A, Herminghaus S. Measurement of contact line tension by analysis of the three-phase boundary with
nanometer resolution. In: Drelich J, Laskowski JS, Mittal KL, editors. Apparent and microscopic contact angles. Utrecht:VSP; 2000. p. 3–12.
[172] Poon CY, Bhushan B. Comparison of surface roughness measurements by stylus profiler, AFM and non-contact opticalprofiler. Wear 1995;190:76–88.
[173] Qian B, Shen Z. Fabrication of superhydrophobic surfaces by dislocation-selective chemical etching on aluminum, copper,and zinc substrates. Langmuir 2005;21:9007–9.
[174] Quere D. Surface wetting model droplets. Nat Mater 2004;3:79–80.[175] Quéré D. Non-sticking drops. Rep Prog Phys 2005;68:2495–535.[176] Reif WE. Squamation and ecology of sharks. Cour Forschungstinst Senckenb 1985;78:1–255.[177] Reyssat M, Pepin A, Marty F, Chen Y, Quere D. Bouncing transitions on microtextured materials. Europhys Lett
2006;74:306–12.
108 B. Bhushan, Y.C. Jung / Progress in Materials Science 56 (2011) 1–108
[178] Richard D, Clanet C, Quere D. Contact time of a bouncing drop. Nature 2002;417:811.[179] Rowan SM, Newton MI, McHale G. Evaporation of microdroplets and the wetting of solid surfaces. J Phys Chem
1995;99:13268–71.[180] Sarikaya M, Aksay IA. Biomimetic design and processing of materials. Woodbury, NY: American Institute of Physics; 1995.[181] Semal S, Blake TD, Geskin V, de Ruijter ML, Castelein G, De Coninck J. Influence of surface roughness on wetting dynamics.
Langmuir 1999;15:8765–70.[182] Shang HM, Wang Y, Limmer SJ, Chou TP, Takahashi K, Cao GZ. Optically transparent superhydrophobic silica-based films.
Thin Solid Films 2005;472:37–43.[183] Shi F, Song Y, Niu J, Xia X, Wang Z, Zhang X. Facile method to fabricate a large-scale superhydrophobic surface by galvanic
cell reaction. Chem Mater 2006;18:1365–8.[184] Shibuichi S, Onda T, Satoh N, Tsujii K. Super-water-repellent surfaces resulting from fractal structure. J Phys Chem
1996;100:19512–7.[185] Shirtcliffe NJ, McHale G, Newton MI, Chabrol G, Perry CC. Dual-scale roughness produces unusually water-repellent
surfaces. Adv Mater 2004;16:1929–32.[186] Shirtcliffe NJ, McHale G, Newton MI, Perry CC, Roach P. Porous materials show superhydrophobic to superhydrophilic
switching. Chem Commun 2005:3135–7.[187] Shiu J, Kuo C, Chen P, Mou C. Fabrication of tunable superhydrophobic surfaces by nanosphere lithography. Chem Mater
2004;16:561–4.[188] Stelmashenko NA, Craven JP, Donald AM, Terentjev EM, Thiel BL. Topographic contrast of partially wetting water droplets
in environmental scanning electron microscopy. J Microsc 2001;204:172–83.[189] Sun M, Luo C, Xu L, Ji H, Ouyang Q, Yu D, et al. Artificial lotus leaf by nanocasting. Langmuir 2005;21:8978–81.[190] Tambe NS, Bhushan B. Scale dependence of micro/nano-friction and adhesion of MEMS/NEMS materials, coatings and
lubricants. Nanotechnology 2004;15:1561–70.[191] Teshima K, Sugimura H, Inoue Y, Takai O, Takano A. Transparent ultra water-repellent poly(ethylene terephthalate)
substrates fabricated by oxygen plasma treatment and subsequent hydrophobic coating. Appl Surf Sci 2005;244:619–22.
[192] Tretinnikov ON. Wettability and microstructure of polymer surfaces: stereochemical and conformational aspects. In:Drelich J, Laskowski JS, Mittal KL, editors. Apparent and microscopic contact angles. Utrecht: VSP; 2000. p. 111–28.
[193] Tuteja A, Choi W, Ma M, Mabry JM, Mazzella SA, Rutledge GC, et al. Designing superoleophobic surfaces. Science2007;318:1618–22.
[194] Tuteja A, Choi W, McKinley GH, Cohen RE, Rubner MF. Design parameters for superhydrophobicity andsuperoleophobicity. Science 2008;318:1618.
[195] van Dijk AIJM, Bruijnzeel LA, Rosewell CJ. Rainfall intensity–kinetic energy relationships: a critical literature appraisal. JHydrol 2002;261:1–23.
[196] Wagner P, Furstner R, Barthlott W, Neinhuis C. Quantitative assessment to the structural basis of water repellency innatural and technical surfaces. J Exp Bot 2003;54:1295–303.
[197] Wang Y, Zhu Q, Zhang H. Fabrication and magnetic properties of hierarchical porous hollow nickel microspheres. J MaterChem 2006;16:1212–4.
[198] Wang S, Liu H, Liu D, Ma X, Fang X, Jiang L. Enthalpy driven three state switching of a superhydrophilic/superhydrphobicsurfaces. Angew Chem Int Ed 2007;46:3915–7.
[199] Wenzel RN. Resistance of solid surfaces to wetting by water. Indust Eng Chem 1936;28:988–94.[200] Wong EW, Sheehan PE, Lieber CM. Nanobeam mechanics: elasticity, strength, and toughness of nanorods and nanotubes.
Science 1997;277:1971–5.[201] Wu X, Zheng L, Wu D. Fabrication of superhydrophobic surfaces from microstructured ZnO-based surfaces via a wet-
chemical route. Langmuir 2005;21:2665–7.[202] Xu L, Chen W, Mulchandani A, Yan Y. Reversible conversion of conducting polymer films from superhydrophobic to
superhydrophilic. Angew Chem Int Ed 2005;44:6009–12.[203] Yabu H, Shimomura M. Single-step fabrication of transparent superhydrophobic porous polymer films. Chem Mater
2005;17:5231–4.[204] Yoshimitsu Z, Nakajima A, Watanabe T, Hashimoto K. Effects of surface structure on the hydrophobicity and sliding
behavior of water droplets. Langmuir 2002;18:5818–22.[205] Yost FG, Michael JR, Eisenmann ET. Extensive wetting due to roughness. Acta Metall Mater 1995;45:299–305.[206] Zhai L, Cebeci FC, Cohen RE, Rubner MF. Stable superhydrophobic coatings from polyelectrolyte multilayers. Nano Lett
2004;4:1349–53.[207] Zhang JL, Li JA, Han YC. Superhydrophobic PTFE surfaces by extension. Macromol Rapid Commun 2004;25:1105–8.[208] Zhang X, Feng S, Yu X, Liu H, Fu Y, Wang Z, et al. Polyelectrolyte multilayer as matrix for electrochemical deposition of
gold clusters: toward super-hydrophobic surface. J Am Chem Soc 2004;126:3064–5.[209] Zhang X, Tan S, Zhao N, Guo X, Zhang X, Zhang Y, et al. Evaporation of sessile water droplets on superhydrophobic natural
lotus and biomimetic polymer surfaces. ChemPhysChem 2006;7:2067–70.[210] Zhang YY, Wang CM, Tan VBC. Examining the effects of wall numbers on buckling behavior and mechanical properties of
multiwalled carbon nanotubes via molecular dynamics simulations. J Appl Phys 2008;103:053505.[211] Zhao N, Xie QD, Weng LH, Wang SQ, Zhang XY, Xu J. Superhydrophobic surface from vapor-induced phase separation of
copolymer micellar solution. Macromolecules 2005;38:8996–9.[212] Zhao Y, Tong T, Delzeit L, Kashani A, Meyyappan M, Majumdar A. Interfacial energy and strength of multiwalled-carbon-
nanotube-based dry adhesive. J Vac Sci Technol B 2006;24:331–5.[213] Zhao Y, Li M, Lu Q, Shi Z. Superhydrophobic polyimide films with a hierarchical topography: combined replica molding
and layer-by-layer assembly. Langmuir 2008;24:12651–7.[214] Zhu L, Xiu Y, Xu J, Tamirisa PA, Hess DW, Wong C. Superhydrophobicity on two-tier rough surfaces fabricated by
controlled growth of aligned carbon nanotube arrays coated with fluorocarbon. Langmuir 2005;21:11208–12.