progress in electrolysis experiments at …lenr-canr.org/acrobat/dardikiprogressin.pdf ·...
TRANSCRIPT

I. Dardik, T. Zilov, H. Branover, A. El-Boher, E. Greenspan, B. Khachaturov,V. Krakov, S. Lesin and M. Tsirlin
Energetics TechnologiesP.O. Box 3026
Omer Industrial ParkOmer, Israel
E-mail: [email protected]
Presented at the12th International Conference on Condensed Matter Nuclear Science
November 27 – December 2,2005Yokohama, Japan
PROGRESS IN ELECTROLYSIS EXPERIMENTSAT ENERGETICS TECHNOLOGIES

ABSTRACT
• In the last year we have succeeded obtaining significant Excess Heat (≥100%) with seven
different Pd foils, using Electrolytic cells, excited by Dardik’s Super Wave©.
• Several of the successful foils were provided by Dr. Vittorio Violante of ENEA Frascatti.
• Significant Excess Heat: The output power exceeded the input power (COP) by at least 100%.
Maximum COP obtained is 600%, it lasted for 24.5 hours. The longest period of Excess
Heat obtained was 134 hours at COP of 150%.
• A new type of experiments was initiated. Electrolytic loaded Pd cathode is exposed to Ultra
Sonic waves (US), inducing cavitations in the vicinity of the cathode.
• It was found, that when the US induced cavitation is super-imposed on electrolytic loading of
Pd cathode, excited by Dardik’s Super Wave©, the load factor (D/Pd) is significantly higher.
• In 4 out of 6 experiments with electrolytic cells exposed to US, strong Excess Thermal effect
was observed.
• Electron-microscopy analysis has shown that the ultrasonic wave resulted in formation of
local structures of so-called “negative crystals”. Selected targets are being analyzed using also
TOF SIMS and dynamic SIMS.
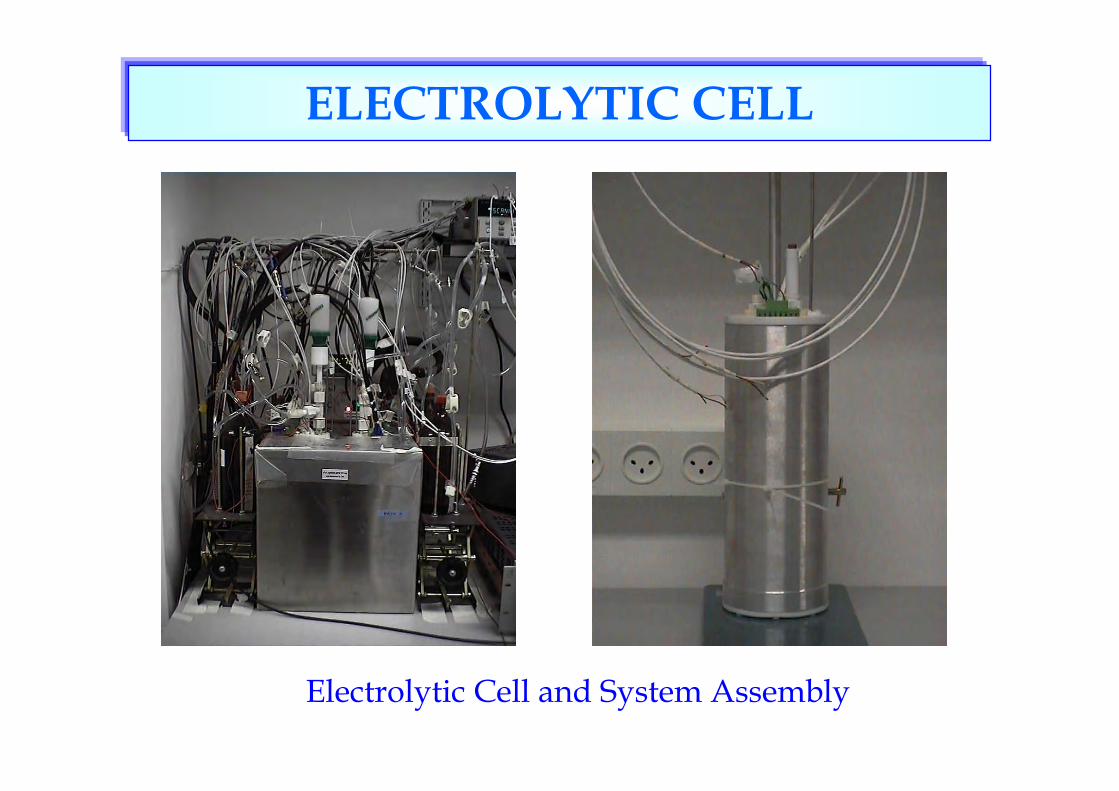
ELECTROLYTIC CELL
Electrolytic Cell and System Assembly

Target Description:Pd foil 50 µm, prepared by Dr. Vittorio Violante
(ENEA Frascatti, Italy) or home-made
Annealed at 8700C in vacuum during 1h
Etched:
1) in Nitric Acid 65-67% 1 min
2) in Aqua Regia 1:1 water solution 1 min
Rinsed:
1) D2O four times
2) Ethanol 95% twice
3) Ethanol Absolute once
Dried:
in vacuum at amb. temperature 24 h
Electrolyte:0.1M LiOD in D2O Low Tritium Content 230 ml
80m
m
7 mm
ELECTROLYTIC CELL
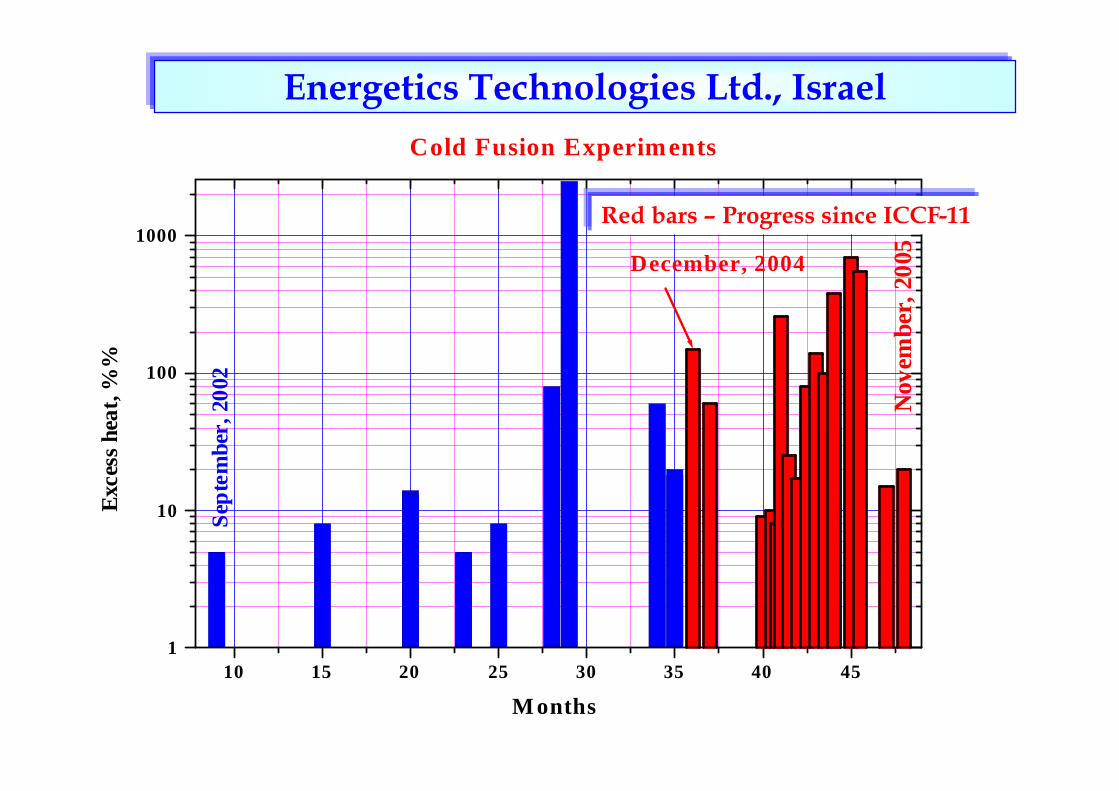
Energetics Technologies Ltd., Israel
10 15 20 25 30 35 40 451
10
100
1000
Nov
embe
r,20
05
Cold Fusion Experiments
Sept
embe
r,20
02
December, 2004
Exc
ess
heat
,%%
M onths
Red bars – Progress since ICCF-11

Excess Heat; Exp. # 64a
Pout=KΔT
Pinet=Iin*Vin – P dis
Excess Power of up to 34 watts; Average ~20 watts for 17 h
17 h
Average Pinet ~0.74 watts
Average Pout ~20 watts
COPE=(Pout-Pinet):Pin ≈(20-0.74):0.77 ≈25

Excess Heat; Exp. # 135
134 h
COPE peak=160%
COPE avg=47%
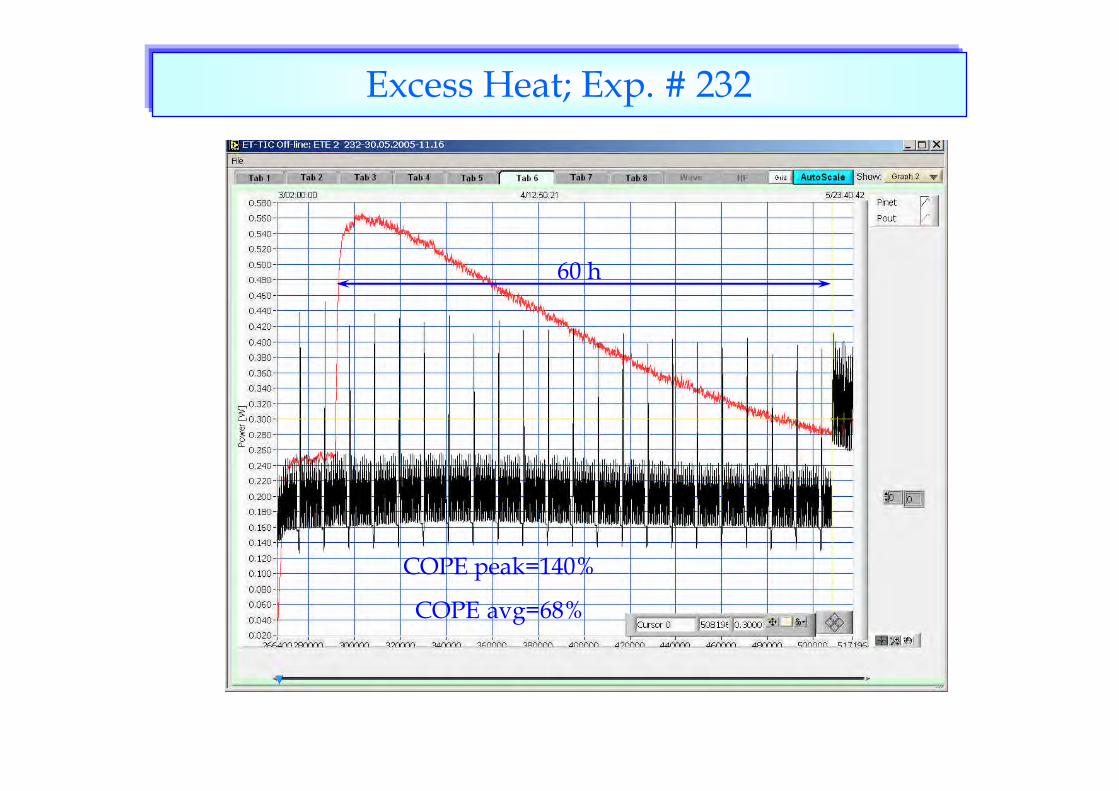
Excess Heat; Exp. # 232
60 h
COPE peak=140%
COPE avg=68%

Excess Heat; Exp. # 241
47 h
COPE peak=120%
COPE avg=52%

Excess Heat; Exp. # 264
47 h
COPE peak=350%
COPE avg=150%

Simultaneous Excess Heat generation in two different experiments
Excess Heat; Exp. # 278&279
ETE-278
ETE-279
24 h 17 min
20 h 04 min
Start up13.08.2005
00:37:52
Start up13.08.2005
01:05:57
Termination of Excess Heat14.08.2005
00:55:10
Termination of Excess Heat13.08.2005
21:10:10
COPE peak=600%
COPE avg=325%
COPE peak=550%
COPE avg=290%

Excess Energy; Exp. # 279
Ex=Eout-Einet
Einet
Eout

50-55mm
2.5-3.0 mm
Ultra Sound – Electrolytic Cell
Target Description:Pd foil 30-35 µm, prepared by rolling of 0.5 mm Pd wire
Annealed at 8700C in vacuum during 1h
Etched:
1) in Nitric Acid 65-67% 1 min
2) in Aqua Regia 1:1 water solution 1 min
Rinsed:
1) D2O four times
2) Ethanol 95% twice
3) Ethanol Absolute once
Dried:
in vacuum at amb. temperature 24 h
Electrolyte:0.3M LiOD in D2O Low Tritium Content 35 ml

Ultra Sound – Electrolytic Cell Schematic View

Ultra Sound – Electrolytic Cell
Quartz Beaker
Axial Centered Cathode
Teflon Support
Helical Pt anode

Ultra Sound – Electrolytic Cell Setup
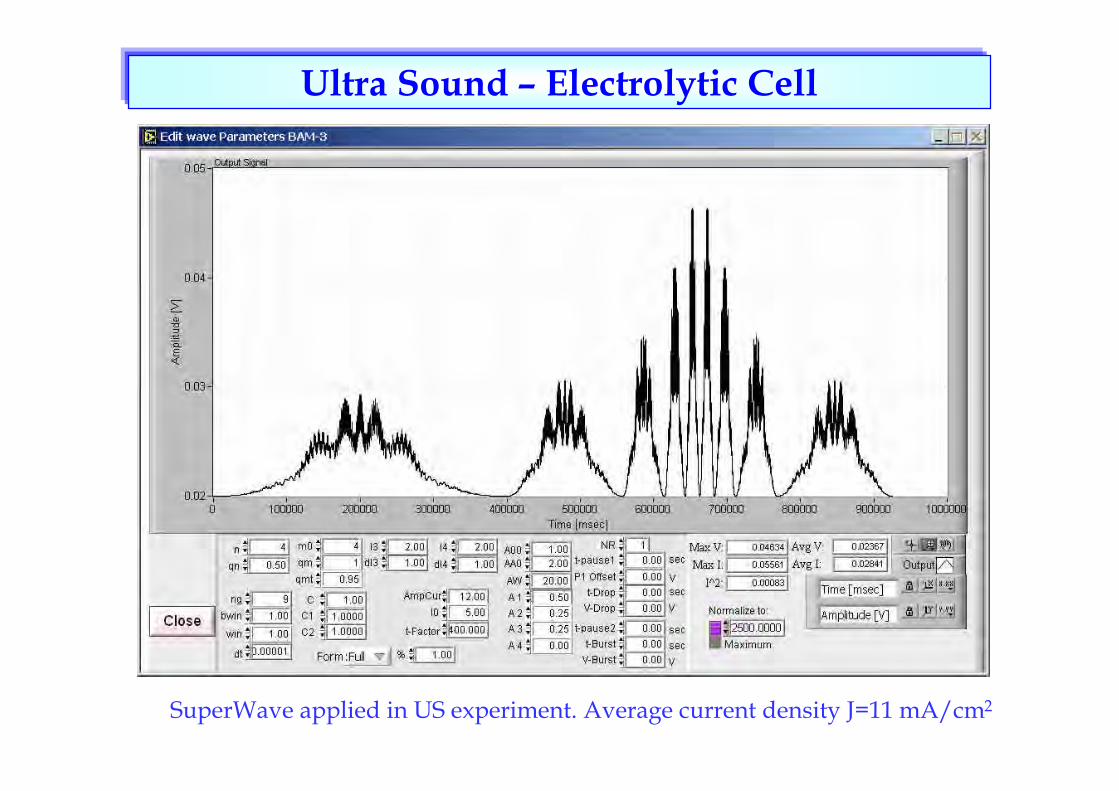
SuperWave applied in US experiment. Average current density J=11 mA/cm2
Ultra Sound – Electrolytic Cell

Relatively high loading achieved with low (11 mA/cm2) current density
Ultra Sound – Electrolytic Cell
R/R0=1.5277 (D/Pd≈0.95)
Turn on of US (~86000 sec)
145 h
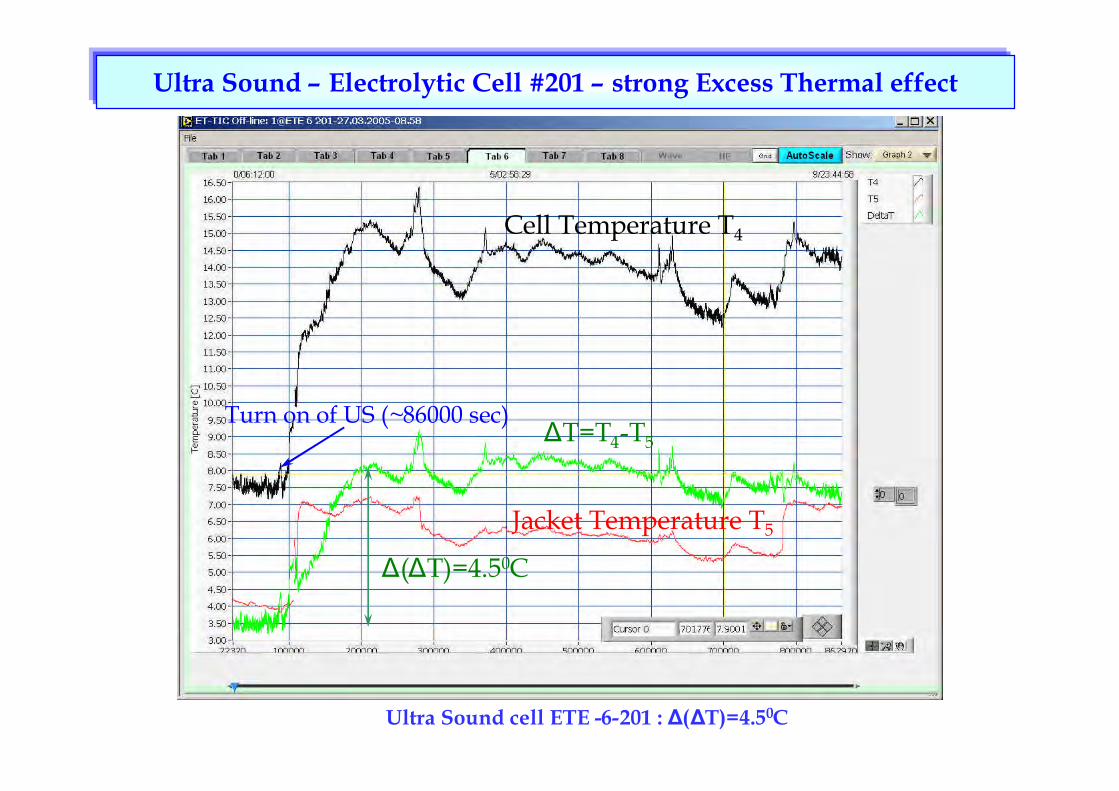
Ultra Sound – Electrolytic Cell #201 – strong Excess Thermal effect
Δ(ΔT)=4.50C
ΔT=T4-T5
Cell Temperature T4
Jacket Temperature T5
Turn on of US (~86000 sec)
Ultra Sound cell ETE -6-201 : Δ(ΔT)=4.50C

US offUS on
US 20%US full power
Tcell
Tjacket
ΔT=Tcell-TJacket
Tambient
Estimation of US influence on temperature in the cell & jacket
Ultra Sound – Electrolytic Cell Calibration with reference cell Pt - Pt

>0.95--5 weeks10.07.052606
>0.9025-500.54 weeks08.06.052445
>0.9575-801.55 weeks02.05.052254
>0.95250-3004.54 weeks22.03.052013
Poorloading
~0.7--8 days26.01.051552
>0.9575-801.57 weeks23.09.04921
Remarks
Loading,D/Pdratio
EstimatedExcess Heat,%
TemperatureGain,0C
Duration ofexperiment
StartingDate
Experiment№
Order№
Ultra Sound – Electrolytic Cell
Summery of experimental results
Reproducibility 66%: 4 of 6 experiments
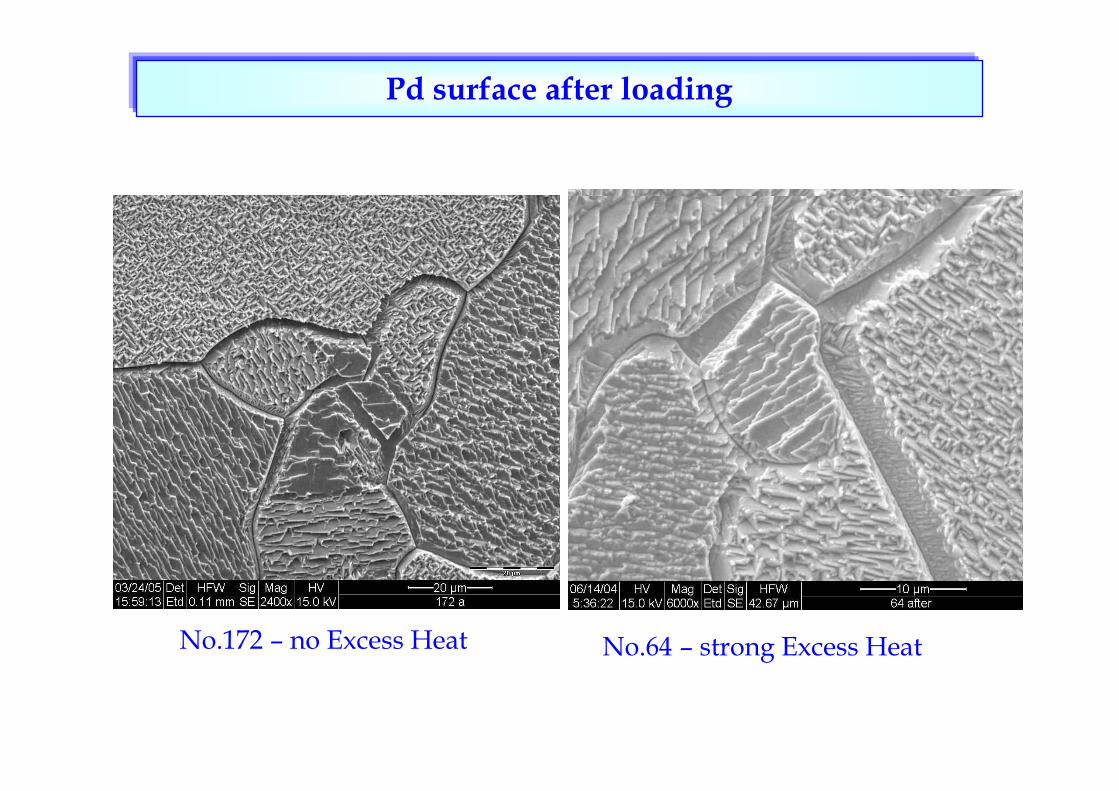
Pd surface after loading
No.64 – strong Excess HeatNo.172 – no Excess Heat
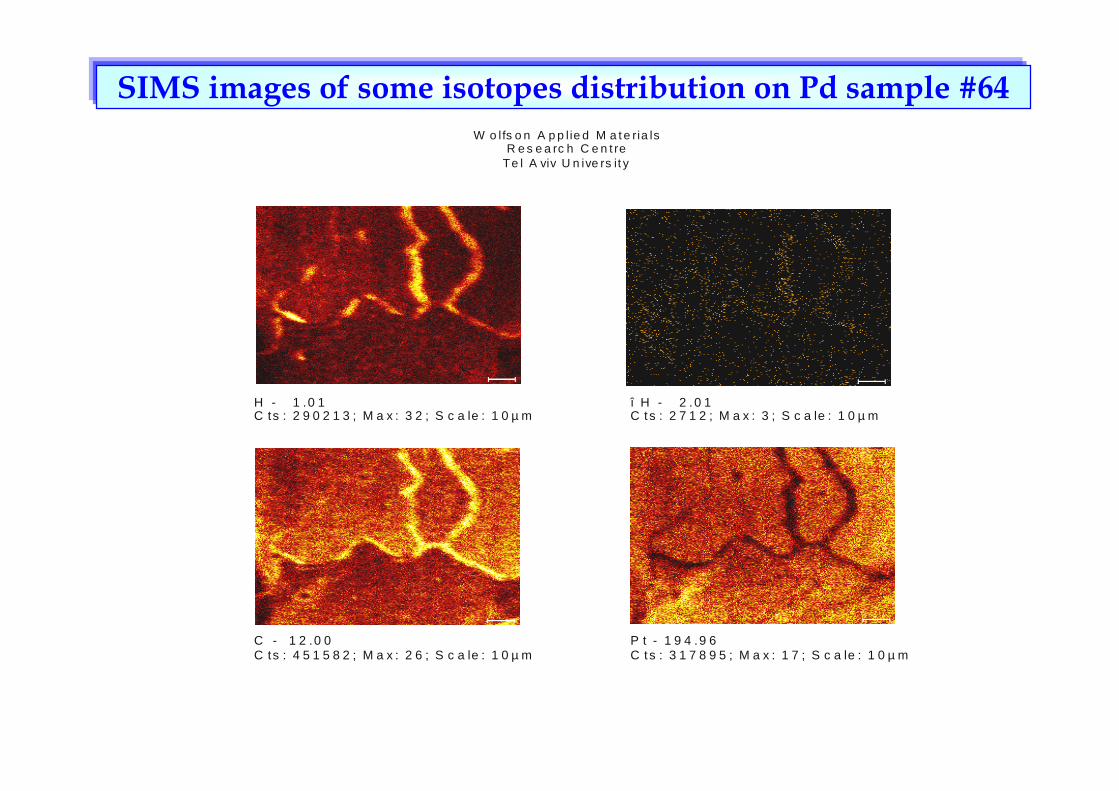
W o lfs o n A p p l ie d M a t e ria lsR e s e a rc h C e n t re
Te l A viv U n ive rs it y
C ts : 2 9 0 2 1 3 ; M a x : 3 2 ; S c a le : 1 0 µ mH - 1 .0 1
C ts : 2 7 1 2 ; M a x : 3 ; S c a le : 1 0 µ mî H - 2 .0 1
C ts : 4 5 1 5 8 2 ; M a x : 2 6 ; S c a le : 1 0 µ mC - 1 2 .0 0
C ts : 3 1 7 8 9 5 ; M a x : 1 7 ; S c a le : 1 0 µ mP t - 1 9 4 .9 6
SIMS images of some isotopes distribution on Pd sample #64

Pd foil No. 201 after Electrolytic-US loading
Cavitation tracks (half-octahedral shape negative crystal) oncathode surface after strong Excess Heat generation

Sample #64, Pd globes on Pt leadsafter strong Excess Heat generation
Pd globes

Sample #64, Pd-based globes on “Black Spots”after strong Excess Heat generation
Pd-based globes

Samples #232 & 278, Pd-based global & dendritic crystalson “Black Spots” after strong Excess Heat generation
140% of Excess Power 600-700% of Excess Power
Pd-based crystals

4He content in Pd after electrolysis resulted in strong Excess heatgeneration (264) and virgin Pd as reference (254)
He
0.E+00
1.E-05
2.E-05
3.E-05
4.E-05
5.E-05
6.E-05
0 0.5 1 1.5 2 2.5 3
Approx. Depth (microns)
CsH
e+ /CsP
d+
CsHe/CsPd 264 CsHe/CsPd 254 (ref.)

CONCLUSIONS
• In the last year we improved our Electrolytic cells reproducibility rate. Weachieved significant Excess Heat (>100%) with seven different Pd foils whichwere excited by Dardik’s SuperWave©.
• A new type of experiments was initiated – electrolytic loading of Pd, exposed toUltra Sonic (US) waves.
• US waves are inducing cavitations in the vicinity of the Pd cathode whereas Pdcathode is electrolytic excited by Dardik’s SuperWave©.
• Using a combination of US and Dardik’s SuperWaves© gives:
a) A significantly higher load factor values
b) Formation of local structures of so called “negative crystals” (shown byelectron microscopy analysis)
c) A reproducibility rate improvement (66%)
• The achieved promissing qualitative experimental results require accuratecalorimetry which is underway.

CONCLUSIONS (continuation)
• Analysis of Pd samples after generation of Excess Heat show the presence of Pdcrystals and globs in the vicinity of “black spots”(active sites), which may becaused by local thermal bursts of high power density, resulted in an impressiveintensification of Pd mass-transfer.
• We have not found out any products of nuclear transformation in the sampleswhich gave Excess Heat effect.
• In order to achieve higher reproducibility rates the following has to be done:
a) Futher optimization of the SuperWaves© in combination with US
b) Thorough investigation of the controlling parameters of the Pd cathodes inorder to achieve large amount of active sites.

ACKNOWLEDGMENT
We wish to thank Dr. Vittorio Violante and his groupfrom ENEA FRASCATTI for their cooperation in
preparation of the Pd cathodes.