programs of the fish conservation and culture...
TRANSCRIPT

8/4/2014
1
Programs of the Fish Conservation and Culture Laboratory
Joan Lindberg1, Tien-Chieh Hung1, Meredith Nagel1,2
1 Fish Conservation and Culture Laboratory, UC Davis2 Aquatic Health Program, UC Davis
Delta Smelt (Hypomesus transpacificus)
• Endemic to Bay‐Delta
• Endangered species status
• Annual life‐span
• Spawning season February – June
• Asynchronous batch‐spawner (multiple clutches)

8/4/2014
2
Main Programs of FCCL
• Delta Smelt Refuge Program– Develop and implement genetic breeding and rearing program
• Research Program and Collaborative studies– Reproductive biology, behavior studies, growth and development
studies
• Aquaculture Program– Produce Delta Smelt and Longfin Smelt for on‐site and off‐site research
Selected studies
• Spawn responses to naturalistic substrates and water velocities
• Effects of light and turbidity on feeding, growth, and survival of larval Delta Smelt
• Effects of temperature and salinity on the choices of Delta Smelt
• Effects of food‐limitation on the life‐stages of Delta Smelt

8/4/2014
3
Spawn Responses to Naturalistic Substrates and Water Velocities
Joan Lindberg1, Brittany Kammerer1,2, Bradd Baskerville-Bridges1
1 Fish Conservation and Culture Laboratory, UC Davis2 Aquatic Health Program, UC Davis
Experimental Spawning Tanks
Two zones of velocity, over two years, 100 fish/tank

8/4/2014
4
0
2
4
6
8
10
12
ET B T AT P W
Ln
(to
tal e
gg
s)
Substrate
1.4 cm/sec
8.8 cm/sec
4a 23b
A
4b
23b23b
23a3a
3a
12a
3a 3a
1a
0
2
4
6
8
10
12
ET C T S P W
Ln
(to
tal
egg
s)
Substrate
8.7 cm/sec
15.8 cm/sec
3b
23a
B
3a
2a12a
12a12a
1a1a
3b
12a 12a
Substrate types:
Empty trays (ET)Bare tank floor (B)Tule plant stalks (T)Artificial tules (AT)Pebble (P)Dead wood (W)Cobble (C)Sand (S)
Deposition of Eggs
• Most of the eggs were found on the substrates (58.5±14.6%) as opposed to the trays (4.5±4.1%).
• More eggs were deposited on the pebble and sand.
• Delta Smelt choose to spawn on substrates in the high flow velocity, each year.
Results Summary
8/4/2014
5
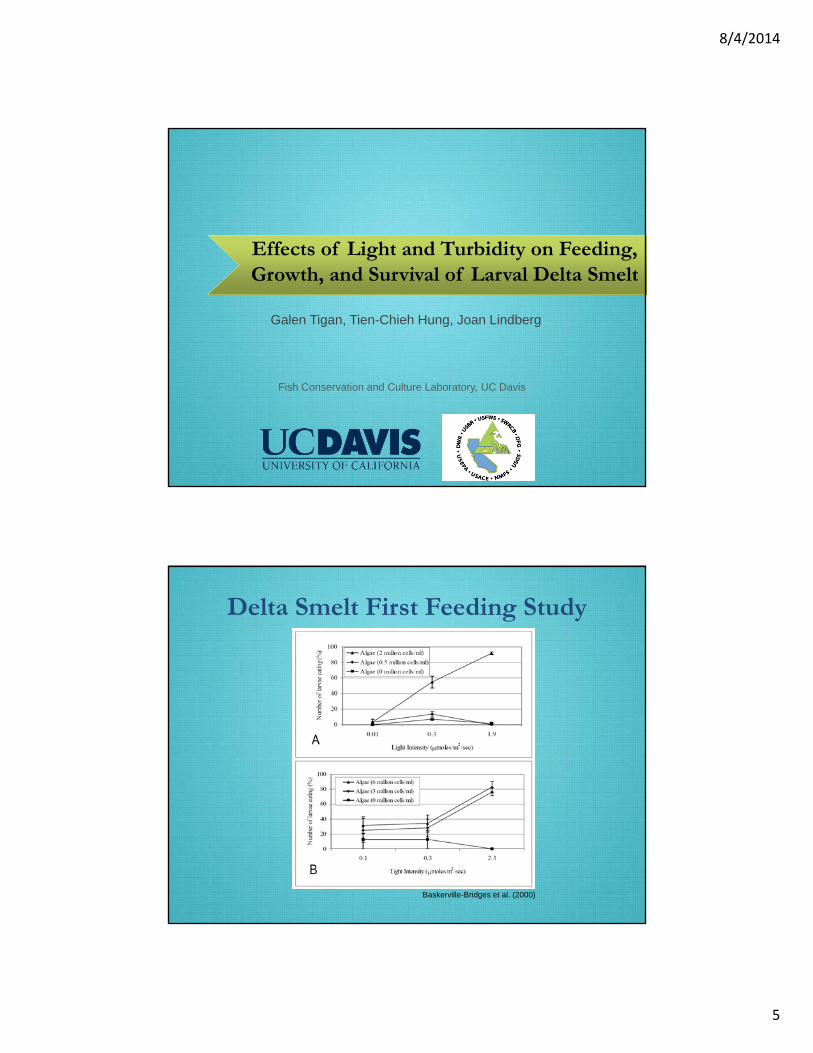
Effects of Light and Turbidity on Feeding, Growth, and Survival of Larval Delta Smelt
Galen Tigan, Tien-Chieh Hung, Joan Lindberg
Fish Conservation and Culture Laboratory, UC Davis
Baskerville-Bridges et al. (2000)
Delta Smelt First Feeding Study

8/4/2014
6
• Three levels of turbidity (2.0, 5.5, and 9.0 NTU) and light intensity (2.0, 6.75, and 9.0 µmole/m2/sec).
• Sampled on Day 10, 20, 30, and 40.
40-day Rearing Study
Survival (%) Growth rate (mm/day)
Survival and Growth
0.00
0.05
0.10
0.15
0.20
0.25
0.30
0.35
10 20 30 40
Growth rate (mm/day)
DPH
2.0µmol/9.0NTU(2)
9.0µmol/9.0NTU(2)
9.0µmol/9.0NTU(1)
6.75µmol/5.5NTU(2)
4.5µmol/2.0NTU(1)
9.0µmol/2.0NTU(1)

8/4/2014
7
Feeding Preference
0.00
0.05
0.10
0.15
0.20
0.25
0.30
0.35
0
10
20
30
40
50
60
Average growth (mm/day)
Number of larvae
10 DPH
9.0 µmole9.0 NTU(1)
9.0 µmole9.0 NTU(2)
6.75 µmole5.5 NTU(2)
9.0 µmole2.0 NTU(1)
2.0 µmole9.0 NTU(2)
4.5 µmole2.0 NTU(1)
0.00
0.05
0.10
0.15
0.20
0.25
0.30
0.35
0
10
20
30
40
50
60
Average growth (mm/day)
Number of larvae
20 DPH
9.0 µmole9.0 NTU(1)
9.0 µmole9.0 NTU(2)
6.75 µmole5.5 NTU(2)
9.0 µmole2.0 NTU(1)
2.0 µmole9.0 NTU(2)
4.5 µmole2.0 NTU(1)
0.00
0.05
0.10
0.15
0.20
0.25
0.30
0.35
0
10
20
30
40
50
60
Average growth (mm/day)
Number of larvae
30 DPH
9.0 µmole9.0 NTU(1)
9.0 µmole9.0 NTU(2)
6.75 µmole5.5 NTU(2)
9.0 µmole2.0 NTU(1)
2.0 µmole9.0 NTU(2)
4.5 µmole2.0 NTU(1)
0.00
0.05
0.10
0.15
0.20
0.25
0.30
0.35
0
10
20
30
40
50
60
Average growth (mm/day)
Number of larvae
40 DPH
9.0 µmole9.0 NTU(1)
9.0 µmole9.0 NTU(2)
6.75 µmole5.5 NTU(2)
9.0 µmole2.0 NTU(1)
2.0 µmole9.0 NTU(2)
4.5 µmole2.0 NTU(1)
• The presence of turbidity and light triggered feeding in Delta Smelt larvae.
• The survival and growth rate are higher for Delta Smelt larvae in the rearing trial with high turbidity conditions.
• The co‐feeding period is shorter for Delta Smelt larvae reared under low turbidity conditions.
• Future work: different life stages and species (Longfin Smelt)
Results Summary

8/4/2014
8
Effects of Temperature and Salinity on the Choices of Adult Delta Smelt
Tien-Chieh Hung1,*, Swee Teh2, Saikrithika Gandhi2, Joan Lindberg1
1 Fish Conservation and Culture Laboratory, UC Davis2 Aquatic Health Program, UC Davis
Shuttlebox System

8/4/2014
9
Acclimated to 14ºC Acclimated to 17ºC
Fish Choice at Several Temps5 and 3 trials/ treatment
23ºC 25ºC
Fish Choice at Several Salinity
8/4/2014
10
• Temperature trials– 23ºC for fish acclimated to 14ºC
– 25ºC for fish acclimated to 17ºC
• Salinity trials– No significant movement to a specific salinity
– Avoiding high salinity, as the salinity increased
• Future work– Other stimuli: turbidity, toxicity, other
Results Summary
Investigating the Effects of Food-Limitation on the Life-Stages of Delta Smelt
Meredith Nagel1,2, Joan Lindberg1, Swee Teh2
1 Fish Conservation and Culture Laboratory, UC Davis2 Aquatic Health Program, UC Davis

8/4/2014
11
Food web interactions: bottom‐up conceptual model of the Pelagic Organism Decline
Declining Fish Abundances in the Delta
Declining Fish Populations
• Invasive species• Drought
• Reduced food availabilityfor pelagic fish
• Changes in zooplankton abundance and community composition
Adult Population
• Reproductive development
• Seasonal fecundity
• Overall fish health
Subsequent Generation
• Egg and larval quality
• Larval development and survival
• Maternal provisioning
Quantifying the Effects of Food-Limitation

8/4/2014
12
• Potential low food availability in fall, coupled with warmer temperatures
• Less is known about winter food‐limitation
Mar
Winter Food-Limitation ?
Experimental Design
• Three replicates, control and food‐limited (n=3)
• 250 fish per tank
• Each fish is uniquely tagged
Photos by Marade Sandford
Adult Delta Smelt Winter Food-Limitation Study

8/4/2014
13
• 10 ‐12 fish dissected for biomarker assays
• 40 fish measured for weight and length every 2 weeks
• Constant temperature at 12°C
Dec Jan Feb March April May June
8 week food‐limitation period
Collect fecundity, histology, and biomarker data
12° C
10° C
Experimental Design
Control tanks fed 2% of body weight per day
Food‐limited tanks fed 2% of body weight 4 days/week (40% reduced ration)
C1 FL1 C2 C3 FL2 FL3
Experimental Design: Food-limitation

8/4/2014
14
– Eggs expressed
– Measured for weight, length, and ova weight
– Females returned to tank
– Estimate the number of eggs
C1 FL1 C2 C3 FL2 FL3
Experimental Design: Fecundity Indices
• RNA/DNA – short term energy storage
• Triglycerides (TAG) – long term energy storage
• Histopathology
• Estradiol – maturation
• Fatty‐Acid analysis
• Disease
Nutritional and General Health Biomarkers

8/4/2014
15
020406080
100
1.0 1.5 2.0 2.5 3.0 3.5 4.0 4.5 5.0
Nu
mbe
r o
f fi
sh
Weight (g)
Frequency Distribution Control Groups in March
020406080
100
1.0 1.5 2.0 2.5 3.0 3.5 4.0 4.5 5.0
Nu
mbe
r o
f fi
sh
Weight (g)
Frequency Distribution Food-Limited Groups in March
Results:
0
50
100
150
45 50 55 60 65 70 75 80 85 90 95
Nu
mbe
r o
f F
ish
Length (mm)
Frequency Distribution of Length in Control Groups
0
50
100
150
45 50 55 60 65 70 75 80 85 90 95
Nu
mbe
r o
f F
ish
Length (mm)
Frequecy Distribution of Length in Food-Limited Groups
8/4/2014
16
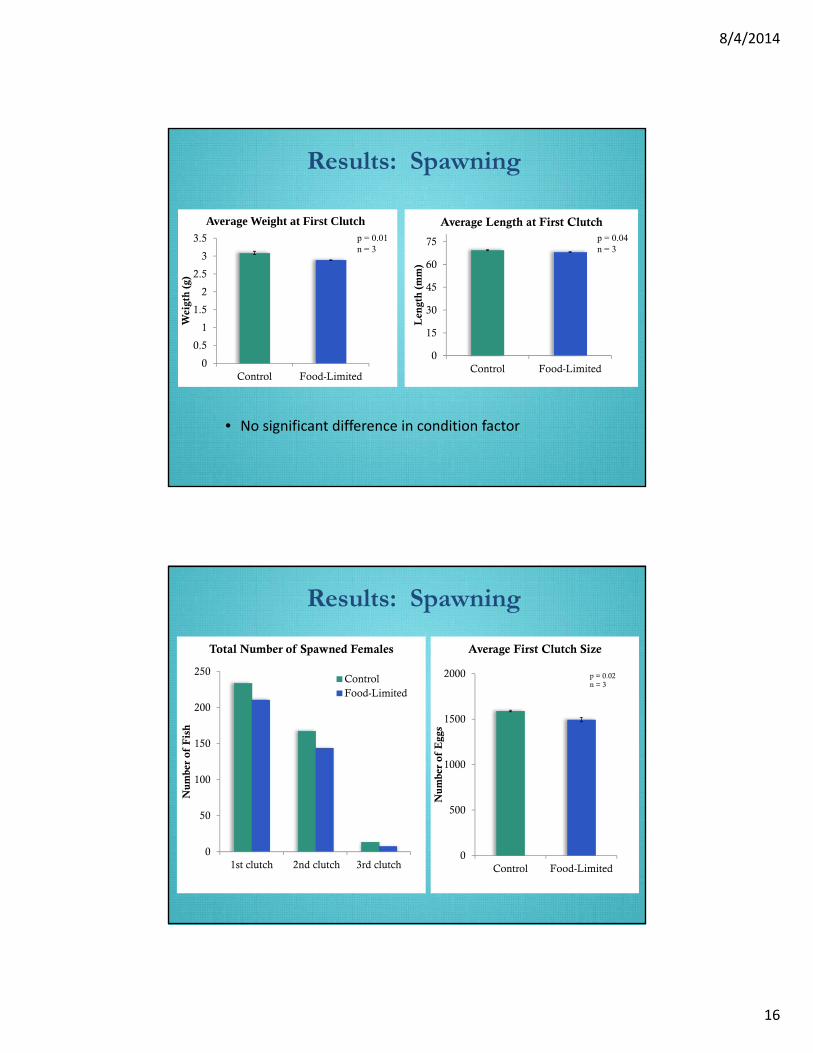
• No significant difference in condition factor
Results: Spawning
0
0.5
1
1.5
2
2.5
3
3.5
Control Food-Limited
Wei
gth
(g)
Average Weight at First Clutchp = 0.01n = 3
0
15
30
45
60
75
Control Food-Limited
Len
gth
(m
m)
Average Length at First Clutchp = 0.04n = 3
Results: Spawning
0
50
100
150
200
250
1st clutch 2nd clutch 3rd clutch
Nu
mbe
r o
f F
ish
Total Number of Spawned Females
ControlFood-Limited
0
500
1000
1500
2000
Control Food-Limited
Nu
mbe
r o
f E
ggs
Average First Clutch Size
p = 0.02n = 3

8/4/2014
17
0
50000
100000
150000
200000
250000
300000
350000
400000
1st Clutch 2nd Clutch 3rd Clutch
Nu
mbe
r o
f E
ggs
Total Number of Eggs per Clutch
Control
Food-Limited
Total difference of 114,440 eggs spawned
Results: Fecundity
• Omega‐3’s important in growth, neural development, and immune system functions
• Omega‐3/Omega‐6 ratios may have pivotal role in egg and larval quality
2013 Pilot Study: Fatty Acid Analysis
0
5
10
15
20
25
30
35
Σn-6 Σn-3
Per
cen
t C
om
posi
tio
n
Percent Composition of Omega-3 (n-3) and Omega-6 (n-6) Fatty
Acids in EggsControlFood-Limited
0
0.5
1
1.5
2
2.5
3
3.5
n-3/n-6
Per
cen
t C
om
posi
tio
n
Ratio of Omega-3 (n-3) to Omega-6 (n-6) in Eggs
Control
Food-Limited

8/4/2014
18
Results: Spawning and Clutch Interval
0
5
10
15
20
25
30
35
1/30/14 2/20/14 3/13/14 4/3/14 4/24/14 5/15/14
Nu
mbe
r o
f R
ipe
Fem
ales
Spawn Date
Number of Ripe Females for Control and Food-Limited Groups
Control Clutch 1Food-Limited Clutch 1Control Clutch 2Food-Limited Clutch 2
• Smaller individuals leads to fewer offspring
• Adult food‐limitation may affects larval survival by:
– Egg and larval quantity and quality
• Impacting population abundances in subsequent year
Photo by Marade Sandford
Potential Implications for Delta Smelt

8/4/2014
19
• How does food‐limitation impact other life‐stages of the delta smelt?
Juveniles ?
?
Moving Forward…. New Questions!
• The number of fish surviving to maturity to enter the
adult population
Density‐Independent Density‐Dependent
• Temperature
• Food conditions
• Competition
• Predation
What is Recruitment?

8/4/2014
20
• Changes in fish populations are primarily driven by variability in recruitment
• Eggs and larvae suffer the greatest losses – most considered natural mortality
Population Dynamics
Zooplankton Larval SurvivalJuvenile Recruits Adult Population
Smaller adults, fewer individuals spawning, fewer eggs
AdultsEggs and LarvaeLower quality, reduced survival
JuvenileHigher mortality, smaller fish, decreased recruitment
Food-Limitation and Population Dynamics

8/4/2014
21
Juvenile food‐limitation: Impacts on recruitment and population dynamics?
• Small alterations to juvenile growth and survival can have massive repercussions on recruitment and the adult population
Objectives:Evaluate food‐limitation on the old and young cohort of a season in terms of:
1.) Growth2.) Survival3.) Subsequent impacts on adult fecundity4.) Temperature

8/4/2014
22
Extra slides
0
10
20
30
40
50
60
70
80
90
1.0 1.5 2.0 2.5 3.0 3.5 4.0 4.5 5.0
Nu
mbe
r o
f fi
sh
Weight (g)
Frequency Distribution in March
Extra slides