production and characterization of trichoderma metabolites ...asianpgpr.com/4thasianpgpr-ppt/dr...
TRANSCRIPT

Production and characterization of Trichoderma metabolites: A new approach for
selective bioremediation
Dr. Anita S. Patil Professor
Lab no 106, Microbial Biotechnology & Phytosecondary metabolite Lab
Department of Biotechnology Sant Gadge Baba Amravati University,
Amravati (M.S) 444 602

Trichoderma: A biocontrol agent • Trichoderma spp. are filamentous fungi found in soil and now-a-days
are marketed as bio-pesticides, bio-fertilizers and soil amendments. • They protect plants, enhance growth and control plant pathogenic
microbial population. • Agriculture relevant microorganisms produce secondary metabolites
during the process of competition with other microbes, via symbiosis, parasitism or pathogenesis.

Trichodermal metabolites:
• Trichoderma secondary metabolites are heterogeneous group of small molecules, not directly essential for growth, but having role in signalling, development and interaction with other organism
• Such metabolites may directly inhibit the growth of pathogens or indirectly triggers the defence system in host plant (disease resistance) and by promoting plant growth (Fe3+ chelating makes soluble iron for plant and depriving to pathogenic microbes).
• Accumulation of metabolites varies according to species/strain and related to biosynthesis and biotransformation rates (Vinale et al., 2009a).

Aflatoxin contamination of ground nut • Infection of (Arachis hypogea L.) groundnut kernels by A. flavus
and A. parasiticus seriously effects quality of food and feed. • It has tremendous impact on global groundnut industry, on
consumers and poses health risk to human and cattle. • Aflatoxins, a group of secondary metabolites produced by
Aspergillus group of fungi are hepatotoxins, immunosuppressant and carcinogens.
• Responsible for liver damage, liver cirrhosis, tumor induction
and growth retardation. A. flavus : B1 and B2 & A. parasiticus : B1, B2, G1, G2
• Polyketide –derived furanocoumarins • AF B1, AFB2, AFG1 and AFG2- Major four toxins among 18 structurally related toxins • Letters B and G refers to the fluorescent colors observed under UV light

Control of aflatoxin contamination
• No single method of control has been found effective • Use of fungal antagonistic as a biocontrol agent provide promising
way to control infection of Aspergillus and aflatoxin contamination in valuable crops.

Why use biological control?
WILL: • Chemical pesticides
– Implicated in ecological, environmental and human health problems – Require yearly treatments – Broad spectrum – Toxic to both beneficial and pathogenic species
BUT: • Biological control agents
– Non-toxic to human – Not a concern with water contaminant – Once colonized may last for years – Host specific – Only effect one or few species
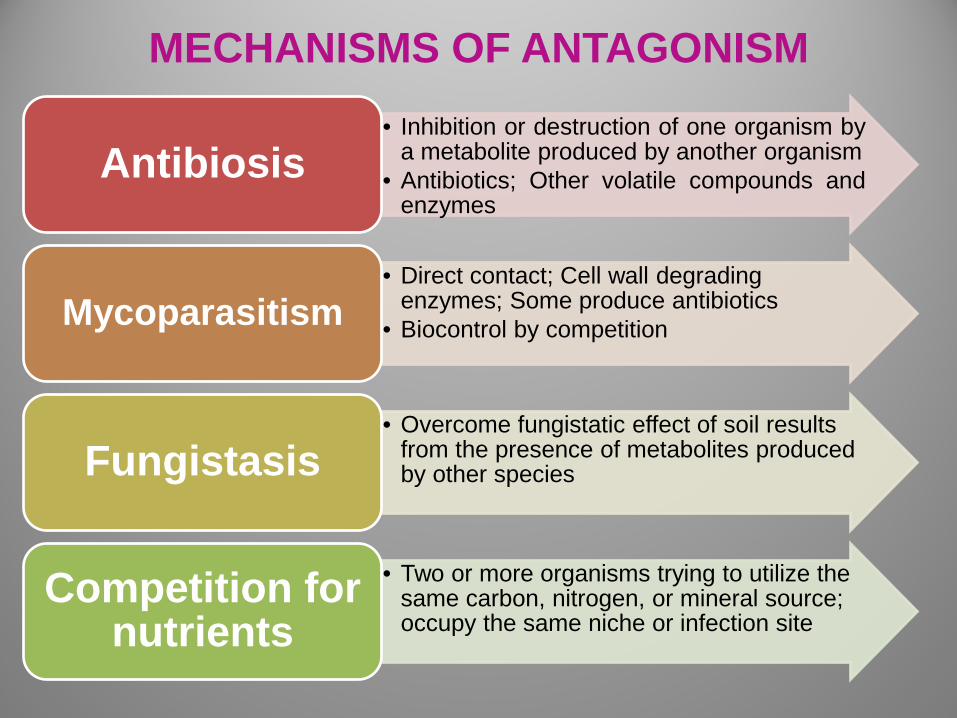
MECHANISMS OF ANTAGONISM
• Inhibition or destruction of one organism by a metabolite produced by another organism
• Antibiotics; Other volatile compounds and enzymes
Antibiosis
• Direct contact; Cell wall degrading enzymes; Some produce antibiotics
• Biocontrol by competition Mycoparasitism
• Overcome fungistatic effect of soil results from the presence of metabolites produced by other species Fungistasis
• Two or more organisms trying to utilize the same carbon, nitrogen, or mineral source; occupy the same niche or infection site
Competition for nutrients

Important fungal metabolites produced by Trichoderma
• Anthraquinones; Daucanes; simple pyrones; Koinginins; Trichodermamides; Viridins; Viridiofungins; Nitrogen heterocyclic compounds; Trichodenones and cyclopentenone derivatives;
• Azaphilones; Harzialactones and derivatives, Butenolides; Trichothecenes; Isocyano metabolites;
• Setin like metabolites; Bisorbicillinoids; Diketopiperazines;
Ergosterol derivatives; Peptaibols; Cyclonerodiol derivatives; Statins;
• Heptelidic acid and derivatives; Acoranes and Miscelanea etc

Advantages of use of antifungal metabolites
• The direct use of antimicrobial compounds produced by fungal BCAs, instead of the whole ‘‘live’’ organism more advantageous in industrial and agricultural applications.
• More compliant to public opinion because these biological products do
not reproduce and spread. • Selective production of active compounds can be optimized by
modifying the growth conditions, i.e. utilizing different culture techniques, substrates, temperature, speed of agitation and pH, etc.
• Production of specific secondary metabolites can be induced against
specific target.

Objectives of study
To screen the antagonistic potential of T. harzianum against aflatoxin producing A. flavus and A. parasiticus in variable culture techniques.
Screening the biocontrol potential of T. harzianum in terms of bioremediation of aflatoxins in co-culture and field trial experiments.
Optimization of fermentation for the production of specific secondary metabolites by T. harzianum having aflatoxigenic bio-remedial ability.
Screening the antifungal ability using TLC bioautography method.

Methods and Materials
Pathogenic Aspergillus species were isolated from infected soil associated with roots of A. hypogea L. (groundnut)
plants by serial dilution method.
Aspergilli screened for their ability to produce aflatoxins based on the detection of UV-induced fluorescence and specific
orange-yellow pigmentation on coconut agar medium (Davis et al., 1987).
Trichoderma species were isolated from the agriculture field where the pathogen (s) is known to exist but the disease
occurrence is low.
Confirmations of species-level identification of Trichoderma and Aspergillus with the support of IARI, New Delhi (India).

A B
C
Fig 1 : Plate culture and microscopic view of A) A. flavus and B ) A. parasiticus and C) T. harzianum

Fungus Microscopic features
Aspergillus species Color of conidial head
Vesicle serration
Conidial head Conidia
A. flavus Yellow when young, becoming dark yellow-green in age
Uniseriate Radiate, splitting into poorly defined column
Globose to subglobose
A. parasiticus Parrot green to dull yellow green
Uniseriate Globose Globose to subglobose
Fungus Growth rate, colony color
Colony mycelia
Colony reverse
Conidiophore branching
Conidiation/conidial color
Conidia shape
Exudates/ Pigmentation
T. harzianum
9.5cm in 4 days, whitish green-bright green
Floccose compact whitish
Colorless to drab color
Much branched, form loose tufts which arise in ring like zone
Moderate, compact, yellow- pale green
Smooth, subglobose
Colorless to pale amber, yellowish in some species
Table 1 : Keys to identify the pathogen and biocontrol agent

B2 B
A A2
Figure 2 . Screening of aflatoxin production on the basis of orange-yellow pigmentation on Aspergillus differentiation media
(A) A. flavus, (A2) reverse side of plate (B) A. parasiticus, (B2) reverse side of plate

Extraction of aflatoxins (AOAC, 2002)
From cell free broth
Grow in Richard broth 9 days
Broth extracted thrice in chloroform
Evaporate and again dissolved in 0.5ml chloroform
TLC spotting (solvent system i.e Chloroform : acetone 9: 1 or Toulene:
Acetonitrile 9:1
From infected seeds
Extract in hexane (remove oily parts)
Again extract in ethyl acetate (remove pigments)
Chloroform extraction
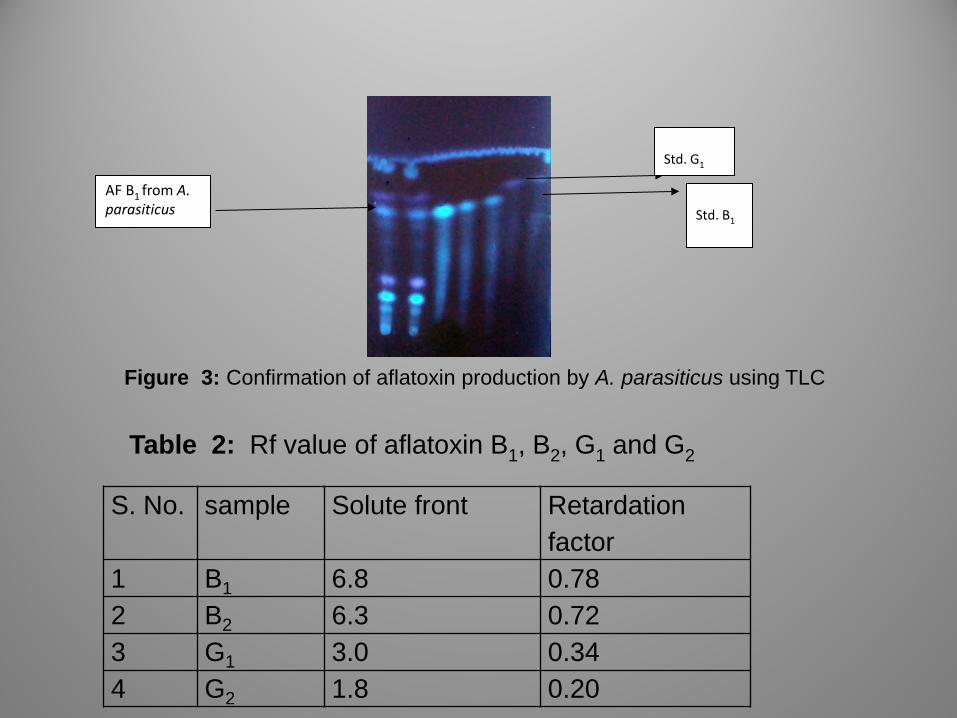
Std. B1
Std. G1
AF B1 from A. parasiticus
Figure 3: Confirmation of aflatoxin production by A. parasiticus using TLC
S. No. sample Solute front Retardation factor
1 B1 6.8 0.78 2 B2 6.3 0.72 3 G1 3.0 0.34 4 G2 1.8 0.20
Table 2: Rf value of aflatoxin B1, B2, G1 and G2

Figure 4: Confirmation of aflatoxin production by A. flavus and A. parasiticus using (A) TLC (B, C) UV Spectroscopy and (E) HPLC analytical method
(A ) (B) (c)
(D)
G1 B1
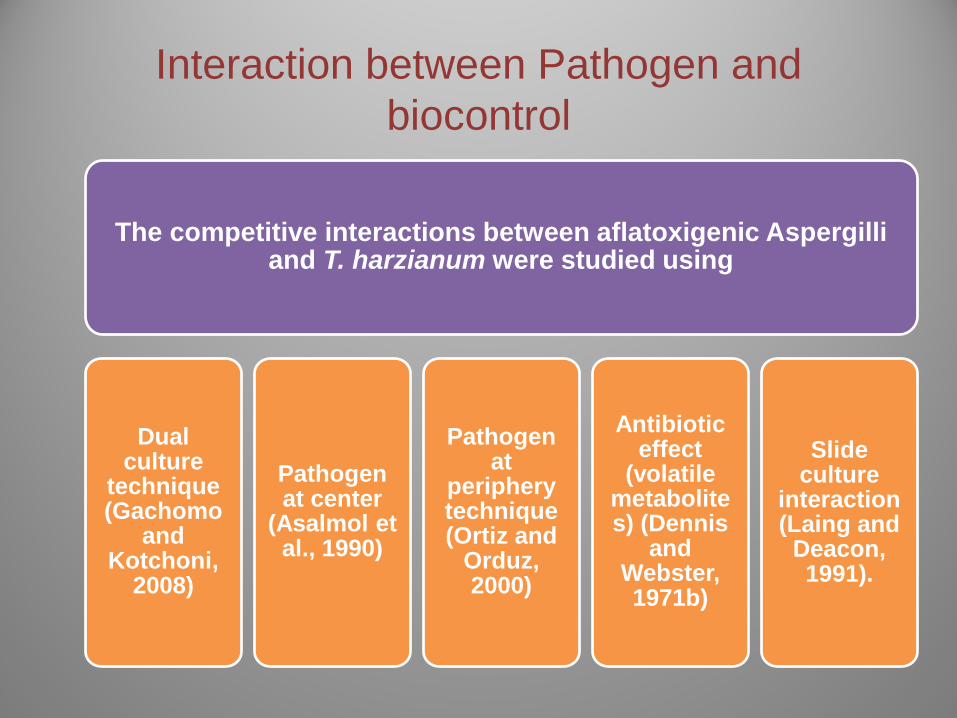
Interaction between Pathogen and biocontrol
The competitive interactions between aflatoxigenic Aspergilli and T. harzianum were studied using
Dual culture
technique (Gachomo
and Kotchoni,
2008)
Pathogen at center
(Asalmol et al., 1990)
Pathogen at
periphery technique (Ortiz and
Orduz, 2000)
Antibiotic effect
(volatile metabolites) (Dennis
and Webster, 1971b)
Slide culture
interaction (Laing and
Deacon, 1991).

S. No. Test pathogen
Percentage inhibition (I) in mm Dual culture technique
pathogen at centre technique
pathogen at periphery technique
Volatile metabolites
1 A. sydowi 51.56% 62.50% 59.37% 68.18% 2 A. nidulans 66.66% 63.88% 65.27% 40.74% 3 A. terreus 63.33% 70.00% 56.66% 47.61% 4 A. ochraceus 63.41% 70.73% 61.80% 33.33% 5 A. fumigatus 77.53% 79.71% 72.46% 63.26% 6 A. flavus 78.46% 81.53% 70.76% 57.14% 7 A. parasiticus 64.00 76.00% 38.00% 44.11%
Table 3. Effect of T. harzianum on radial growth inhibition of peanut mycoflora by the production of metabolites on RBA medium in co-culture methods

i. A. flavus ii. A. parasiticus
Figure 5 : Effect of T. harzianum on radial growth inhibition of A. flavus and A. parasiticus on RBA medium in variable culture techniques
A. Dual culture
C. Pathogen at periphery
B. Pathogen at centre

Figure 6. Microscopical view in which hyphae of T. harzianum interacting with aflatoxigenic A. flavus

Bioremediation (Detoxification) of aflatoxins
A. Co-culture system
Spore suspension (1x10⁶ spores/ml) of aflatoxigenic A. flavus and A. parasiticus were co-cultivated with T. harzianum in the Richard's broth
media (pH 5.5) for 8 days at 25°C.
Qualitative assay of aflatoxin by TLC was done as per method (Basappa, 2009), quantitative estimation by UV-Spectroscopy (Nesheim
and Stack, 2001) and the level of aflatoxins B1, and G1 groundnut samples was estimated by running samples through HPLC according to
the AOAC
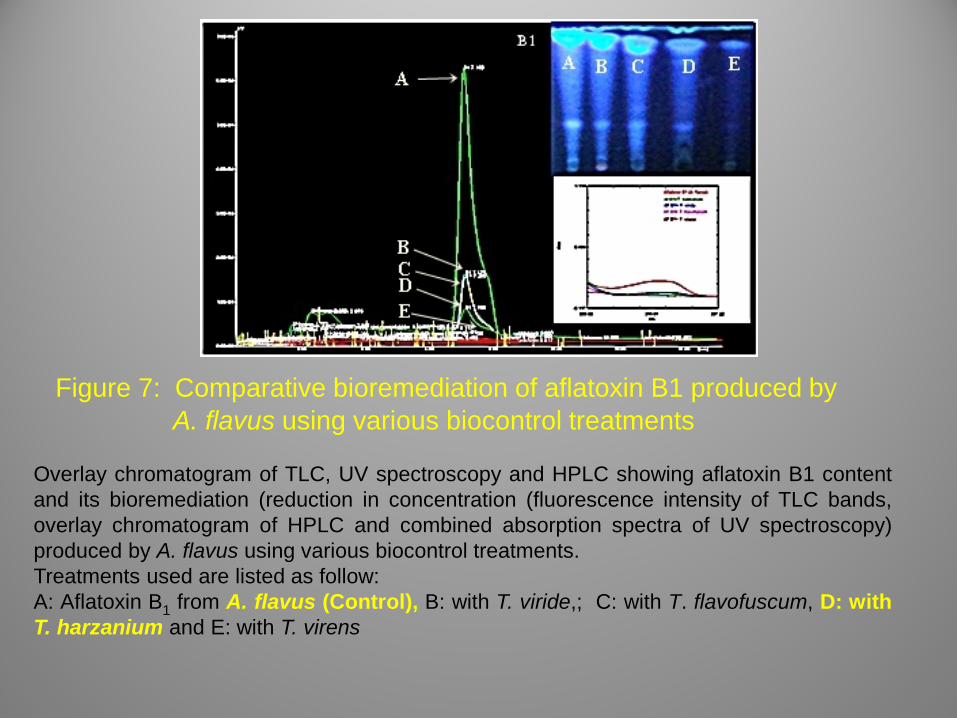
Figure 7: Comparative bioremediation of aflatoxin B1 produced by A. flavus using various biocontrol treatments
Overlay chromatogram of TLC, UV spectroscopy and HPLC showing aflatoxin B1 content and its bioremediation (reduction in concentration (fluorescence intensity of TLC bands, overlay chromatogram of HPLC and combined absorption spectra of UV spectroscopy) produced by A. flavus using various biocontrol treatments. Treatments used are listed as follow: A: Aflatoxin B1 from A. flavus (Control), B: with T. viride,; C: with T. flavofuscum, D: with T. harzanium and E: with T. virens

Figure 8. Comparative bioremediation of aflatoxin B1 & G1 produced by A. parasiticus using various biocontrol treatments
Overlay chromatogram of TLC, UV spectroscopy and HPLC showing aflatoxin B1 (PK2) and G1 (PK1) content and its bioremediation (reduction in concentration (fluorescence intensity of TLC bands, overlay chromatogram of HPLC and UV spectroscopy) produced by A. parasiticus using various biocontrol treatments. Treatments used are listed as follow: (B1 (A) and G1 (a) from A. parasiticus (control), B1 (B) and G1 (b) with T. viride, B1 (C) and G1 (c) with T. flavofuscum, (B1 (D) and G1 (d) T. harzanium and (B1 (E) and G1 (e) with T. virens, lane F: B1 (a) and G1 (b) with T. harzanium

B. Integrated management of aflatoxin by Trichoderma harzianum in field trial
experiment
The mass multiplication of antagonist and pathogen was done on sorghum seeds soaked in 2% sucrose solution for overnight. The local peanut variety susceptible to Aspergillus infection was used
as test crop.
The biocontrol agent was added two times during the experimental period. First application was given during sowing, and the second application was given after 35 days of trial. The effect on seed germination (without infection), height, yield and
protein content of seed was considered as a parameter to assess its biocontrol ability.

A. Integrated management of aflatoxin and growth promotion activity in groundnut plant with the help of Trichoderma species
i. Effect of aflatoxigenic Aspergillus species on the growth of peanut
A. flavus A. parasiticus
Figure 9: Field trial experiment treated with i. A.flavus ii. A. parasiticus and iii. Combination with T. harzanium
When pathogen alone was inoculated into the soil, reduced the germination of seeds. Only 19% and 24% seed germination occurred in presence of A. flavus and A. parasiticus as compared to control (55 %). Shoot length (14.5 and 21.5 cm), fresh weight (21.420 and 29.530 g), dry weight (10.120 and 12.020 g) and the protein content were found to reduce by 0.1889-0.1745 with the treatment of A. flavus and A. parasiticus respectively. Insignificant change in the protein content of groundnut seeds was observed.

Treatment Germinati
on
(%)
Height
(cm)
Fresh weight
of plant (gm)
Dry
weight of
plant (gm)
Protein
content in
seeds
(mg/ml)
Control (Plain
soil)
55 27.5 43.120 16.650 0.2646
A. flavus 19 14.5 21.420 10.120 0.1889
A. parasiticus 24 21.5 29.530 12.020 0.1745
T. harzianum 81 51.3 210.300 79.50 0.513
TH +AF 74 49.02 123.76 61.214 0.4978
TH+AP 77 49.30 126.35 62.453 0.4502
Table 4. Effect of antagonistic potential of T. harzianum on the growth promotion factors of groundnut plant infected with A. flavus and A. parasiticus
* TH+AF - T. harzianum+ A. flavus & TH+AP - T. harzianum + A. parasiticus
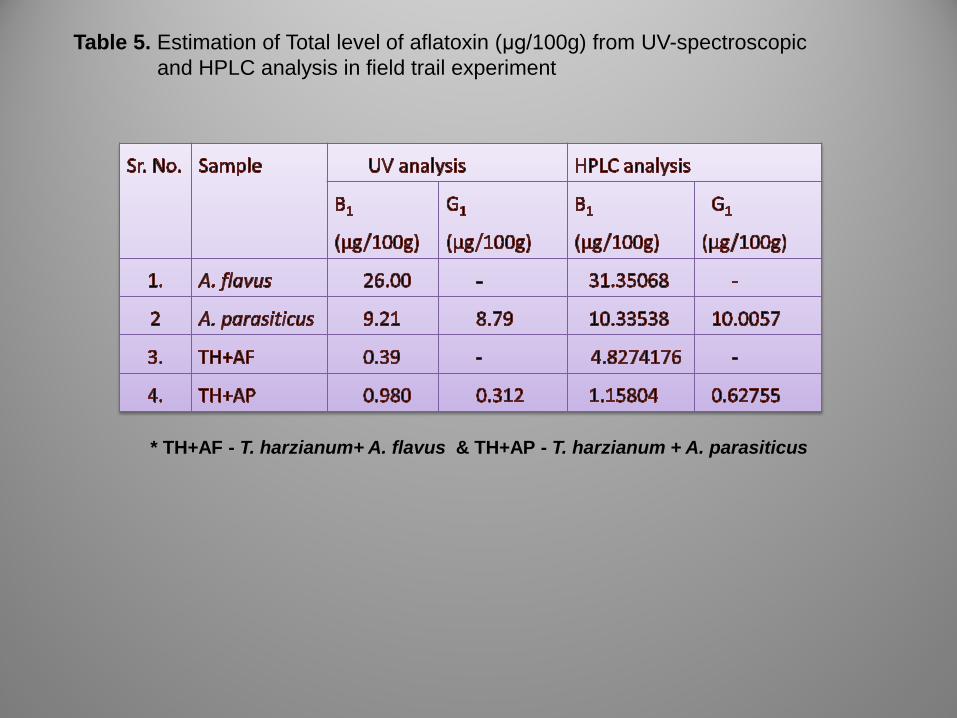
Table 5. Estimation of Total level of aflatoxin (μg/100g) from UV-spectroscopic and HPLC analysis in field trail experiment
* TH+AF - T. harzianum+ A. flavus & TH+AP - T. harzianum + A. parasiticus

Fermentation of fungal culture for induction of bioactive metabolites
Log phase fungal culture (1x10⁶ spore/ml) inoculated in 250 ml of Richards broth (pH 5.5), incubated at 28°C
for 10 days.
Broth was filtered twice with Whatman No. 1 filter paper to eliminate fungal mycelia.
The 25 ml of cell free extract extracted with 10 ml of chloroform and further
passed through a bed of anhydrous sodium sulphate
and then evaporated in water bath at 60°C.
Extraction of fungal metabolites was done using n-hexane, chloroform, ethyl
acetate, n-butanol and water as dual solvent systems.
As ethyl acetate extract showed higher biological activities were selected for the extraction scheme of
both extracellular (excreted into the medium) and intracellular metabolites. About 250 ml ethyl acetate was added into each fungal culture flask and kept
overnight ensuring complete fungal cell death.
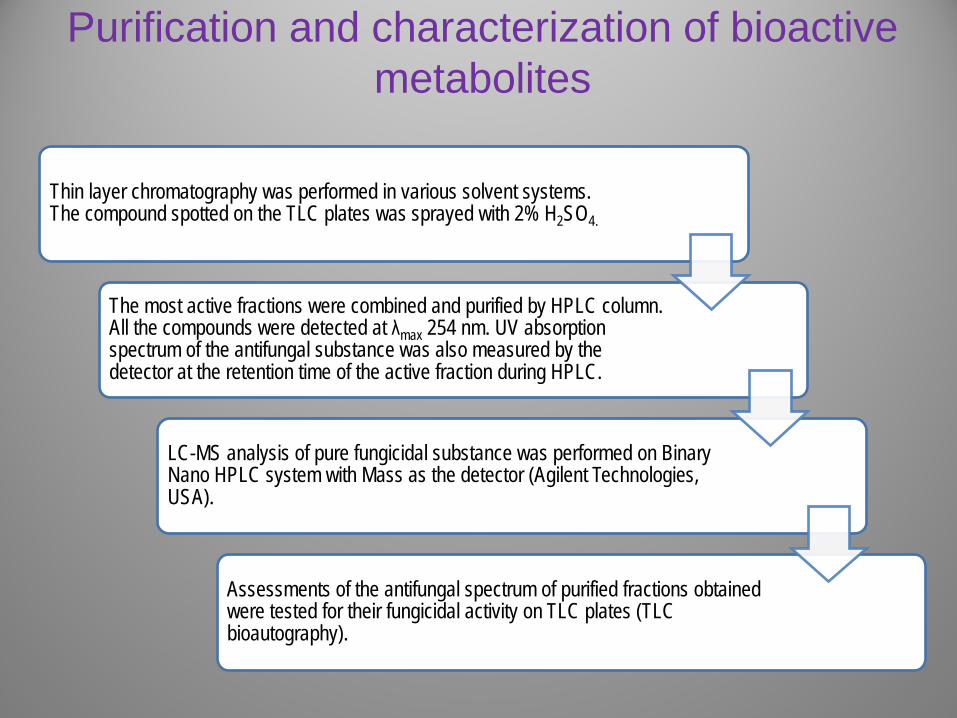
Purification and characterization of bioactive metabolites
Thin layer chromatography was performed in various solvent systems. The compound spotted on the TLC plates was sprayed with 2% H2SO4.
The most active fractions were combined and purified by HPLC column. All the compounds were detected at λmax 254 nm. UV absorption spectrum of the antifungal substance was also measured by the detector at the retention time of the active fraction during HPLC.
LC-MS analysis of pure fungicidal substance was performed on Binary Nano HPLC system with Mass as the detector (Agilent Technologies, USA).
Assessments of the antifungal spectrum of purified fractions obtained were tested for their fungicidal activity on TLC plates (TLC bioautography).

Table 6: Antifungal activity of antibiotics produced by Trichoderma species (using various solvent extracts)
A. flavus A. parasiticus
Figure 10: Antifungal activity of extract by Disc diffusion method and TLC separation of active compound

Figure 11: TLC Chromatogram of combined fractions of T. harzianum ethyl acetate extract separated by column chromatography (A) T. harzianum (B) after spraying the plate with conc. H2SO4 spray reagent detecting the presence of terpenoid

242220181614121086420
380,000360,000340,000320,000300,000280,000260,000240,000220,000200,000180,000160,000140,000120,000100,000
80,00060,00040,00020,000
0-20,000 RT [min]
TDF-A91.DATAuV
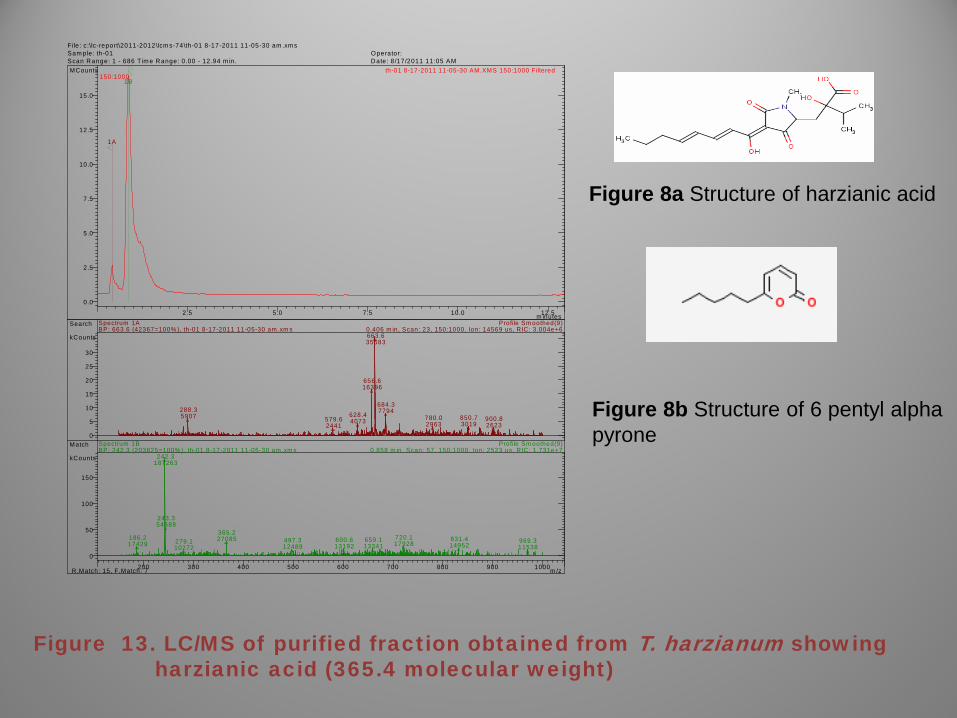
Figure 12. HPLC chromatogram of the antifungal substance TH1 isolated from the culture filtrate of T. harzianum
File: c:\lc-report\2011-2012\lcm s-74\th-01 8-17-2011 11-05-30 am .xm sSam ple: th-01 Operator: Scan Range: 1 - 686 Tim e Range: 0.00 - 12.94 m in. Date: 8/17/2011 11:05 AM
2.5 5.0 7.5 10.0 12.5m inutes
0.0
2.5
5.0
7.5
10.0
12.5
15.0
MCounts th-01 8-17-2011 11-05-30 AM.XMS 150:1000 Filtered150:1000
1A
1B
200 300 400 500 600 700 800 900 1000m /zR.Match: 15, F.Match: 7
0
5
10
15
20
25
30
kCounts
Search
288.3 5907 579.6
2441
628.4 4073
656.6 16396
663.6 35583
684.3 7794
780.0 2963
850.7 3019
900.8 2623
Profile Sm oothed(9)Spectrum 1A0.406 m in, Scan: 23, 150:1000, Ion: 14569 us, RIC: 3.004e+6BP: 663.6 (42367=100% ), th-01 8-17-2011 11-05-30 am .xm s
0
50
100
150
kCounts
Match
186.2 17429
242.3 187263
243.3 54688
279.1 10272
365.2 27085 497.3
12489 600.6 13192
659.1 13341
720.1 17928
831.4 14952
969.3 11538
Profile Sm oothed(9)Spectrum 1B0.858 m in, Scan: 57, 150:1000, Ion: 2523 us, RIC: 1.731e+7BP: 242.3 (203825=100% ), th-01 8-17-2011 11-05-30 am .xm s
Figure 13. LC/MS of purified fraction obtained from T. harzianum showing harzianic acid (365.4 molecular weight)
Figure 8a Structure of harzianic acid
Figure 8b Structure of 6 pentyl alpha pyrone

TLC bioautography
The developed TLC plates were first over layered PDA (50°C) containing spore suspension of Aspergillus (10-6 spores/ml).
The inoculated plates were then transferred to the sterile plastic boxes, sealed with parafilm to maintain 100% relative humidity and incubated at 25°C in dark for 3-4 days.
Mycelial growth inhibition around the separated band indicated the antifungal potential of the individual fractions.
Zones of inhibition are next visualized by a dehydrogenase activity detecting reagent, a tetrazolium salt MTT (3-(4,5-Dimethylthiazol-2-yl)-2,5-Diphenyltetrazolium Bromide), which is converted by the bacteria into the intensely colorful product. The antibacterial
compounds appear as colorless spots against a coloured background (Hamburger, 1987).
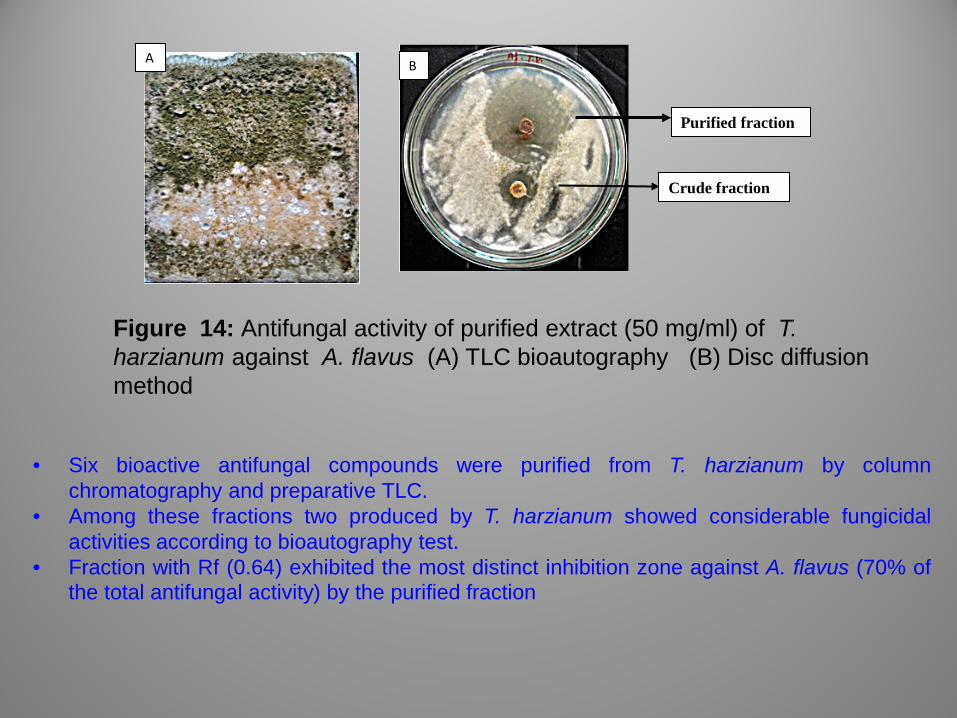
Crude fraction
Purified fraction
A B
Figure 14: Antifungal activity of purified extract (50 mg/ml) of T. harzianum against A. flavus (A) TLC bioautography (B) Disc diffusion method
• Six bioactive antifungal compounds were purified from T. harzianum by column chromatography and preparative TLC.
• Among these fractions two produced by T. harzianum showed considerable fungicidal activities according to bioautography test.
• Fraction with Rf (0.64) exhibited the most distinct inhibition zone against A. flavus (70% of the total antifungal activity) by the purified fraction

T. harzianum treatments are able to control the aflatoxin level and growth of Aspergillus species by their secondary
metabolites.
The work, confirm the involvement of harzianic acid and 6-n-pentyl pyrone in antagonistic activity.
Chemical analysis of these metabolites will broaden the spectrum of substances known to control the aflatoxin
production and possible other fungal growth too.
The derived metabolites from the Trichoderma species may be the useful future tool for both disease and fungicide's resistance
management.
Conclusions

Acknowledgement University Grant Commission, New Delhi for Post Doc Research Award scheme (2011-12)
Department of Biotechnology, SGB Amravati University, Amravati (M.S) India

AOAC Official Method. 2005. Aflatoxin M1 in liquid milk, immunoaffinity column by liquid chromatography. Natural Toxins-chapter 49 (pp. 45-47). Official Methods of Analysis of AOAC International. 18: 20877-2417.
Asalmol, M. N., Sen, B. and Awasthi, J. 1990. Role of temperature and pH in antagonism of Aspergillus niger and Trichoderma viride against Fusarium solani, Proc. Indian Phyto-Pathol Soc (Western Zone). On Biocontrol of Plant Pathogen. 11-13.
Basappa, S. C. 2009. Aflatoxin: formation, analysis and control. oxphord U.K. Alpha science international Ltd.
Davis, N. D., Iyer, S. K. and Diener, U.L. 1987. Improved method of screening for aflatoxin with a coconut agar medium. App and Env Microbio. 53: 1593-1595.
Dennis, C. and Webster, J. 1971. Antagonism properties of species groups of Trichoderma, III. Hyphal interaction. Trans Br Mycol Soc. 57: 363-369.
Dennis, C. and Webster, J. 1971. Antagonistic properties of species groups of Trichoderma production of volatile antibiotics. Trans Br Mycol Soc. 57: 41-48.
Gachomo, E. W. and Kotchoni, S. O. 2008. The use of Trichoderma harzianum and T. viride as potential biocontrol agents against peanut microflora and their effectiveness in reducing aflatoxin contamination of infected kernels. Biotechnol. 1: 9.
Hamburger, M. 0., and Cordell, G. A. 1987. A direct bioautographic TLC assay for compounds possessing antibacterial activity. J Net Prod. 50: 19-22.
Laing, S. A. K. and Deacon, J. W. 1991. Video microscopical comparison of mycoparasitism by Pythium oligandrum. P. nunn and an unnamed Pythium species. Mycological Research. 95, 469–79.
Nesheim, S. and Stack, M. E. 2001. Mycotoxin protocols. Methods in molecular biology. 157: 31-36.
Ortiz, A., and Orduz, S. 2000. In vitro evaluation of Trichoderma and Gliocladium antagonism against the symbiotic fungus of the leaf-cutting ant Atta cephalotes. Mycopathologia. 150: 53-60.
Patil, A., Laddha, A., Lunge, A., Paikrao, H. and Mahure, S. 2012. In vitro antagonistic properties of selected Trichoderma species against tomato root rot causing pythium. Int J of Sci Env and Tech. 1: 302–315.
Vinale, F., Flematti, G., Sivasithamparam, K., Lorito, M., Marra, R., Skelton, B. W. and Ghisalberti, E. L. 2009. Harzianic acid, an antifungal and plant growth promoting metabolite from Trichoderma harzianum. J Nat Prod. 72: 2032–2035.
Woo, S. L. and Lorito, M. 2007. Exploiting the interactions between fungal antagonists, pathogens and the plant for biocontrol. In Vurro, M., Gressel, J. (eds), Novel biotechnologies for biocontrol agent enhancement and management. 107-130, IOS, Springer Press, Amsterdam, the Netherlands.