processed records of the 8 march 2010 elazığ – kovanc lar, … · 1 processed records of the 8...
TRANSCRIPT

1
Processed records of the 8 March 2010 Elazığ – Kovancılar, earthquake
Earthquake Engineering Research Center
Middle East Technical University
An earthquake occurred on March 8, 2010 at 02:32 (GMT) in the eastern part of Turkey. The
epicenter falls in Zone 1 in the Earthquake Zones Map of Turkey. This is the most seismically hazardous zone according to the seismic classification criteria adopted for Turkey (Gülkan et al., 1993). It is located midway between the provincial capital of Elazığ and Bingöl with coordinates reported as 38.7752N-40.0295E by the Earthquake Division of the Turkish Disaster and Emergency Management Agency (DEMA).
The area is sparsely populated, with most dwellings having one or two stories constructed from
rubble masonry without timber reinforcement or less frequently, adobe, with thick walls against harsh climate conditions. The roofs of dwellings are inclined corrugated metal with uncut timber serving as the diaphragm. This type of building and its earlier versions topped with a heavy earthen roof have performed very poorly during earthquakes.
The depth and magnitude of the earthquake are reported as 5 km and ML5.8, respectively by the
same agency. Other national and international seismic agencies have reported the depth, magnitude, epicentral coordinates as well as other relevant source parameters as listed in Table 1.
Currently a total of 20 three-component accelerometric data is available through the TÜBİTAK1
funded project entitled “Compilation of National Strong Ground Motion Database in Accordance with International Standards2.” The data comes from the main and aftershock events. They are acquired by the data automation system established in the Earthquake Division as one of the target objectives in the above project. This first report on the earthquake presents the uniformly processed accelerometric data of these events as well as their Fourier acceleration and response spectra. This information will also be disseminated through the Web at eerc.ce.metu.edu.tr and daphne.deprem.gov.tr. The Web site also contains the raw accelerometric data for researchers who want to do their own data processing. The current document will be updated and expanded regularly and will become a full report after compiling the observations of METU field reconnaissance team that will leave for the area on March 10, 2010. The following pages illustrate the processed waveforms and the calculated spectra for currently available records. Table 2 summarizes the low-cut and high-cut filter cut-offs determined by the procedure described in Akkar and Bommer (2006). The same table also lists the suggested usable period ranges of each recording based on the empirical expressions derived in the same article. The processing and spectral calculations are done by using the USDP software that is developed within the context of the above project. References:
Akkar, S. and Bommer J.J., 2006. “ Influence of long-period filter cut-off on elastic spectral displacements,” Earthquake Engineering and Structural Dynamics , 35(9), 1145-1165. Gulkan P., Koçyiğit A., Yücemen M.S., Doyuran V. and Başöz N. (1993). “Turkish seismic zonation map prepared by the most recent earthquake data,” Report No. 93-01, Earthquake Engineering Research Center, Middle East Technical University 06531, Ankara Turkey. 1 Scientific and Technological Research Council of Turkey 2 This project is jointly launched by the Earthquake Department of the Disaster and Emergency Management State Agency and the Earthquake Engineering Research Center of Middle East Technical University.

2
Acknowledgments:
We thank to strong-motion group of DEMA for providing us the strong-motion data. We also thank to Arda Arcasoy and Kıvanç Karanis for correcting the sample spacing of acceleration time series. Contributors:
Abdullah Sandıkkaya Emrah Yenier Sinan Akkar

3
Table 1. Important seismological features of the main and aftershock earthquakes reported by national and international seismological agencies
Agency Date Time (GMT)
Epicenter Latitude
Epicenter Longitude
Depth (km) Mw Mb Ms ML M0
(dyne.cm)DEMA3 08-03-10 02:32:30 38.7752 40.0295 5.0 - - - 5.8 - KOERI4 08-03-10 02:32:31 38.807 40.0998 5.0 - - - 6.0 - GCMT5 08-03-10 02:32:39 38.89 40.02 15.6 6.1 5.9 5.9 - 1.55E+25 RCMT6 08-03-10 02:32:40 38.95 40.00 15.0 6.1 - - - 1.60E+25 USGS7 08-03-10 02:32:36 38.888 40.022 21.0 6.0 - - - 1.40E+25
Agency T-
axes PLG
T-axes AZ
N-axes PLG
N-axes AZ
P-axes PLG
P-axes AZ
1st Plane Strike
1st Plane Dip
1st Plane Slip
2nd Plane Strike
2nd Plane Dip
2nd Plane Slip
Correct Plane
DEMA - - - - - - - - - - - - - KOERI - - - - - - - - - - - - - GCMT - - - - - - 320 66 -174 228 85 24 2 RCMT 15 275 67 46 16 181 318 67 -179 228 89 -23 2 USGS 4 272 77 22 11 181 227 85 -11 318 79 -174 1
3 Earthquake Department of the Disaster and Emergency Management State Agency (abbreviated as State Earthquake Department in this document). 4 Kandilli Observatory and Earthquake Research Institute 5 Global Centroid Moment Tensor 6 European Mediterranean Regional Centroid Moment Tensors Database 7 United States Geological Survey

4
Table 1 (continued)
Agency Date Time (GMT)
Epicenter Latitude
Epicenter Longitude
Depth (km) Mw Mb Ms ML M0
(dyne.cm)DEMA 08/03/10 07:47:37 38.7355 40.009 5.0 - - - 5.6 - KOERI 08/03/10 07:47:38 38.7805 40.066 5.0 - - - 5.5 - GCMT 08/03/10 07:47:44 38.81 39.96 15.2 5.6 5.5 5.5 - 2.78E+24 RCMT 08/03/10 07:47:44 38.77 40 17.0 5.6 - - - 3.00E+24 USGS 08/03/10 02:32:30 - - - - - - - -
Agency T-
axes PLG
T-axes AZ
N-axes PLG
N-axes AZ
P-axes PLG
P-axes AZ
1st Plane Strike
1st Plane Dip
1st Plane Slip
2nd Plane Strike
2nd Plane Dip
2nd Plane Slip
Correct Plane
DEMA - - - - - - - - - - - - - KOERI - - - - - - - - - - - - - GCMT - - - - - - 322 81 -171 230 81 -9 2 RCMT 1 276 70 7 20 185 322 75 -166 229 76 -15 2 USGS - - - - - - - - - - - - -

5
Table 1 (continued)
Agency Date Time (GMT)
Epicenter Latitude
Epicenter Longitude
Depth (km) ML
DEMA 08/03/10 03:20:22 38.7948 40.0705 5.0 4.4 KOERI 08/03/10 03:20:22 38.8698 40.2325 5.0 4.1
Agency Date Time (GMT)
Epicenter Latitude
Epicenter Longitude
Depth (km) ML
DEMA 08/03/10 08:11:20 38.7412 40.0138 10.0 4.2 KOERI 08/03/10 08:11:20 38.7357 40.076 5.1 4.3
Agency Date Time (GMT)
Epicenter Latitude
Epicenter Longitude
Depth (km) ML
DEMA 08/03/10 09:00:46 38.7468 40.006 4.1 4.8 KOERI 08/03/10 09:00:46 38.761 40.0615 5.0 4.8
Agency Date Time (GMT)
Epicenter Latitude
Epicenter Longitude
Depth (km) ML
DEMA 08/03/10 10:14:23 38.7685 40.0772 7.7 5.0 KOERI 08/03/10 10:14:23 38.828 40.1187 5.0 5.1

6
Table 2. Important properties of the processed records from the main and aftershock events
Record Names Instrument Type
Record Information
flc-NS
fhc-NS
Usable period-
NS
flc-EW
fhc-EW
Usable period-
EW
flc-UD
fhc-UD
Usable period-
UD 20100308023229_0201 CMG-5TD 0.100 25 9.0 0.075 25 12.0 0.050 30 18.0 20100308023229_1201 CMG-5TD 0.050 40 18.0 0.075 40 12.0 0.050 40 18.0 20100308023229_1206 CMG-5TD 0.050 35 19.4 0.050 35 19.4 0.075 40 12.9 20100308023229_2101 CMG-5TD 0.100 30 9.0 0.050 30 18.0 0.100 30 9.0 20100308023229_2301 CMG-5TD 0.075 30 12.0 0.100 30 9.0 0.050 40 18.0 20100308023229_2303 SM-2 0.075 20 12.9 0.075 20 12.9 0.100 25 9.7 20100308023229_4701 CMG-5TD 0.100 35 9.0 0.100 35 9.0 0.075 30 12.0 20100308023229_7201 CMG-5TD 0.050 35 - 0.075 30 - 0.100 35 - 20100308032022_2303 SM-2 IDR - - - - - - - - - 20100308074737_1201 CMG-5TD 0.100 30 9.0 0.075 30 12.0 0.075 40 12.0 20100308074737_1206 CMG-5TD 0.075 25 12.9 0.075 30 12.9 0.075 30 12.9 20100308074737_2301 CMG-5TD 0.075 30 12.0 0.075 30 12.0 0.100 30 9.0 20100308074737_2303 SM-2 0.100 25 9.7 0.100 20 9.7 0.100 35 9.7 20100308081120_2303 SM-2 0.100 20 9.7 0.150 20 6.5 0.200 30 4.9 20100308090046_1201 CMG-5TD 0.100 25 9.0 0.150 25 6.0 0.150 30 6.0 20100308090046_2303 SM-2 0.100 20 9.7 0.150 20 6.5 0.150 25 6.5 20100308101423_1201 CMG-5TD 0.050 40 18.0 0.100 40 9.0 0.150 40 6.0 20100308101423_1206 CMG-5TD 0.100 40 9.7 0.100 40 9.7 0.100 40 9.7 20100308101423_2303 SM-2 0.150 15 6.5 0.150 20 6.5 0.200 25 4.9
20100308XXXXXX_2303 SM-2 IDR - - - - - - - - - flc: Low-cut filter frequency fhc: High-cut filter frequency IDR: Insufficient digitizer resolution

7
Table 2 (continued)
Record Names Processed PGA_NS (cm/s2)
Processed PGA_EW
(cm/s2)
Processed PGA_UD
(cm/s2)
Processed PGV_NS
(cm/s)
Processed PGV_EW
(cm/s)
Processed PGV_UD
(cm/s) 20100308023229_0201 2.43 2.23 1.65 0.95 0.75 0.38 20100308023229_1201 55.43 34.27 25.50 5.10 3.78 1.74 20100308023229_1206 11.59 17.84 8.95 1.96 1.23 0.99 20100308023229_2101 3.44 5.10 2.60 0.52 0.68 0.35 20100308023229_2301 5.56 4.76 3.85 1.01 0.71 0.48 20100308023229_2303 62.14 66.59 30.04 7.30 5.99 3.24 20100308023229_4701 2.56 2.48 1.68 0.35 0.50 0.18 20100308023229_7201 7.61 5.42 2.52 1.27 1.09 0.27 20100308032022_2303 - - - - - - 20100308074737_1201 14.54 10.21 7.07 1.10 0.83 0.55 20100308074737_1206 2.81 3.85 1.54 0.31 0.34 0.17 20100308074737_2301 3.54 4.22 3.33 0.60 0.50 0.45 20100308074737_2303 76.26 47.79 55.01 10.37 3.85 4.38 20100308081120_2303 7.78 6.86 4.98 0.56 0.58 0.36 20100308090046_1201 2.72 3.01 2.43 0.17 0.14 0.12 20100308090046_2303 15.50 12.95 9.18 1.68 0.95 0.78 20100308101423_1201 8.67 8.12 5.31 0.44 0.47 0.24 20100308101423_1206 2.25 2.21 1.48 0.17 0.17 0.08 20100308101423_2303 16.42 13.42 11.10 1.38 0.96 1.00
20100308XXXXXX_2303 - - - - - - PGA: Peak ground acceleration
PGV: Peak ground velocity
8
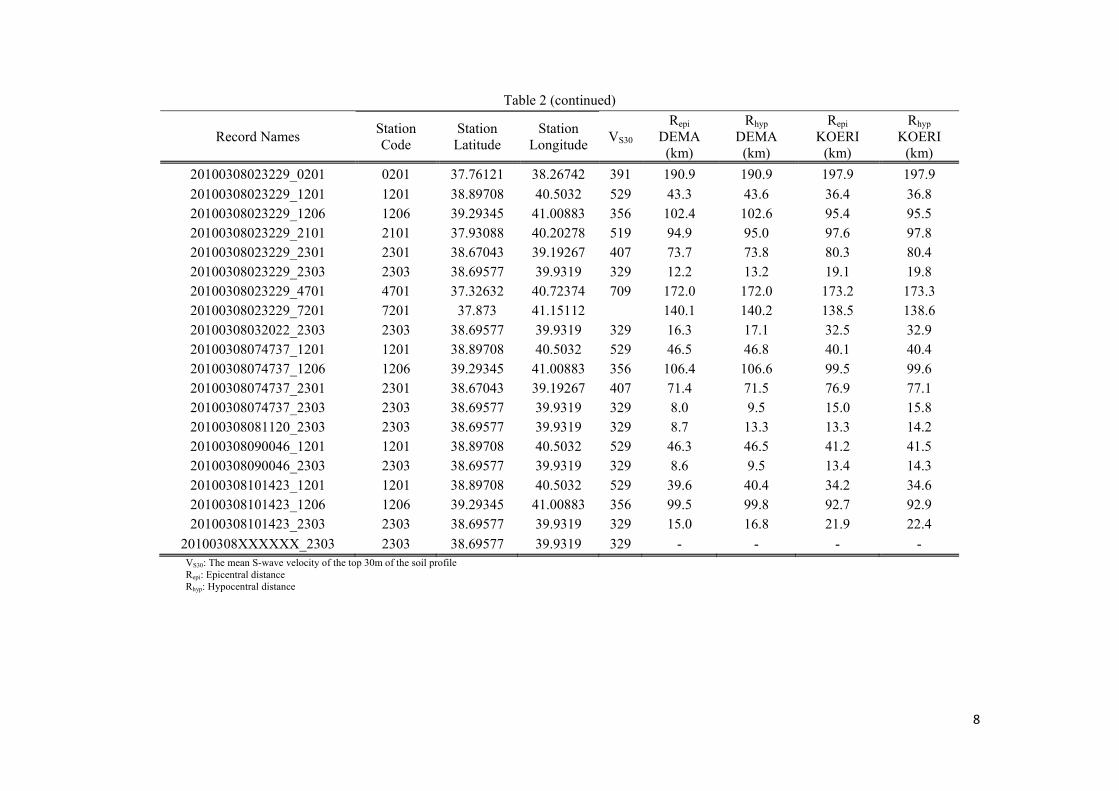
Table 2 (continued)
Record Names Station Code
Station Latitude
Station Longitude VS30
Repi DEMA
(km)
Rhyp DEMA
(km)
Repi KOERI
(km)
Rhyp KOERI
(km) 20100308023229_0201 0201 37.76121 38.26742 391 190.9 190.9 197.9 197.9 20100308023229_1201 1201 38.89708 40.5032 529 43.3 43.6 36.4 36.8 20100308023229_1206 1206 39.29345 41.00883 356 102.4 102.6 95.4 95.5 20100308023229_2101 2101 37.93088 40.20278 519 94.9 95.0 97.6 97.8 20100308023229_2301 2301 38.67043 39.19267 407 73.7 73.8 80.3 80.4 20100308023229_2303 2303 38.69577 39.9319 329 12.2 13.2 19.1 19.8 20100308023229_4701 4701 37.32632 40.72374 709 172.0 172.0 173.2 173.3 20100308023229_7201 7201 37.873 41.15112 140.1 140.2 138.5 138.6 20100308032022_2303 2303 38.69577 39.9319 329 16.3 17.1 32.5 32.9 20100308074737_1201 1201 38.89708 40.5032 529 46.5 46.8 40.1 40.4 20100308074737_1206 1206 39.29345 41.00883 356 106.4 106.6 99.5 99.6 20100308074737_2301 2301 38.67043 39.19267 407 71.4 71.5 76.9 77.1 20100308074737_2303 2303 38.69577 39.9319 329 8.0 9.5 15.0 15.8 20100308081120_2303 2303 38.69577 39.9319 329 8.7 13.3 13.3 14.2 20100308090046_1201 1201 38.89708 40.5032 529 46.3 46.5 41.2 41.5 20100308090046_2303 2303 38.69577 39.9319 329 8.6 9.5 13.4 14.3 20100308101423_1201 1201 38.89708 40.5032 529 39.6 40.4 34.2 34.6 20100308101423_1206 1206 39.29345 41.00883 356 99.5 99.8 92.7 92.9 20100308101423_2303 2303 38.69577 39.9319 329 15.0 16.8 21.9 22.4
20100308XXXXXX_2303 2303 38.69577 39.9319 329 - - - - VS30: The mean S-wave velocity of the top 30m of the soil profile Repi: Epicentral distance Rhyp: Hypocentral distance

9
Table 2 (continued)
Record Names Station Code
Repi GCMT (km)
Rhyp GCMT (km)
RJB GCMT (km)
Rrup GCMT (km)
Repi RCMT (km)
Rhyp RCMT (km)
RJB RCMT (km)
Rrup RCMT (km)
Repi USGS (km)
Rhyp USGS (km)
RJB USGS (km)
Rrup USGS (km)
20100308023229_0201 0201 197.9 198.5 190.7 191.0 200.8 201.4 193.6 193.9 197.9 199.0 191.6 192.4 20100308023229_1201 1201 41.9 44.7 36.3 38.0 44.0 46.5 39.4 40.8 41.8 46.7 36.8 40.5 20100308023229_1206 1206 96.5 97.8 89.4 90.1 95.2 96.4 88.2 88.9 96.5 98.7 90.3 91.8 20100308023229_2101 2101 107.6 108.8 103.8 104.4 114.5 115.5 110.9 111.4 107.4 109.4 103.9 105.3 20100308023229_2301 2301 75.9 77.5 69.1 70.3 76.7 78.1 69.7 70.6 76.0 78.8 70.1 72.4 20100308023229_2303 2303 22.9 27.7 16.8 20.2 28.8 32.5 23.6 25.9 22.7 30.9 17.3 24.2 20100308023229_4701 4701 184.2 184.8 181.5 181.9 191.0 191.6 188.6 188.9 183.9 185.1 181.4 182.2 20100308023229_7201 7201 150.0 150.8 149.5 149.9 156.2 156.9 156.1 156.4 149.7 151.2 149.3 150.3 20100308032022_2303 2303 - - - - - - - - - - - - 20100308074737_1201 1201 48.1 50.5 44.6 46.3 45.9 49.0 42.2 44.5 - - - - 20100308074737_1206 1206 105.4 106.5 101.8 102.5 104.9 106.3 101.2 102.2 - - - - 20100308074737_2301 2301 68.5 70.1 65.0 66.5 71.1 73.1 67.5 69.7 - - - - 20100308074737_2303 2303 12.9 19.9 10.1 15.8 10.1 19.8 6.4 15.5 - - - - 20100308081120_2303 2303 - - - - - - - - - - - - 20100308090046_1201 1201 - - - - - - - - - - - - 20100308090046_2303 2303 - - - - - - - - - - - - 20100308101423_1201 1201 - - - - - - - - - - - - 20100308101423_1206 1206 - - - - - - - - - - - - 20100308101423_2303 2303 - - - - - - - - - - - -
20100308XXXXXX_2303 2303 - - - - - - - - - - - - RJB: Joyner-Boore distance (the closest distance from site to the vertical projection of the rupture plane) Rrup: Rupture distance (the closest distance from site to the rupture plane)

10
Figure 1. Epicenter of the mainshock and national strong-motion stations that recorded the mainshock
(from Google Earth)

11
Ground Motions of the 08/03/2010 02:32:29 Elazığ-Kovancılar, Earthquake
Figure 2. Acceleration (top row), velocity (middle row) and displacement (bottom row) time series of the processed ground motions recorded at Elazığ-Palu (Record Name: 20100308023229_2303, Station Code: 2303). The waveforms are band-pass filtered by acausal 4-pole/4-pole Butterworth filter. Zero pads due to
acausal filter transients are not shown for illustrative purposes.

12
Figure 3. Fourier acceleration spectra (top row) and 5-percent damped pseudo-spectral accelerations
(bottom row) of the processed ground motions recorded at Elazığ-Palu (Record Name: 20100308023229_2303, Station Code: 2303).
13
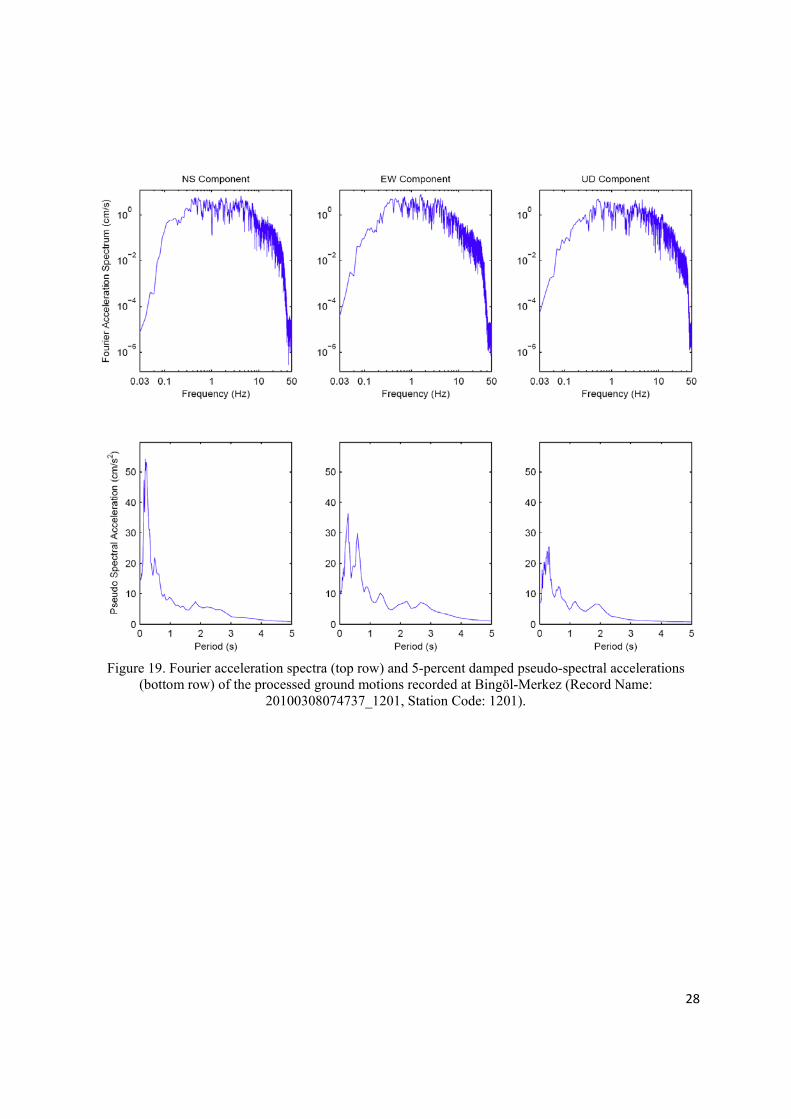
Figure 4. Acceleration (top row), velocity (middle row) and displacement (bottom row) time series of the
processed ground motions recorded at Elazığ-Merkez (Record Name: 20100308023229_2301, Station Code: 2301). The waveforms are band-pass filtered by acausal 4-pole/4-pole Butterworth filter. Zero pads
due to acausal filter transients are not shown for illustrative purposes.

14
Figure 5. Fourier acceleration spectra (top row) and 5-percent damped pseudo-spectral accelerations
(bottom row) of the processed ground motions recorded at Elazığ-Merkez (Record Name: 20100308023229_2301, Station Code: 2301).

15
Figure 6. Acceleration (top row), velocity (middle row) and displacement (bottom row) time series of the processed ground motions recorded at Adıyaman-Merkez (Record Name: 20100308023229_0201, Station Code: 0201). The waveforms are band-pass filtered by acausal 4-pole/4-pole Butterworth filter. Zero pads
due to acausal filter transients are not shown for illustrative purposes.

16
Figure 7. Fourier acceleration spectra (top row) and 5-percent damped pseudo-spectral accelerations
(bottom row) of the processed ground motions recorded at Adıyaman-Merkez (Record Name: 20100308023229_0201, Station Code: 0201).

17
Figure 8. Acceleration (top row), velocity (middle row) and displacement (bottom row) time series of the
processed ground motions recorded at Bingöl-Merkez (Record Name: 20100308023229_1201, Station Code: 1201). The waveforms are band-pass filtered by acausal 4-pole/4-pole Butterworth filter. Zero pads
due to acausal filter transients are not shown for illustrative purposes.

18
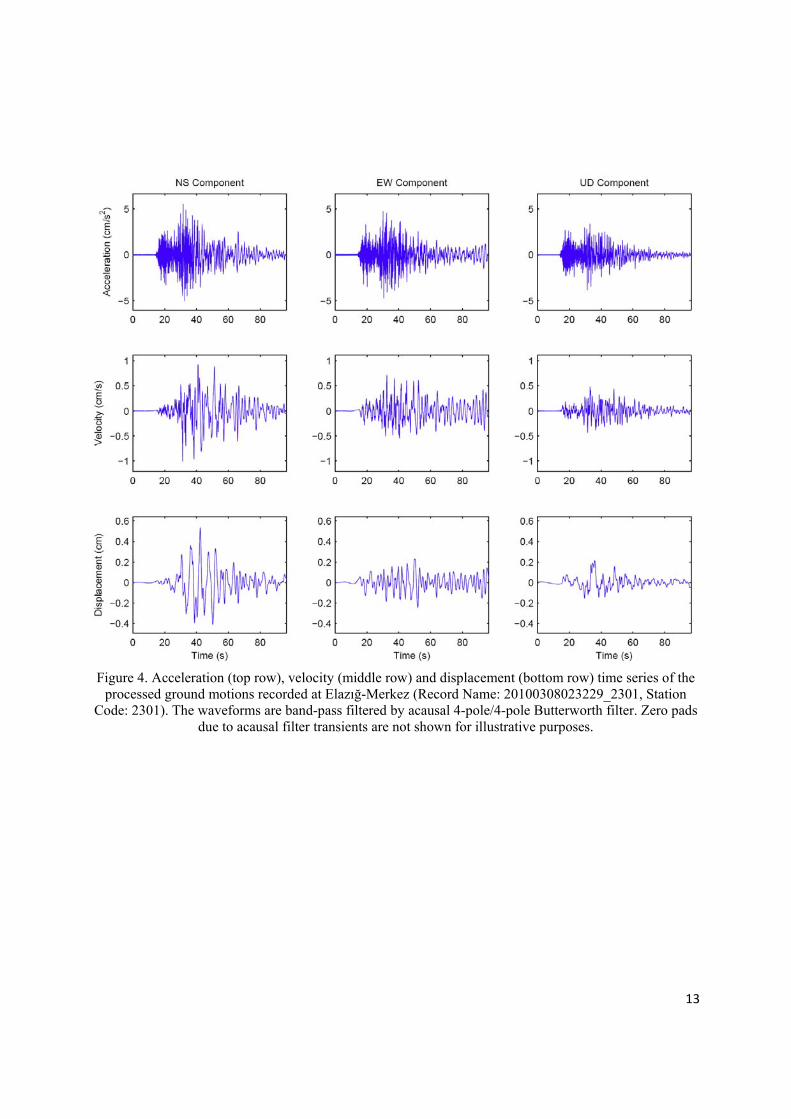
Figure 9. Fourier acceleration spectra (top row) and 5-percent damped pseudo-spectral accelerations
(bottom row) of the processed ground motions recorded at Bingöl-Merkez (Record Name: 20100308023229_1201, Station Code: 1201).

19
Figure 10. Acceleration (top row), velocity (middle row) and displacement (bottom row) time series of the
processed ground motions recorded at Bingöl-Karlıova (Record Name: 20100308023229_1206, Station Code: 1206). The waveforms are band-pass filtered by acausal 4-pole/4-pole Butterworth filter. Zero pads
due to acausal filter transients are not shown for illustrative purposes.

20
Figure 11. Fourier acceleration spectra (top row) and 5-percent damped pseudo-spectral accelerations
(bottom row) of the processed ground motions recorded at Bingöl-Karlıova (Record Name: 20100308023229_1206, Station Code: 1206).

21
Figure 12. Acceleration (top row), velocity (middle row) and displacement (bottom row) time series of the processed ground motions recorded at Diyarbakır-Merkez (Record Name: 20100308023229_2101, Station Code: 2101). The waveforms are band-pass filtered by acausal 4-pole/4-pole Butterworth filter. Zero pads
due to acausal filter transients are not shown for illustrative purposes.

22
Figure 13. Fourier acceleration spectra (top row) and 5-percent damped pseudo-spectral accelerations
(bottom row) of the processed ground motions recorded at Diyarbakır-Merkez (Record Name: 20100308023229_2101, Station Code: 2101).

23
Figure 14. Acceleration (top row), velocity (middle row) and displacement (bottom row) time series of the
processed ground motions recorded at Mardin-Merkez (Record Name: 20100308023229_4701, Station Code: 4701). The waveforms are band-pass filtered by acausal 4-pole/4-pole Butterworth filter. Zero pads
due to acausal filter transients are not shown for illustrative purposes.

24
Figure 15. Fourier acceleration spectra (top row) and 5-percent damped pseudo-spectral accelerations
(bottom row) of the processed ground motions recorded at Mardin-Merkez (Record Name: 20100308023229_4701, Station Code: 4701).

25
Figure 16. Acceleration (top row), velocity (middle row) and displacement (bottom row) time series of the
processed ground motions recorded at Batman-Merkez (Record Name: 20100308023229_7201, Station Code: 7201). The waveforms are band-pass filtered by acausal 4-pole/4-pole Butterworth filter. Zero pads
due to acausal filter transients are not shown for illustrative purposes.

26
Figure 17. Fourier acceleration spectra (top row) and 5-percent damped pseudo-spectral accelerations
(bottom row) of the processed ground motions recorded at Batman-Merkez (Record Name: 20100308023229_7201, Station Code: 7201).

27
Ground Motions of the 08/03/2010 07:47:37 Elazığ-Palu, Earthquake
Figure 18. Acceleration (top row), velocity (middle row) and displacement (bottom row) time series of the
processed ground motions recorded at Bingöl-Merkez (Record Name: 20100308074737_1201, Station Code: 1201). The waveforms are band-pass filtered by acausal 4-pole/4-pole Butterworth filter. Zero pads
due to acausal filter transients are not shown for illustrative purposes.
28
Figure 19. Fourier acceleration spectra (top row) and 5-percent damped pseudo-spectral accelerations
(bottom row) of the processed ground motions recorded at Bingöl-Merkez (Record Name: 20100308074737_1201, Station Code: 1201).

29
Figure 20. Acceleration (top row), velocity (middle row) and displacement (bottom row) time series of the
processed ground motions recorded at Bingöl-Karlıova (Record Name: 20100308074737_1206, Station Code: 1206). The waveforms are band-pass filtered by acausal 4-pole/4-pole Butterworth filter. Zero pads
due to acausal filter transients are not shown for illustrative purposes.

30
Figure 21. Fourier acceleration spectra (top row) and 5-percent damped pseudo-spectral accelerations
(bottom row) of the processed ground motions recorded at Bingöl-Karlıova (Record Name: 20100308074737_1206, Station Code: 1206).
31
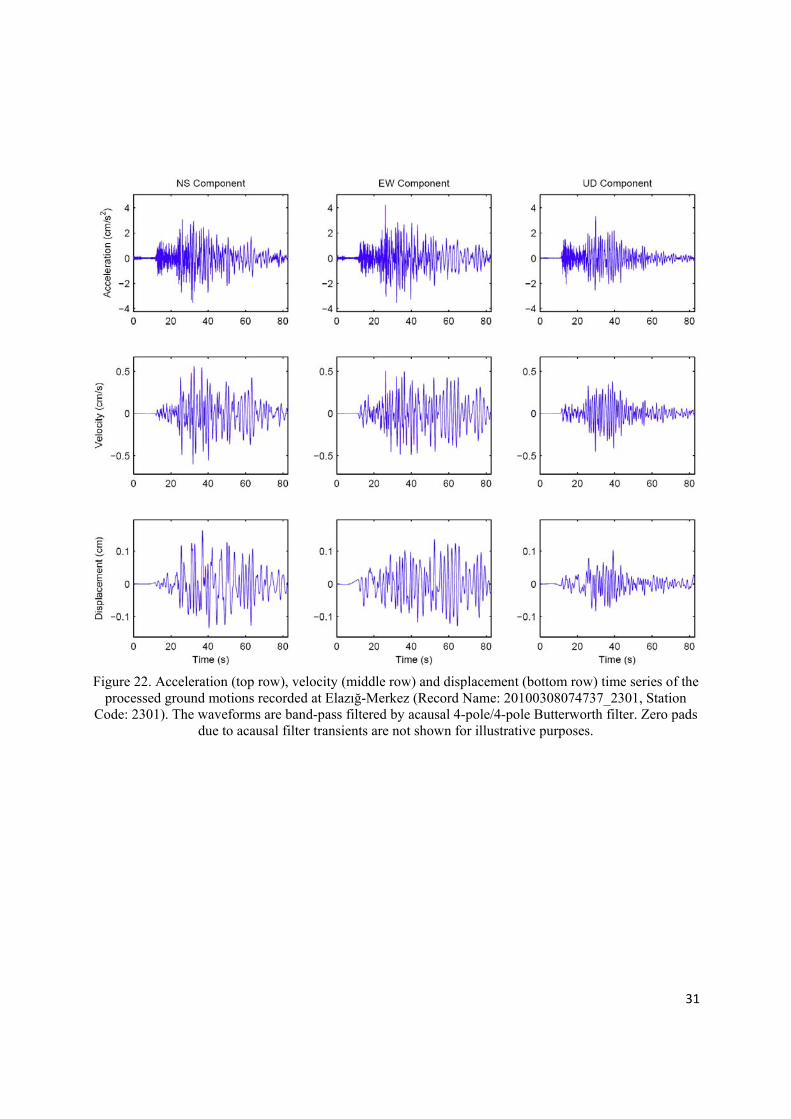
Figure 22. Acceleration (top row), velocity (middle row) and displacement (bottom row) time series of the
processed ground motions recorded at Elazığ-Merkez (Record Name: 20100308074737_2301, Station Code: 2301). The waveforms are band-pass filtered by acausal 4-pole/4-pole Butterworth filter. Zero pads
due to acausal filter transients are not shown for illustrative purposes.

32
Figure 23. Fourier acceleration spectra (top row) and 5-percent damped pseudo-spectral accelerations
(bottom row) of the processed ground motions recorded at Elazığ-Merkez (Record Name: 20100308074737_2301, Station Code: 2301).

33
Figure 24. Acceleration (top row), velocity (middle row) and displacement (bottom row) time series of the processed ground motions recorded at Elazığ-Palu (Record Name: 20100308074737_2303, Station Code: 2303). The waveforms are band-pass filtered by acausal 4-pole/4-pole Butterworth filter. Zero pads due to
acausal filter transients are not shown for illustrative purposes.

34
Figure 25. Fourier acceleration spectra (top row) and 5-percent damped pseudo-spectral accelerations
(bottom row) of the processed ground motions recorded at Elazığ-Palu (Record Name: 20100308074737_2303, Station Code: 2303).

35
Ground Motions of the 08/03/2010 08:11:20 Elazığ-Palu, Earthquake
Figure 26. Acceleration (top row), velocity (middle row) and displacement (bottom row) time series of the processed ground motions recorded at Elazığ-Palu (Record Name: 20100308081120_2303, Station Code: 2303). The waveforms are band-pass filtered by acausal 4-pole/4-pole Butterworth filter. Zero pads due to
acausal filter transients are not shown for illustrative purposes.

36
Figure 27. Fourier acceleration spectra (top row) and 5-percent damped pseudo-spectral accelerations
(bottom row) of the processed ground motions recorded at Elazığ-Palu (Record Name: 20100308081120_2303, Station Code: 2303).

37
Ground Motions of the 08/03/2010 09:00:46 Elazığ-Kovancılar, Earthquake
Figure 28. Acceleration (top row), velocity (middle row) and displacement (bottom row) time series of the
processed ground motions recorded at Bingöl-Merkez (Record Name: 20100308090046_1201, Station Code: 1201). The waveforms are band-pass filtered by acausal 4-pole/4-pole Butterworth filter. Zero pads
due to acausal filter transients are not shown for illustrative purposes.

38
Figure 29. Fourier acceleration spectra (top row) and 5-percent damped pseudo-spectral accelerations
(bottom row) of the processed ground motions recorded at Bingöl-Merkez (Record Name: 20100308090046_1201, Station Code: 1201).

39
Figure 30. Acceleration (top row), velocity (middle row) and displacement (bottom row) time series of the processed ground motions recorded at Elazığ-Palu (Record Name: 20100308090046_2303, Station Code: 2303). The waveforms are band-pass filtered by acausal 4-pole/4-pole Butterworth filter. Zero pads due to
acausal filter transients are not shown for illustrative purposes.

40
Figure 31. Fourier acceleration spectra (top row) and 5-percent damped pseudo-spectral accelerations
(bottom row) of the processed ground motions recorded at Elazığ-Palu (Record Name: 20100308090046_2303, Station Code: 2303).

41
Ground Motions of the 08/03/2010 10:14:23 Elazığ-Kovancılar, Earthquake
Figure 32. Acceleration (top row), velocity (middle row) and displacement (bottom row) time series of the
processed ground motions recorded at Bingöl-Merkez (Record Name: 20100308101423_1201, Station Code: 1201). The waveforms are band-pass filtered by acausal 4-pole/4-pole Butterworth filter. Zero pads
due to acausal filter transients are not shown for illustrative purposes.

42
Figure 33. Fourier acceleration spectra (top row) and 5-percent damped pseudo-spectral accelerations
(bottom row) of the processed ground motions recorded at Bingöl-Merkez (Record Name: 20100308101423_1201, Station Code: 1201).
43
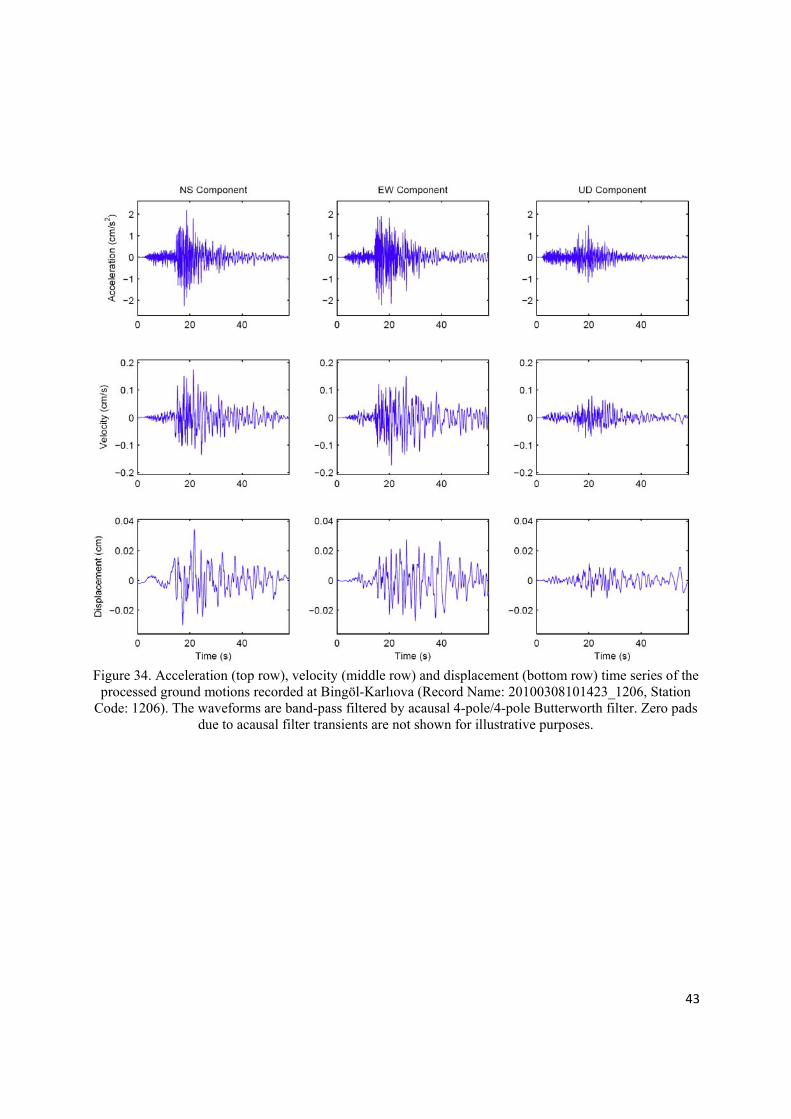
Figure 34. Acceleration (top row), velocity (middle row) and displacement (bottom row) time series of the
processed ground motions recorded at Bingöl-Karlıova (Record Name: 20100308101423_1206, Station Code: 1206). The waveforms are band-pass filtered by acausal 4-pole/4-pole Butterworth filter. Zero pads
due to acausal filter transients are not shown for illustrative purposes.

44
Figure 35. Fourier acceleration spectra (top row) and 5-percent damped pseudo-spectral accelerations
(bottom row) of the processed ground motions recorded at Bingöl-Karlıova (Record Name: 20100308101423_1206, Station Code: 1206).
45
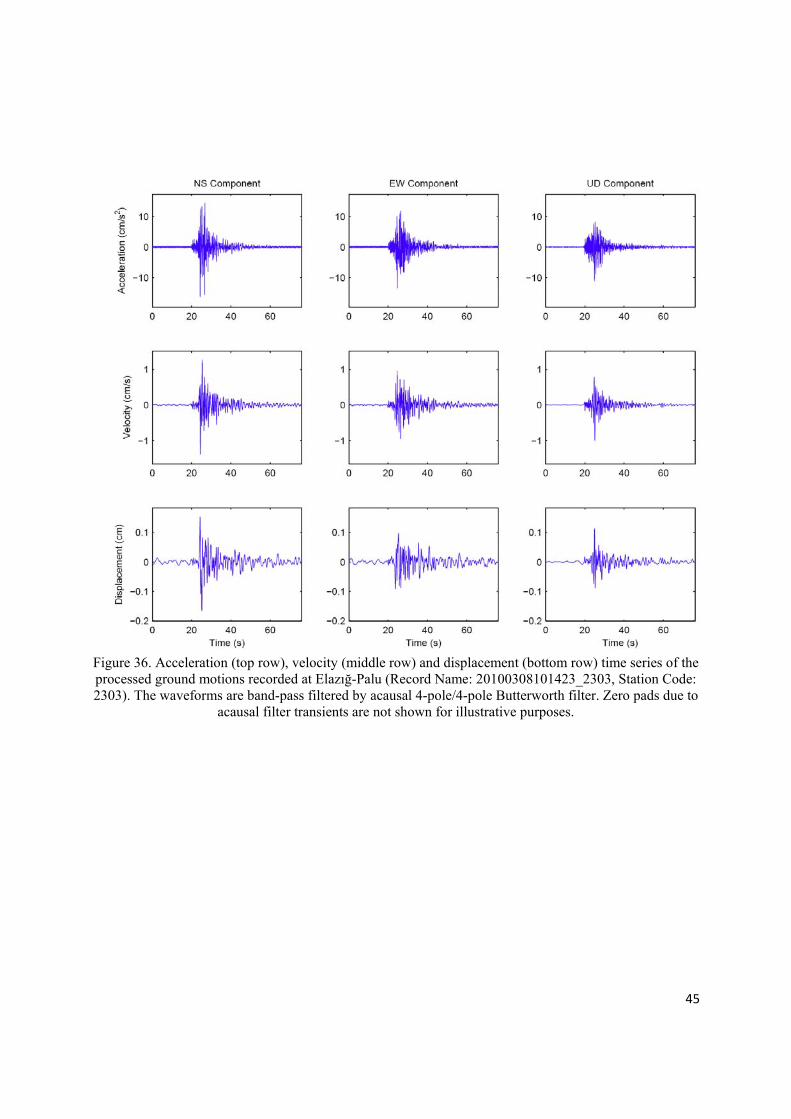
Figure 36. Acceleration (top row), velocity (middle row) and displacement (bottom row) time series of the processed ground motions recorded at Elazığ-Palu (Record Name: 20100308101423_2303, Station Code: 2303). The waveforms are band-pass filtered by acausal 4-pole/4-pole Butterworth filter. Zero pads due to
acausal filter transients are not shown for illustrative purposes.

46
Figure 37. Fourier acceleration spectra (top row) and 5-percent damped pseudo-spectral accelerations
(bottom row) of the processed ground motions recorded at Elazığ-Palu (Record Name: 20100308101423_2303, Station Code: 2303).

47
Ground Motions with Insufficient Digitizer Resolution (IDR) Problem
Figure 37. Unprocessed acceleration time series of the ground motions recorded at Elazığ-Palu (Record
Name: 20100308032022_2303, Station Code: 2303).
Figure 38. Unprocessed acceleration time series of the ground motions recorded at Elazığ-Palu (Record
Name: 20100308XXXXXX_2303, Station Code: 2303).