processable molecular pores functional porous composites ... filefunctional porous composites by...
TRANSCRIPT

Electronic Supplementary Information
Functional Porous Composites by Blending with Solution-Processable Molecular Pores
S. Jiang, L. Chen, M. E. Briggs, T. Hasell and A. I. Cooper*
Department of Chemistry, University of Liverpool, Liverpool L69 7ZD, UK
Table of contents
1. Experimental
Table S1. Synthesis of cage-pyrene composites with various pyrene loadingTable S2. Synthesis of cage-polymer composites with various polymer loading
2. Characterisation and Analysis
Figure S1. MALDI-TOF data for scrambled cages.
Figure S2. Powder XRD patterns for crystalline pyrene, amorphous scrambled cages, and cage-pyrene composites at various pyrene loading.
Figure S3. SEM images for pyrene (a), scrambled cages (b), and cage-pyrene composite with 16 wt.% pyrene loading (c).
Figure S4. (a) 1H-NMR spectra of scrambled cages (black), pyrene (red), and cage-pyrene composite with 16 wt.% pyrene loading (blue). (b) An enlarged view of chemical shift between 7.8 and 8.4 for pyrene. The peaks are assigned to the protons on aromatic rings of pyrene.
Figure S5. 1H-NMR spectrum of cage-pyrene composite with 16 wt.% pyrene loading
Figure S6. FTIR spectra for pyrene (black), scrambled cages (red) and cage-pyrene composite with 16 wt.% pyrene loading (blue).
Figure S7. Images of scramble cages (a) and cage-pyrene composite with 16 wt.% pyrene (b) under UV light with a wavelength of 254 nm.
Figure S8. The pyrene excimer/monomer (e/m) ratio in the composites plotted as function of the pyrene loading.
Electronic Supplementary Material (ESI) for ChemComm.This journal is © The Royal Society of Chemistry 2016

Table S3. BET surface areas, N2 uptakes and pore volumes comparison between scrambled cages, pyrene, and cage-pyrene composites with a various pyrene loading.
Figure S9. CO2 adsorption and desorption at 298 K for scrambled cages and cage-pyrene composites with a various pyrene loading.
Figure S10. BET surface areas for the cage-polymer composites measured by Quantachrome gas sorption instrument with a different polymer loading. The polymers include PMMA, PVP, PEI and PS.
Figure S11. 1H-NMR spectra of scrambled cages (black), PEI (red) and cage-PEI composite with 33 wt.% PEI loading (blue)
Figure S12. 1H-NMR spectrum of cage-PEI composite with 33 wt.% PEI loading
Figure S13. FTIR spectra for scrambled cages (black), PEI (red) and cage-PEI composite with 23 wt.% PEI loading (blue).
Figure S14: TGA analysis for PEI (black curve), amorphous scrambled cages (red curve), and cage-PEI composites at various PEI loading.
Figure S15. Powder XRD patterns for PEI, amorphous scrambled cages, and cage-PEI composites at various PEI loading.
Table S4. BET surface areas, N2 uptakes, and pore volumes comparison between scrambled cages, PEI and cage-PEI composites with a various PEI loading.

Experimental
Materials. 1,3,5-Triformylbenzene was purchased from Manchester Organics, (1R,2R)-(-)-
1,2-cyclohexanediamine was purchased from TCI-UK. 1,2-Diaminoethane, pyrene, polymers
were purchased from Sigma Aldrich. All other chemicals were purchased from Fisher and
used as received.
Synthesis of scrambled cages
The synthetic procedure has been described in the previous study.[1] Dichloromethane (DCM,
400 mL) was added to 1,3,5-triformylbenzene (5 g, 30.9 mmol) in a round flask at room
temperature. A solution of 1,2-diaminoethane (0.9 g, 15.4 mmol) in DCM (200 mL) and a
solution of (1R,2R)-(-)-1,2-cyclohexanediamine (3.5 g, 30.9 mmol) in DCM (200 mL) were
slowly added sequentially. After complete addition, the reaction was allowed to stir for 2–3
days at room temperature. A clear homogeneous solution was observed with no undissolved
material being present. The reaction mixture was concentrated on a rotary evaporator,
triturated with ethyl acetate then isolated by filtration to remove any unreacted starting
materials. The product was vacuum dried overnight before analysis. Typical yield after
washing = 70–75 %.
Synthesis of cage-pyrene composites
The scrambled cages (100 mg) were dissolved in DCM (20 mL) in a sample vial at room
temperature. A stock solution of pyrene in DCM (10 mg/mL) was made. The corresponding
pyrene solution was added into the scrambled cages solution to form composites. The four
cage-pyrene composites were prepared with a pyrene loading at 3 wt.%, 5 wt.%, 10 wt.%,
and 15 wt.%, respectively. The amounts are listed in table S1. The mixed solution was stirred
for a day. The products were obtained by evaporating the solvents using the rotary
evaporator. Accurate pyrene loading was verified by 1H-NMR and was consistent with the
expected 3 wt.%, 6 wt.%, 10 wt.%, or 16 wt.% loadings.
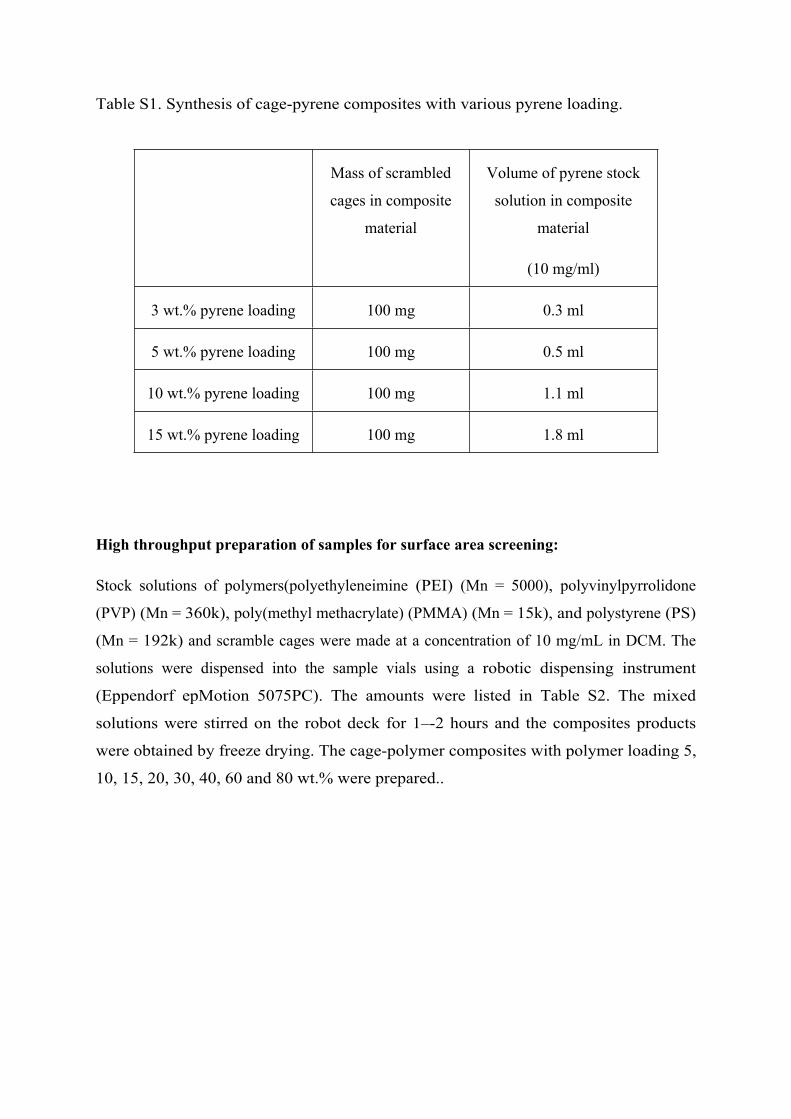
Table S1. Synthesis of cage-pyrene composites with various pyrene loading.
Mass of scrambled
cages in composite
material
Volume of pyrene stock
solution in composite
material
(10 mg/ml)
3 wt.% pyrene loading 100 mg 0.3 ml
5 wt.% pyrene loading 100 mg 0.5 ml
10 wt.% pyrene loading 100 mg 1.1 ml
15 wt.% pyrene loading 100 mg 1.8 ml
High throughput preparation of samples for surface area screening:
Stock solutions of polymers(polyethyleneimine (PEI) (Mn = 5000), polyvinylpyrrolidone
(PVP) (Mn = 360k), poly(methyl methacrylate) (PMMA) (Mn = 15k), and polystyrene (PS)
(Mn = 192k) and scramble cages were made at a concentration of 10 mg/mL in DCM. The
solutions were dispensed into the sample vials using a robotic dispensing instrument
(Eppendorf epMotion 5075PC). The amounts were listed in Table S2. The mixed
solutions were stirred on the robot deck for 1–-2 hours and the composites products
were obtained by freeze drying. The cage-polymer composites with polymer loading 5,
10, 15, 20, 30, 40, 60 and 80 wt.% were prepared..

Table S2. Synthesis of cage-polymer composites with various polymer loadings
wt.%
Volume of
polymer
solution/mL
Volume of
polymer
solution/mL
5 0.5 9.5
10 1 9
15 1.5 8.5
20 2 8
30 3 7
40 4 6
60 6 4
80 8 2
Synthesis of cage-PEI composites
Linear PEI (Mn = 5000 PDI < 1.2) was used. Due to its hydroscopic properties, PEI was
handled in a glove box.
The scrambled cages (100 mg) were dissolved in DCM (20 mL) in a round-bottomed flask at
room temperature. A stock solution of linear PEI in MeOH was prepared with a concentration
of 10 mg/mL. Five cage-PEI composites samples at different PEI loadings were
prepared, corresponding to 5 wt.%, 10 wt.%, 15 wt.%, 20 wt.%, and 30 wt.%. The
mixed solution was stirred for a day. The composites materials were obtained by
evaporating the solvents using the freeze drying. The samples were vacuumed dried
overnight before analysis. The PEI loading calculated from NMR was 5 wt.%, 9 wt.%, 17
wt.%, 23 wt.%, 3 and 3 wt.%.

Characterization and Analysis
Nuclear Magnetic Resonance (NMR) Spectroscopy. Solution 1H NMR spectra were
recorded at 400.13 MHz using a Bruker Avance 400 NMR spectrometer.
Fourier Transform Infrared Spectroscopy (FTIR). IR spectra were recorded using a
Bruker Tensor 27 FT-IR spectrometer with Quest ATR (diamond crystal puck) attachment
running Opus 6.5 software. Samples were analysed as dry powders for 16 scans with a
resolution of 4 cm-1. Spectra were recorded in transmission mode.
Thermogravimetric Analysis (TGA). TGA analysis was carried out using a Q5000IR
analyzer (TA instruments) with an automated vertical overhead thermobalance. The samples
were heated at the rate of 5 °C/min.
Analytical HPLC. HPLC data was obtained using a Dionex UltiMate 3000 system. The
column used for the analysis of scrambled cages was a Syncronis C8, 150 x 4.6 mm, 3 μm
(97203-154630, 12475). The mobile phase was methanol at a flow rate of 1 mL/min. The
column oven temperature was set to 30 °C. Detection for HPLC analysis was conducted at
254 nm.
Powder X-ray Diffraction. Powder X-ray diffraction data were collected on a Panalytical
X’pert pro multi-purpose diffractometer in transmission Debye-Scherrer geometry operating
with a Cu anode at 40 kV 40 mA. Samples were ground and mounted as loose powder onto a
transparent film and spun at 2s/rotation. PXRD patterns were collected in two 1-h scans with
a step size of 0.013º 2θ and scan time of 115 s/step over 5–50º 2θ. The incident X-ray beam
was conditioned with 0.04 rad Soller slits and an anti-scatter slit of 1/2º. The diffracted beam
passed through an automatic antiscatter slit (5 mm), 0.04 rad Soller slits and Ni filter before
processing by the PIXcel detector operating in scanning mode.
Scanning electron microscopy (SEM). High resolution imaging of the morphology was
achieved using a Hitachi S-4800 cold Field Emission Scanning Electron Microscope
(Hitachi). The dry samples were prepared on 15 mm Hitachi M4 aluminium stubs using an
adhesive high purity carbon tab. The samples were then coated with a 2 nm layer of gold

using an Emitech K550X automated sputter coater. The field emission scanning electron
microscope measurement scale bar was calibrated against certified standards. Imaging was
conducted at a working distance of 8 mm and a working voltage of 3 kV using a mix of upper
and lower secondary electron detectors.
Gas Sorption Analysis. All samples were tested with gases of the following purities:
hydrogen (99.9995%, BOC gases), carbon dioxide (SCF grade, BOC gases) and methane
(ultrahigh purity, BOC gases). Most surface areas and pore size distributions were measured
by nitrogen adsorption and desorption at 77.3 K using a Micromeritics ASAP 2020
volumetric adsorption analyzer. Samples were degassed at offline at 60 °C for 15 h under
dynamic vacuum (10-5 bar) before analysis, followed by degassing on the analysis port, also
at 80 °C. Carbon dioxide isotherms were measured at 273 and 293 K using a Micromeritics
2020 volumetric adsorption analyzer using the same degassing procedure. High throughput
samples were measured for 5-point BET on Quantachrome Nova 4200 Surface Area
Analyzers running in parallel, with 4 sorption ports each. Samples were run at 77 K, after
degassing at 90 °C for 12 h under dynamic vacuum.

Figure S1. MALDI-TOF data for scrambled cages. An enlarged view of m/z ratios between 900 and 1400 is concluded.
Calculated for CC1, CC1531, CC1432, CC1333, CC1234, CC1135, and CC3: 792, 846, 900, 954, 1008, 1062, and 1116, respectively. m/z ratios correspond to 955 [CC1333+H]+, 1009 [CC1234+H]+, 1031 [CC1234+Na]+, 1063 [CC1135+H]+, 1085 [CC1135+Na]+, 1117 [CC3+H]+,1139 [CC3+Na]+, 1181 [CC1333+Dithranol]+, 1235 [CC1234+Dithranol]+ and 1289 [CC1135+Dithranol]+. Dithranol, THF and NaI are the matrix for MALDI-TOF analysis.

Position [°2Theta] (Copper (Cu))
10 20 30
Counts
0
1000
2000
3000
0
1000
0
50
100
0
50
100
0
50
100
0100
200300
G7_Pyrene_AIC-HTtrans-BATCH-60min
F1_Scrambled cages_AIC-HTtrans-BATCH-60min
H2_SJ2-2_AIC-HTtrans-BATCH-60min
H3_SJ2-3_AIC-HTtrans-BATCH-60min
H5_SJ2-4_AIC-HTtrans-BATCH-60min
H7_SJ2-1_AIC-HTtrans-BATCH-60min
Pyrene
Scrambled cages
3 wt.% pyrene loading
6 wt.% pyrene loading
10 wt.% pyrene loading
16 wt.% pyrene loading
Figure S2. Powder XRD patterns for crystalline pyrene, amorphous scrambled cages, and
cage-pyrene composites at various pyrene loading. The composite materials show amorphous
phases.

(a)
(b)
(c)
Figure S3. SEM images for pure pyrene (a), pure scrambled cages (b) and a cage-pyrene
composite with 16 wt.% pyrene loading (c).
10 8 6 4 2 0
Scrambled cages Pyrene Cages+Pyrene
8.4 8.2 8.0 7.8
Pyrene
H1 H6
H2
H3 H4
H5
H7H8H9
H10
(a)
(b)
H1 and H6
H2, H5, H7 and H10
H3, H4, H8 and H9
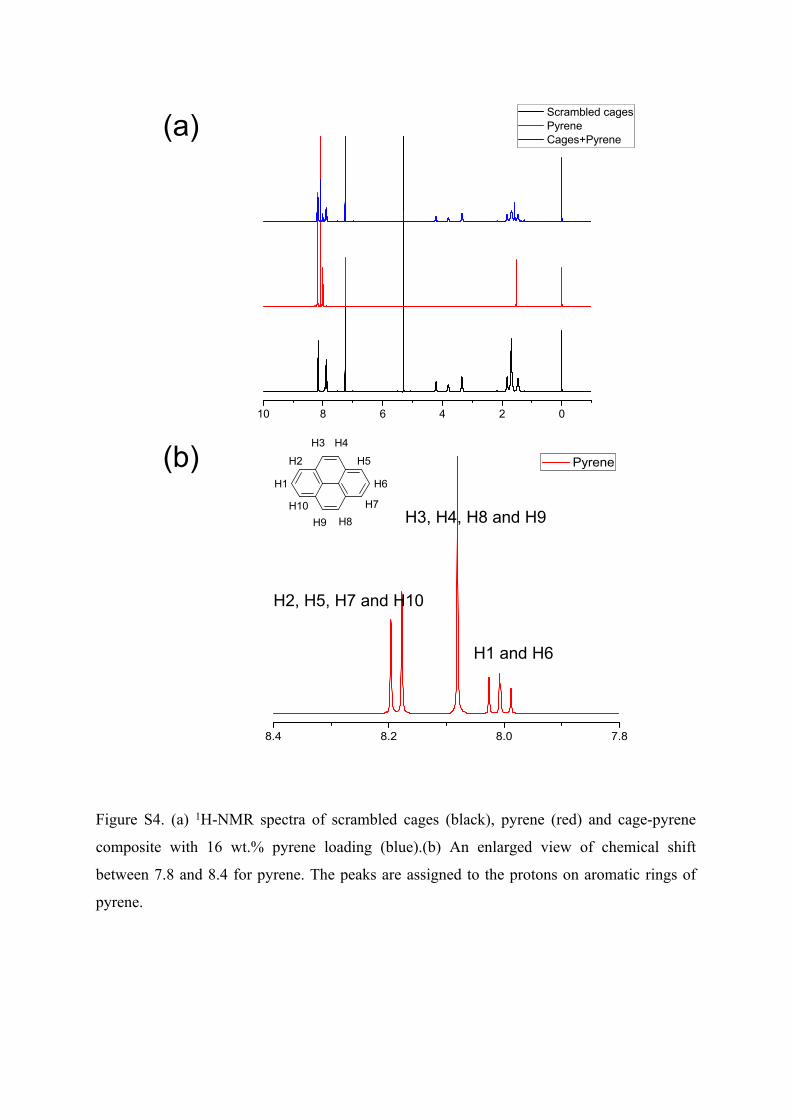
Figure S4. (a) 1H-NMR spectra of scrambled cages (black), pyrene (red) and cage-pyrene
composite with 16 wt.% pyrene loading (blue).(b) An enlarged view of chemical shift
between 7.8 and 8.4 for pyrene. The peaks are assigned to the protons on aromatic rings of
pyrene.

Figure S5. 1H-NMR spectra of cage-pyrene composite with 16 wt.% pyrene loading. The
triplet peaks at ~ 8.02 ppm are assigned to the protons on aromatic rings of pyrene with 2H.
The multiple peaks at ~ 7.9 ppm are consistent with protons on aromatic rings of scrambled
cages with 12H. The integration of the peak area at ~8.02 ppm is 1, compared with 0.53 of
the integration of the peak area ~7.9 ppm. The accurate pyrene loading can be calculated by
the integrations of two peak areas.

Figure S6. FTIR spectra for pyrene (black), scrambled cages (red) and cage-pyrene composite
with 16 wt.% pyrene loading (blue).
4000 3500 3000 2500 2000 1500 1000 500
Tran
sim
issi
on
Wavenumber (cm-1)
Pyrene Scrambled cages 16 wt.% pyrene loading composite
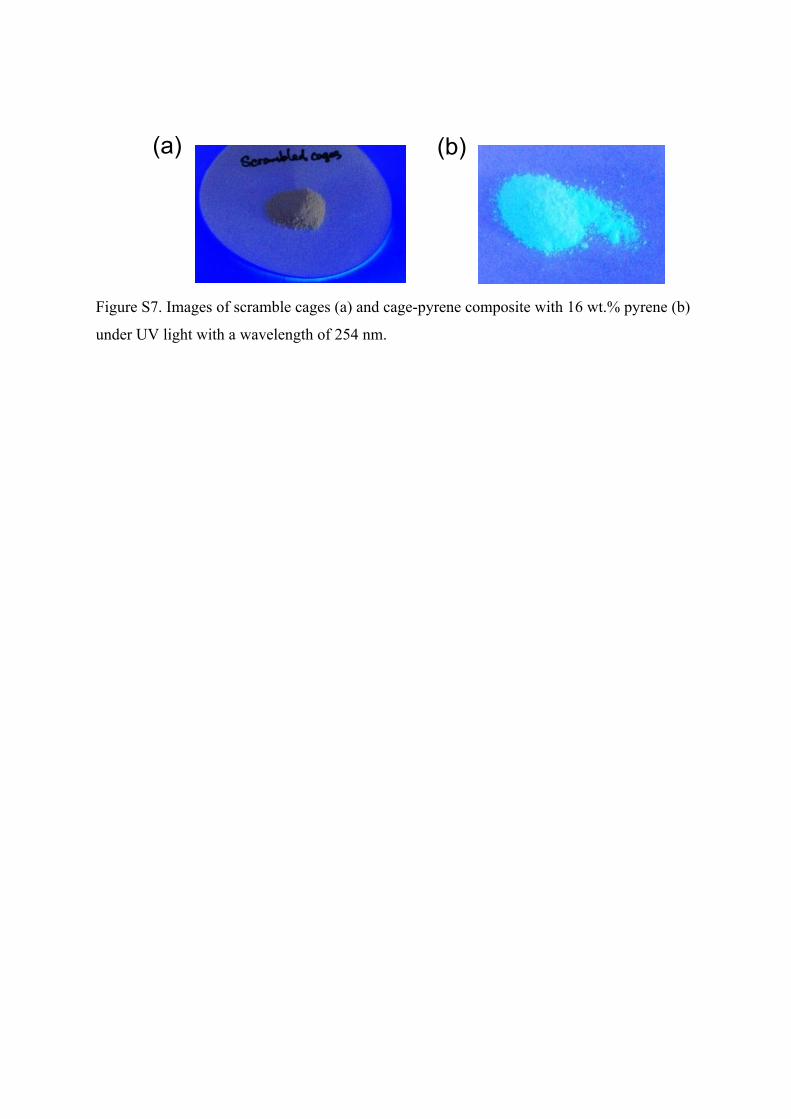
Figure S7. Images of scramble cages (a) and cage-pyrene composite with 16 wt.% pyrene (b)
under UV light with a wavelength of 254 nm.
(a) (b)

0 2 4 6 8 10 12 14 16
0
2
4
6
8
10
12
e/m
ratio
Pyrene loading (Weight %)
Figure S8. The pyrene excimer/monomer (e/m) ratio in the composites plotted as function of the pyrene loading. The e/m ratio was calculated by comparing the fluorescence intensity of the excimer band at 470 nm to the first monomer peak at 373 nm.
BET Surface areas
(m2 g-1)
N2 uptakes
(mmol g-1)
(1 bar, 77 K)
t-plot pore volumes
(cm3 g-1)
Scrambled cages 718 11.29 0.26
Pyrene N/A 0.26 N/A
Composites with 3 wt.% pyrene loading
635 9.14 0.23
Composites with 6 wt.% pyrene loading
513 7.98 0.19
Composites with 10 wt.% pyrene loading
197 3.02 0.076
Composites with 16 wt.% pyrene loading
N/A 0.83 N/A
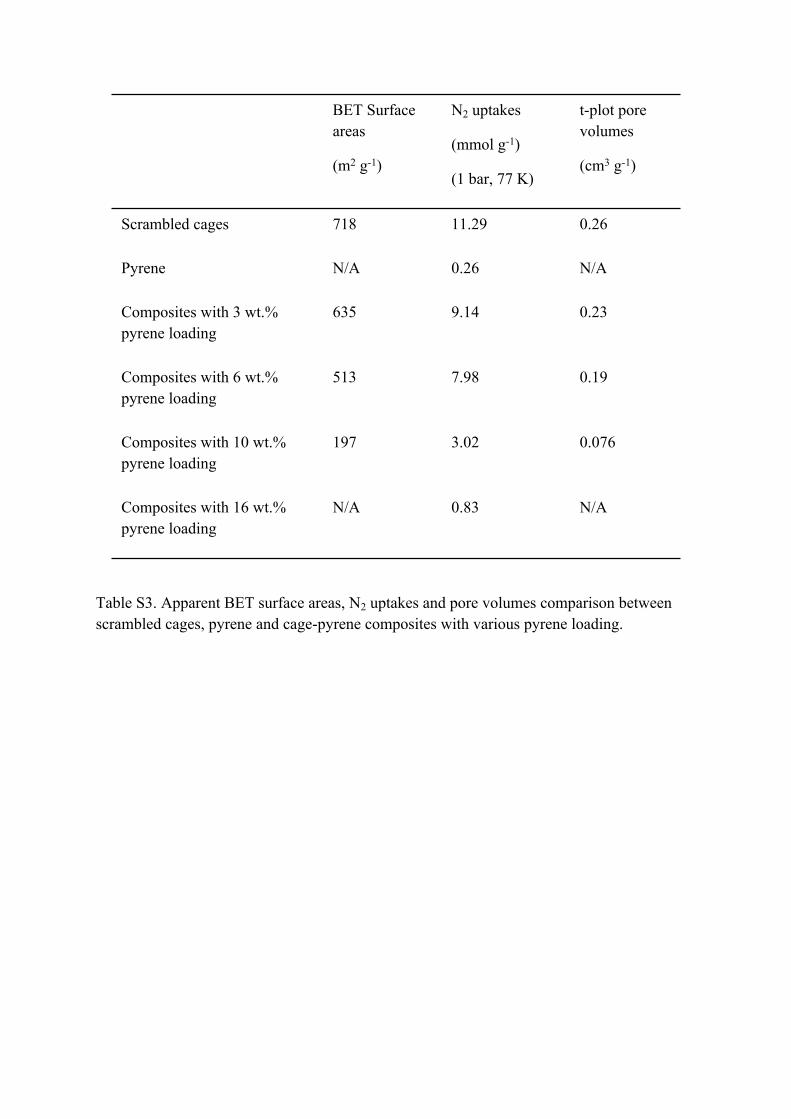
Table S3. Apparent BET surface areas, N2 uptakes and pore volumes comparison between scrambled cages, pyrene and cage-pyrene composites with various pyrene loading.

0 200 400 600 800 10000.0
0.2
0.4
0.6
0.8
1.0
1.2
1.4
1.6
Qua
ntity
Ads
orbe
d (m
mol
/g)
Absolute pressure (mbar)
Scrambled cages 3 wt.% pyrene loading 6 wt.% pyrene loading 10 wt.% pyrene loading 16 wt.% pyrene loading
Figure S9. CO2 adsorption and desorption at 298 K for scrambled cages and cage-pyrene composites with a various pyrene loading.

5% 10% 15% 20% 30% 40% 60% 80% 100% --
0
50
100
150
200
250
300
350
400
450 PMMA PVP PEI PS
BET
SA (m
2 g-1)
Polymer loading (wt.%)
Figure S10. BET surface areas for the cage-polymer composites measured using a Quantachrome gas sorption instrument with a different polymer loading. The polymers include poly(methyl methacrylate) (PMMA), polyvinylpyrrolidone (PVP), polyethyleneimine (PEI) and polystyrene (PS).

10 8 6 4 2 0
Scrambled cages PEI Cages+PEI
Figure S11. 1H-NMR spectra of scrambled cages (black), PEI (red) and cage-PEI composite
with 33 wt.% PEI loading (blue).

-4-3-2-101234567891011f1 (ppm)
-100
0
100
200
300
400
500
600
700
800
900
1000
1100
1200
1300
1400
1500
1600
1.00
0.89
Figure S12. 1H-NMR spectra of cage-PEI composite with 33 wt.% PEI loading. The peak at
2.73 ppm is assigned to the protons of the linear PEI backbone N-CH2. The multiple peaks at
~ 7.9 ppm are consistent with protons on aromatic rings of scrambled cages with 12H. The
accurate PEI loading can be calculated by the integrations of two peak areas.

4000 3500 3000 2500 2000 1500 1000 500
Tran
sim
issi
on
Wavenumber (cm-1)
Scrambled cages PEI 23 wt.% PEI loading composite
Figure S13. FTIR spectra for scrambled cages (black), PEI (red) and cage-PEI composite
with 23 wt.% PEI loading (blue).

4.429% 10.79%
21.08%
20
40
60
80
100
Weight (%)
20 120 220 320 Temperature (°C)
PEI ––––––– Scrambled cages ––––––– 5 wt.% PEI loading ––––––– 9 wt.% PEI loading ––––––– 23 wt.% PEI loading –––––––
Figure S14: TGA analysis for PEI (black curve), amorphous scrambled cages (red curve), and
cage-PEI composites at various PEI loading. The weight loss at 320 ºC agrees with the
amount of PEI loading.

Position [°2Theta] (Copper (Cu))
10 20 30 40
Counts
0
1000
0
500
1000
0200
400
600
800
0
500
1000
0
500
1000
F1_Scrambled cages_AIC-HTtrans-BATCH-60min
A6_PEI_AIC-HTtrans-BATCH-60min
C6_SJ41-2-5%_AIC-HTtrans-BATCH-60min
C7_SJ41-2-23%_AIC-HTtrans-BATCH-60min
C8_SJ41-2-33%_AIC-HTtrans-BATCH-60min
Scrambled cages
5 wt.% PEI loading
23 wt.% PEI loading
33 wt.% PEI loading
PEI
Figure S15. Powder XRD patterns for PEI, amorphous scrambled cages, and cage-PEI
composites at various PEI loading. The composite materials show amorphous phases. The
peaks shown for scrambled cages at 38º and 45º correspond to the aluminium of the sample
holder.

BET Surface areas
(m2 g-1)
N2 uptakes
(77 K)
(mmol g-1)
CO2 uptakes
(1.2 bar
298 K)
(mmol g-1)
Micropore volumes
(cm3 g-1)
Scrambled cages 718 11.26 1.48 0.26
PEI N/A N/A 1.47 N/A
Composites with 5 wt.% PEI loading
540 9.90 1.93 0.22
Composites with 9 wt.% PEI loading
496 8.98 1.93 0.20
Composites with 17 wt.% PEI loading
250 4.98 2.08 0.092
Composites with 23 wt.% PEI loading
215 4.26 1.95 0.077
Composites with 33 wt.% PEI loading
164 3.21 1.86 0.064
Table S4. BET surface areas, N2 uptakes and pore volumes comparison between scrambled cages, PEI and cage-PEI composites with a various PEI loading.
Reference:
[1] S. Jiang, J. T. A. Jones, T. Hasell, C. E. Blythe, D. J. Adams, A. Trewin and A. I. Cooper, Nat. Commun., 2011, 2, 207.