process engineering and industrial management (dal pont/process engineering and industrial...
TRANSCRIPT

Chapter 7
Lifecycle Analysis and Eco-Design:Innovation Tools for Sustainable
Industrial Chemistry
7.1. Contextual elements
7.1.1. The lessons of Easter Island
The dramatic story of the Easter Islanders is, now more topical than ever and alesson to remember for the sustainable development of our civilization. On EasterSunday in 1722, the fleet of the Dutch admiral Jacob Roggeveen reaches the coast ofthe island Rapa Nui, “the great distant” in Maori language. Roggeveen was thereforethe first European to set foot on this island, one of the most desolate and mostuninhabited places on Earth. One hundred and sixty square kilometers that stretch inthe Pacific Ocean, at 3,700 km from the Chilean coast and at 2,300 km from thenearest inhabited land, Pitcairn Island. The colonization of Easter Island belongs tothe last phase of the long expansion movement of men across the globe during the5th Century AD. Initially, the first Polynesians came from Southeast Asia, reachedthe Tonga and Samoa islands around 1,000 BC. From there, they moved to the eastof the Marquesas Islands about 300 AD then, from the 5th to 9th Century, to EasterIsland in the south east, Hawaii in the north, the Society Islands and then finallyNew Zealand. Once this colonization was carried out, Polynesians were the peoplemost widely spread on Earth, occupying a huge triangle from Hawaii in the north toNew Zealand in the south west and the Easter Island in the south: which is twice thearea nowadays of the current United States.
Chapter written by Sylvain CAILLOL.
© 2012 ISTE Ltd. Published 2012 by ISTE Ltd.Process Engineering and Industrial Management Edited by Jean-Pierre Dal Pont

234 Process Engineering and Industrial Management
And when Roggeveen arrived on this island, he discovered a primitive society ofsome 3,000 people living in miserable reed huts or caves, in almost permanent stateof war and forced to cannibalism to improve the meager available food resources.Yet, amid this misery and barbarism, the early European explorers discovered on thisland the evidence of an ancient society. Indeed throughout the island lay more than600 stone statues of at least 6 m in height. 20th Century anthropologists who havestudied the history and culture of Easter islanders have established that these statuescould never be the work of the destitute and primitive population discovered bythe 18th Century colonists, but had been made by a once thriving and developedsociety.
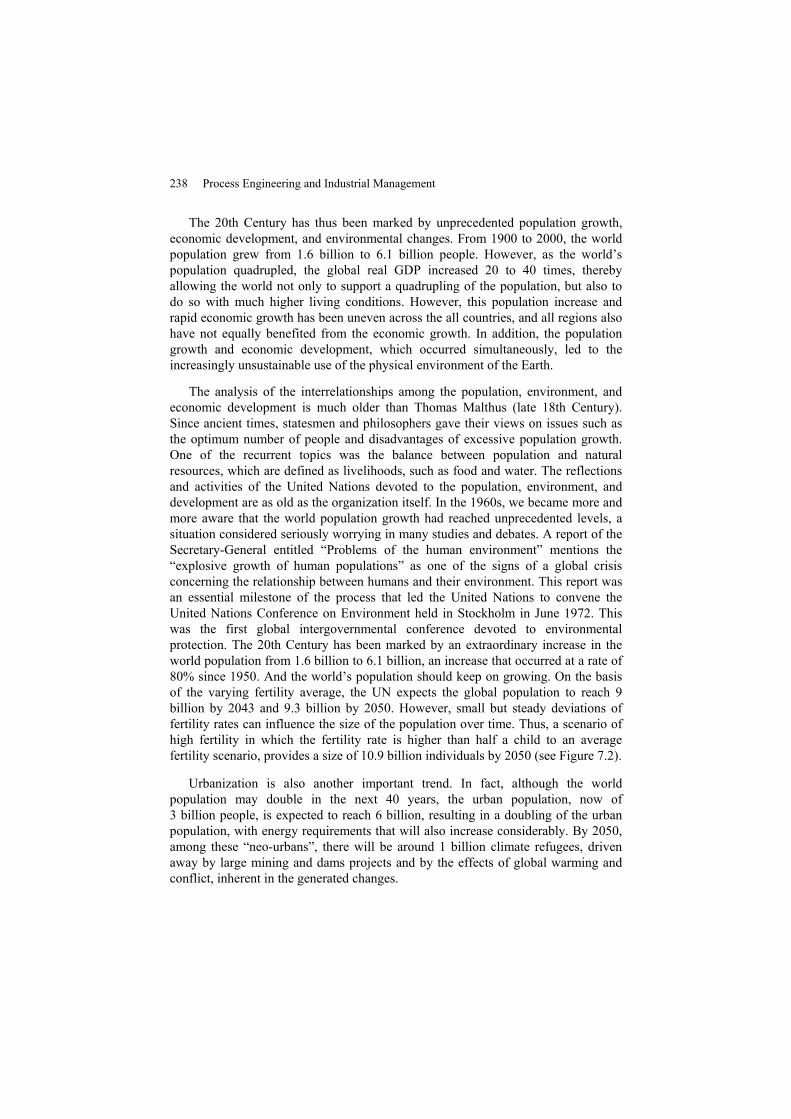
Resulting from the about 30 Polynesians who originally colonized the islandRapa Nui in the 5th Century, the Easter Island society flourished and reached apopulation of over 7,000 inhabitants at the height of its civilization, in the 1500s.The Easter Islanders took most of their resources from the trees of the forests: energyfor heating and cooking food, wood for building their houses, and fishing boats, formaking weapons and nets for hunting and fishing, and organic enrichment of soil foragriculture. The villages were then spread all over the island in small groups of hutssurrounded by cultivated fields. Social activities took place in ceremonial centersaround the monuments of “ahu”, vast stone platforms similar to those found in otherparts of Polynesia. They were used for burials, ancestor worship, and celebrations inthe honor of the missing leaders. The Easter Island society was the most advancedPolynesian society of all and one of the most complex in the world considering thelimited resources available. Islanders shared most of their time between elaboraterituals and the construction of religious monuments. Over 300 platforms were builton the island. Most of them were built according to sophisticated astronomicalalignments, directed toward one of the solstices or the equinox. This is evidence of ahigh level of intellectual achievement. At each site there rose between 1 and 15 ofthe monumental stone statues that have survived today, the only vestige of thedisappeared Easter Island society. They represented a male torso and a headcrowned with a “bun” of red stone carved in stone quarries, weighing about 10 tons.The shape of the stones was made in various quarries on the island. The maindifficulty was in transporting these monumental works across the island, and thenerecting them at the top of the “ahu” (see Figure 7.1). The solution to this problemfound by the islanders was also an element of ruin ... because of the absence ofbeasts of burden, they had to use a very large human labor to haul the statues byusing tree trunks as rollers.
The rise in population led them to reduce forest areas to convert them intosettlements and cultivable lands. And trees that are certainly a renewable resource,were consumed at a rate greater than their ability to renew themselves ... In a fewdecades, population growth was the cause of increased crop production, which led toland impoverishment and the reduction of forest area, thereby leading to soil

Lifecycle Analysis and Eco-Design 235
erosion. Forest resources became scarce. As the population increased, they had tocut down more trees to provide land for agriculture, fuel for heating and cooking,construction material for houses, canoes for fishing, and trucks to transport thestatues. Very large amounts of wood were consumed, and one day, there was notenough wood anymore ... and 600 stone giants, which had required so much woodfor their erection, became witnesses to the extinction of this civilization.
Figure 7.1. Photo: Yann Payoux, 2009
In fact, the lack of trees continued until the complete disappearance of thisresource. The social and cultural impacts of deforestation were very important. Theinability to erect new statues must have had a devastating effect on belief systemsand social organization and challenged the many foundations on which this complexsociety was built. But the deforestation of the island did not only just mark the endof a sophisticated social or religious life: it also had dramatic effects on the people’sdaily life. Thus, the tree shortage forced many people not to build any more woodenhouses, but to live in caves. When about a century later wood completelydisappeared, everyone had to make do with the troglodyte caves dug into thehillsides or flimsy huts of reeds cut from the vegetation that grew along crater lakes.It was no longer possible anymore to build canoes: reed boats did not allow them toundertake long journeys. Fishing also became more difficult because the mulberrywood with which they made nets was not available any more. The loss of forestcover further impoverished the soil of the island, which was already suffering from alack of suitable animal manure to replace the nutrients absorbed by crops. Increased

236 Process Engineering and Industrial Management
exposure to bad weather worsened erosion and made crop yields fall rapidly. Poultrybecame the main source of food. As their numbers increased, they had to preventtheft. But there were not enough to keep 7,000 inhabitants alive, and therefore thepopulation declined rapidly. From 1600, the society in decline, Easter Islandregressed to an even more primitive level of life. Deprived of trees and canoes, theislanders found themselves as prisoners thousands of kilometers from their nativeland, unable to escape from the consequences of the collapse of their environmentfor which they were responsible themselves: a massive degradation of theenvironment caused by the island deforestation.
Thus, if the first discoverers of the island in the 18th Century found it completelycleared with the exception of a few isolated trees at the bottom of the deepest craterof the island, contemporary scientific studies have proven that Rapa Nui had a thickvegetal cover in the 5th Century.
7.1.2. On the carrying capacity
This instructive historical example enables us to put the emphasis on theimportance of a wise usage of our resources, whatever they are insofar as theconcept of renewal capacity of any resource is intimately subjected to the rate of itsconsumption. This concept is developed in the concept of carrying capacity.
Carrying capacity, in agronomy, is defined as the number of animals (maximumor optimum) that a territory can tolerate without causing any damage to plant andsoil resources. And we define overshoot, as the growth of a population beyond thecarrying capacity of its region. These concepts are widely used in natural resourcemanagement. These fundamental concepts thus partly determine the bases forsustainable development:
– a rate of consumption of renewable resources that does not exceed theirregeneration capacity;
– a rate of consumption of non-renewable resources not exceeding thedevelopment of alternative resources;
– a quantity of waste and pollution that does not exceed what can be absorbed bythe environment.
Thus, life and Earth sciences and social sciences have offered various modelsfor the study of the relationships between the population and environment,especially decomposition models (or multiplicative models). In these models, thetotal impacts on the environment are considered to be the product of population size,level of wealth or of consumption/production per inhabitant, and the levelof environmentally harmful technologies. The empirical applications of this type of

Lifecycle Analysis and Eco-Design 237
model were used to examine the increased use of specific resources, or discharge ofspecific pollutants associated with the increased supply of various goods or services.The results are more heterogeneous with respect to the role of demographic factors.But these models are still well summarized by the IPAT equation [7.1] of Ehrlichand Holdren. This equation is defined as:
I = P × A × T [7.1]
with:
– I = impacts: resource use, emissions of pollutants;
– P = population;
– A = abundance, wealth determined by GDP/person that defines the level ofconsumption;
– T = technology that quantifies the impacts/GDP;
– GDP: gross domestic product. It is an economic indicator that measures theproduction level of a country. It is defined as the total value of domestic productionof goods and services in a given country during a given year by the actors residingwithin the country.
Population and abundance are the quantities defined, subjected, insofar as we donot seek to reduce them in our civilization. Therefore, the only factor that can allowus to reduce the impacts I, is the factor T of technology.
If we now introduce the concept of eco-design, it should lead us to seek themeans to reduce the factor T of impacts/GDP.
7.2. The chemical industry mobilized against upheavals
7.2.1. Global turmoils
Our company has recently become aware – on the human scale– that it wasmortgaging its collective future to meet its need for individual wealth. As long asthere were only a few hundred million people on Earth to share most of the wealthand generate, consequently, most of the anthropogenic pollution, the balance –questionable, certainly – was maintained – Vilfredo Pareto’s laws are thus made.But with the arrival in the last decades of nearly 3 billion people, Indians, Chinese,and so on, that claim – rightfully so – a high level of consumption, and with theprospect of an increasing world population in the forthcoming years, theinternational community calls for sustainable development: to establish a new trulysustainable balance.
238 Process Engineering and Industrial Management
The 20th Century has thus been marked by unprecedented population growth,economic development, and environmental changes. From 1900 to 2000, the worldpopulation grew from 1.6 billion to 6.1 billion people. However, as the world’spopulation quadrupled, the global real GDP increased 20 to 40 times, therebyallowing the world not only to support a quadrupling of the population, but also todo so with much higher living conditions. However, this population increase andrapid economic growth has been uneven across the all countries, and all regions alsohave not equally benefited from the economic growth. In addition, the populationgrowth and economic development, which occurred simultaneously, led to theincreasingly unsustainable use of the physical environment of the Earth.
The analysis of the interrelationships among the population, environment, andeconomic development is much older than Thomas Malthus (late 18th Century).Since ancient times, statesmen and philosophers gave their views on issues such asthe optimum number of people and disadvantages of excessive population growth.One of the recurrent topics was the balance between population and naturalresources, which are defined as livelihoods, such as food and water. The reflectionsand activities of the United Nations devoted to the population, environment, anddevelopment are as old as the organization itself. In the 1960s, we became more andmore aware that the world population growth had reached unprecedented levels, asituation considered seriously worrying in many studies and debates. A report of theSecretary-General entitled “Problems of the human environment” mentions the“explosive growth of human populations” as one of the signs of a global crisisconcerning the relationship between humans and their environment. This report wasan essential milestone of the process that led the United Nations to convene theUnited Nations Conference on Environment held in Stockholm in June 1972. Thiswas the first global intergovernmental conference devoted to environmentalprotection. The 20th Century has been marked by an extraordinary increase in theworld population from 1.6 billion to 6.1 billion, an increase that occurred at a rate of80% since 1950. And the world’s population should keep on growing. On the basisof the varying fertility average, the UN expects the global population to reach 9billion by 2043 and 9.3 billion by 2050. However, small but steady deviations offertility rates can influence the size of the population over time. Thus, a scenario ofhigh fertility in which the fertility rate is higher than half a child to an averagefertility scenario, provides a size of 10.9 billion individuals by 2050 (see Figure 7.2).
Urbanization is also another important trend. In fact, although the worldpopulation may double in the next 40 years, the urban population, now of3 billion people, is expected to reach 6 billion, resulting in a doubling of the urbanpopulation, with energy requirements that will also increase considerably. By 2050,among these “neo-urbans”, there will be around 1 billion climate refugees, drivenaway by large mining and dams projects and by the effects of global warming andconflict, inherent in the generated changes.

Lifecycle Analysis and Eco-Design 239
ProjectionscenarioConstant
High
Medium
Low
Popu
latio
n(i
nbi
llio
ns)
Year
Figure 7.2. World population projections under different scenariosof projection, 1950–2050 (Source: UN)
In the forthcoming years, the expected population growth will also beaccompanied by an increase in consumption per person. The first item ofconsumption will be energy consumption. Thus, IEA estimates lead us to imagineseveral worrying scenarios that might arise by 2050: a doubling to tripling of energyconsumption compared to 11 Gtoe consumed in 2007!
Similarly, the Global Footprint Network has identified the global overshoot daythe 23 September 2008. This means that between January 1 and September 23, 2008,people have consumed the resources that nature can theoretically produce in a year.
Thus, from September 24, 2008, and until the end of the year, people have livedbeyond their means, overexploiting the environment and undermining its capacity toregenerate. According to the calculations of the Global Footprint Network,

240 Process Engineering and Industrial Management
humanity’s needs began to exceed the productive capacity of the Earth in 1986.Since then, as a result of the world population growth, the date when mankind hasexhausted the resources theoretically produced in a year has been reached earlier andearlier. In 1996, our consumption exceeded 15% of the production capacity of thenatural environment, and the “global overshoot day” fell in November. In 2007, itwas October 6. In 2008, we have exploited the planet to 140%. Certainly, theaccuracy of the calculations to arrive at this result can be challenged, but one thing iscertain: we are in a bubble, and humanity is now living on credit.
7.2.2. New constraints of industrial chemistry
In addition, our society is currently based on the almost exclusive use of fossilfuels, especially for energy supply and consumer goods. The question is not to knowwhether there will be a peak production but rather when it will occur. In deed,almost all experts agree on the amount and duration of our global reserves of oil,coal, gas, nuclear fuel, and so on, based on our current consumption rate. Thus, atthe end of this century, we will have exhausted all the land reserves that nature hastaken millions of years to form. And yet this exploitation of fossil fuel resources –fossil carbon – is accompanied by a transfer of material, the transfer of carbon,which by oxidation (and a fortiori by combustion) will take the form of CO2 in ouratmosphere; accumulating and contributing to the increase in the concentration ofthe famous greenhouse gas emissions, which are responsible for the rise in averageglobal temperatures.
NorthAmerica
SouthAmerica
FormerSovietUnion
Europe MiddleEast
Africa AsiaOceaniacountries
World
Figure 7.3. Oil stocks in the world (in years of production in 2005)(Source: BP statistical review, 2007)
These matters are all constraints on industry and, in particular, the chemicalindustry – the industry of industries, since over two-thirds of its products are
Lifecycle Analysis and Eco-Design 241
intended for downstream industries. And because of these constraints, the chemicalindustry will undergo a revolution that is based on:
– anticipating the exhaustion of raw materials resulting from the fossil fuels witha higher price volatility. Thus, over the period of 2002–2007, the price of butadiene,a compound obtained directly by steam cracking of naphtha, has increased almost bya factor of 4. And the unequal distribution of fossil fuels, particularly oil, gives riseto significant speculations that jeopardize a stable supply (see Figure 7.3);
– an obligation to drastically reduce the polluting emissions of chemicalprocesses and in particular the release of greenhouse gases (CO2, NOx, etc.).
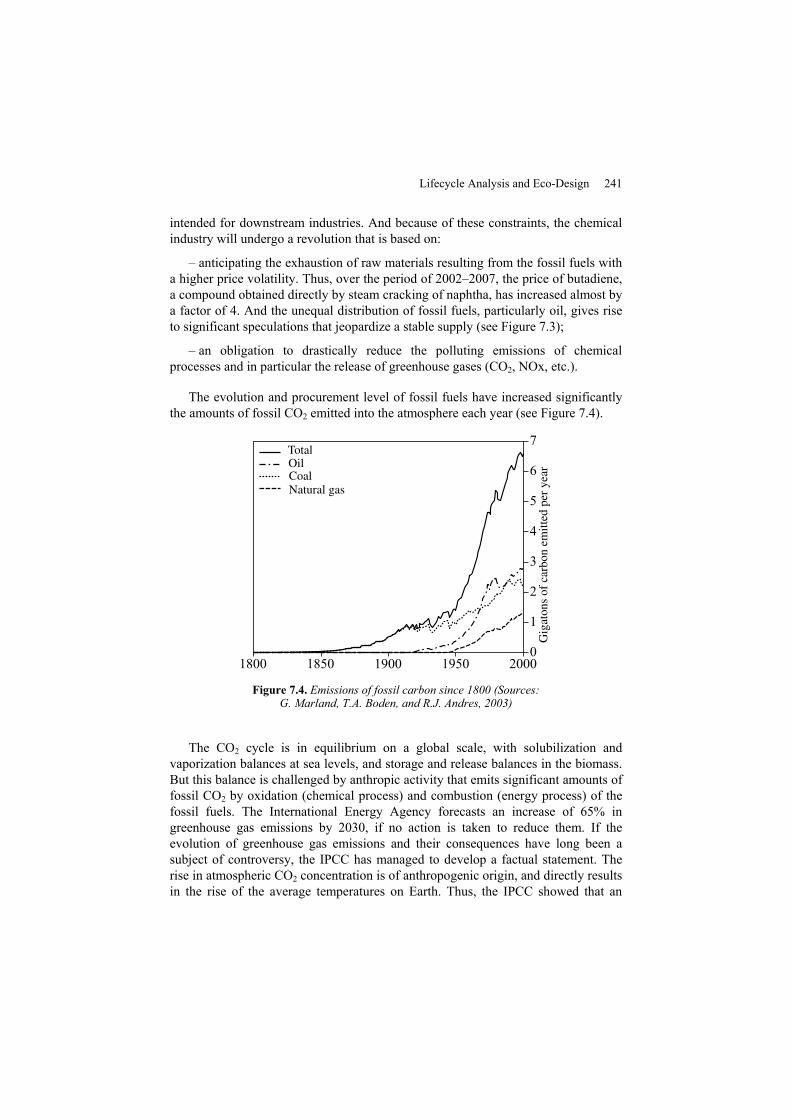
The evolution and procurement level of fossil fuels have increased significantlythe amounts of fossil CO2 emitted into the atmosphere each year (see Figure 7.4).
Gig
aton
sof
carb
onem
itted
per
year
TotalOilCoalNatural gas
Figure 7.4. Emissions of fossil carbon since 1800 (Sources:G. Marland, T.A. Boden, and R.J. Andres, 2003)
The CO2 cycle is in equilibrium on a global scale, with solubilization andvaporization balances at sea levels, and storage and release balances in the biomass.But this balance is challenged by anthropic activity that emits significant amounts offossil CO2 by oxidation (chemical process) and combustion (energy process) of thefossil fuels. The International Energy Agency forecasts an increase of 65% ingreenhouse gas emissions by 2030, if no action is taken to reduce them. If theevolution of greenhouse gas emissions and their consequences have long been asubject of controversy, the IPCC has managed to develop a factual statement. Therise in atmospheric CO2 concentration is of anthropogenic origin, and directly resultsin the rise of the average temperatures on Earth. Thus, the IPCC showed that an
242 Process Engineering and Industrial Management
increase in CO2 emissions in the 20th Century is responsible for an average rise oftemperature of 0.3°C. The current concentration of CO2 in the atmosphere is 385ppm. Several scenarios are imagined for the 21st Century, depending on thestabilization level of CO2 concentration. In the “medium” scenario, theconcentration would reach 700 ppm, which would cause an increase in temperatureof 3°C by the end of this century, accompanied with a rise in sea levels from 25 cmto 50 cm. In addition, Nicholas Stern has tried to estimate the cost of climate changeand estimated in 2006 to about 5,500 billion of dollars, the optimistic scenariocorresponding to the consequences of a rise to 550 ppm of CO2;
– a strong regulatory pressure on toxicology and environmental toxicologyrelated to the use of raw materials, synthetic intermediates, and products fromchemical industry, with especially the REACH regulation, the Water FrameworkDirective WFD, but also many European directives regarding the end of life ofmaterials (ELV directives, waste electrical and electronic equipment WEEE,directive on volatile organic compounds VOC emitted by paints, varnishes andvehicle refinishing products, etc.).
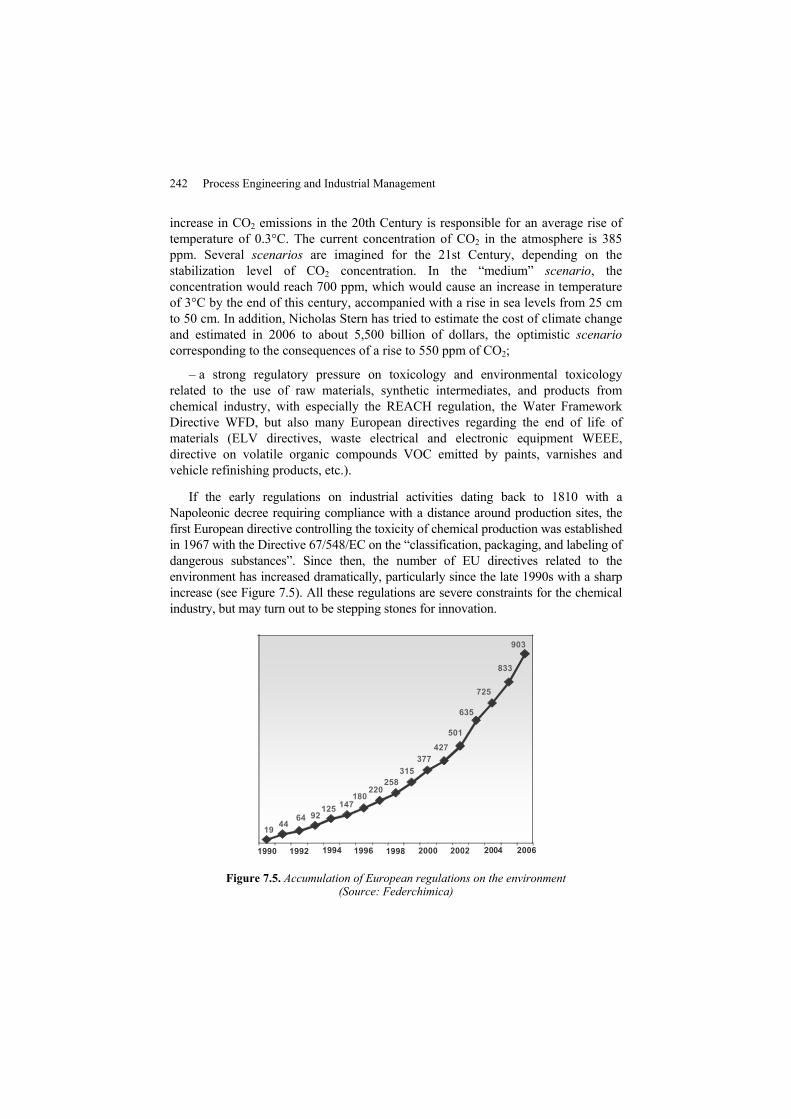
If the early regulations on industrial activities dating back to 1810 with aNapoleonic decree requiring compliance with a distance around production sites, thefirst European directive controlling the toxicity of chemical production was establishedin 1967 with the Directive 67/548/EC on the “classification, packaging, and labeling ofdangerous substances”. Since then, the number of EU directives related to theenvironment has increased dramatically, particularly since the late 1990s with a sharpincrease (see Figure 7.5). All these regulations are severe constraints for the chemicalindustry, but may turn out to be stepping stones for innovation.
20061990 1992 1994 1996 1998 2000 2002 2004
19 4464 92
125 147180
220258
315377
427
501
635
725
833
903
Figure 7.5. Accumulation of European regulations on the environment(Source: Federchimica)
Lifecycle Analysis and Eco-Design 243
Therefore, covering the needs of humanity (food, energy, health care, etc.) whilerespecting our environment is the challenge that lies ahead and that chemistry willhave to face in the forthcoming years. Chemistry has already managed to win battlesin the last century – fight against epidemics, increase in agriculture, food, andindustrial productivity to meet the growing demands for food and consumer goods,and so on. Currently the demand is different, but it is chemistry that has the keys tosustainable development.
7.3. The lifecycle analysis, an eco-design tool – definitions and concepts
7.3.1. Eco-design: a few definitions
The production of goods and services is from now on under stress. It will nolonger be sufficient to meet the specifications by technical means in accordance withthe cost limit. Henceforth, we will have to integrate the respect for mankind and theenvironment, which means reducing the consumption of fossil fuels, limitinggreenhouse gas emissions, comply with environmental constraints – this amounts tolimit environmental impacts. However, taking into consideration all environmentalimpacts during the manufacturing process, and not only the measurement of thecarbon footprint and CO2 emissions amounts to integrate eco-design to thetraditional design processes, but also consequently to the innovation process. Thisinnovation process undergoes significant changes. We are not only waiting for aquick response, some time is taken, but to provide a comprehensive response on theenvironment, an eco-designed response.
In addition, eco-design is an integral part of the recommendations of the GrenelleEnvironment Forum held in 2007. Indeed, the Commitment no. 217 encouragesanalysis approaches of environmental products and eco-design “Commitmentno. 217: generalize the present environmental information about products andservices: energy brand applied to all major energy consumer products, with a singlereference point, development of eco-brands accompaniment of voluntary approachesto support the development of information on ecological impacts, with progressiveobligation to provide these information; study of the development of the ecologicalprice (double price to inform consumers about the environmental footprint ofthe goods they are buying) eventually going towards a collaborative eco-contribution”.
Finally, eco-design is from now on a regulatory requirement with the frameworkdirective for Ecodesign which states, for energy consuming products, that: “The eco-design of products is an essential axis of the community strategy on the IntegratedProduct Policy. As a preventive approach, aimed at optimizing the environmentalperformance of products while maintaining their quality, it provides new and realopportunities to the manufacturer, consumer, and society as a whole”. This directive

244 Process Engineering and Industrial Management
was reinforced by a directive laying down eco-design requirements for the followingproducts: hot-water boilers fed with liquid or gas fuel, refrigerators, freezers andhousehold electrical appliances, and ballasts for fluorescent lamps. Eco-design istherefore starting to become an obligation. It is also a response to consumers’expectations. In fact, the end users are now awaiting for eco-friendly products.According to the IRSN barometer, since 2006, the environmental degradation is inthe top three concerns of the French. Eco-design is thus a comprehensive approach,which is focused on the product. It mainly takes into account the environmental andhuman criteria from the design phase of a product. These criteria generally relate tothe set of phases followed by a product: production, distribution, use and end of life,namely the lifecycle of a product (see Figure 7.6). Eco-design is a multicriteriapreventive process, which seeks to identify and reduce at the source all impacts onthe environment.
Manufacturing
End of life
LifecycleLifecycle
RecyclingUse
Distribution
Transport
Extraction of resources
Figure 7.6. The lifecycle
The concept of eco-design is based on a powerful tool to identify theenvironmental impacts: the lifecycle assessment − LCA.
7.3.2. The lifecycle assessment: history
The lifecycle assessment, as practiced, is actually an environmental lifecycleassessment as the evaluated impacts are mainly environmental impacts (see Figure 7.7).
The “lifecycle assessment” thinking is a holistic way of thinking, which takesinto account all impacts, environmental, social, and economic on the wholelifecycle of the product or service. This way of thinking should help to prevent localimprovements from resulting in a transfer of problems (pollution, socialconditions, etc.).

Lifecycle Analysis and Eco-Design 245
Livable
EconomicSocial Fair
SustainableFeasible
LCA
Environment
Figure 7.7. LCA lay out
LCA dates back to the late 1960s and to the early environmental assessmentsconducted in the United States on the REPA – Resource and Environment ProfileAnalysis model. These assessments intended to compare materials for packagingapplications and focused on energy consumption, consumption of raw materials,natural resources, and waste production, in relation to the discussions of the momenton growth and environment (especially by the Club of Rome). In the early 1970s,following the first oil shock, industrial companies were essentially making theinventory of the energy flows consumed by their activities, under the form ofanalyses of environmental profiles and of use of resources, at the expense of realenvironmental analyses. In the late 1980s, a renewed interest emerged forenvironmental analyses, in relation to the issues of solid waste. Matter and energyinventories are also used for marketing purposes. The initial methods led to resultsthat were difficult to use from one country to another, from one product to another,due to the heterogeneity of the data used and the various approaches. Industrialistsand government had called for the development of a systematic, repeatable,and comparable methodology at least on regional scales. The SETAC (Societyof Environmental Toxicology and Chemistry) and BUWAL (Swiss Ministry ofEnvironment) had then responded to this call and the first Swiss method ofenvironmental balance of BUWAL appeared in 1984.
The concept of lifecycle assessment appeared in reality for the first time during aseminar in Vermont (USA) of SETAC in 1990, which had put the emphasis on theneed to extend the eco-balance based on material/energy balances to a real lifecycleassessment – the concept of impact assessment was established. The first lifecycleassessment was therefore performed in France on the steel packaging products of theSOLLAC company. In 1993, SETAC proposed a code of conduct that thenconstituted the reference frame for future developments. In 1997, the ISO –International Organization for Standardization – published the first Internationalstandard on the lifecycle assessment – ISO 14040: Environmental Management –Lifecycle assessment – Principles and framework. In 1998, the ISO published theinternational standard ISO 14041: Environmental management – Lifecycleassessment – Definition of the purpose and scope of study and analysis of the
246 Process Engineering and Industrial Management
inventory. In 2000, the ISO published the international standard ISO 14042:Environmental management – life cycle assessment – evaluation of impact on thelifecycle and the international standard ISO 14043: environmental management –lifecycle assessment – lifecycle interpretation. LCAs were developed in France inthe 2000s with the carrying out of LCA by specialized firms and the organization in2005 of the first symposium on eco-design and chemistry in France by the FrenchFederation of Science for chemistry FFC and ChemSuD chair. In 2006, ISOpublished the standard 14044: environmental management – lifecycle assessment –requirements and guidelines and established a new version of the standard 14040.These two new standards cancelled and superseded the previous ISO standards14040, 14041, 14042, and 14043.
7.3.3. Lifecycle assessment: concept and definitions
The lifecycle assessment is an analytical method, which consists ofquantitatively assessing all potential environmental impacts of a product or serviceby considering the entire Lifecycle.
This analysis can be applied to the entire Lifecycle, in a “from cradle to grave”approach, to the extent that at each stage of the Lifecycle there is energy andresource consumption, and generation of environmental, social, and economicalimpacts.
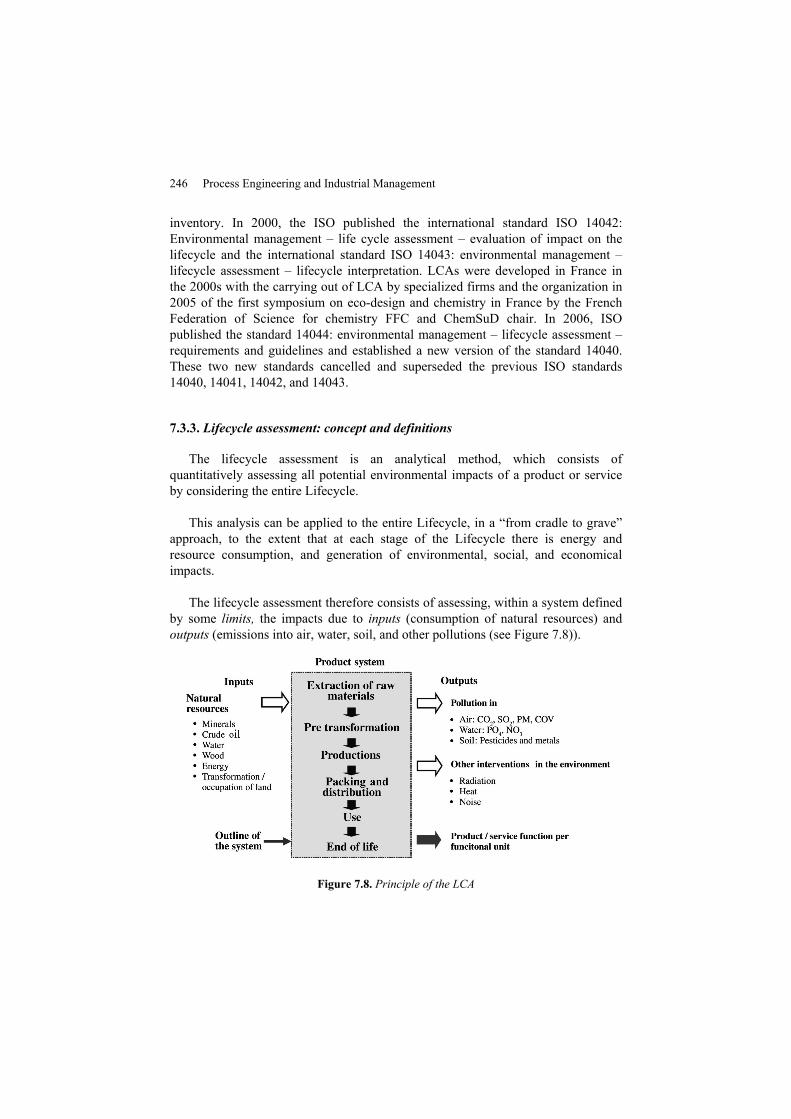
The lifecycle assessment therefore consists of assessing, within a system definedby some limits, the impacts due to inputs (consumption of natural resources) andoutputs (emissions into air, water, soil, and other pollutions (see Figure 7.8)).
Figure 7.8. Principle of the LCA
Lifecycle Analysis and Eco-Design 247
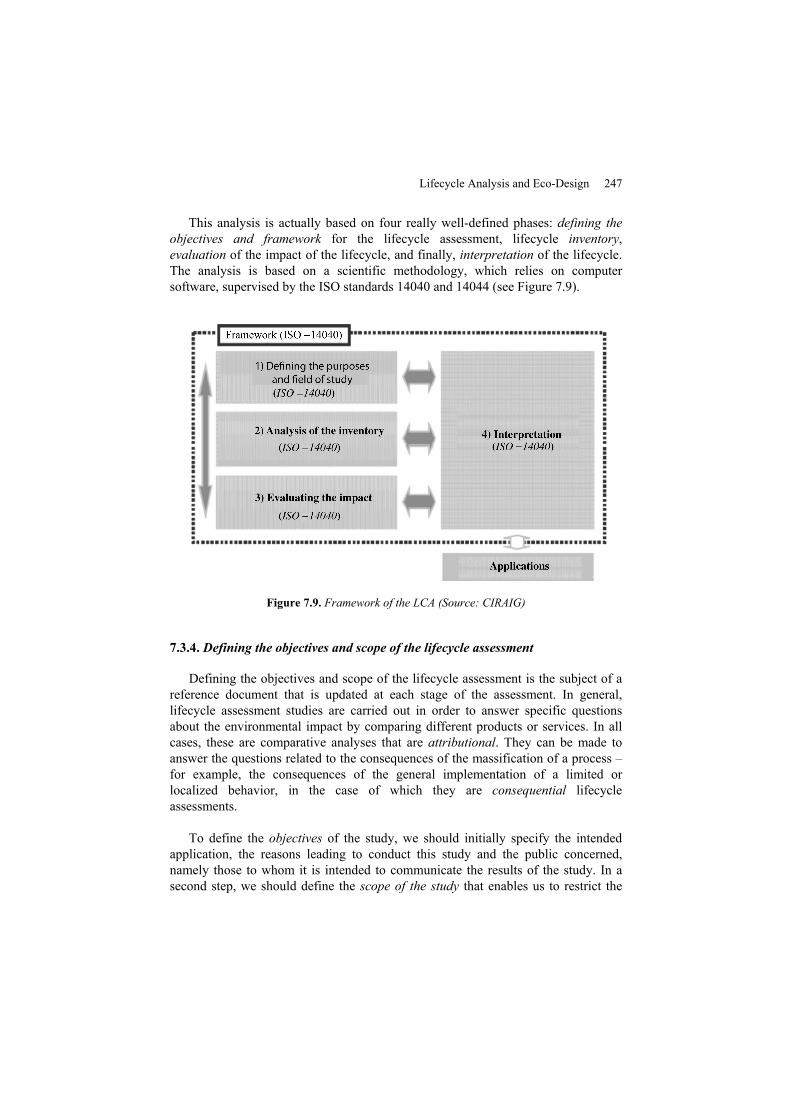
This analysis is actually based on four really well-defined phases: defining theobjectives and framework for the lifecycle assessment, lifecycle inventory,evaluation of the impact of the lifecycle, and finally, interpretation of the lifecycle.The analysis is based on a scientific methodology, which relies on computersoftware, supervised by the ISO standards 14040 and 14044 (see Figure 7.9).
Figure 7.9. Framework of the LCA (Source: CIRAIG)
7.3.4. Defining the objectives and scope of the lifecycle assessment
Defining the objectives and scope of the lifecycle assessment is the subject of areference document that is updated at each stage of the assessment. In general,lifecycle assessment studies are carried out in order to answer specific questionsabout the environmental impact by comparing different products or services. In allcases, these are comparative analyses that are attributional. They can be made toanswer the questions related to the consequences of the massification of a process –for example, the consequences of the general implementation of a limited orlocalized behavior, in the case of which they are consequential lifecycleassessments.
To define the objectives of the study, we should initially specify the intendedapplication, the reasons leading to conduct this study and the public concerned,namely those to whom it is intended to communicate the results of the study. In asecond step, we should define the scope of the study that enables us to restrict the
248 Process Engineering and Industrial Management
study to the given limits and establish the limits of the system studied, and also todefine the activities and impacts that are included or excluded from the study. Wedefine the temporal cover (system lifespan), geographical cover, technologicalcover, cover of the processes (system boundaries), cover of environmentalinterventions (inputs and outputs), and cover of the potential impacts.
To determine the impacts related to the proposed project, we can rely on a list ofenvironmental references. The study of this list will help us to eliminate unnecessaryimpact categories, to arrange the categories with insignificant impacts at a low levelof analysis, and therefore to identify the critical impacts. This amounts to setting aninclusion threshold for the impacts on the lifecycle analysis.
Inclusion threshold: It is in fact usually impossible to consider all the compoundsforming a complex product. The head of the LCA is required to set an inclusionthreshold, which corresponds to the rules of negligibility whose principle is asfollows: all components representing less than X% the total mass of the product areneglected. Secondly, we verify that the sum of what is taken into account remainsabove a fixed percentage, which is always close to 100% and, qualitatively, that theneglected compounds do not have particularly dangerous characteristics (e.g. toxicsubstances, radioactive waste, etc.) or other specific established problems (e.g.compound whose achievement is known as highly polluting and energyconsumption). If not, these compounds will be reintegrated into the analysis,whatever their quantity.
The system definition also includes the definition of the functional unit and ofthe reference flow.
The functional unit is a quantity used to quantify the function of the studiedproduct system and to compare different systems performing the same function.
EXAMPLES.–
– In the framework of an LCA to evaluate different packaging, the functionstudied is packaging. The functional unit to be defined is a packed volume V (m3)and not a packed mass (kg) or a mass of packaging materials;
– In the framework of an LCA to evaluate various means of hand drying, thefunction studied is drying. The functional unit is thus a N number of dry hands, andnot a surface of tissue paper. We can thus compare reference flows, such as aquantity of paper or a volume of hot air;
– In the framework of an LCA to assess the environmental impacts of two muralpaintings, P1 and P2, the function studied is the cover of a wall surface. Thefunctional unit to be defined is thus a painted surface S (m2). The Direct comparisonof the impacts of a liter of paint P1 to those of a liter of paint P2 is meaningless and
Lifecycle Analysis and Eco-Design 249
could even lead to completely wrong results. In fact, if per liter, the paint P1 is 30%cleaner than the paint P2, during the application, P1 requires two layers when oneis enough for P2. We can thus obtain wrong results. In fact, a liter to litercomparison would lead to recommend the use of the paint P1, while it would haveno interest for the environment or the user;
– if the analysis focuses on the comparison of processes or waste treatmentprocess (storage, incineration, recycling), the functional unit may be, for example,the processing of one ton of waste.
This definition phase is really crucial, as the results of LCA depend greatly onthe objectives and framework that have been previously set (but usually not on thesponsor or the director). Thus, the LCA of a plastic yoghurt pot from a particularmanufacturer, knowing the precise transport distance of their products as well as thecomposition and the different modes of production of energy that it uses, will notgive the same results as the LCA of the European yogurt pot, which is made based onthe average member of European production. Therefore, to avoid inaccurateinterpretations or generalizations in the subsequent use of results, the objective andscope of the study should clearly explain the studied issue.
7.3.5. Lifecycle inventory analysis
This phase is the one, which was the most developed at the methodological level.It benefited from the methods resulting from raw materials/energy balances of the1970s. The definition of the Lifecycle inventory analysis according to internationalstandards is: “Phase of lifecycle assessment involving the compilation andquantification of inputs and outputs for a given product system during its lifecycle”.The inventory is the basic objective of the LCA, as it is constituted by the basicprocesses obeying the physical laws of conservation of mass and energy. This typeof inventory is not, however, absolute. Indeed, this approach involves a phase ofdata collection related to the achievement of working hypotheses. The data canindeed be collected not only on production sites but also with complete data fromtrade associations or organizations.
It consists here of gathering data or collecting the existing data and makingcalculations according to a precise sequence: flow chart, description of each basicprocess, data collection, and data validation. The quantitative input and output dataof each elementary process calculated with respect to the reference flow are put inrelation to the functional unit.
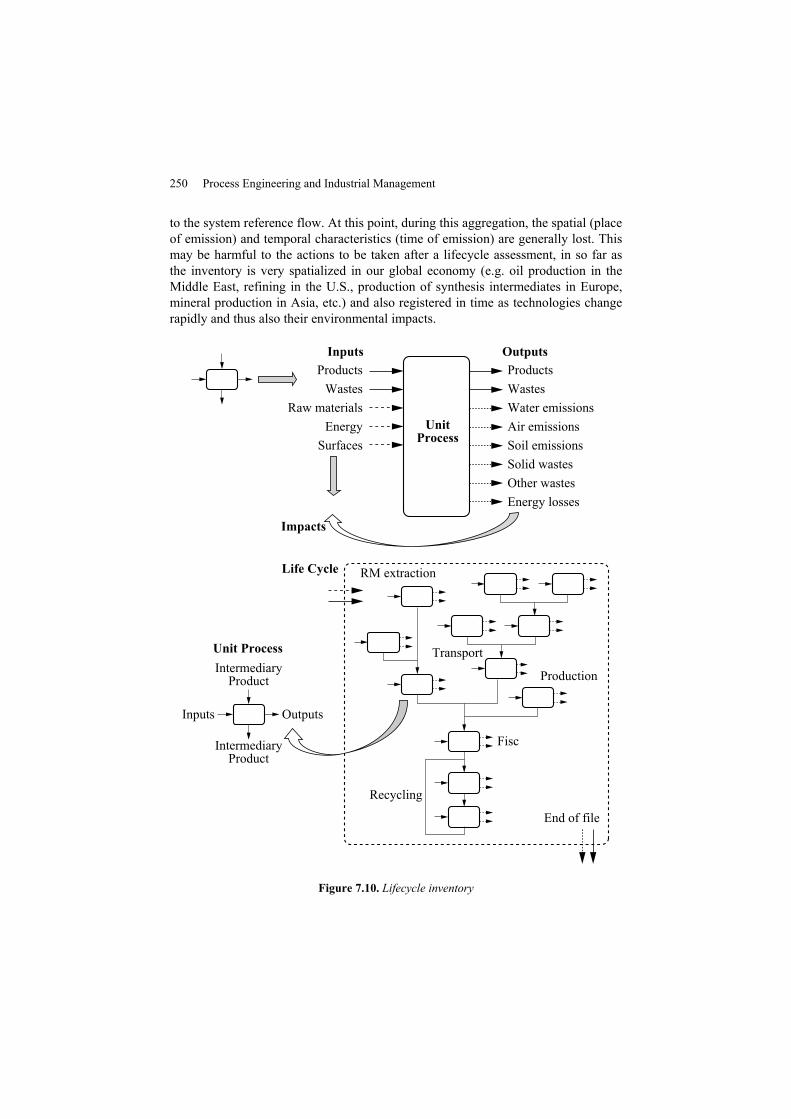
All environmental interventions (use of resources and emissions of pollutants)for product system, for each of the unitary processes at each step of the lifecycle (seeFigure 7.10), are thus summarized into an inventory table and expressed with respect
250 Process Engineering and Industrial Management
to the system reference flow. At this point, during this aggregation, the spatial (placeof emission) and temporal characteristics (time of emission) are generally lost. Thismay be harmful to the actions to be taken after a lifecycle assessment, in so far asthe inventory is very spatialized in our global economy (e.g. oil production in theMiddle East, refining in the U.S., production of synthesis intermediates in Europe,mineral production in Asia, etc.) and also registered in time as technologies changerapidly and thus also their environmental impacts.
Figure 7.10. Lifecycle inventory
Lifecycle Analysis and Eco-Design 251
Inventory data are composed of material flows (mineral iron, bauxite, water, etc.)and energy (oil, gas, coal, etc.) entering the system under study and ofcorresponding outflows (solid waste, liquid, or gaseous emissions, etc.). There aresome lifecycle inventory databases especially for common raw materials, energy,and transport. These data are accessible at low cost in the form of public orpublished databases (e.g. database Ecoinvent data v2.1).
Some groups or professional federations have also collected data on theenvironmental impacts of their material throughout its lifecycle or, more frequently,on the upstream part of the cycle, to make them available to the users of thosematerials, so that they incorporate them into their own LCA. For specific data to thestudy, data collection has often to be carried out on an individual basis, for acollection on industrial sites, through bibliographic researches, or through theperspective of previous studies.
Case of plastics: The APME (Association of Plastic Manufacturers in Europe)provides for free by mail and on its Website, the “Eco-profiles” of major plastics, inthe form of lists of averaged inventory results, which are easily usable inspreadsheets or calculation software.
7.3.6. Assessing the impact of the lifecycle
The impact assessment phase consists of explaining and interpreting the resultsobtained during the inventory, in terms of impacts on the environment, and in theform of an adequate summary that could be understood by a non-specialist. Thisphase should help to prepare the disclosure of elements related to the productenvironmental impact. It is particularly sensitive.
The two previous phases – inventory and assessment – are those that are mostlyrelated to chemistry since the entire manufacturing process is divided into materialand energy balances, and deconvoluted in primary inputs: oil, gas, electricity, andso on. At each step of this process, by-products, effluents, and so on, are identifiedand their future is evaluated in terms of directly or indirectly possible pollution.
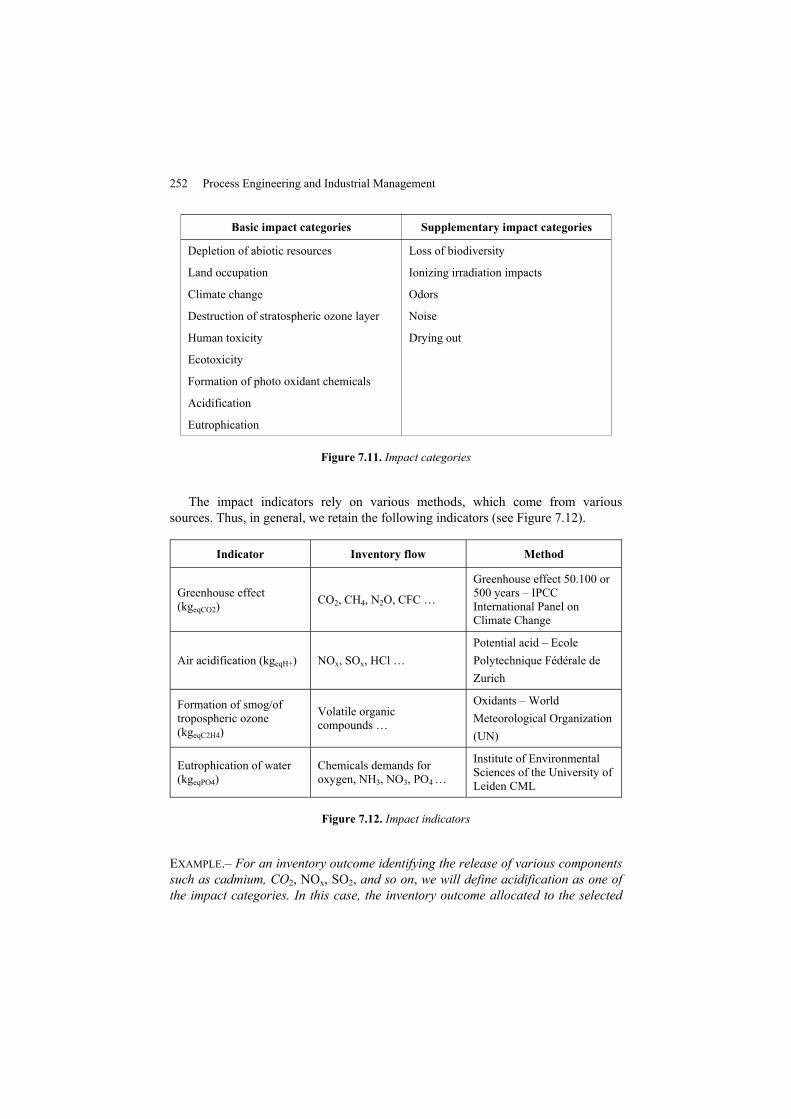
To conduct the impact assessment phase, we must first select the impactcategories to be remembered (see Figure 7.11), define the impact indicators andcharacterization models, and carry out the allocation of inventory results in differentimpact categories (classification).
For each indicator category, we must calculate the results (characterization), theamplitude of the results in comparison to reference values (normation), the groupingand ranking of indicators, and finally the weighting of indicators.
252 Process Engineering and Industrial Management
Basic impact categories Supplementary impact categories
Depletion of abiotic resources Loss of biodiversity
Land occupation Ionizing irradiation impacts
Climate change Odors
Destruction of stratospheric ozone layer Noise
Human toxicity Drying out
Ecotoxicity
Formation of photo oxidant chemicals
Acidification
Eutrophication
Figure 7.11. Impact categories
The impact indicators rely on various methods, which come from varioussources. Thus, in general, we retain the following indicators (see Figure 7.12).
Indicator Inventory flow Method
Greenhouse effect(kgeqCO2)
CO2, CH4, N2O, CFC …
Greenhouse effect 50.100 or500 years – IPCCInternational Panel onClimate Change
Air acidification (kgeqH+) NOx, SOx, HCl …Potential acid – EcolePolytechnique Fédérale deZurich
Formation of smog/oftropospheric ozone(kgeqC2H4)
Volatile organiccompounds …
Oxidants – WorldMeteorological Organization(UN)
Eutrophication of water(kgeqPO4)
Chemicals demands foroxygen, NH3, NO3, PO4…
Institute of EnvironmentalSciences of the University ofLeiden CML
Figure 7.12. Impact indicators
EXAMPLE.– For an inventory outcome identifying the release of various componentssuch as cadmium, CO2, NOx, SO2, and so on, we will define acidification as one ofthe impact categories. In this case, the inventory outcome allocated to the selected

Lifecycle Analysis and Eco-Design 253
impact category includes acidifying emissions due to NOx and SO2. Modeling theindicator category is the release of H+ protons. The chosen indicator is aggregatedacidification potential AP and SO2eq. For aggregating, the weighting coefficients tobe used are as follows: 1 for the emissions of SO2 and 0.7 for NOx emissions. Thecategory application point is composed of ecosystems such as forests, vegetation,and so on.
It is imperative that the chosen indicator provides an adequate representation, i.e.that the low indicator corresponds to a low impact and that the indicator shows arelevant environmental phenomenon.
For this, the number of indicators must be limited, indicators should bedetermined from the data and existing models, and the calculations should beexecutable in a limited time at a reasonable cost.
Category indicators actually represents the amount of potential impact. They aredistinguished according to two main types, depending on their position in the causalchain between emissions and impacts (see Figure 7.13): midpoint and endpointindicators.
SO2
emissions
CFCemission
Source EndpointMidpoint
Destruction ofthe tropospheric
ozone
Destruction ofthe stratospheric
ozone
Acidifiedlake
Deadfish
Humanhealth
UVBexposive
Loss ofbiodiversity
Acid rain
Figure 7.13. Midpoint and endpoint indicators
Midpoint indicators correspond to the aggregation by type of impact(acidification, destruction of the ozone layer, etc.). They are more easily accessible,with a limited uncertainty, but have a low environmental relevance. Endpointindicators reflect the impact on targets (loss of biodiversity, human health, etc.).They are not easily accessible, with a high uncertainty but are of greatenvironmental relevance.
Another way of classifying the impacts is to separate them in terms of direct andindirect impacts. Direct impacts correspond to the actions of sources on specifictargets such as the depletion of natural resources by the extraction of raw materials.
254 Process Engineering and Industrial Management
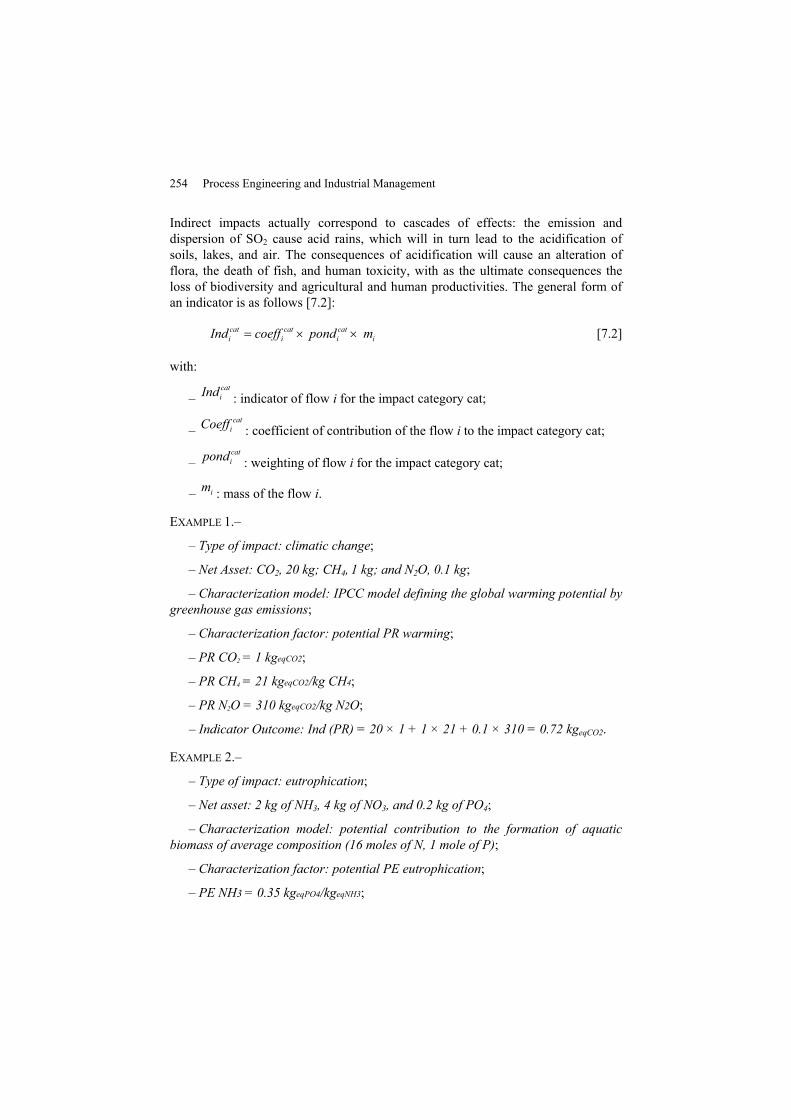
Indirect impacts actually correspond to cascades of effects: the emission anddispersion of SO2 cause acid rains, which will in turn lead to the acidification ofsoils, lakes, and air. The consequences of acidification will cause an alteration offlora, the death of fish, and human toxicity, with as the ultimate consequences theloss of biodiversity and agricultural and human productivities. The general form ofan indicator is as follows [7.2]:
cat cat cati i i iInd coeff pond m= × × [7.2]
with:
–catiInd : indicator of flow i for the impact category cat;
–catiCoeff : coefficient of contribution of the flow i to the impact category cat;
–catipond : weighting of flow i for the impact category cat;
– im : mass of the flow i.
EXAMPLE 1.–
– Type of impact: climatic change;
– Net Asset: CO2, 20 kg; CH4, 1 kg; and N2O, 0.1 kg;
– Characterization model: IPCC model defining the global warming potential bygreenhouse gas emissions;
– Characterization factor: potential PR warming;
– PR CO2= 1 kgeqCO2;
– PR CH4= 21 kgeqCO2/kg CH4;
– PR N2O = 310 kgeqCO2/kg N2O;
– Indicator Outcome: Ind (PR) = 20 × 1 + 1 × 21 + 0.1 × 310 = 0.72 kgeqCO2.
EXAMPLE 2.–
– Type of impact: eutrophication;
– Net asset: 2 kg of NH3, 4 kg of NO3, and 0.2 kg of PO4;
– Characterization model: potential contribution to the formation of aquaticbiomass of average composition (16 moles of N, 1 mole of P);
– Characterization factor: potential PE eutrophication;
– PE NH3= 0.35 kgeqPO4/kgeqNH3;

Lifecycle Analysis and Eco-Design 255
– PE NO3= 0.1 kgeqPO4/kgeqNO3;
– PE PO4= 1 kgeqPO4;
– Indicator Outcome: Ind (PE) = 2 × 0.35 + 4 × 0.1 + 0.2 × 1 = 1.3 kgeqPO4.
7.3.7. Interpretation of the lifecycle
The two previous phases, impact inventory and assessment are the areas ofexpertise of the lifecycle assessment. Indeed, the approach is technical and the dataare numerous. In the interpretation phase of the lifecycle assessment, users,managers, and decision makers, will use the results of the impact analysis to identifythe key actions, which will have to be taken into accounts other sizes (research anddevelopment, marketing, production, financial services, etc.).
LCA results are expressed as a series of data that has both potential impacts(e.g. X kgeqCO2 for the greenhouse effect) and physical flows (e.g. Y MJ ofnon-renewable energies). They are the subjects of a report and, in the case ofcommunication, of a public summary document.
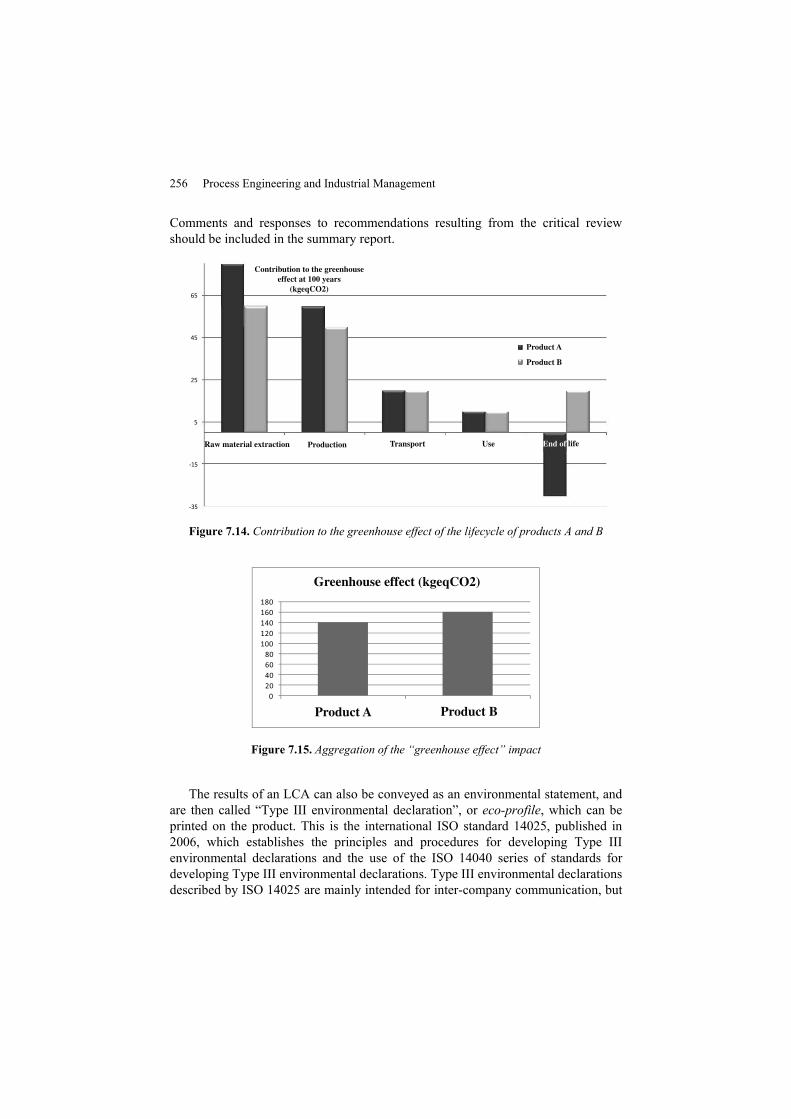
For a LCA comparing the two products A and B, the results for each impact canbe expressed for each step of the lifecycle, to compare and identify the stepspresenting the greatest impacts. This can also help to compare the contribution ofeach product at each stage of the Lifecycle. The following results (see Figure 7.14)enable us to establish that the product A contributes more to the greenhouse effectthan the product B for the steps of raw materials extraction and production, but itsability to recycle at the end of life, enables it to absorb CO2. This representationenables us to identify the steps on which efforts have to be made in order to reduceimpacts.
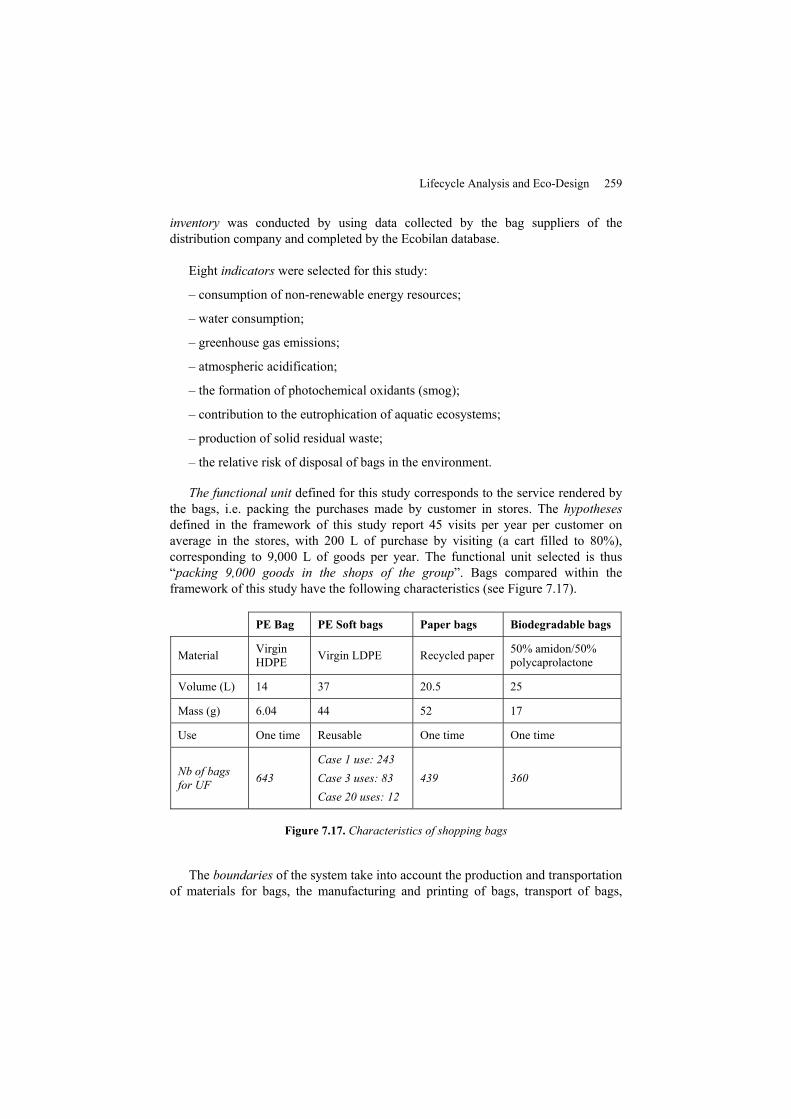
The aggregation of results for the contribution to the greenhouse effect perproduct enables us to identify macroscopic trends (see Figure 7.15), but annihilatesthe differences in the lifecycle. This representation enables us to make a globalselection of the product causing the least impact.
The essential phase of interpretation is the report writing that should contain themain elements of the lifecycle assessment: a reminder of the context and objectivesof the lifecycle assessment, detailed definition of the chosen functional unit,methodology of the lifecycle assessment, basic information and sources used andtheir limitations, encountered technical, methodological, and scientific difficulties.This report must necessarily include a critical review, i.e. the review of the study byan independent expert. This expert can act either alone or within a critical reviewcommittee involving experts of the studied field and key stakeholders: the key is toensure the impartiality of the experts regarding the LCA in the studied domain.
256 Process Engineering and Industrial Management
Comments and responses to recommendations resulting from the critical reviewshould be included in the summary report.
Contribution to the greenhouseeffect at 100 years
(kgeqCO2)
Raw material extraction Production Transport Use End of life
Product B
Product A
Figure 7.14. Contribution to the greenhouse effect of the lifecycle of products A and B
Greenhouse effect (kgeqCO2)
Product A Product B
Figure 7.15. Aggregation of the “greenhouse effect” impact
The results of an LCA can also be conveyed as an environmental statement, andare then called “Type III environmental declaration”, or eco-profile, which can beprinted on the product. This is the international ISO standard 14025, published in2006, which establishes the principles and procedures for developing Type IIIenvironmental declarations and the use of the ISO 14040 series of standards fordeveloping Type III environmental declarations. Type III environmental declarationsdescribed by ISO 14025 are mainly intended for inter-company communication, but

Lifecycle Analysis and Eco-Design 257
their use for the communication between a company and private individuals undercertain conditions is not ruled out. The search for improvements is the component ofthe lifecycle assessment, in which the options to reduce environmental impacts ofthe system are identified and assessed. This stage includes the identification,assessment, and selection of options for the improvement of the environmental loadof products or processes.
Currently, lifecycle assessments are most of the time used to meet certainrequirements, such as the environmental performance of an industrial process, theenvironmental sales pitch, the comparison of environmental impacts of two products(or more), and the calculation of environmental balances.
In addition, the initial characteristics of the product generally determine thepossibilities of valorization at the end of life. Finally, this approach shows a strategicadvantage in terms of communication. Indeed, the results obtained in this type ofapproach may be shared with customers and bring about a competitive advantagethat differentiates the product from its competitors.
7.3.8. LCA software
There are now dozens of software for analyzing the lifecycle assessment.Initially, the first software that emerged in the 1990s that have replaced thespreadsheet programs of 1980s, have been developed by consultants, at first for theirown needs and then for their customers. We can thus name some early versions ofTEAM d’Ecobilan, Sima Pro, PRé Consultants, etc. These various types of softwarewere designed as sophisticated spreadsheets adjusted to the calculations of inventoryand have provided with their different versions, more extensive features in terms ofinput and modification of models, display and print of the results as tables andgraphs. The following versions have integrated various methods of assessment,based on the structure of LCA defined by the SETAC also with sensitivity analyses.
The latest generation of LCA tools is derived from the previous software, towhich were added a user interface and a database specific to a type of use, such asproduct design (Eco-It derived from Sima Pro). Other types of software arededicated to a specific industry, such as EIME for French electrical, electronic, andcommunication industries or WISARD for household waste management; both ofthem are derived from TEAM.
Suppliers of LCA software, who usually have initially developed the softwarefor their own use, are now divided into three categories:
– public research institutes;
– environmental consulting offices, especially in LCA;

258 Process Engineering and Industrial Management
– industrialists, who, after having developed a software for their own needs inthe early 1990s without marketing it, now often associate with consultants orresearch institutes to develop a new software.
7.4. Innovation through eco-design
LCA does not provide solutions to design products or processes of lowenvironmental impact but is a guide to select which stages to improve. The LCA isthus a tool that helps to make choices and to guide researches to foster innovation. Infact, the results of the lifecycle of a given initial product (see Figure 7.16) help us toidentify that the highest X impact is related to the production stages of raw materials.Therefore, the research should be conducted on this stage in order to identify accesschannels or raw materials of lesser impact to develop a eco-designed new product. Itis in this research process that innovation is found, and it is in this sense that eco-design is a real innovation tool.
INITIALPRODUCT
ECODESIGNEDPRODUCT
Impact X Impact X
Raw materials Raw materialsProduction
DistributionUseUse
Valorization ValorizationProduction
Distribution
Figure 7.16. Innovation process
We propose to study the examples of case studies to detail the whole processapplied to industrial products and processes.
7.4.1. Example: LCA of supermarket shopping bags
The example of the comparative lifecycle assessment of the shopping bagsdistributed in supermarkets is very informative. This study was conducted in 2004 byan expert office in LCA, for a distribution company. It was completed by a criticalreview organized by ADEME. This study aimed at quantifying and comparing theenvironmental impacts of four types of shopping bags available to customers insupermarkets: a disposable polyethylene (PE) bag, a reusable shopping bag made ofsoft polyethylene, a disposable paper bag, and a single-use biodegradable bag. The
Lifecycle Analysis and Eco-Design 259
inventory was conducted by using data collected by the bag suppliers of thedistribution company and completed by the Ecobilan database.
Eight indicators were selected for this study:
– consumption of non-renewable energy resources;
– water consumption;
– greenhouse gas emissions;
– atmospheric acidification;
– the formation of photochemical oxidants (smog);
– contribution to the eutrophication of aquatic ecosystems;
– production of solid residual waste;
– the relative risk of disposal of bags in the environment.
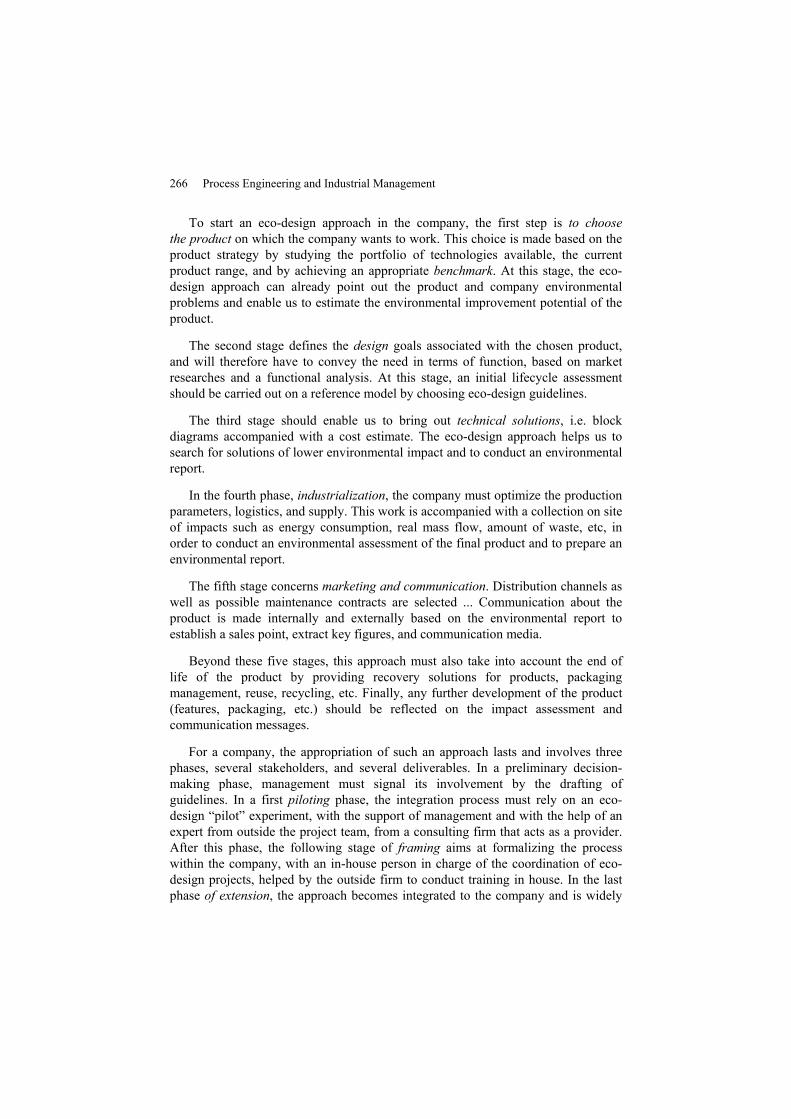
The functional unit defined for this study corresponds to the service rendered bythe bags, i.e. packing the purchases made by customer in stores. The hypothesesdefined in the framework of this study report 45 visits per year per customer onaverage in the stores, with 200 L of purchase by visiting (a cart filled to 80%),corresponding to 9,000 L of goods per year. The functional unit selected is thus“packing 9,000 goods in the shops of the group”. Bags compared within theframework of this study have the following characteristics (see Figure 7.17).
PE Bag PE Soft bags Paper bags Biodegradable bags
Material VirginHDPE Virgin LDPE Recycled paper 50% amidon/50%
polycaprolactone
Volume (L) 14 37 20.5 25
Mass (g) 6.04 44 52 17
Use One time Reusable One time One time
Nb of bagsfor UF 643
Case 1 use: 243Case 3 uses: 83Case 20 uses: 12
439 360
Figure 7.17. Characteristics of shopping bags
The boundaries of the system take into account the production and transportationof materials for bags, the manufacturing and printing of bags, transport of bags,

260 Process Engineering and Industrial Management
phase of usage, and various end of life possibilities. The inclusion threshold definedis 5%: this means that the sum of the inputs whose production is not included in thesystem represents less than 5% of the total mass of the system inputs. Someprocesses are also excluded from the lifecycle. Thus, the study does not include theassessment of impacts related to the construction of buildings for industrial sites, orto the manufacturing of machine tools or delivery trucks. In fact, in a steady state ofstabilized operation, the amortization of all this equipment is carried on throughouttheir whole lifespan, and then becomes negligible in the studied lifecycle. The studydoes not address the transport of full bags to shoppers’ homes.
In calculating the impacts identified in this study, the reference flows identifiedare as follows:
– natural resources: consumption of oil, coal, natural gas, uranium, and water;
– air pollution: CO2, CH4, N2O, NOx, SOx, and COV;
– water pollution: discharges of nitrogen, phosphorus, and oxidizable substances(COD);
– total waste production.
The impact of relative risk by disposal, was evaluated using the followingparameters:
– volume of bags used to be processed: this volume is directly correlated to thenumber of bags that are disposed off;
– probability of disposal: this probability depends on the mode of acquisition, itis low when the bag is purchased, strong when it is free;
– probability of flying off: this probability depends on the density of the bag, it isstrong if the bag is “light”, weak if it is “heavy”;
– persistence of the bags in the environment: this parameter depends on whetherthe material of the bag is biodegradable or not.
The LCA has focused on the lifecycles of the four types of bags beingconsidered. For example, the lifecycle of the disposable HDPE bag (see Figure 7.18)first takes into account the use and refining of oil for the synthesis of ethylene, thepolymerization of ethylene by Ziegler Natta catalyst, production of HDPE pellets,and their transport. These data are resulting from the inventory databases of 1999 ofAPME (average on 24 European sites producing LDPE 3.87 Mt/year or 89.7% ofthe production of Western Europe). The lifecycle also takes into account theproduction of titanium dioxide (data from a production site – 1992), calciumcarbonate (data from the Swiss Ministry of Environment), and linear PE with lowdensity (averages of the APME), which are the loads in the bag. The production ofglue and ink is also taken into account.

Lifecycle Analysis and Eco-Design 261
HDPE production, pigments...
Manufacture of bags
Transport
Exploitation &refinement of oil
Granuled HDPEproduction
Manufacture of HDPE bag by extrusion andprinting
Production of electricity
Glue productionInk production
Warehouses
handfillIncineration with energyrecovery
Incineration withoutenergy recovery
Electricityproduction
Production of vapour with coal,heavy fuel, natural gas
END OF LIFE
Shops
TiO2Production
CaCO3Production
LLDPEProduction
Figure 7.18. Lifecycle of disposable HDPE bags
In these lifecycles, energy production is modeled based on the energy ratios ofelectricity production of countries producing bags, namely France, Italy, Spain, andMalaysia. The differences are particularly significant for the impacts concerning theconsumption of natural resources and the production of greenhouse gas emissions.Thus, the electricity in France is 75% of nuclear origin, whereas the electricity inMalaysia is 75% produced by the combustion of hydrocarbons. In addition, thecalculations made to assess the impacts related to transport stages are based on thefuel consumption by trucks. The model takes into account the average consumptionof a truck with full load (38 L/100 km) weighted by one-third the mass of the load,including the influence of empty return. The equation is therefore as follows:
Actual consumption (L) = number of kilometers traveled × 38/100 × (2/3 +1/3 × real load/ payload + empty return rate × 2/3) [7.3]
Finally, the end of life stage was modeled using data from ADEME forhousehold waste. Thus, 51% of waste are brought to landfills and 49% areincinerated. And 88% of incinerated waste are recycled to produce energy, 5% isexhausted as vapor and 22% is generated as electricity.
The impacts of this lifecycle assessment are presented in two forms: for eachstage of the lifecycle of each bag being considered (see Figure 7.19), or

262 Process Engineering and Industrial Management
agglomerated for each bag by considering the number of reuses of soft bags (seeFigure 7.20).
Material
PE disposable bagPE Soft bag (3 uses)Paper bagBiodigradable bag
Glue Ink Pigment Bag:production
End of lifeTransport
Consumption of non-renuable energy (MJ / 9,000 l packed)
Figure 7.19. Non-renewable energy consumption
The interpretation of the results of impacts enable us to identify the followingtrends:
– consumption of renewable energy, greenhouse gas emissions, and formation ofsmog are impacts that are due to the phases of material production (see Figures7.19 and 7.22);
– paper bags are the highest water consumers, due to the paper recyclingprocess (see Figure 7.21);
– paper and biodegradable bags are the source of the impacts of eutrophication,due to the paper recycling process or the use of fertilizer for corn crop from whichwe get starch (see Figure 7.24);
– phases of material and bag production are the strongest contributions toatmospheric acidification (see Figure 7.23);
– the formation of solid waste is the end of life stage, which is the largestcontributor to this impact;
– for the set of relevant impacts, soft bags show impacts: higher than other typesof bags meant for a single reuse; equivalent from three uses; and lower than anumber of reuses higher than three;
– The relative risk presented by disposal is very high for disposable PE bags,and low in all other cases.
The broad guidelines of the findings are also that the reduction of the mass ofthe bag and reuse of the bag are two major factors that reduce the impacts on theenvironment. The conclusions of this study are therefore strongly favorable to the useof soft LDPE bags – with the assumption of reuse of these bags for at least three times.

Lifecycle Analysis and Eco-Design 263
PE disposable bag
PE soft bag (3 uses)
Paper bag
Biodigradable bag
Consumption of non-renuable energy (MJ / 9,000 l packed)
Number of uses of soft bags
Figure 7.20. Consumption of renewable energy for N uses of soft bags
Water consumption (liters / 9,000 l packed)
PE disposable bag
PE soft bag (3 uses)
Paper bag
Biodigradable bag
Material Glue Ink Pigment Bag:production
Transport End of life
Figure 7.21. Water consumption
Emission of greenhouse gases (KgeqCO2 / 9,000 l packed)
PE disposable bagPE soft bag (3 uses)Paper bagBiodigradable bag
Material Glue Ink Pigment Bag:production
End of lifeTransport
Figure 7.22. Emission of greenhouse gases

264 Process Engineering and Industrial Management
PE disposable bag
PE soft bag (3 uses)
Paper bag
Biodigradable bag
Material Glue Ink Pigment Bag:production
End of lifeTransport
Atmospheric acidification (g eq H+ / 9,000 l packed)
Figure 7.23. Atmospheric acidification
Eutrophication (g eq phosphates / 9,000 l packed)
Biodigradable bag
Paper bag
PE soft bag (3 uses)
PE disposable bag
Material Glue Ink Pigment Bag:production
End of lifeTransport
Figure 7.24. Water eutrophication
7.4.2. Example of eco-design by a manufacturer of office furniture
The company considered offers solutions for office layout, has routinely used theevaluation of the lifecycle for each of its products. A lifecycle assessment of anoffice chair made in this company had therefore underlined the preponderantimpacts of the stages of production of materials and seat. To reduce these impactsand to identify an eco-designed innovative solution for office chairs, the companyhas promoted the use of recycling and reuse for office chairs (see Figure 7.25).Thus, the materials that made this seat were at 44% recycled, free of heavy metals.This chair can be dismantled completely and each part can be replaced individuallyby the company. The seat and packaging are also recyclable at 99%. This seat wasreduced to 7 kg and packed volume was reduced by 30%. The environmentalimpacts of the material and seat production are thus reduced, as well as impactsrelated to transport. Finally, the end of life was supported by the company that hadestablished a recovery and replacement of parts and seats service. This product hadbeen voted “Best French eco-designed product” at Pollutec in 2004 and has won thegold medal of Focus Green Award in 2008 in Germany.

Lifecycle Analysis and Eco-Design 265
Figure 7.25. Eco-designed seat (Source: A. Malsch)
7.4.3. Example of eco-design from a manufacturer of detergents
Conducting lifecycle assessments has also led a detergent company to offerinnovative eco-designed products. Thus, in the framework of the development ofdetergents, very detailed lifecycle assessments of laundry have highlighted the mainenvironmental impacts and the stages with the highest impact. These results havethus shown that the most important environmental impacts were related to the usagephase of detergent. In fact, 75% of the energy consumed in the lifecycle come fromthe energy consumption of the washing machine during the usage phase. Thisenergy consumption is especially linked to the operating temperature of the washingmachine. To reduce environmental impacts and to suggest an eco-designedinnovative solution, the company has developed a detergent in order to reduce thewashing temperature without reducing the performance of detergent. This “coldactive” detergent makes it possible to significantly reduce overall environmentalimpacts and nearly 50% of major energy consumption have been consumed in thetotal lifecycle. Marketing material made to promote this product has also highlightedthe savings for consumers, which will reduce their energy bills.
7.4.4. The integration process of eco-design in the company
These examples highlight the achievements of design and marketing ofeco-designed products. These products have been designed in the innovation processbased on lifecycle assessment to identify the axes of improvement related to themost important environmental impacts, the most contributing strategic stages to thelifecycle. We can thus, in the light of these examples, try to describe the integrationprocess of eco-design in the company in five steps and extract the appropriationprocess from it.
266 Process Engineering and Industrial Management
To start an eco-design approach in the company, the first step is to choosethe product on which the company wants to work. This choice is made based on theproduct strategy by studying the portfolio of technologies available, the currentproduct range, and by achieving an appropriate benchmark. At this stage, the eco-design approach can already point out the product and company environmentalproblems and enable us to estimate the environmental improvement potential of theproduct.
The second stage defines the design goals associated with the chosen product,and will therefore have to convey the need in terms of function, based on marketresearches and a functional analysis. At this stage, an initial lifecycle assessmentshould be carried out on a reference model by choosing eco-design guidelines.
The third stage should enable us to bring out technical solutions, i.e. blockdiagrams accompanied with a cost estimate. The eco-design approach helps us tosearch for solutions of lower environmental impact and to conduct an environmentalreport.
In the fourth phase, industrialization, the company must optimize the productionparameters, logistics, and supply. This work is accompanied with a collection on siteof impacts such as energy consumption, real mass flow, amount of waste, etc, inorder to conduct an environmental assessment of the final product and to prepare anenvironmental report.
The fifth stage concerns marketing and communication. Distribution channels aswell as possible maintenance contracts are selected ... Communication about theproduct is made internally and externally based on the environmental report toestablish a sales point, extract key figures, and communication media.
Beyond these five stages, this approach must also take into account the end oflife of the product by providing recovery solutions for products, packagingmanagement, reuse, recycling, etc. Finally, any further development of the product(features, packaging, etc.) should be reflected on the impact assessment andcommunication messages.
For a company, the appropriation of such an approach lasts and involves threephases, several stakeholders, and several deliverables. In a preliminary decision-making phase, management must signal its involvement by the drafting ofguidelines. In a first piloting phase, the integration process must rely on an eco-design “pilot” experiment, with the support of management and with the help of anexpert from outside the project team, from a consulting firm that acts as a provider.After this phase, the following stage of framing aims at formalizing the processwithin the company, with an in-house person in charge of the coordination of eco-design projects, helped by the outside firm to conduct training in house. In the lastphase of extension, the approach becomes integrated to the company and is widely
Lifecycle Analysis and Eco-Design 267
applicable to all design projects, coordination is done in-house and all members ofthe project are competent in so far as the company is able to generate self-training.Management can then communicate about the external approach.
7.5. Limits of the tool
The lifecycle assessment is thus a support tool for eco-design. This tool can bepowerful, but also has some limits especially due to the complexity of itsimplementation. Indeed, resorting to expert software and often expensive databasesreduces its use to a few multinationals and limits its contribution to the analysis ofexisting products and processes. LCA is therefore a particularly interesting toolbecause it enables a multicriteria analysis, on the entire lifecycle, without limitingitself to a single stage (end of life, etc.) or a single impact (carbon footprint, etc.). Inaddition, this tool is standardized through the ISO standards describing it. Moreover,a single impact, estimated at each stage, can be “added” to give a clear vision andhelps decision-making. And finally, nothing is published without having beenpreviously submitted to the journal of a group of experts.
However, if the LCA enables the identification during a given process of thestages generating the highest environmental impacts – such as stages of rawmaterials extraction – LCA gives a vision a posteriori but does not direct the courseof the innovative process. LCA is indeed a study performed on an already developedor commercialized product and helps to identify the steps that have the greatestimpact on the environment during the manufacture of this product. The objective ofan eco-designed process is to bring about, in a second phase, some solutions toreduce the most significant impacts during the previously identified stages.Innovation is thus born from the search for solutions during the second generation,or from the improvement of the product manufacture process. Therefore, the primaryobjective of these lifecycle analyses is rather data compilation, the conducting of anenvironmental assessment, the production of results for the communication on themanufacture a product; the support for eco-design is performed a second timebecause LCA is best suited to evaluate its final impact of a product, rather thanguiding its design. Furthermore, other limitations of this tool lie in the definingstages of the assumptions, in the allocation rules followed or the considered end oflife. We will try to illustrate this through the following examples.
7.5.1. On the importance of hypotheses
In fact, in the lifecycle assessment of shopping bags described in section 7.4,conclusions strongly support the use of soft LDPE bags – in the event of reuse of thesebags at least three times. The broad guidelines of the findings are that the reduction ofthe bag weight and reuse of the bag are two major factors reducing the impacts on the

268 Process Engineering and Industrial Management
environment. But at no time is considered a possible reuse of other considered bags(especially HDPE and biodegradable bags, which could be reused a second time, or atleast as garbage bags). In addition, the study is comparing bags with very differentvolumes, which involves quite variable amounts of material depending on the bags.And yet knowing that the weight of the bag is an important parameter, it would havebeen appropriate to consider the solutions showing larger volumes for the same bag.Thus, we can clearly identify that the LCA evaluates selected products and helps inchoosing the best product within this selection. But experience shows that solutions toa problem can often be found outside a preselection ... We must therefore beinnovative to really find eco-designed solutions.
Another interesting example is the informative case study described by Jollietet al. The goal of the presented LCA is to develop an environment-friendly computerby comparing the environmental impacts of two computers, a desktop PC with a CRTmonitor and a LCD laptop. The functional unit given is 10,000 hours of usage of thecomputer (i.e. 2,000 h/year over 5 years). In the hypotheses considered, we comparetwo computers with similar functions, ignoring the transportability of the laptop.Infrastructures and manufacturing machine tools of computers are not included in thelimits of the study and the battery of the laptop is not taken into account (productionand disposal). The results of this lifecycle assessment show the following differences:the desktop computer has the most significant environmental impacts. The impacts ofthe laptop are actually lower by almost 40% to those of the desktop PC in allcategories. And the screen is responsible for nearly 50% of impacts. So, the findingsclearly guides us toward the laptop solution. But this case study shows that the resultsobtained are related to unrealistic and not rigorous hypotheses. In fact, themanufacture and disposal of the laptop battery are not included in the LCA. And yetthis type of component and significant mass contains toxic and eco-toxic substances,its disposal is governed by the Waste Electrical and Electronic Equipment (WEEE)Directive. It is inconceivable not to include it in the LCA. In addition, as the screensupports up to 50% of impacts, it seems less rigorous to compare the PC with screensof different technologies. It would be more appropriate to compare a PC with an LCDscreen. And finally, the life span of two PCs is not comparable; indeed, the life spanof the laptop is reduced not only because of the potential damage caused duringtransport phases but also because it is difficult to replace its components. In contrast,the lifespan of a desktop PC can be extended, in so far as some components ormaterials will be reused in a new configuration (screen, keyboard, etc.). In this case,the functional unit can be changed. Therefore, this educational case study highlightsthe faults of the LCA tool when we lack rigor in the choice of the functional unit andhypotheses.
The example taken from the study of Kim et al. is also very illustrative ofthe importance of choosing the hypotheses of the LCA. Indeed, in their study, thisteam compared the environmental impacts of two types of polymers, the polystyrene

Lifecycle Analysis and Eco-Design 269
PS – obtained from the polymerization of styrene, a monomer coming from oil, anda PHA polyhydroxyalkanoate – polyester derived from the fermentation of sugarsextracted from corn kernels, from agricultural source, by bacteria. The comparison iscarried out at similar mass, despite any possible differences in properties. The resultspresented in this study show initially that the impact on the greenhouse effect islower for the manufacture of polystyrene (2.9 kgeqCO2 for PS and 3.5–4.4 kgeqCO2 forPHA). However, in a second study/case, we add in the lifecycle the production ofsugars from the co-produced straw and also the recovery of energy coming fromstraw valorization. And in this case, the production of PHA becomes a CO2 well, tothe extent that the indicator is −1.2 to −1.9 kgeqCO2. This example perfectly illustratesthe importance of choosing the right hypotheses and limits on the final result.
7.5.2. On the relevance of inventory data
Let us return to the lifecycle assessment of shopping bags described in section 7.4.The LCA has studied the lifecycles of four types of bags. For example, the lifecycle ofthe disposable HDPE bag (Figure 7.18) first takes into account the exploitation andrefinement of oil for the synthesis of ethylene, the polymerization of ethylene byZiegler-Natta catalysis, the production of HDPE pellets and their transport. However,these data come from the inventory database of 1999 APME (average on 24 Europeansites producing LDPE 3.87 Mt/year, i.e. 89.7% of Western European production). Andyet in the study, we learn that the HDPE is manufactured in France, but also in Asiaand Brazil. Not only the inventory data from APME related to the manufacture ofHDPE date back to 5 years, but also they are not more representative anymore ofmanufacturing carried out in Brazil or Asia – they thus cannot be used to assess theenvironmental impacts. Similarly, the lifecycle of the HDPE bag also takes intoaccount the production of HDPE bags. In this case, the data from inventory databasesof the APME (1993 average of eight production sites in the UK). And yet, theseHDPE bags are made in France. Thus, not only are these data old (over 10 years), butthey also represent only part of the British situation and can never be representative ofthe French situation – in terms of energy consumption only. In fact, if the electricityproduction in France is mainly nuclear (78%) and then thermal (11%) and renewable(11%), this report is completely different in the UK, where electricity is mainly ofthermal origin (75%), then nuclear (20%) and renewable (5%). As a result,environmental impacts are completely different (contribution to global warming) andcannot be used from one country to another.
7.5.3. On the influence of allocation rules
The rules for allocating waste can also play a role in the results of a lifecycleassessment. Thus, if we compare two LCA on bioethanol as biofuels (a LCAconducted by ADEME in 2002 and another one conducted by EDEN in 2006), the

270 Process Engineering and Industrial Management
results are very different. In fact, the energy performance of bioethanol of wheat(returned energy/mobilized renewable energy) varies from single to double for bothstudies: 1.10 for EDEN and 2.05 for ADEME. These differences may be explainedby the differences in the choices made for the allocation of waste from thebioethanol sector. Thus, EDEN has chosen to include, in its LCA, all the impactsgenerated by the waste from the bioethanol sector, thereby promoting a systematicapproach, while ADEME allocates only 43% of the impacts of waste. ADEME hasdone for this LCA the choice of mass allocation – the bioethanol, product targetedby the sector, representing only 43% of mobilized dry matter. These two options canbe chosen, but it is important to understand that the results can be radically changedbecause of this choice.
7.5.4. On the choice of recycling
Concerning the rules of comparison on the end of life stage, the CIRAIG drawsour attention on the relevance of the comparison of different ways of valorization. Infact, it is usually impossible to directly compare the environmental impacts generatedby the two ways of valorization of a product. If we wish to process 1 ton of wastepaper, we cannot directly compare recycling – that will produce X t (X < 1) ofrecycled paper – and thermal valorization – which will produce a Y MJ quantity ofelectricity. In fact, in the first case, we will always need a power generation and in thesecond case, we will still need paper – these two systems do not render the sameservice. It is therefore necessary to complete this comparison by adding to eachsystem the process avoided depending on the chosen option (see Figure 7.26).
Completed system I: Valorization of paper by recycling & energy production
Completed system II: Valorization of paper by energy valorization & paper production
1 ton of old paperto be processed
1 ton of old paperto be processed
Raw materials
Raw materials
Recycling material by paper
Paper production (average in France)
Conventional production of energy
Energy valorization
Y kg ofpaper
X MJof energy
X MJof energy
Y kg ofpaper
Figure 7.26. Comparison of two completed systems
Therefore, in the first case (paper recycling), we must also take into account in theimpact assessment, the production of Y MJ of electricity depending on local

Lifecycle Analysis and Eco-Design 271
conditions of conventional electricity generation. And in the second case (the thermalvalorization), we must also consider the conventional production of X t of paper fromwood in the impact assessment. We can from now on compare strictly two systemsthat have the same products: X t of paper and Y MJ of electricity.
The LCA is a particularly interesting tool as it enables a multicriteria analysis, onthe entire lifecycle, without limiting ourselves to a single stage (end of life, etc.) or asingle impact (carbon balance, etc.). This tool is standardized through the ISOstandards describing it and guarantees an expert review before publication. And thesame impact, estimated at each stage, can be “added” to give a clear idea and helpdecision-making. However, this tool has certain limitations that particularly lie in thecareful selection of the hypothese definition, limits, and functional unit. Similarly, thefollowed allocation rules or the considered end of life may significantly alter theresults. But the most restrictive limitations of this tool are qualitative andmethodological. In fact, the impacts calculated are only potential impacts and do notreflect the local reality. In addition, this tool is not dynamic. Thus, inventory data, evenwhen they come from measurements made on site, are only valid for a limited timeand are rarely updated. As for the quality of the data, it is unreliable. When theinventory data are derived from databases (EU averages or others), they are notnecessarily representative of local realities and are also limited by a low frequency ofupdating. In all cases, the results obtained are rarely updated. More importantly, theLCA does not enable taking into account the margin of technological progresses that itcompares. Indeed, if we compare a very well-established and highly optimizedtechnology with a new technology, it may be necessary to conclude that the first older,technology, causes less environmental impacts without realizing that the newtechnology has more room for progress. And we can thus decide not to develop thisnew technology even though it would cause less impact after a few optimizations.LCA eases everything, and does not include time as dimensional variable.
7.6. Conclusion: the future of eco-design
Design processes in industry and in particular in chemical industries arenow changing. They must now respond to a holistic challenge of reduction inenvironmental impacts at each stage of the manufacturing process. They mustintegrate eco-design of the product or process. In this approach, lifecycle assessment –LCA – is a crucial tool to support environmental assessment. And in doing so, thelifecycle assessment, by identifying the progress margin in terms of environmentalimpacts, of energy and resource consumption, becomes a strategic tool for innovation.This tool makes it possible to guide the efforts of research and development, therebyleading to the identification of innovative solutions to reduce environmental impacts,to lead to new products, which are “greener”, eco-designed, and responding to themore and more pressing demands of the market and regulations.
272 Process Engineering and Industrial Management
However, the process of lifecycle assessment is performed a posteriori on anexisting product or process and helps us to analyze the environmental impacts of thisproduct or process. The results of this LCA thus put the emphasis on the stages thathave the greatest impact on the environment. We will have to work on these stagesto reduce the environmental impact but only during a phase of product improvementor during the design phase of the “second generation” of this product. In the firstapproach, the lifecycle assessment only enables us to compare the environmentalimpact of two products to find the best compromise. And this tool has bothqualitative and methodological limitations. Thus, the definition of the hypotheses,limits, functional unit, and followed allocation rules or of the considered end of lifemay significantly alter the results.
But the most restrictive limitations of this tool are qualitative andmethodological. Qualitative, because the relevance of the data is essential whenassessing impacts and because these data are not always relevant or updated in thedatabases, they are not always representative of the local reality. Methodological, asthis tool only enables a comparison in time, an assessment of the relative impactsand does not take into account the margin of technological progress that it compares.Thus, we wish for this lifecycle assessment tool to evolve, remedy these limitationsand to better assess impacts associated with the toxicity and pollution. In addition, tomeet the new constraints in the innovation processes, to be upstream of the projectphases, to support the design of the products and processes in the chemical industry,and to take into account the new regulatory aspects, we need new tools givingguidelines to be followed to guide the choices of researchers and chemists. Itbecomes more and more important to assist the innovation process with a tool thathelps piloting, gate to gate, instead of concluding it from a comprehensive analysisa posteriori. And it is essential to extend this environmental design to all projects inthe chemical industry to make eco-design emerge in this sector. For this, productand process designers in the chemical industry are in need of a suitable tool, easy touse and not just made for environmental balance experts, a tool that can guide themfrom the choice of access routes on final environmental impact. And industrialistsmust also expand the collection of inventory data and share these inventory data tocontribute to update the database inventory, which is a real “Achilles heel” of LCA.In addition, it is crucial to link the inventory databases to those of the classificationof dangerous substances. How can we imagine nowadays the identification of achemical access way without anticipating the constraints imposed by regulations andin particular the REACH regulation? It is also important to be able to generalize theuse of such a tool for smaller companies to increase their competitiveness. It is thusnecessary to provide them with a tool usable at all stages of the project early in thestages of innovation, includes guiding the choices of R&D. Existing tools do notnecessarily respond to this objective, particularly for SMEs in the chemical industry,which are looking for a simplified reference frame to enable them to integrate theconcept of sustainable development in the design of their products. Thus, if qualitymanagement began in 1992 for major groups, these actions have only started about2004–2006 for smaller structures. Nowadays, in the industrial sector, only a quarter

Lifecycle Analysis and Eco-Design 273
of the companies provided for the end of life of its products, and there are eco-design practices among 40% of them. Finally, it is essential for companies to takeover the involvement in research and education and to help to mobilize the publicresearch teams in this area.
7.7. Bibliography
[ACA 05] ACADÉMIE DES TECHNOLOGIES, Les Analyses de Cycle de Vie, Ouvrage collectif,Paris, 2005.
[ART 10] Article 8 – Décret Impérial Français 15/10/1810 relatif aux manufactures.
[AZÉ 07] AZEMAR M., Les Sciences chimiques au service de l’environnement, inCommunication, Pollutec, Paris, 2007.
[BAI 07] BAIRD R., MIGIRO K., NUTT D., KWATRA A., WILSON S., MELBY J., PENDLETON A.,RODGERS M., DAVISON J., Human Tide, The Real Migration Crisis, Christian Aid report,in BURTON A. (ed.), May 2007.
[BAR 09] BAROMETRE IRSN – La perception des risques et de la sécurité par les Français,éditions 2006, 2007, 2008 and 2009, Sources Institut de Radioprotection et de SûretéNucléaire.
[BOE 05] BOEGLIN N., VEUILLET D., Introduction à l’analyse de cycle de vie (ACV),ADEME, Paris, 2005
[CAI 08] CAILLOL S., “Analyse de cycle de vie et écoconception: les clés d’une chimieNouvelle”, Annales des Mines Réalités Industrielles – L’Eco-conception, une nouvelleEconomie Industrielle?, November 2008, p. 34-41.
[CST 05] CSTB, Référentiel technique de certification “Bâtiments tertiaires – DémarcheHQE”, 2005.
[DEL 98] DELONG J.B., Estimating World GDP, One Million B.C. – Present, University ofBerkeley, Berkeley, 1998.
[DIR 00a] DIRECTIVE 2000/60/CE, Journal Officiel de l’Union Européenne, L327, 22December 2000.
[DIR 00b] DIRECTIVE 2000/53/CE, Journal Officiel de l’Union Européenne, L269, p. 34-43,21 October 2000.
[DIR 03] DIRECTIVE 2002/96/CE (modifiée 2003/108/CE), Journal Officiel de l’UnionEuropéenne, L345, p. 106-107, 31 December 2003.
[DIR 04] DIRECTIVE 2004/42/CE, Journal Officiel de l’Union Européenne, L143, p. 87-96, 30April 2004.
[DIR 05] DIRECTIVE 2005/32/CE, Journal Officiel de l’Union Européenne, L191/29, 6 July 2005.
[DIR 08] DIRECTIVE 2008/28/CE, Journal Officiel de l’Union Européenne, L81/48, 1 March 2008.
[DUP 08] DUPONT G., “Le jour où l’humanité a épuisé le produit global de la Terre”, LeMonde, 24 September 2008.
274 Process Engineering and Industrial Management
[ECO 04] ECOBILAN PWC, Evaluation des impacts environnementaux des sacs de caisseCarrefour, ADEME, Paris, 2004.
[GRE 07] Grenelle Environnement, Ministère de l’Ecologie, de l’Energie, du DéveloppementDurable et de la Mer, 2007.
[EHR 71] EHRLICH P., HOLDREN J., “The impact of population growth”, Science, vol. 171,p. 1212-1217, 1971.
[IEA 07] IEA,World Energy Outlook, IEA Books, Paris, 2007.
[JOL 05] JOLLIET O., SAADÉ M., CRETTAZ P., Analyse du cycle de vie – Comprendre etréaliser un écobilan, Presses polytechniques et universitaires romandes, Lausanne, 2005.
[JUR 54] JURAN J., “Les universaux en management, organisation et contrôle”, TheManagement Control, 1954.
[KIM 05] KIM S., DALE B., International Journal of LifeCycle Assessment, vol. 10, no. 3,p. 200-210, 2005.
[NAT 69] UNITED NATIONS, Problems of the Human Environment: Report of the SecretaryGeneral – 47th Session of the Economic and Social Council, 1969.
[NAT 00] UNITED NATIONS, Long-Range World Population Projections: Based on the 1998Revision, 2000.
[PUY 99] PUYOU J.-B., Démarches d’écoconception en entreprise, Techniques de l’Ingénieur,Paris, 1999.
[PON 00] PONTINGC., Le viol de la Terre, Nil Editions, Paris, 2000.
[PON 08] PONSM.N., Analyse du cycle de vie – Comment choisir un logiciel, Techniques del’Ingénieur, Paris, 2008.
[REA 06] REACH, Règlement (CE) no. 1907/2006 du Parlement européen et du Conseil du18 December 2006.
[REY 08] REYES T., “Intégration de l’environnement dans la conception des produits”, UTT,2008.
[SAD 06] SADONES P., Les Agrocarburants, Report, EDEN, 2006.
[SAO 01a] SAOUTER E., VAN HOOF G., PITTINGER C., FEIJTEL T., “The effect of compactformulations on the environmental profile of northern European granular laundrydetergents”, International Journal of LifeCycle Assessment, vol. 6, no. 6, p. 363-372, 2001.
[SAO 01b] SAOUTER E., VAN HOOF G., PITTINGER C., FEIJTEL T., “The effect of compactformulations on the environmental profile of northern European granular laundrydetergents”, International Journal of LifeCycle Assessment, vol. 7, no. 1, p. 27-38, 2001.
[STE 06] STERNN., The Economics of Climate Change – The Stern Review, Cabinet Office –HM Treasury, 2006.
[STE 08] STEELCASE, Rapport de responsabilité sociale 2008, enterprise, 2008.
[UIC 08] “2008 Bilan de l’industrie chimique en France”, in Conférence de presse UIC,Union des Industries Chimiques, Paris, 2008.