an empirical study of industrial requirements engineering ... · an empirical study of industrial...
TRANSCRIPT

An Empirical Study of IndustrialRequirements Engineering ProcessAssessment and Improvement
IAN SOMMERVILLE and JANE RANSOMComputing Department, Lancaster University
This article describes an empirical study in industry of requirements engineering process maturityassessment and improvement. Our aims were to evaluate a requirements engineering processmaturity model and to assess if improvements in requirements engineering process maturity leadto business improvements. We first briefly describe the process maturity model that we used andmodifications to this model to accommodate process improvement. We present initial maturityassessment results for nine companies, describe how process improvements were selected andpresent data on how RE process maturity changed after these improvements were introduced.We discuss how business benefits were assessed and the difficulties of relating process maturityimprovements to these business benefits. All companies reported business benefits and satisfactionwith their participation in the study. Our conclusions are that the RE process maturity model isuseful in supporting maturity assessment and in identifying process improvements and there issome evidence to suggest that process improvement leads to business benefits. However, whetherthese business benefits were a consequence of the changes to the RE process or whether thesebenefits resulted from side-effects of the study such as greater self-awareness of business processesremains an open question.
Categories and Subject Descriptors: D.2.1 [Software Engineering]: Requirements/Specifications;D.2.8 [Software Engineering]: Metrics; D.2.9 [Software Engineering]: Management
General Terms: Experimentation, Measurement
Additional Key Words and Phrases: Software process improvement, process measurement, require-ments engineering, empirical software engineering
1. INTRODUCTION
The notion of process improvement and consequent business benefits throughincreased product quality and productivity is rooted in the work of Deming[1982] in his work on statistical quality control. Deming’s approach was geared
This research was partially funded by the European Commission’s Framework 5 research programunder contract number IST-2000-28760.Authors’ address: Computing Department, Infolab21, South Drive, Lancaster University, LancasterLA1 4WA, UK; email: {is,bjr}@comp.lancs.ac.uk.Permission to make digital or hard copies of part or all of this work for personal or classroom use isgranted without fee provided that copies are not made or distributed for profit or direct commercialadvantage and that copies show this notice on the first page or initial screen of a display alongwith the full citation. Copyrights for components of this work owned by others than ACM must behonored. Abstracting with credit is permitted. To copy otherwise, to republish, to post on servers,to redistribute to lists, or to use any component of this work in other works requires prior specificpermission and/or a fee. Permissions may be requested from Publications Dept., ACM, Inc., 1515Broadway, New York, NY 10036 USA, fax: +1 (212) 869-0481, or [email protected]© 2005 ACM 1049-331X/05/0100-0085 $5.00
ACM Transactions on Software Engineering and Methodology, Vol. 14, No. 1, January 2005, Pages 85–117.

86 • I. Sommerville and J. Ransom
towards repeatability so that process performance was not dependent on indi-viduals but was predictable, so that repeating the same work would produce,more or less, the same result. To achieve better results, the process there-fore had to be improved and Deming successfully introduced a measurement-improvement cycle for industrial processes.
Deming’s approach was adopted by Humphrey [1989] and others at the Soft-ware Engineering Institute in the 1980s, and they developed it for softwareprocess improvement. The seminal results of this work were the notion of soft-ware process maturity and an identification of a process maturity model withdiscrete levels of process maturity. This was an essential basis for the devel-opment of the Software Capability Maturity Model (CMM), described by Paulk[Paulk et al. 1993, 1995] which allows the maturity status of software devel-opment organizations to be assessed. Over time, the CMM has evolved froman assessment model to an essential component of an integrated approach tosoftware process improvement [Ahern et al. 2001].
The general notion of a process maturity model has been extended at the SEIinto other areas such as personnel assessment and systems engineering. Theconcept has also been taken up and incorporated into other process improve-ment models such as the European BOOTSTRAP model [Haase et al. 1994;Koch 1993; Kuvaja et al. 1994] and the Canadian TRILLIUM model [Coallier1999]. The SPICE project [El Emam et al. 1997; Konrad and Paulk 1995, Paulkand Konrad 1994] is a continuing initiative to develop an international stan-dard for software process improvement where a continuous improvement modelis suggested that pulls together the different models that have been proposedor are in use. The CMMI model [Ahern et al. 2001] also integrates differentmodels and has both staged and continuous versions.
Our previous work in RE process improvement resulted in the develop-ment of a maturity model for requirements engineering processes analogousto the CMM model for software processes [Sawyer et al. 1998, 1999a, 1999b;Sommerville and Sawyer 1997]. Like all other approaches to process maturityassessment, our work has been inspired by the initial concepts developed byHumphrey; but we have focused on requirements engineering (RE) processes—an area that has been mostly outside the scope of other process improvementmodels. Our rationale for concentrating on this early phase of the softwareprocess was that problems in this area have a profound effect on system devel-opment costs and functionality and that a very large number of organizationshave poorly defined and informal RE processes.
System requirements engineering problems are universal and very signifi-cant indeed. In an early paper, Boehm [1983] suggested that errors in systemrequirements could be up to 100 times more expensive to fix than errors intro-duced during system implementation. Lutz [1993] showed that 60% of errorsin critical systems were the results of requirements errors. In 1996, a survey ofEuropean companies found that more than 60% of them considered require-ments engineering problems as very significant [Espiti 1996]. Recently, Hallet al. [2002] carried out a case study of 12 companies at different levels of ca-pability as measured by the CMM. They discovered that, out of a total of 268development problems cited, almost 50% (128) were requirements problems.
ACM Transactions on Software Engineering and Methodology, Vol. 14, No. 1, January 2005.
Engineering Process Assessment and Improvement • 87
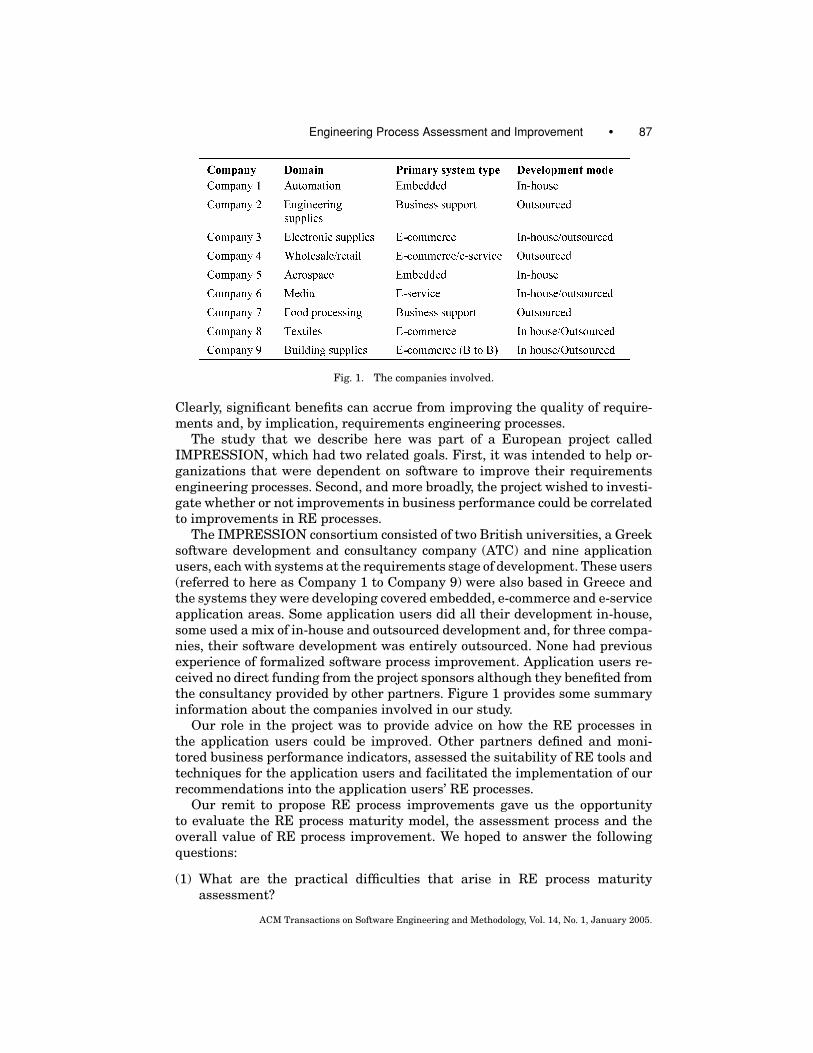
Fig. 1. The companies involved.
Clearly, significant benefits can accrue from improving the quality of require-ments and, by implication, requirements engineering processes.
The study that we describe here was part of a European project calledIMPRESSION, which had two related goals. First, it was intended to help or-ganizations that were dependent on software to improve their requirementsengineering processes. Second, and more broadly, the project wished to investi-gate whether or not improvements in business performance could be correlatedto improvements in RE processes.
The IMPRESSION consortium consisted of two British universities, a Greeksoftware development and consultancy company (ATC) and nine applicationusers, each with systems at the requirements stage of development. These users(referred to here as Company 1 to Company 9) were also based in Greece andthe systems they were developing covered embedded, e-commerce and e-serviceapplication areas. Some application users did all their development in-house,some used a mix of in-house and outsourced development and, for three compa-nies, their software development was entirely outsourced. None had previousexperience of formalized software process improvement. Application users re-ceived no direct funding from the project sponsors although they benefited fromthe consultancy provided by other partners. Figure 1 provides some summaryinformation about the companies involved in our study.
Our role in the project was to provide advice on how the RE processes inthe application users could be improved. Other partners defined and moni-tored business performance indicators, assessed the suitability of RE tools andtechniques for the application users and facilitated the implementation of ourrecommendations into the application users’ RE processes.
Our remit to propose RE process improvements gave us the opportunityto evaluate the RE process maturity model, the assessment process and theoverall value of RE process improvement. We hoped to answer the followingquestions:
(1) What are the practical difficulties that arise in RE process maturityassessment?
ACM Transactions on Software Engineering and Methodology, Vol. 14, No. 1, January 2005.
88 • I. Sommerville and J. Ransom
(2) Is the RE process maturity model a useful basis for an RE process improve-ment initiative?
(3) Do improvements in RE process maturity lead to real business benefits?
The work described here is novel in that it represents the first systematicevaluation of the RE process maturity model across a range of companies. Whilethe model has been used, both by ourselves and others, within individual com-panies the degree of formality with which it has been applied has been veryvariable. We believe that, while it has had a significant influence on some REprocess improvement initiatives, it has not previously been used by us in asystematic way where “before and after” maturity assessments were carriedout.
The remainder of the article focuses on our requirements maturity assess-ment work in the IMPRESSION project. We summarize our requirements engi-neering maturity assessment process, discuss the application of this model andhow it was used to propose process improvements. We then present the resultsof a re-application of the assessment, reflect on the success of our process im-provement proposals and discuss how we tried to assess business benefits fromprocess improvement. Finally, we discuss the lessons learned from this studyfor the requirements engineering process maturity model and, more generally,for requirements engineering process improvement.
2. THE REQUIREMENTS PROCESS MATURITY MODEL
In a previous project (REAIMS), concerned with the improvement of processesfor safety-critical systems development, we developed a maturity model forrequirements engineering processes and an associated method for process as-sessment. This model and associated research has been documented in a book[Sommerville and Sawyer 1997] and in a number of papers [Sawyer et al. 1998,1999a, 1999b]. This article is primarily concerned with the use and evalua-tion of the model rather than its development. Consequently, we present onlya brief summary of the RE process maturity model to provide a context for thedescription of the process improvement study.
The requirements engineering maturity assessment method that we devel-oped helps organizations to compare their RE processes to industrial good prac-tice and to identify possible process improvements. At the heart of our methodis a process maturity model for requirements engineering that complementsthe SEI’s Capability Maturity Model, which does not cover requirements engi-neering processes. As many of the companies that we worked with were awareof the work of the SEI, we decided to use CMM-compatible terminology andtherefore proposed three levels of RE process maturity corresponding to thefirst three levels in the CMM:
Initial. The requirements engineering processes are inadequate, and dependon the skills and experience of individual engineers. Timescales and budgetsare often not met, requirements are not properly managed and requirementsdocuments may be nonexistent or poorly structured and inconsistent.
ACM Transactions on Software Engineering and Methodology, Vol. 14, No. 1, January 2005.
Engineering Process Assessment and Improvement • 89
Repeatable. Companies have explicit standards for requirements documentsand descriptions and have introduced policies and repeatable procedures forrequirements management. Basic cost and scheduling management proceduresare in place and some advanced requirements engineering tools and techniquesmay be used.
Defined. The RE process for both management and engineering are docu-mented, standardised and integrated into a standard process that enables ac-tive process improvement.
We chose three rather than five levels as in the CMM because our initial workin formulating the maturity model suggested that there were so few companieswith defined RE processes that including the higher CMM levels (Managed andOptimizing) was not worthwhile. This data gathered in the study described inthis article confirmed our view that RE process maturity was generally low andthat higher levels of process maturity would not, at this stage, be useful.
Essentially, our approach is based on the notion that the level of processmaturity reflects the extent that good RE practices and used and standardizedin a company. We identified 66 good practice guidelines, a method of assign-ing scores to them and an algorithm that determines the RE maturity levelof an organization. These good RE practices fall into three categories, basic,intermediate and advanced:
Basic practices. There are 36 basic practices that are concerned with funda-mental activities that are required to gain control of the RE process and, gener-ally, are applicable across application domains. Most of the basic good practicesare concerned with documenting, validating and managing requirements.
Intermediate practices. There are 21 intermediate practices are mostly con-cerned with the use of methodical approaches to requirements engineering andthe use of tools. Again, they are mostly domain-independent.
Advanced practices. There are nine advanced practices that are concernedwith methods such as formal specification and organizational change. The keydistinction between advanced and intermediate practices are that advancedpractices are mostly geared to critical systems development. This reflects thefact that the model was originally developed in collaboration with companiesinvolved in safety-critical systems engineering.
Good practices are associated with important requirements engineering pro-cess areas as shown below (the area number reflects the chapter in our book[Sommerville and Sawyer 1997] describing these practices):
3 The Requirements Document4 Eliciting Requirements5 Requirements Analysis and Negotiation6 Describing Requirements7 System Modelling8 Requirements Validation9 Requirements Management
10 Critical Systems Requirements
ACM Transactions on Software Engineering and Methodology, Vol. 14, No. 1, January 2005.

90 • I. Sommerville and J. Ransom
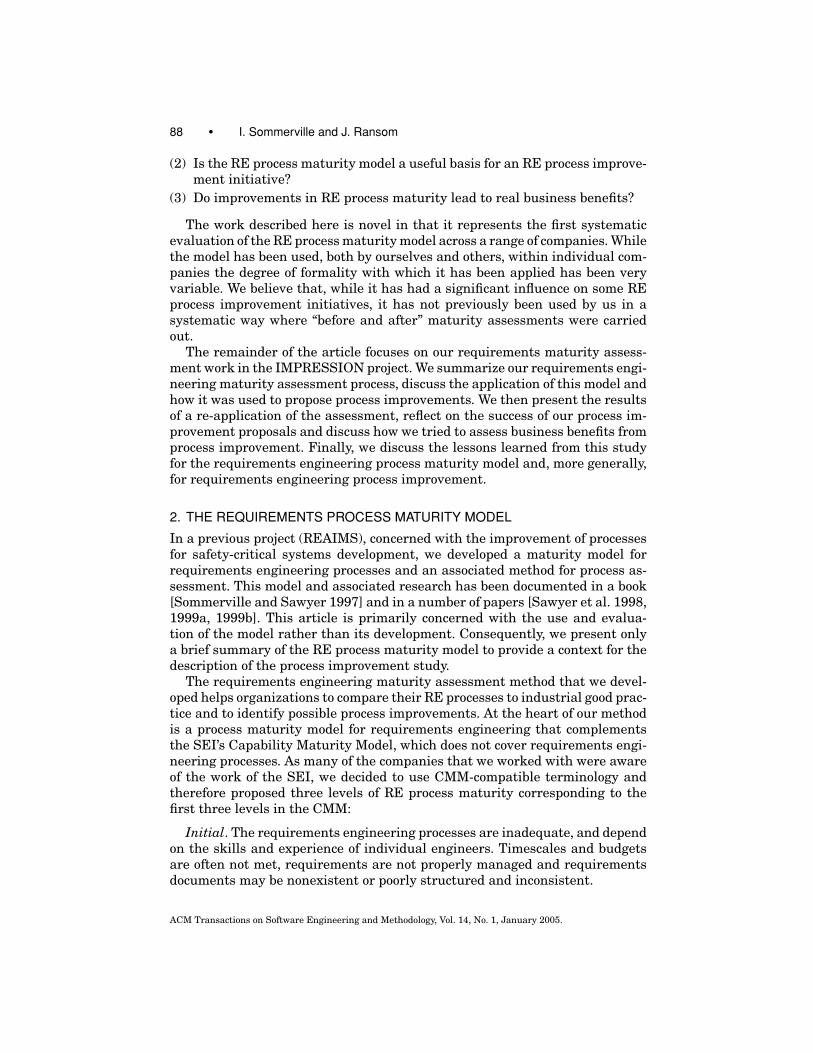
Fig. 2. RE process maturity levels.
Some examples of the good requirements engineering practices that we pro-posed are:
3.1 Define a standard document structure (Basic)4.3 Identify and consult system stakeholders (Basic)6.2 Use language simply, consistently and concisely (Basic)8.2 Organise formal requirements inspections (Basic)
4.10 Prototype poorly understood requirements (Intermediate)9.6 Define change management policies (Intermediate)
10.6 Specify systems using formal specifications (Advanced)10.8 Collect incident experience (Advanced)
We do not have space to discuss the details of these guidelines here. In our book[Sommerville and Sawyer 1997], each good practice guideline is described indetail, along with its expected benefits, the cost of introduction and the costsof using that guideline. Further examples of good practice guidelines are listedlater in this article in Figures 9 and 10.
To assess process maturity, the assessor examines the RE processes used ina company and decides which practices that the company has adopted. This as-sessment cannot be carried out mechanically but requires judgment to recognizewhen particular ways of working correspond to the good practice recommen-dations. To reflect whether or not a practice has been institutionalized, theassessor allocates a weighted score to each practice according to its use withinan organization as follows:
—Never used (Score = 0)—Discretionary—used at the discretion of individuals (Score = 1)—Normal—used by many teams but in different ways (Score = 2)—Standardized—used throughout the company in a standardized way
(Score = 3)
The maturity level is computed by summing these weighted scores for allBasic guidelines and for the Intermediate/Advanced guidelines. The score istherefore presented as a pair of numbers M | N where M is the weightedscore for Basic guidelines and N the weighted score for Intermediate/Advancedguidelines.
The threshold levels in the model that we proposed are shown in Figure 2.These threshold levels and the scores associated with these levels were de-rived after extensive discussions with RE practitioners in industry and they
ACM Transactions on Software Engineering and Methodology, Vol. 14, No. 1, January 2005.
Engineering Process Assessment and Improvement • 91
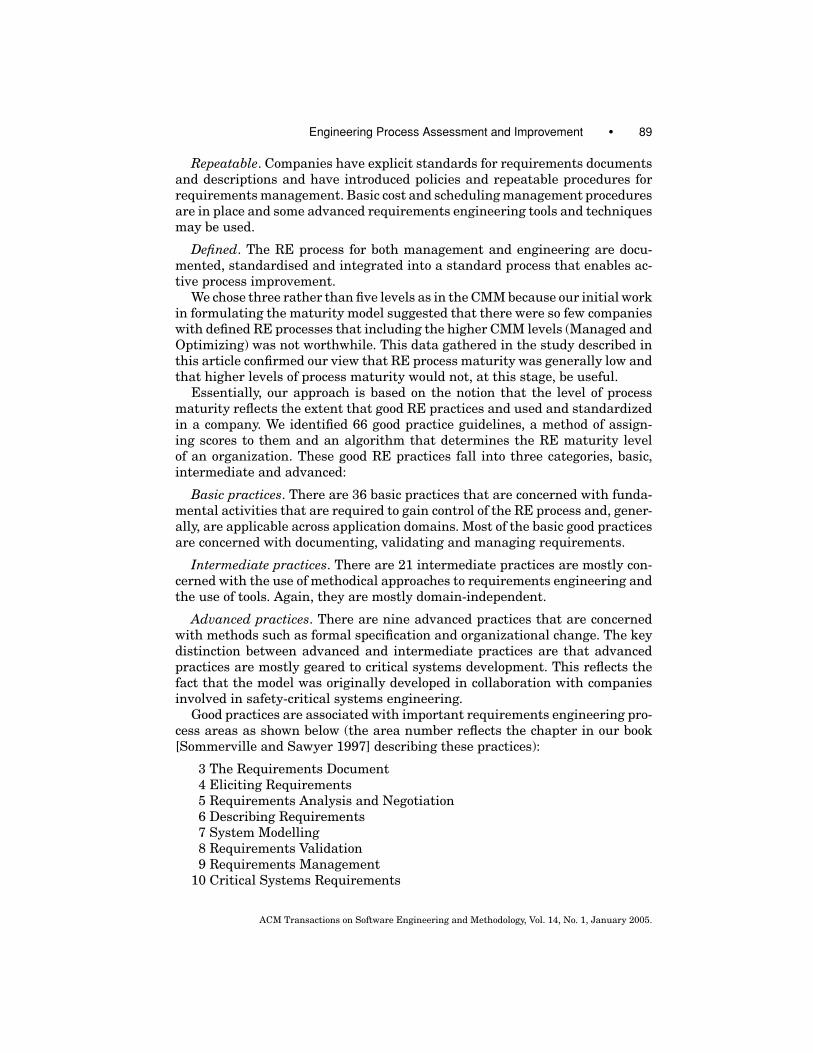
Fig. 3. Requirements engineering process maturity assessment.
reflect our judgment and experience in good requirements engineering practice.Essentially, to move from an Initial to a Repeatable level, a company must havea sound base of RE practices in place and to move from Repeatable to Defined,this must be supplemented by the use of methodical approaches.
As is now recognized in the CMMI approach [Ahern et al. 2001], the thresholdlevels in all discrete maturity models are arbitrary and this is certainly trueof our model. Discrete models have the advantage that they establish goalsfor companies trying to increase their maturity but, as we discuss later, one ofthe results of this project was to convince us that a continuous rather than adiscrete maturity model is more appropriate for most requirements engineeringprocesses.
3. RE PROCESS MATURITY ASSESSMENT
The process maturity assessment method involves assessing the use of RE prac-tices in an organization and using the results to determine a process maturitylevel. The process that we originally designed to assess the maturity level con-sists of five steps, as shown in Figure 3:
(1) Prune Guideline Checklist. Quickly identify practices that are never usedin an organization (e.g., formal methods) to eliminate the correspondingguidelines from the assessment. Therefore, time is not wasted on unneces-sary discussion.
(2) Select People to Interview. Select contacts within the organization who knowthe practices used and can advise on the level of usage.
(3) Score Practices against Checklist. Allocate each practice a score by inter-viewing the contacts.
(4) Resolve Areas of Uncertainty. Once an initial set of scores has been ob-tained, resolve all areas of uncertainty by further stakeholder discussionand ensure the scoring method is consistent.
(5) Compute Process Maturity. Compute the RE process maturity by calculatingthe total score and assigning a level as shown in Figure 2.
Maturity assessments are summarized in a maturity matrix as shown inFigure 4, which shows the number of good practices used and the overall ma-turity assessment. The maturity matrix includes columns for each of the three
ACM Transactions on Software Engineering and Methodology, Vol. 14, No. 1, January 2005.

92 • I. Sommerville and J. Ransom
Fig. 4. The organization of a requirements maturity matrix.
categories of good practice guidelines, Basic, Intermediate and Advanced andinformation in each row about these guidelines:
� Row 1 shows the number of guidelines in each category that are actuallyused.
� Row 2 shows the weighted score, as explained above, reflecting the extent towhich the guideline use is standardized in the organization.
� Row 3 shows the maximum possible score that can be attained if all guidelinesin that category are used and standardized.
� Row 4 shows the percentage of this maximum actually achieved in this as-sessment.
� Row 5 shows the assessed maturity level (Initial, Repeatable or Defined).
The information in the maturity matrix is the basic starting point for discus-sions on process improvement. As we discuss in later sections, this is thensupplemented by further process information to give a broader picture of theuse of RE practices and possible process improvements.
4. THE IMPRESSION EXPERIMENT
The aim of our study was to collect information that would help us assess andimprove the requirements engineering process maturity model. At the sametime, the overall project had the goal of improving the requirements engineeringprocesses in the application users and assessing the relationship between theseimproved processes and business performance. We were not directly involved inbusiness performance measurement—other partners (City University, London)developed ways of monitoring business performance and applied this with theapplication users. This was done in parallel with the activities that we describebelow.
The IMPRESSION project was an 18-month project with a 3-month startupand training phase followed by a 14-month assessment and improvement phaseand then a final, 1-month, reporting phase. The stages of the work where we
ACM Transactions on Software Engineering and Methodology, Vol. 14, No. 1, January 2005.
Engineering Process Assessment and Improvement • 93
were involved were:
(1) Method and Tool Development. We adapted the RE process maturity assess-ment process to the circumstances of this project and trained consultantsfrom ATC in the process maturity method. We also developed the IMPRES-SION maturity assessment tool that supports the method (Months 1–3).
(2) Initial Maturity Assessment of the Application Users. This involved consul-tants from ATC visiting all of the application users, carrying out a pro-cess maturity assessment and collecting maturity information in the tooldatabase. This was sent to us for detailed analysis (Month 4).
(3) Process Improvement. This stage involved us in producing a list of improve-ment recommendations and passing these to our consultant partners forimplementation with the application users (Month 5). We provided supportover the next 10 months to ATC during the improvement implementationphase of the project. (Months 6–16).
(4) Process Maturity Reassessment. ATC then reassessed the process maturityand, as before, transferred the results to us for analysis. (Month 17).
(5) Business Performance and RE Process Improvement Analysis. Working withour partners, we analysed the process improvement and business improve-ment data and tried to understand the relations between these (Month 18).
We discuss each of these stages in more detail in later sections of this article.The IMPRESSION experiment involved real industrial companies with real
problems. Unlike a university experiment carried out using students from thesame background and pre-prepared materials, we had virtually no control overexperimental variables such as the selection of subjects, their commitment andthe projects used in the assessment. However, requirements engineering isprimarily an industrial problem that is influenced by technical, business, eco-nomic and political factors. Working with industrial users reflects the realityof requirements engineering and we suspect that it is practically impossible toreplicate this industrial reality in a university setting.
The fact that the work involved international partners offered us an impor-tant advantage from the point of view of experimentation. Because our applica-tion user partners normally worked in Greek rather than English, we were notdirectly involved in applying our maturity model. Hence, we avoided a problemof software engineering experimentation where the experiment is carried out bythe inventor of some technique. Under those circumstances, it is very difficultfor the experimentor to be objective and hence there is always some questionmark over “successful” results. We are therefore confident that the results thatwe present in this paper are not strongly biased by our own desire for our modelto “work”.
5. METHOD AND TOOL DEVELOPMENT
It is a truism that any method has to be adapted for particular circumstances ofuse and the first stage in our work in the IMPRESSION project was to examinethe maturity assessment process to assess what changes were required. The
ACM Transactions on Software Engineering and Methodology, Vol. 14, No. 1, January 2005.

94 • I. Sommerville and J. Ransom
driving factor for change was the fact that we would be indirectly rather thandirectly involved in the assessment and improvement process and that ourGreek consultant partners, who had experience of requirements engineeringbut not of RE process improvement, would be our interface with the applicationusers.
The principal method change that we introduced was to make specific sugges-tions for improvements to be introduced rather than simply leave this entirelyto the judgment of the assessor. To simplify the task of the assessor, we alsodeveloped a simple tool that supported the process of assessment, automatedthe maturity level computation and provided a series of process reports for theassessor and application users.
When originally developing the process maturity model, we assumed thata consultant would work with an organization and use their own knowledgeof requirements engineering to propose process improvements that were ap-propriate to that context. In practice, after discussions with our technologypartners, it became clear that some improvement guidance based on the goodpractice guidelines would be helpful. We therefore extended the maturity as-sessment method with additional activities geared to improvement ratherthan assessment. The improvement approach that we proposed was a cyclicalprocess:
(1) Assess the process maturity of the organization.(2) Using information on possible improvements suggested by the IMPRES-
SION tool, identify the most cost-effective improvements that can be intro-duced in the time available.
(3) Implement these improvements and then re-assess the maturity level. Thislater reassessment allows us to check if the improvements have been im-plemented and if implementing the improvements has adversely affectedthe use of existing good practice.
To support this process, we extended the maturity assessment method with twoadditional steps:
Compare Levels. This is a feedback facility to compare the results of the cur-rent assessment with the previous assessment, using the type of improvementsmade, prior to making further recommendations for improvements.
Recommend Improvements. This allows for the input of improvement rec-ommendations so that we could, at the end of the assessment, analyse whichguidelines have been implemented and to what extent.
The tool main control window display (Figure 5) shows these extra steps.The IMPRESSION tool that we developed in the first phase of the project sup-
ports data collection, maturity assessment computation and report generation.It is a stand-alone tool, developed using Java and a Microsoft Access database,incorporating a model of the assessment process and providing user supportat each stage of that process. It is calibrated with the 66 good practice guide-lines and computation methods, interactively accepts scores and recommenda-tions from a user, performs the maturity calculations and provides an extensive
ACM Transactions on Software Engineering and Methodology, Vol. 14, No. 1, January 2005.

Engineering Process Assessment and Improvement • 95
Fig. 5. The IMPRESSION maturity assessment tool.
reporting capability. We chose this approach to implementation rather than aspreadsheet approach because it made it easier to create and adapt reportsabout the processes in individual companies.
The primary motivation for developing this tool was the need for rapid matu-rity assessment. To assess process maturity, an assessor has to assess the levelof standardisation for each of 66 Guidelines and allocate each a score. Then, toarrive at a maturity level and perform an analysis, these assessments must beseparated, sorted and summed. Reports are then created for the client whoseprocess maturity is being assessed.
The process maturity computations are not difficult but are tedious andprone to error. Report generation, however, can take a considerable time, asthis involves identifying and collating the practices used in a company andpresenting these in different ways. Manually, excluding the time required forinformation gathering, we estimated that computing the process maturity andgenerating the required reports for each company would take about 2 workingdays.
Our aim in developing the IMPRESSION tool was to reduce the time forinformation processing and report generation to 2–3 hours. The time requiredfor information gathering at each company varied from 1 to 3 days initially,with slightly less time required for information gathering when maturity re-assessment was carried out. Therefore, with the tool, it was possible to carryout all initial maturity assessments within a month thus leaving us time tointroduce process improvements and re-assess the process maturity. Developingthe tool took about 3 weeks of effort so we estimated that the time savings were
ACM Transactions on Software Engineering and Methodology, Vol. 14, No. 1, January 2005.
96 • I. Sommerville and J. Ransom
worthwhile. A further benefit of using the tool, rather than manual analysis,was that all data was expressed in a standard way so that it was simpler tomake comparisons across the different companies involved.
6. INITIAL RE PROCESS MATURITY ASSESSMENT
The maturity matrices, described in Section 3.1, following the first assessmentsof the maturity of the application users are shown in Figure 6. These are orderedleft to right depending on the number of basic guidelines that were used. Theinitial maturity assessment showed large variations in process maturity acrossthe companies even although all of them were assessed at operating at an Initiallevel of maturity. For example, Company 6 made extensive use of good practicewhereas Company 2 essentially did not do any requirements engineering intheir systems’ procurement processes.
As we were not involved directly in the assessment process, we had no in-tuition about the strengths and weaknesses of each company’s processes so, inaddition to the maturity matrices, we added a facility to the tool that presentedan overview of each company’s use of good RE practice according to processarea.
These Area/Strength matrices for each company are shown in Figure 7,which identifies the different types of guideline (rows in the matrix) and clas-sifies the company’s use of guidelines of that type as weak (the leftmost col-umn), average, good and strong (the rightmost column). For example, youcan see from the area/strength matrices that Company 5 is strong in describ-ing requirements and weakest in requirements elicitation, management andsafety requirements (relevant for this company as it operated in the aerospacesector).
The value of the area/strength matrices was that they gave us an overallpicture of the strengths and weaknesses of the application users and helpedus decide where limited improvement effort should be focused. Of course, theyare only a partial view of strengths and weaknesses—they do not show theextent to which practice is institutionalized, but we found them to be a valuablecommunication tool when discussing improvements with management in theapplication companies.
Observations from this initial maturity assessment are:
—Our suspicions that the application users were operating at low maturity lev-els were confirmed. All of the companies were operating at the Initial levelof RE process maturity. However, we were pleased to see that Company 5and Company 6 were fairly close to the weighted score of 55 in basic guide-lines that represented the threshold between Initial and Repeatable levelsof maturity.
—We were surprised that a number of companies successfully used intermedi-ate and advanced good practices in spite of the fact that they did not reallyhave a strong base of fundamental practice. This either meant that our no-tion of what was an intermediate or advanced practice was wrong or thatcompanies could successfully use such practices without having their pro-cesses under control. The companies reported that they used these advanced
ACM Transactions on Software Engineering and Methodology, Vol. 14, No. 1, January 2005.

Engineering Process Assessment and Improvement • 97
Fig. 6. The RE maturity matrices for all application companies after the initial maturityassessment.
ACM Transactions on Software Engineering and Methodology, Vol. 14, No. 1, January 2005.

98 • I. Sommerville and J. Ransom
Fig. 7. Area/strength matrices after the initial maturity assessment.
practices, including the use of formal specification in one company, with-out difficulty. The maturity matrices show the rating of such companies asInitial+ rather than Initial to distinguish them from companies with few orno intermediate or advanced practices.
7. PROCESS IMPROVEMENT
While the benefits of process improvement are widely accepted, in practice,implementing real process improvement is a difficult task. When introducingnew practices or improving existing ones, you have to consider the abilities,receptivity and experience of the personnel involved and the time and resourcesavailable. You have to ensure that business goals are not threatened by theprocess changes and that changes can be introduced without excessive costs.
In the RE Good Practice Guide [Sommerville and Sawyer 1997], we recom-mend that that new RE practices should be introduced incrementally and in
ACM Transactions on Software Engineering and Methodology, Vol. 14, No. 1, January 2005.

Engineering Process Assessment and Improvement • 99
such a way that the use of existing good practice is not compromised. An in-cremental improvement might be the introduction of a small number of newpractices or increasing the score for a particular practice by one level. Based onthe advice associated with the SEI’s Capability Maturity Model for software,we recommend that companies should normally delay the introduction of inter-mediate and advanced practices until a good base of basic practices has beeninstitutionalized.
The IMPRESSION project as a context for process improvement placed ad-ditional constraints on the choice of improvements. To deliver results to theproject sponsor, our recommendations had to be implemented within the rel-atively short timescale of the project. It was a requirement of the applicationusers that the process changes should not disrupt their normal business op-erations. Consequently, our goal was to generate the greatest increase in REmaturity for the lowest cost without compromising organizational profitabilityor operations. To do so, we made the following pragmatic proposals for maturityimprovement:
(1) Focus improvements on areas of requirements engineering where the com-pany is weak as suggested by the Area/Strength matrix.
(2) Consolidate and standardise practices that are already in use in the com-pany.
(3) Only introduce new practices where the cost of introduction is low.
As most Intermediate and Advanced practices require additional training,their costs of introduction is fairly high. We therefore decided to recommend foreach company that the focus of process improvement should be to bring in newBasic practices to strengthen the foundation for requirements engineering andto standardize Basic practices that were already used. Of course, the decisionon what changes were actually made was the company’s not ours. However, allcompanies accepted the wisdom of establishing a strong basis for RE and sofollowed our recommendations.
These proposals had to be interpreted for each of the application user compa-nies involved. Companies with a relatively high maturity level are most likelyto spend time consolidating existing practices. Low-maturity companies needto bring in new practices to establish a base for later standardization.
7.1 Identifying Weak Areas
The first stage in process improvement was to identify the areas where a com-pany is weakest as these are where improvements are most likely to be cost-effective. We therefore identified the need for more detailed information on theuse of good practice in different areas of the requirements engineering processthan was available from the maturity and area/strength matrices. To providethis more detailed information for each company, we added a further report thatshowed how “strong” an organization is in each RE area as the number of prac-tices actually used in that area expressed as a percentage of the total possible.
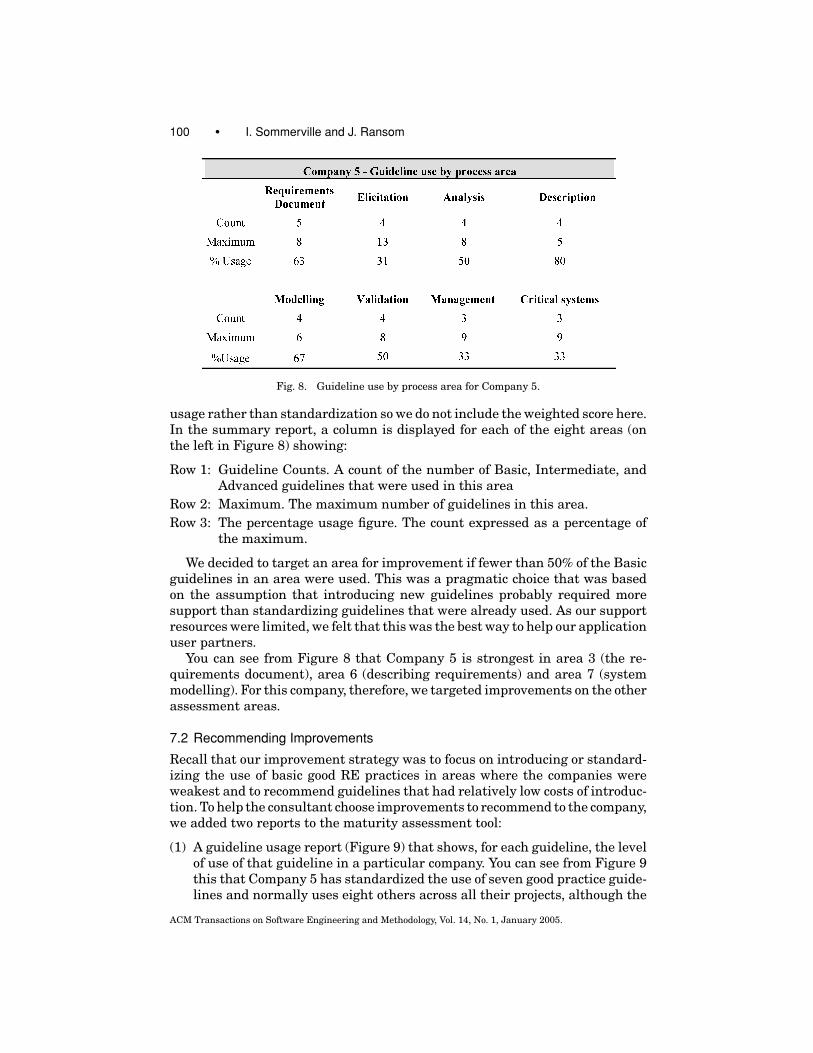
A sample of the report showing guideline use by process area for Company 5is shown in Figure 8. The aim of this report was primarily to show guideline
ACM Transactions on Software Engineering and Methodology, Vol. 14, No. 1, January 2005.
100 • I. Sommerville and J. Ransom
Fig. 8. Guideline use by process area for Company 5.
usage rather than standardization so we do not include the weighted score here.In the summary report, a column is displayed for each of the eight areas (onthe left in Figure 8) showing:
Row 1: Guideline Counts. A count of the number of Basic, Intermediate, andAdvanced guidelines that were used in this area
Row 2: Maximum. The maximum number of guidelines in this area.Row 3: The percentage usage figure. The count expressed as a percentage of
the maximum.
We decided to target an area for improvement if fewer than 50% of the Basicguidelines in an area were used. This was a pragmatic choice that was basedon the assumption that introducing new guidelines probably required moresupport than standardizing guidelines that were already used. As our supportresources were limited, we felt that this was the best way to help our applicationuser partners.
You can see from Figure 8 that Company 5 is strongest in area 3 (the re-quirements document), area 6 (describing requirements) and area 7 (systemmodelling). For this company, therefore, we targeted improvements on the otherassessment areas.
7.2 Recommending Improvements
Recall that our improvement strategy was to focus on introducing or standard-izing the use of basic good RE practices in areas where the companies wereweakest and to recommend guidelines that had relatively low costs of introduc-tion. To help the consultant choose improvements to recommend to the company,we added two reports to the maturity assessment tool:
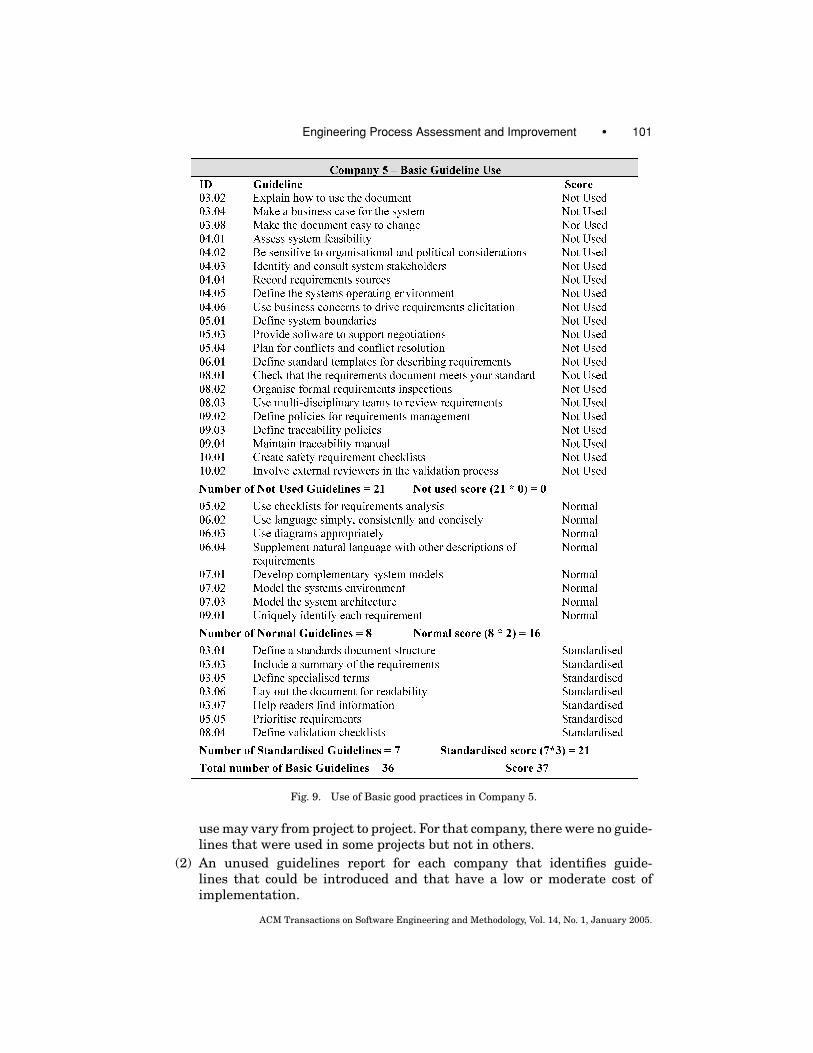
(1) A guideline usage report (Figure 9) that shows, for each guideline, the levelof use of that guideline in a particular company. You can see from Figure 9this that Company 5 has standardized the use of seven good practice guide-lines and normally uses eight others across all their projects, although the
ACM Transactions on Software Engineering and Methodology, Vol. 14, No. 1, January 2005.
Engineering Process Assessment and Improvement • 101
Fig. 9. Use of Basic good practices in Company 5.
use may vary from project to project. For that company, there were no guide-lines that were used in some projects but not in others.
(2) An unused guidelines report for each company that identifies guide-lines that could be introduced and that have a low or moderate cost ofimplementation.
ACM Transactions on Software Engineering and Methodology, Vol. 14, No. 1, January 2005.

102 • I. Sommerville and J. Ransom
Fig. 10. Guidelines that could be introduced by Company 5.
Figure 10 shows the unused guidelines for Company 5. Our intention in thisreport was to identify guidelines with a low introductory cost so, for complete-ness, highlighted all such guidelines that a company did not use and not justBasic guidelines. It was then up to each company, to decide which of theseto select for introduction and to set their own schedule for improvement. Ourpartners ATC acted as consultants during this period helping the applicationusers prioritize their needs, select appropriate guidelines and introduce thesein different projects within the company.
8. FINAL RE PROCESS MATURITY ASSESSMENT
The purpose of this assessment was to compare the results with the initial as-sessment to quantify the actual RE process improvements made. The maturity
ACM Transactions on Software Engineering and Methodology, Vol. 14, No. 1, January 2005.

Engineering Process Assessment and Improvement • 103
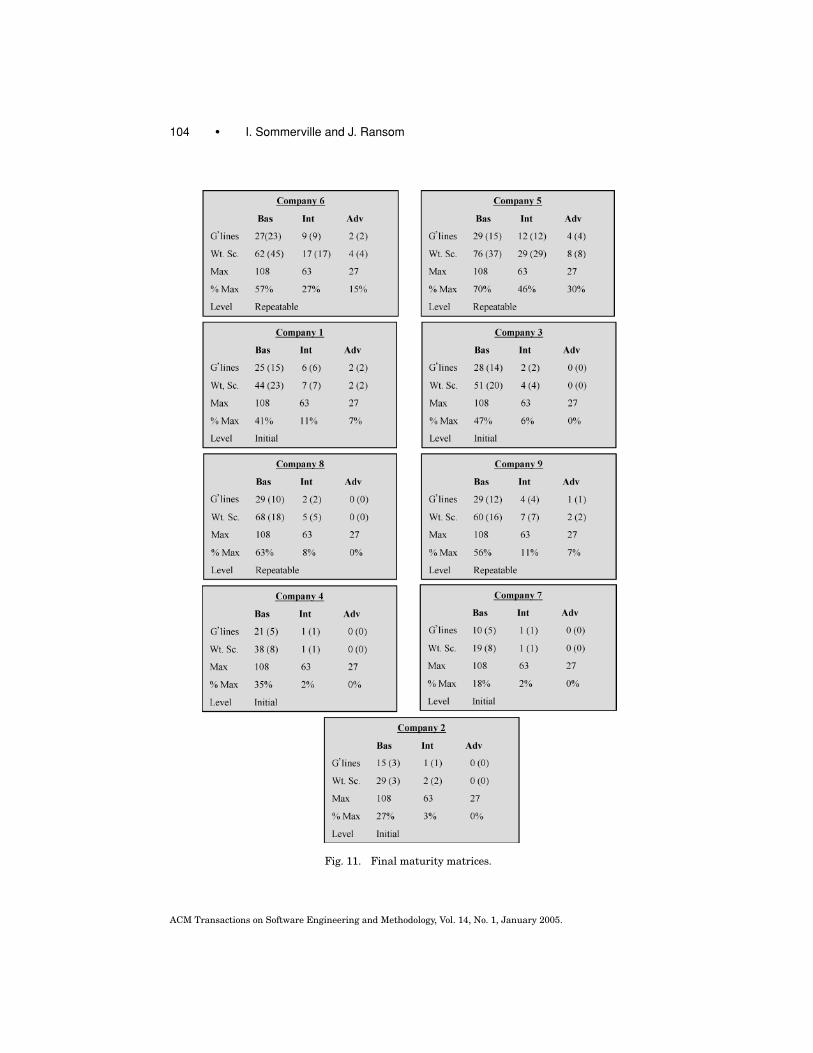
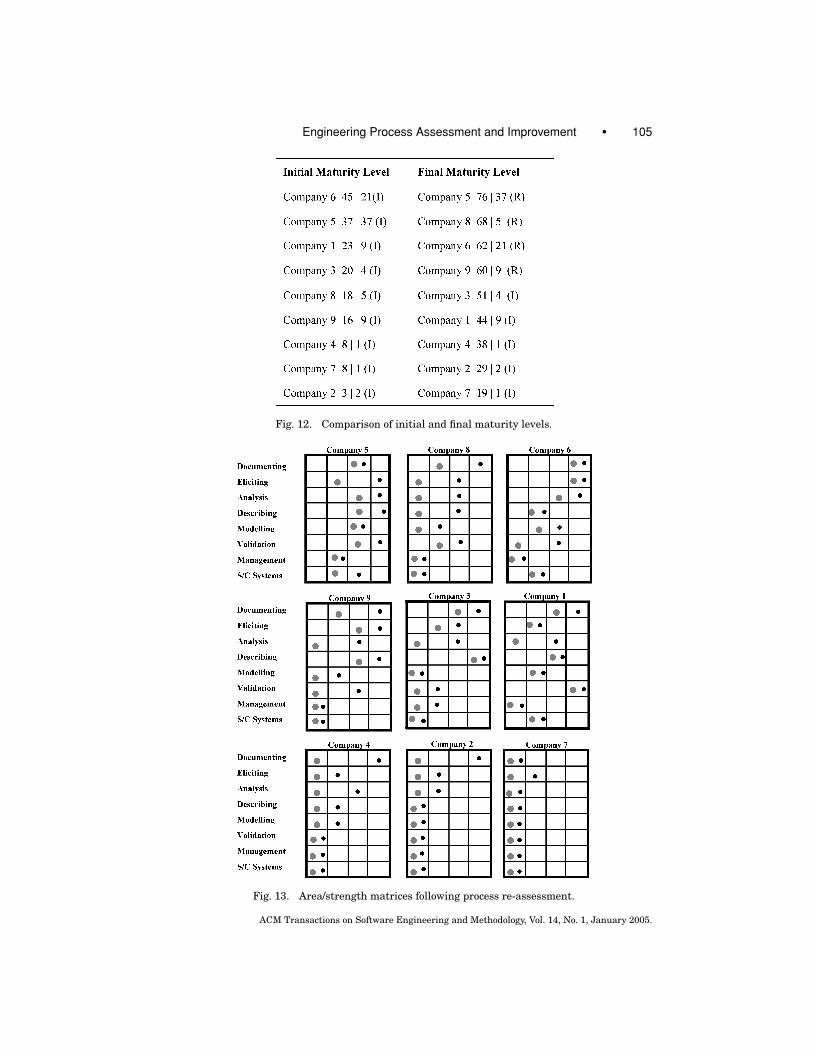
matrices following the second assessment are shown in Figure 11 and are pre-sented in the same sequence as those in the initial assessment. To allow asimple comparison to be made with the previous assessment, the scores in theinitial maturity assessment are shown in brackets. To illustrate how maturitylevels changed, Figure 12 shows the rank order of the companies in the initialand final maturity assessment.
For each company, we show the weighted score of Basic practices (to the left ofthe vertical bar), the weighted score of Intermediate/Advanced practices (to theright of the bar) and the computed maturity level (I for Initial, R for Repeatable).From Figure 12, it is clear that all of the companies involved have increasedtheir RE process maturity. Four companies moved from the Initial maturitylevel to the Repeatable level and the other four companies all introduced asignificant number of good requirements engineering practices.
The matrices show that different companies have used different strategiesto increase their maturity level. Company 6, for example, has introduced rela-tively few new guidelines (from 23 to 27 Basic guidelines) but has increased itsmaturity level by increasing and standardizing the use of good practice (shownby the increase in the weighted score from 45 to 62). By contrast, Company 5,which has also moved from Initial to Repeatable, has introduced 14 new Basicguidelines.
To give us a picture of the areas where each company has introduced im-provements we modified the area/strength matrices to show before and afterstrengths and weaknesses. Figure 13 shows the area/strength matrices as esti-mated in the final maturity assessment. The large dots represent the strengthin the first assessment and the small black dots represent the scores in there-assessment.
The area/strength matrices that were generated after process improvementswere introduced reveal information that is hidden by the quantitative presenta-tion in the maturity matrices. For example, although Company 7 has introducedfive new basic guidelines, this has made no practical difference to its strengthin requirements engineering. It is still weak in almost all areas. By contrast,Company 4 whose initial estimate was the same as Company 7’s has introduced16 new guidelines and has increased its strength in a number of RE processareas.
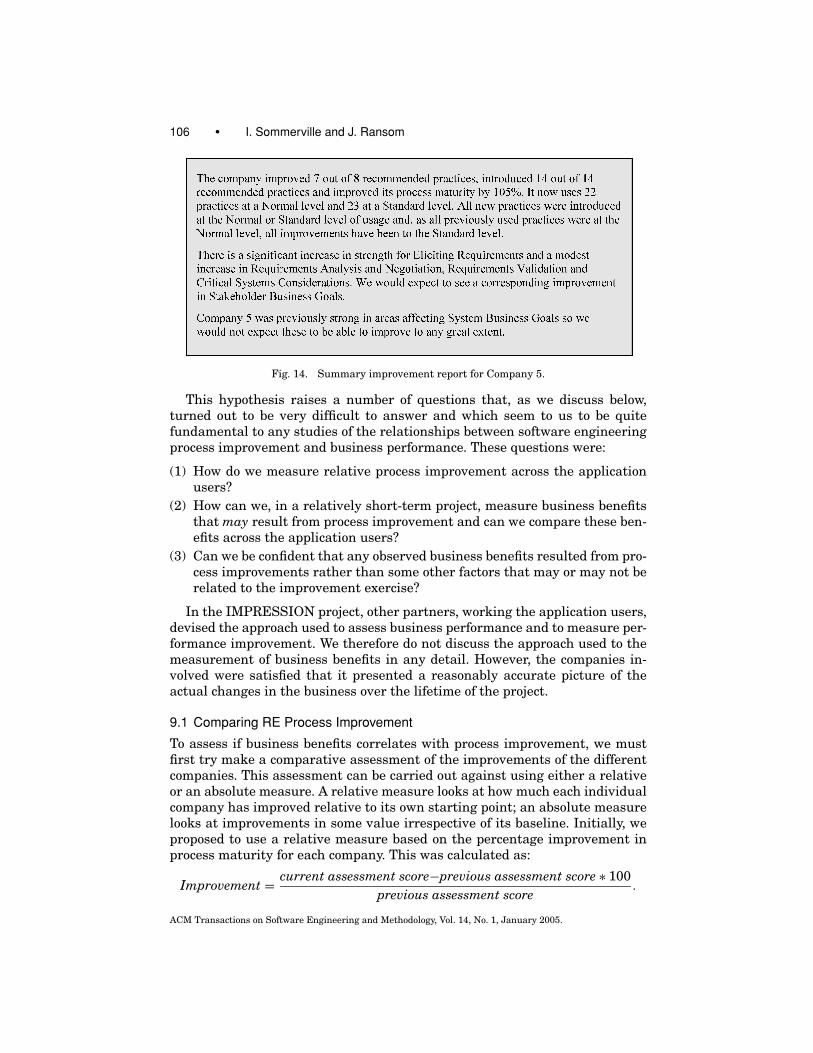
The data collected during the process maturity assessment allowed us tosee the changes that individual companies made to their process. To providemanagement information, we created summary reports for each company whichdescribed the changes that the company had made and predicted how thesemight affect business goals (discussed later). The improvement summary reportfor Company 5 is shown in Figure 14.
9. RE PROCESS IMPROVEMENTS AND BUSINESS PERFORMANCE
One of the overall aims of the IMPRESSION project was to investigate therelationship between RE process improvement and business benefits. Our hy-pothesis was that there would be a correlation between the extent of RE processimprovement and the business benefits gained.
ACM Transactions on Software Engineering and Methodology, Vol. 14, No. 1, January 2005.
104 • I. Sommerville and J. Ransom
Fig. 11. Final maturity matrices.
ACM Transactions on Software Engineering and Methodology, Vol. 14, No. 1, January 2005.
Engineering Process Assessment and Improvement • 105
Fig. 12. Comparison of initial and final maturity levels.
Fig. 13. Area/strength matrices following process re-assessment.
ACM Transactions on Software Engineering and Methodology, Vol. 14, No. 1, January 2005.
106 • I. Sommerville and J. Ransom
Fig. 14. Summary improvement report for Company 5.
This hypothesis raises a number of questions that, as we discuss below,turned out to be very difficult to answer and which seem to us to be quitefundamental to any studies of the relationships between software engineeringprocess improvement and business performance. These questions were:
(1) How do we measure relative process improvement across the applicationusers?
(2) How can we, in a relatively short-term project, measure business benefitsthat may result from process improvement and can we compare these ben-efits across the application users?
(3) Can we be confident that any observed business benefits resulted from pro-cess improvements rather than some other factors that may or may not berelated to the improvement exercise?
In the IMPRESSION project, other partners, working the application users,devised the approach used to assess business performance and to measure per-formance improvement. We therefore do not discuss the approach used to themeasurement of business benefits in any detail. However, the companies in-volved were satisfied that it presented a reasonably accurate picture of theactual changes in the business over the lifetime of the project.
9.1 Comparing RE Process Improvement
To assess if business benefits correlates with process improvement, we mustfirst try make a comparative assessment of the improvements of the differentcompanies. This assessment can be carried out against using either a relativeor an absolute measure. A relative measure looks at how much each individualcompany has improved relative to its own starting point; an absolute measurelooks at improvements in some value irrespective of its baseline. Initially, weproposed to use a relative measure based on the percentage improvement inprocess maturity for each company. This was calculated as:
Improvement = current assessment score−previous assessment score ∗ 100previous assessment score
.
ACM Transactions on Software Engineering and Methodology, Vol. 14, No. 1, January 2005.
Engineering Process Assessment and Improvement • 107
Fig. 15. Comparative maturity improvements.
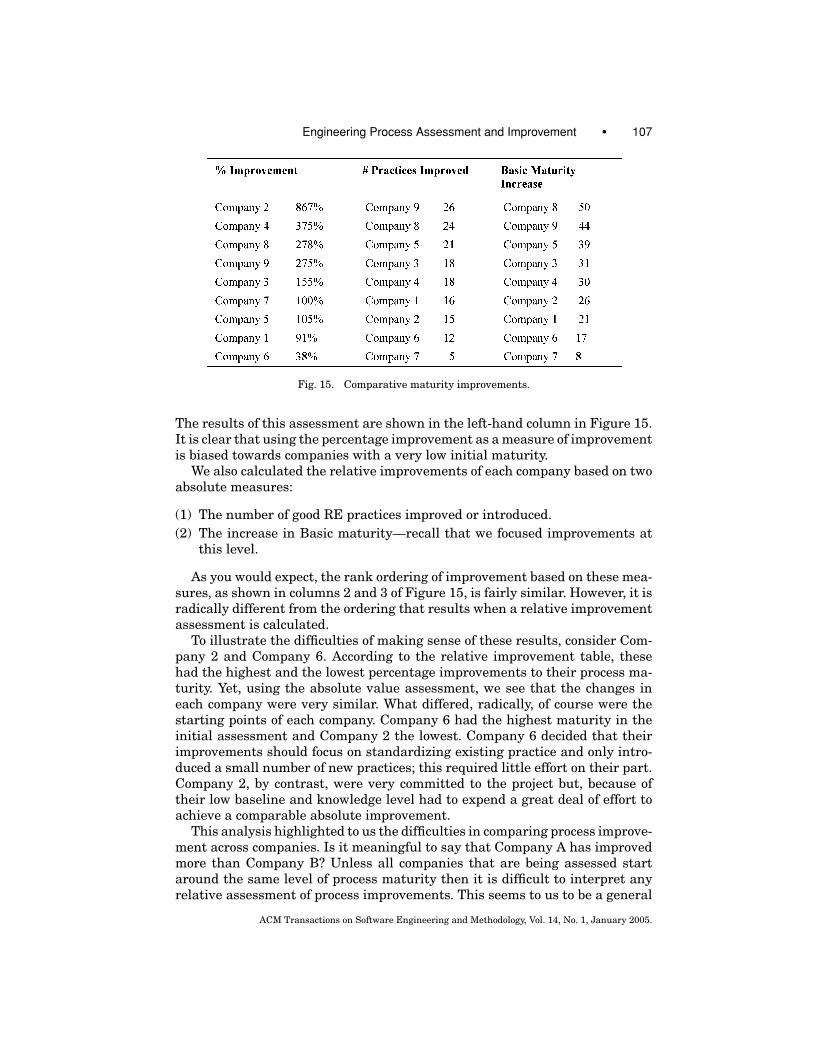
The results of this assessment are shown in the left-hand column in Figure 15.It is clear that using the percentage improvement as a measure of improvementis biased towards companies with a very low initial maturity.
We also calculated the relative improvements of each company based on twoabsolute measures:
(1) The number of good RE practices improved or introduced.(2) The increase in Basic maturity—recall that we focused improvements at
this level.
As you would expect, the rank ordering of improvement based on these mea-sures, as shown in columns 2 and 3 of Figure 15, is fairly similar. However, it isradically different from the ordering that results when a relative improvementassessment is calculated.
To illustrate the difficulties of making sense of these results, consider Com-pany 2 and Company 6. According to the relative improvement table, thesehad the highest and the lowest percentage improvements to their process ma-turity. Yet, using the absolute value assessment, we see that the changes ineach company were very similar. What differed, radically, of course were thestarting points of each company. Company 6 had the highest maturity in theinitial assessment and Company 2 the lowest. Company 6 decided that theirimprovements should focus on standardizing existing practice and only intro-duced a small number of new practices; this required little effort on their part.Company 2, by contrast, were very committed to the project but, because oftheir low baseline and knowledge level had to expend a great deal of effort toachieve a comparable absolute improvement.
This analysis highlighted to us the difficulties in comparing process improve-ment across companies. Is it meaningful to say that Company A has improvedmore than Company B? Unless all companies that are being assessed startaround the same level of process maturity then it is difficult to interpret anyrelative assessment of process improvements. This seems to us to be a general
ACM Transactions on Software Engineering and Methodology, Vol. 14, No. 1, January 2005.

108 • I. Sommerville and J. Ransom
problem with any experiments involving the introduction of new software tech-niques or technologies into different organizations. We cannot control the base-line so cannot therefore determine the relative improvements in a reliableway.
9.2 Assessing and Comparing Business Benefits
The “holy grail” of the software engineering research community is to demon-strate that a proposed innovation (be it in methods or tools) leads to businessbenefits from companies adopting that innovation. To make an assessment ofthe business benefits of RE process improvement, we had to choose appropriatemetrics that reflected these benefits and then take measurements before andafter the process improvements were introduced. Our project partners proposedthe following approach to make this assessment:
(1) Through discussion with the user partners, discover business goals thatwere likely to be supported by RE process improvement.
(2) Identify how we could assess if the company was making progress towardsits business goal. To do this, we identified a number of critical success factors(CSFs) that were related to the business goals—we discuss this furtherbelow.
(3) Identify specific measurements that we could make that were related to theCSFs. We measured the values of key performance indicators (KPIs) wherea KPI is a measurable process or product attribute. By examining changesin the KPIs, we could assess whether or not each company was makingprogress towards its process improvement goals and hence its businessgoals.
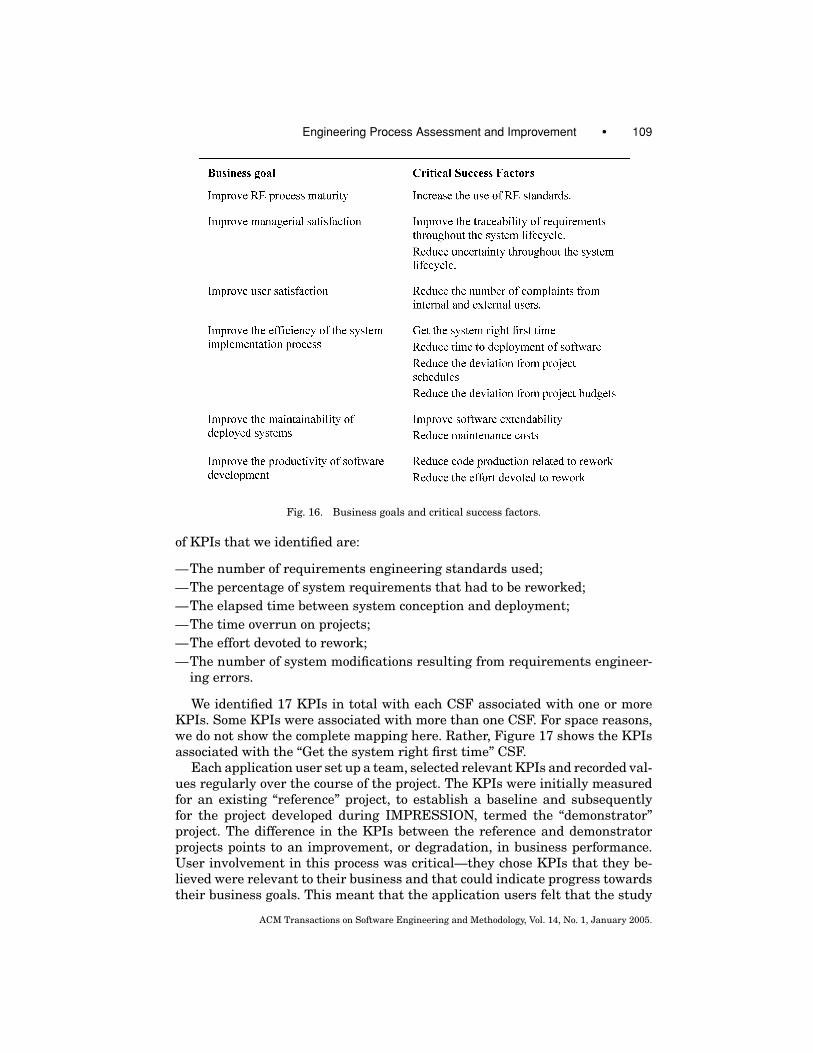
The high-level, strategic business goals for the application users reflectedthe business improvements that they wished to make. Different organizationshad different goals but we finally settled on six business goals shared by allcompanies. These are shown in the left column in Figure 16. Improving REprocess maturity was identified by all of our partners as a business goal initself. The reason for this was that they had all experienced problems withtheir RE processes and felt that, even if no other benefits ensued, better REprocesses would be of value to the business.
To help us decide whether or not progress was being made towards a busi-ness goal, we identified 11 associated critical success factors that are shown inthe right column of Figure 16. Each CSF can be thought of as a software pro-cess improvement goal—they were not just concerned with RE processes. Forexample, to reach the business goal of improving software productivity, associ-ated CSFs were to reduce the amount of code that had to be reworked and toreduce the amount of effort devoted to rework. Improving RE processes shouldcontribute to these goals, for example, reducing requirements rework meansthat less effort overall will be spent on rework.
To enable us to assess progress towards each CSF, we associated one ormore Key Performance Indicators with each CSF. A KPI is a process or productmeasure that can be made at different stages in the software process. Examples
ACM Transactions on Software Engineering and Methodology, Vol. 14, No. 1, January 2005.
Engineering Process Assessment and Improvement • 109
Fig. 16. Business goals and critical success factors.
of KPIs that we identified are:
—The number of requirements engineering standards used;—The percentage of system requirements that had to be reworked;—The elapsed time between system conception and deployment;—The time overrun on projects;—The effort devoted to rework;—The number of system modifications resulting from requirements engineer-
ing errors.
We identified 17 KPIs in total with each CSF associated with one or moreKPIs. Some KPIs were associated with more than one CSF. For space reasons,we do not show the complete mapping here. Rather, Figure 17 shows the KPIsassociated with the “Get the system right first time” CSF.
Each application user set up a team, selected relevant KPIs and recorded val-ues regularly over the course of the project. The KPIs were initially measuredfor an existing “reference” project, to establish a baseline and subsequentlyfor the project developed during IMPRESSION, termed the “demonstrator”project. The difference in the KPIs between the reference and demonstratorprojects points to an improvement, or degradation, in business performance.User involvement in this process was critical—they chose KPIs that they be-lieved were relevant to their business and that could indicate progress towardstheir business goals. This meant that the application users felt that the study
ACM Transactions on Software Engineering and Methodology, Vol. 14, No. 1, January 2005.

110 • I. Sommerville and J. Ransom
Fig. 17. A CSF and associated KPIs.
Fig. 18. KPI assessment per company.
had real business value and none of them dropped out in the course of theexperiment.
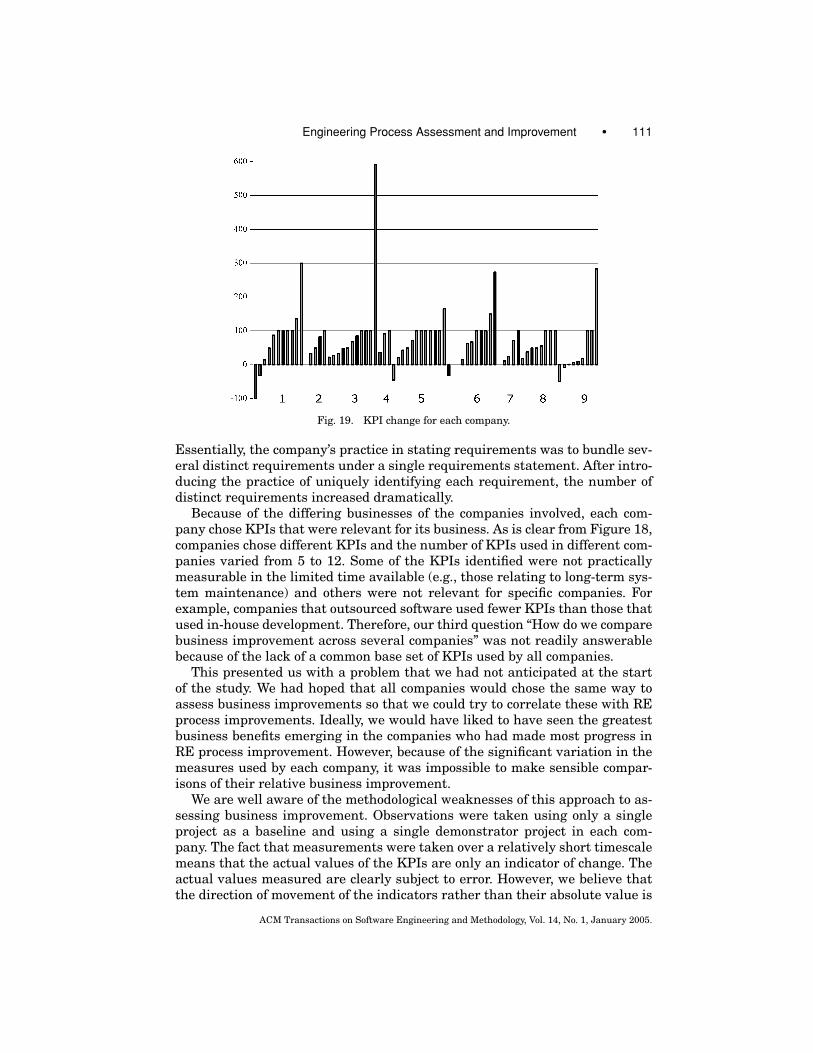
Figure 18 shows the number of KPIs used by each company and the numberof KPIs that indicated improvements. The changes in the KPIs across all compa-nies varied dramatically from −100% to +600%. Figure 19 is a histogram thatshows, for each company (1–9), the changes in each KPI. Across all companies,we measured about 75 KPIs in all.
You can see that, in the vast majority of cases, there was up to a 100% im-provement in the measured KPI. A small number of KPIs (6) showed a degra-dation and a small number (4) showed no change. In some cases, there wasno change in a KPI because there was no real scope for improvement in thatKPI from the baseline as the company was already performing well. Some ofthe decreases in KPIs resulted from differences beween the baseline and thedemonstrator project.
Equally, a small number of KPIs indicated an improvement of more than100% with, in one case, a massive improvement of almost 600%. This lattercase was a change in the KPI “Number of unique requirements captured”.
ACM Transactions on Software Engineering and Methodology, Vol. 14, No. 1, January 2005.
Engineering Process Assessment and Improvement • 111
Fig. 19. KPI change for each company.
Essentially, the company’s practice in stating requirements was to bundle sev-eral distinct requirements under a single requirements statement. After intro-ducing the practice of uniquely identifying each requirement, the number ofdistinct requirements increased dramatically.
Because of the differing businesses of the companies involved, each com-pany chose KPIs that were relevant for its business. As is clear from Figure 18,companies chose different KPIs and the number of KPIs used in different com-panies varied from 5 to 12. Some of the KPIs identified were not practicallymeasurable in the limited time available (e.g., those relating to long-term sys-tem maintenance) and others were not relevant for specific companies. Forexample, companies that outsourced software used fewer KPIs than those thatused in-house development. Therefore, our third question “How do we comparebusiness improvement across several companies” was not readily answerablebecause of the lack of a common base set of KPIs used by all companies.
This presented us with a problem that we had not anticipated at the startof the study. We had hoped that all companies would chose the same way toassess business improvements so that we could try to correlate these with REprocess improvements. Ideally, we would have liked to have seen the greatestbusiness benefits emerging in the companies who had made most progress inRE process improvement. However, because of the significant variation in themeasures used by each company, it was impossible to make sensible compar-isons of their relative business improvement.
We are well aware of the methodological weaknesses of this approach to as-sessing business improvement. Observations were taken using only a singleproject as a baseline and using a single demonstrator project in each com-pany. The fact that measurements were taken over a relatively short timescalemeans that the actual values of the KPIs are only an indicator of change. Theactual values measured are clearly subject to error. However, we believe thatthe direction of movement of the indicators rather than their absolute value is
ACM Transactions on Software Engineering and Methodology, Vol. 14, No. 1, January 2005.
112 • I. Sommerville and J. Ransom
significant—movement in a positive direction suggests that the changes intro-duced contributed to business improvement.
In all companies we saw positive improvements for most KPIs so concludedthat our study led to real business benefits for the participants. This conclu-sion was reinforced by discussions with application user company managementwho were happy with the changes to the RE process that were made and whointuitively felt that there had been progress made towards their business goals.
There are general issues that arise from our work here that we believe areapplicable to other technology transfer projects. The fact that we identifiedbusiness goals rather than simply technical process goals was a critical fac-tor in convincing company management that participation in the study wasworthwhile. The CSFs and KPIs were developed through consultation with theapplication users and this consultation process further reinforced their com-mitment to the work. As researchers, it is important that we bear in mind thatour research goals are rarely the goals of our business partner and accepting animperfect method is perhaps worthwhile if it opens up the possibility of activeindustrial commitment to new methods and techniques.
9.3 RE Process Improvement and Business Benefits
The results of our study indicated that when the RE Process Maturity of an orga-nization improved, an improvement was also observed in business performanceindicators. However, we cannot draw any definite conclusions about whetheror not the magnitude of the business performance improvement is correlatedwith the magnitude of the RE process improvement.
As we have discussed in Sections 9.1 and 9.2, making relative comparisonsof improvements in process maturity and business goals was impossible. Com-pany 2 had a relative improvement of process maturity of over 800% and Com-pany 6 had an improvement of 38%. Even in the absolute tables, Company 2did better than Company 6 yet when we look at the improvements in the KPIsshown in Figure 19, these suggest that, if anything, Company 6 improved morethan Company 2. Our suspicion here is that improvements become more effec-tive once some threshold level of maturity has been reached—Company 6 hadreached this level so gained value from its process improvements; Company 2started from such a low point that the threshold level was never reached.
The data collected suggests that involvement in the process improvementexperiment resulted in business benefits for all of the companies involved. Thiswas certainly reflected in the qualitative impressions of company representa-tives who, universally, felt that participation had been worthwhile and that theyhad gained some benefit from being involved. Of course, these benefits couldhave come from some other external factors but, given that nine companies fromquite different sectors were involved, it is unlikely that there were comparableexternal reasons for the business benefits across all companies.
The data also supports the hypothesis that improving the maturity of REprocesses leads to business benefits but we do not have sufficient data to pro-pose any formula that would allow us to predict the business improvementsresulting from some given level of process improvement. It is also the case that
ACM Transactions on Software Engineering and Methodology, Vol. 14, No. 1, January 2005.

Engineering Process Assessment and Improvement • 113
participation in the study had significant side-effects for the companies thatmay have influenced the results.
It is possible that it is the participation in the process of process improve-ment rather than the improvements themselves that is most significant. TheHawthorne effect is a well-known experimental effect where it is participationin an experiment that leads to changes in outcome rather than the changes pro-posed in the experiment. Furthermore, our partner, ATC, noted that, in some in-stances, the improvement in business performance could be attributed to a newawareness of business issues brought about as a side-effect the IMPRESSIONexercise rather than by RE process improvements themselves. This increasedawareness may have led to business process changes apart from changes to REpractice. It could be the case that this increased self-awareness is the key factorthat led to business benefits and not the improvements in RE processes.
We believe that this increased self-awareness is a factor in improvement butwe suspect that the truth is that the improvements resulted from a mixture ofincreased awareness and better practices. To judge the actual contribution ofbetter practice would require the improvement exercise to be continued in thesame organizations where (we hope) that the self-awareness factor would beless significant.
10. CONCLUSIONS AND LESSONS LEARNED
This industrial study in process improvement provided valuable informationabout requirements engineering process improvement. It demonstrated thatthe RE process maturity model was usable in practice across a range of com-panies and that it was a useful basis for supporting RE process improvement.Our study provided some evidence to confirm the hypothesis that improvingRE process maturity contributes to improved business performance. However,because of differences between companies, it was impossible for us to judgewhether or not there was a correlation between the degree of process improve-ment introduced and the business benefits that resulted from this.
When some method or tool is used in a real industrial setting, we learn usefullessons about how it can be improved. The particular value of the study was thelessons that we learned about the RE process maturity model, the good practiceguidelines that we proposed as part of that model and the maturity assessmentprocess.
10.1 Lessons Learned
Our initial development of the RE process maturity model was carried out underthe assumption that maturity assessment would either be done by companiesthemselves or by consultants who worked closely with them. We assumed thatthey would be sufficiently familiar with the processes and activities used thatthey could identify improvements that could be introduced.
Perhaps the most important lesson that we learned as far as the process ma-turity model was that this was an optimistic assumption. Knowing the processmaturity was not enough—companies also wanted to know what improvementscould be introduced. Therefore, the amendment to the maturity model where we
ACM Transactions on Software Engineering and Methodology, Vol. 14, No. 1, January 2005.
114 • I. Sommerville and J. Ransom
introduced a process improvement recommendation stage as shown in Figure 5is an important result of this study. This change from a passive assessmentmodel to an active improvement model and the development of tool supportmeans that the startup costs for process improvement are reduced and henceincreases the practical usefulness of the approach.
We were always aware that the maturity categorisation into Initial, Repeat-able and Advanced was a somewhat arbitrary one but felt that identifying thesedifferent levels gave companies a target to aim at in the maturity improvement.However, these levels are too coarse to provide effective feedback on maturityimprovement and the study showed that we need a continuous rather than adiscrete model where companies can see progression according to guidelinesused, standardized, etc. They also require more than a simple assessment butan across the board analysis of their strengths and weaknesses. This reflectsexperience with the CMM and movement towards a continuous model as re-flected in CMMI [Ahern et al. 2001]. The guidelines are already organized intoprocess areas such as requirements elicitation, requirements analysis, etc. andwe are now considering a redesign of the maturity assessment based aroundthese areas.
We also found that our classification of the good practice guidelines was fartoo complex. First, there are too many categories of costs of introduction ofguidelines—we had initially defined eight possible cost categories. These couldbe simplified to Low, Moderate and High. Second, our classification of eachguideline as Basic/Intermediate/Advanced needs to be adapted for differentapplication domains. A guideline that might be basic guideline, such as “definetraceability policies” for a technologically advanced company is perhaps an ad-vanced guideline for a company operating at a very low level of maturity. Wenow think that it is probably the case that using area and cost of introductionas the classification attributes for the guidelines is all that we need and thatthe basic/intermediate/advanced classification is unnecessary.
Our process maturity model was initially developed for companies working incritical systems development and two of the application users in the IMPRES-SION project fell into this category. However, the other companies involved wereeither involved in business systems development or companies who outsourcedall of their systems development from external contractors. Realistically, thesecompanies will never achieve the high levels of process maturity that can beexpected from companies developing critical systems. Similarly, there are someguidelines that are specific to some domains and, indeed, outsourcing may re-quire new guidelines to be introduced.
This project has shown that the same model can be applied across differenttypes of company but that there is probably a need for sector-specific variantsof the model, especially if the different levels are maintained. Therefore, ifwe maintain the staged model, a company that outsources all of its softwaredevelopment might be rated as operating at an Intermediate level of maturitywith a lower overall score in good practice use than a company that developscritical systems. We are now considering how the model should evolve to makeit more configurable.
ACM Transactions on Software Engineering and Methodology, Vol. 14, No. 1, January 2005.

Engineering Process Assessment and Improvement • 115
10.2 Tool Support
We believe that a fundamental success factor in this study was the developmentof the software tool to support the process maturity model. This made it possiblefor nine analyses and reanalyses to be carried out in a relatively short periodand for the method to be applied by an organization that was not involved in itsdevelopment. Without this tool, the costs of data collection and analyses wouldhave appeared prohibitive and we do not believe that the commitment of ourindustrial partners could have been maintained.
Our general conclusion here is that if you are involved in any study that in-volves extensive data collection then you should develop the support tool beforestarting to collect data. This significantly lowers the initial commitment costsfrom industry and so lowers the barriers to participation in software engineer-ing experiments.
10.3 Conclusion
Our involvement in this process assessment and improvement study was a veryvaluable exercise that provided encouraging feedback about the usefulness ofthe process maturity model. It also revealed some fundamental difficulties ofassessing and comparing process maturity and process improvement.
If we return to the questions identified in the introduction to this article,how well have these been answered?
First, we wanted to discover the practical difficulties that arise in RE processmaturity assessment. We have not mentioned these in the article simply be-cause we had no real problems in this respect. We anticipated problems whereour industrial partners were unable to engage in the process because of othercommitments but these problems simply did not arise. We believe that this waslargely due to the fact that we presented the work to them from a businessrather than a technical perspective.
Second, the IMPRESSION project confirmed the usefulness of the RE processmaturity model and improvement framework across a range of different typesof company. Without the structured approach provided by the model, assessingRE process maturity and, critically, selling the notion of RE process improve-ment to application users would have been much more difficult. The fact thatan external consultant could apply the model without previous experience inmaturity assessment was also an encouraging result.
Third, we have not unequivocally demonstrated that RE process improve-ment leads directly to business benefits. This is extremely difficult in a short-term project. However, the evidence that was produced strongly suggested thatparticipation in a process improvement process resulted in benefit and it islikely that at least some of this benefit resulted from better requirements en-gineering practice.
The study highlighted a number of key points that researchers interested inassessing the value of new tools and methods should bear in mind:
(1) Industry is primarily interested in business benefits rather than technicalmeasures that compare existing methods with new approaches. Whatever
ACM Transactions on Software Engineering and Methodology, Vol. 14, No. 1, January 2005.

116 • I. Sommerville and J. Ransom
the weaknesses of the method used to assess business benefits, the factthat we talked to companies in these terms meant that they engaged in thestudy and were committed to it. To engage industry in technology transfer,we cannot just present technical solutions but must also relate these to thereal needs of the business.
(2) Relative comparisons of the efficacy of tools and methods will inevitablybe very difficult. There is so much variation in the practices used in differ-ent industries that creating a common baseline will always be very diffi-cult. We will probably never discover the “holy grail” where we can relatebusiness improvements directly to the introduction of new technologies. Asresearchers and reviewers, we must understand the fundamental difficul-ties here and not expect too much from empirical software engineering. Weshould see measurements made in industry as contributing to a body ofevidence about some tool or technique and should not expect them to standon their own.
There is no question that experimentation in software engineering is very dif-ficult and fraught with uncertainties. Controlled experiments (often using stu-dents) are so far removed from industrial reality that their conclusions willalways be open to question. Industrial experiments suffer from all of the messyproblems of reality that mean generalizations are difficult to sustain. In an idealworld, we would, of course, have a structured approach where we move fromthe laboratory to industry. In reality, this is often impossible and our experiencein the IMPRESSION project suggests that, in spite of the uncertainties in theresults, industrial experiments are an effective means of highlighting practicalproblems with software engineering techniques and demonstrating the valueof such techniques to industry.
ACKNOWLEDGMENTS
We would like to thank our partners in the IMPRESSION project—AthensTechnology Centre, Greece and City University, London—who made this workpossible. Particular thanks are due to Andreas Kalligeris, Christina Sorovouand Despina Politou from ATC who worked with our industrial users to over-see the requirements engineering improvement exercise and collect assessmentdata and to Bill Karakostas from City who devised the business benefit as-sessment scheme. Pete Sawyer from Lancaster provided helpful comments onearlier drafts of the article.
REFERENCES
AHERN, D. M., CLOUSE, A., AND TURNER, R. 2001. CMMI Distilled. Addison-Wesley, Reading, Mass.BOEHM, B. W. 1983. The economics of software maintenance. In Proceedings of Software Mainte-
nance Workshop (Washington, D.C.), 9–37.COALLIER, F. 1999. TRILLIUM: A model for the assessment of telecom product development and
support capability. In Software Process Improvement, R. B. Hunter and R. H. Thayer, Eds. IEEEComputer Society Press, Los Alamitos, Calif.
DEMING, W. E. 1982. Out of the Crisis. MIT Press International, Cambridge, Mass.
ACM Transactions on Software Engineering and Methodology, Vol. 14, No. 1, January 2005.
Engineering Process Assessment and Improvement • 117
EL EMAM, K., DROUIN, J., AND WELO, M. 1997. SPICE: The Theory and Practice of Software ProcessImprovement and Capability Determination. IEEE Computer Society Press, Los Alamitos, Calif.
ESPITI. 1996. Software process improvement on the right road with ESPITI—The ESPITIEuropean Survey Results. ESPITI Newsletter Issue 2. Available at: http://www.cse.dcu.ie/cse/international/trispin/News2.html#espiti.
HAASE, V., MESSNARZ, R., KOCH, G., KUGLER, H. J., AND DECRINIS, P. 1994. Bootstrap: Fine tuningprocess assessment. IEEE Software 11, 4, 25–35.
HALL, T., BEECHAM, S., AND RAINER, A. 2002. Requirements problems in twelve software companies:An empirical analysis. IEE Proceedings: Softw. 149, 5, 153–60.
HUMPHREY, W. 1989. Managing the Software Process. Addison-Wesley, Reading, Mass.KOCH, G. 1993. Process assessment: The ‘BOOTSTRAP’ approach. Inf. Softw. Tech. 35, 6/7, 387–
403.KONRAD, M. AND PAULK, M. 1995. An overview of SPICE’s model for process management. In
Proceedings of the 5th International Conference on Software Quality (Austin, Tex.).KUVAJA, P., SIMILA, J., KRZANIK, L., BICEGO, A., SAUKKONEN, S., AND KOCH, G. 1994. Software Process
Assessment and Improvement: The BOOTSTRAP Approach. Blackwell Publishers, Oxford.LUTZ, R. R. 1993. Analysing software requirements errors in safety-critical embedded systems.
In Proceedings of RE’93 (San Diego Calif.).PAULK, M. C., CURTIS, B., CHRISSIS, M. B., AND WEBER, C. V. 1993. Capability maturity model,
Version 1.1. IEEE Softw. 10, 4, 18–27.PAULK, M. C. AND KONRAD, M. 1994. An overview of ISO’s SPICE project. IEEE Comput. 27, 4,
68–70.PAULK, M. C., WEBER, C. V., CURTIS, B., AND CHRISSIS, M. B. 1995. The Capability Maturity Model:
Guidelines for Improving the Software Process. Addison-Wesley, Reading, Mass.SAWYER, P., VILLER, S., AND SOMMERVILLE, I. 1998. Requirements process improvement through the
phased introduction of good practice. Softw. Proc. J. 3, 1, 19–34.SAWYER, P., SOMMERVILLE, I., AND KOTONYA, G. 1999a. Improving market-driven RE processes.
In Proceedings of International Conference on Product-Focused Software Process Improvement(Profes ’99) (Oulu, Finland), 222–236.
SAWYER, P., SOMMERVILLE, I., AND VILLER, S. 1999b. Capturing the benefits of requirements engi-neering. IEEE Softw. 16, 2, 78–85.
SOMMERVILLE, I. AND SAWYER, P. 1997. Requirements Engineering: A Good Practice Guide. Wiley,Chichester.
Received August 2003; revised April 2004 and September 2004; accepted September 2004
ACM Transactions on Software Engineering and Methodology, Vol. 14, No. 1, January 2005.