process and steps for site selection - microsoft · the site selection process normally leads to a...
TRANSCRIPT

Process and steps for site selection
Doris Soto and Jose Aguilar (FIRA)

Outline
The different categories / dimensions of the carrying capacity
Site selection process / specific areas
Estimation of carrying capacity
Relationship with SEIA and SEIAS (and environmental impact assessment systems and strategic environmental impact assessment).

The site selection process normally
Leads to a licensing for a specific site (and often is linked to a production volume)
There could be multiple licenses or clusters
Same process used for the broader zonification as appropriate

The four dimensions of carrying capacity
Production carrying capacity
Physical carrying capacity(primary site selection)
Fed aquaculture Extractive aquaculture
Ecological carrying capacity
Social carrying capacity
Guidance/feedback
BathymetryCurrentsTemperatureetc
Mass balance modelsHydrographic modelsCommunity structureetc
PlanktonDetritusMarketsetc
EmploymentVisual impactsRecreationCharismatic speciesTraditional fisheriesetc
Bathymetry/Pond structureHydrodynamics
Land use/Infrastructureetc
FeedFCR/FCE/Wastage
Marketsetc
Mass balance modelsHydrographic modelsCommunity structure
etc
EmploymentVisual impacts
RecreationCharismatic speciesTraditional fisheries
etc

Bivalvos
Biodepósitos=materia
organica
Feed
Biodeposits, feeds
= organic matter
Intensive Extensive
Alimento
Ecological Footprint1
Eco Footprint 2

Aquaculture as a production process
Therefore ecosystem considerations are needed from the early planning process
Feeds
Organic
Matter and Other “wastes”
HOW MUCH IS COMING IN (and
source) AND HOW MUCH IS GOING OUT (and
where is going, this includes diseases)

Intensive
Carnivorous Herbivorous (not exclusively)
Salmonids
Seabream
Seabass
Mullets
Flatfish
Shrimp
Tilapia
Carps
Abalone
Etc.
Floating open systems Closed or semiclosed
Land based systems
Better control
Low control of
environmental risks efluents
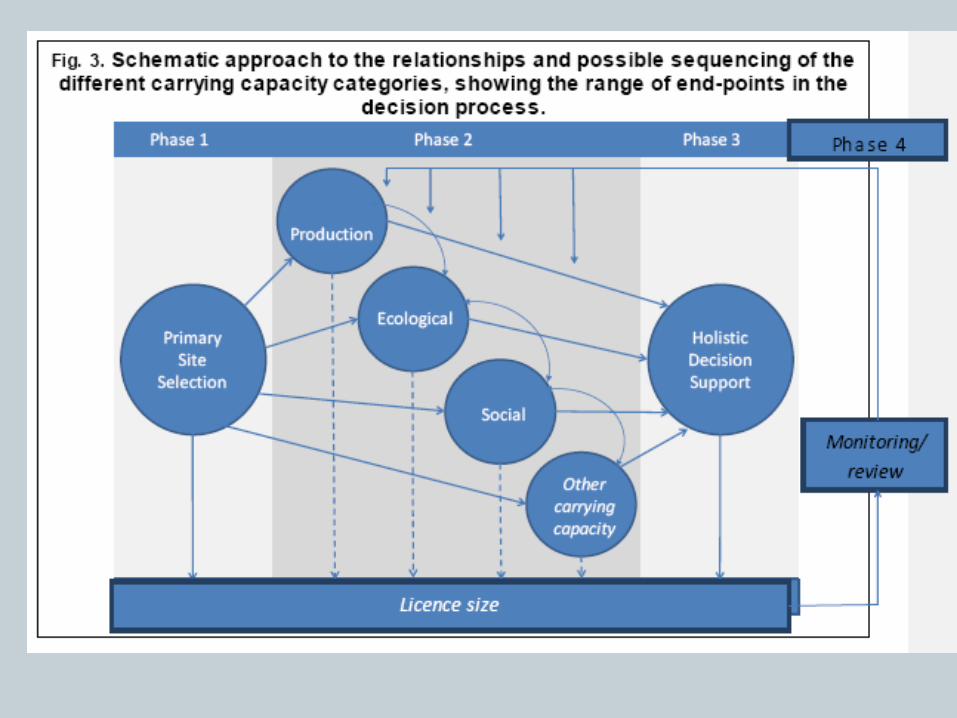
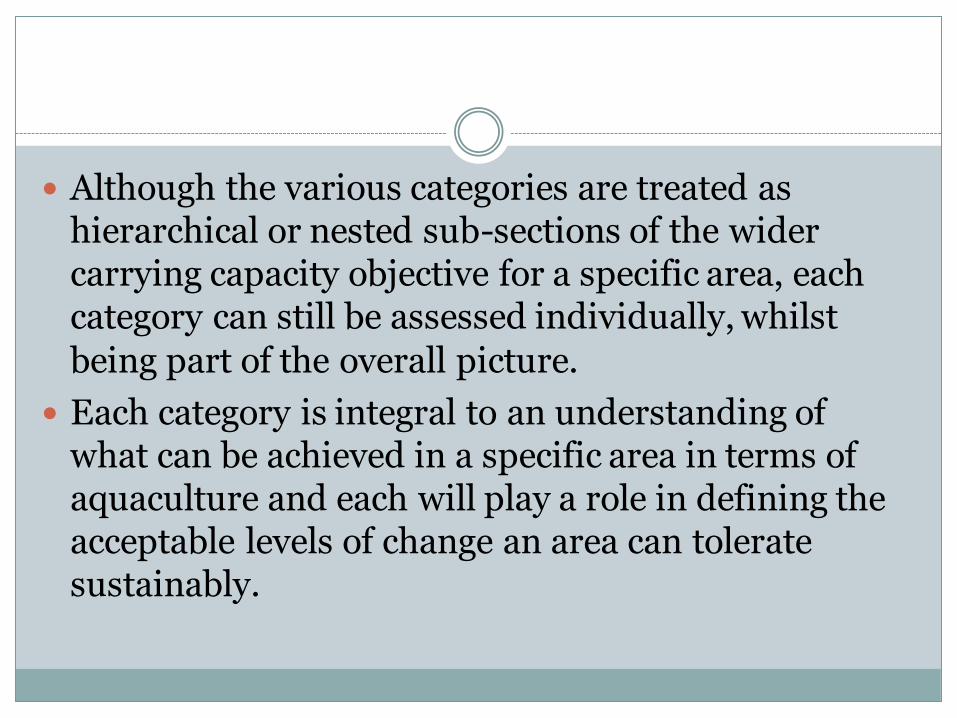
Although the various categories are treated as hierarchical or nested sub-sections of the wider carrying capacity objective for a specific area, each category can still be assessed individually, whilst
being part of the overall picture.
Each category is integral to an understanding of what can be achieved in a specific area in terms of aquaculture and each will play a role in defining the acceptable levels of change an area can tolerate sustainably.

Site selection: Phase 1
Step 1. Scoping Definition of the ecosystem boundary (spatial, social and political scales) Identify over-riding policy, legislation (such as land and sea rights) and
regulations (such as ecosystem quality standards, water quality standards).
Step 2. Identification of issues to determine criteria for site selection Geology, bathymetry, physical variables (physical carrying capacity) Exclusion zones and buffers, green areas, to sensitive ecosystems Current policies and normative framework that potentially applied to the
preselected area (water rights, land rights, access, sea bottom use rights, water quality normative etc.)
Local climatic conditions and exposure Identification of other users and relevant stakeholders, potential conflicts Access and transport
Step 3. Selection of the site according to the prioritization of the criteria
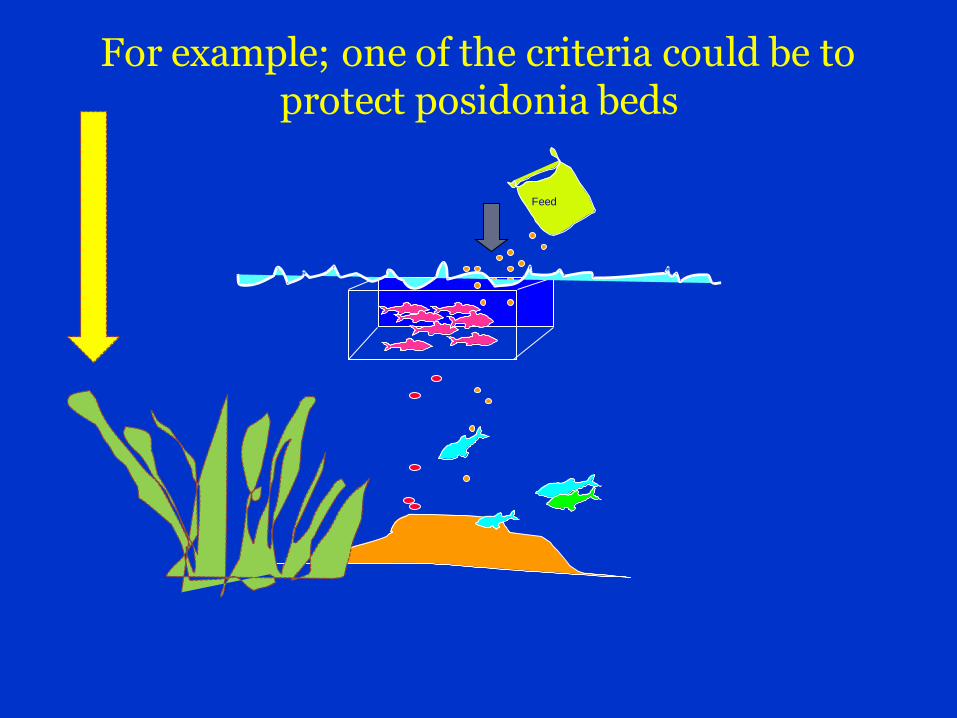
For example; one of the criteria could be to protect posidonia beds
Feed

Phase 2: estimating carrying capacity
The selection of the site could also require some indicators of carrying capacity when we have decided before hand the biomass we want to produce
Often the final decision on the total production is taken after having estimated insitu the carrying
capacity of a site
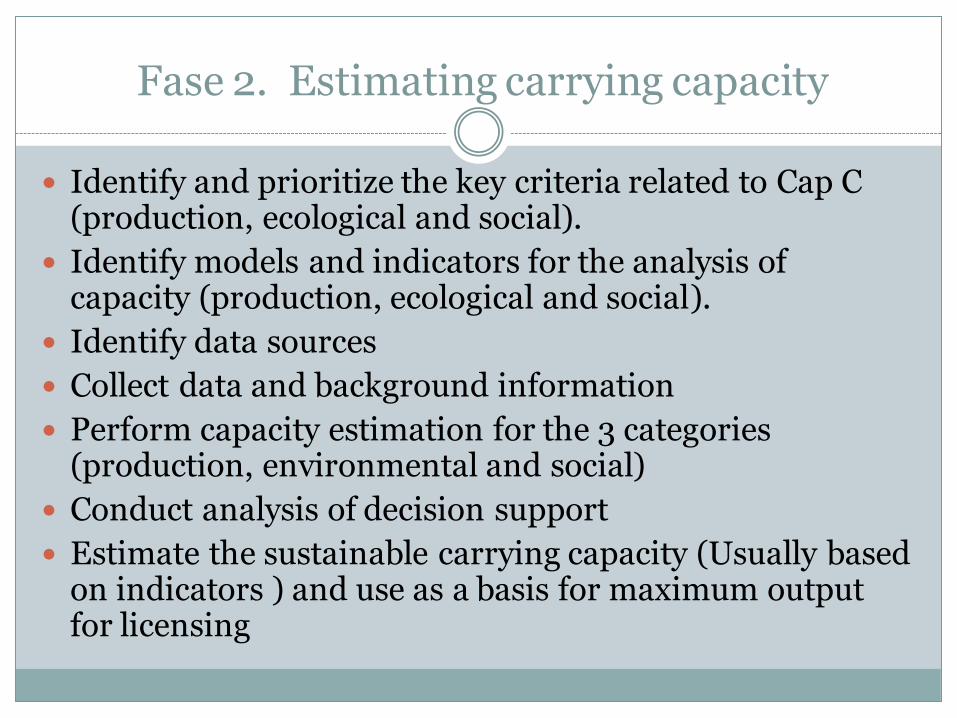
Fase 2. Estimating carrying capacity
Identify and prioritize the key criteria related to Cap C (production, ecological and social).
Identify models and indicators for the analysis of capacity (production, ecological and social).
Identify data sources
Collect data and background information
Perform capacity estimation for the 3 categories (production, environmental and social)
Conduct analysis of decision support
Estimate the sustainable carrying capacity (Usually based on indicators ) and use as a basis for maximum output for licensing

Estimating ecological carrying capacity
Can not be estimated with great accuracy since the variables that influence it are diverse and controlled by
complex processes and mechanisms
In the water column the maximum load capacity depends usually of the limiting factor for productivity
In sediments it depends on the ability to process organic
and inorganic matter and oxygen availability
Carrying capacity related to diseases and biosecurity; which is the maximum fish biomass allowable (and distance
between sites)
in an area to avoid diseases

We need to evaluate the destiny of the organic and inorganic matter produced by the farming
Two extreme possibilities
All organic matter and debris Disperse and locally "disappears"
All organic matter and waste is deposited beneath the cages
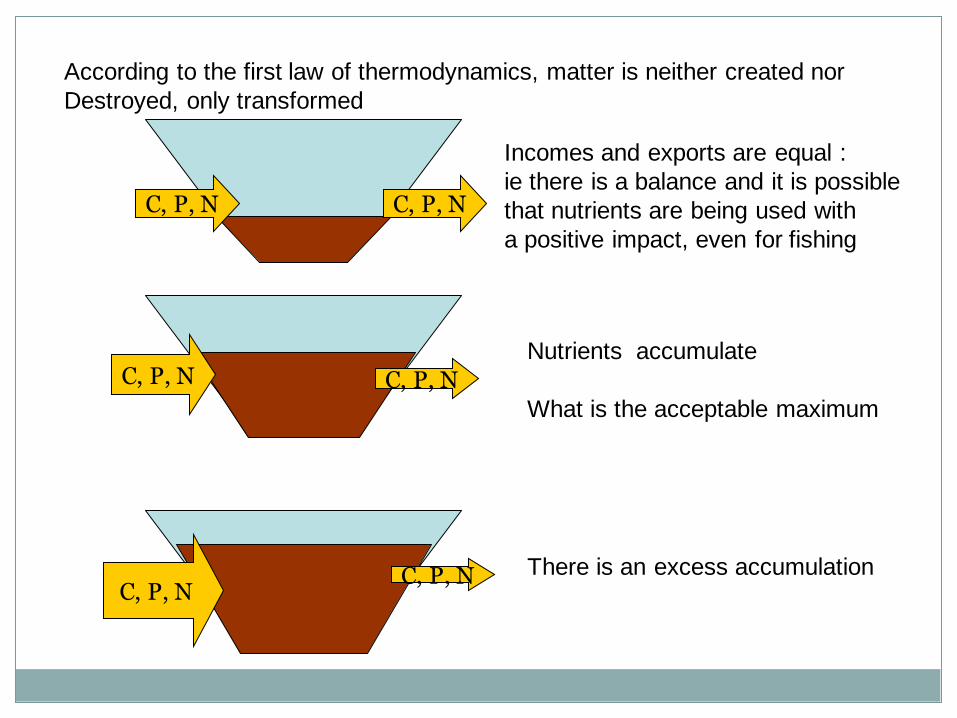
C, P, N C, P, N
C, P, N C, P, N
C, P, N C, P, N
Incomes and exports are equal :
ie there is a balance and it is possible
that nutrients are being used with
a positive impact, even for fishing
Nutrients accumulate
What is the acceptable maximum
There is an excess accumulation
According to the first law of thermodynamics, matter is neither created nor
Destroyed, only transformed
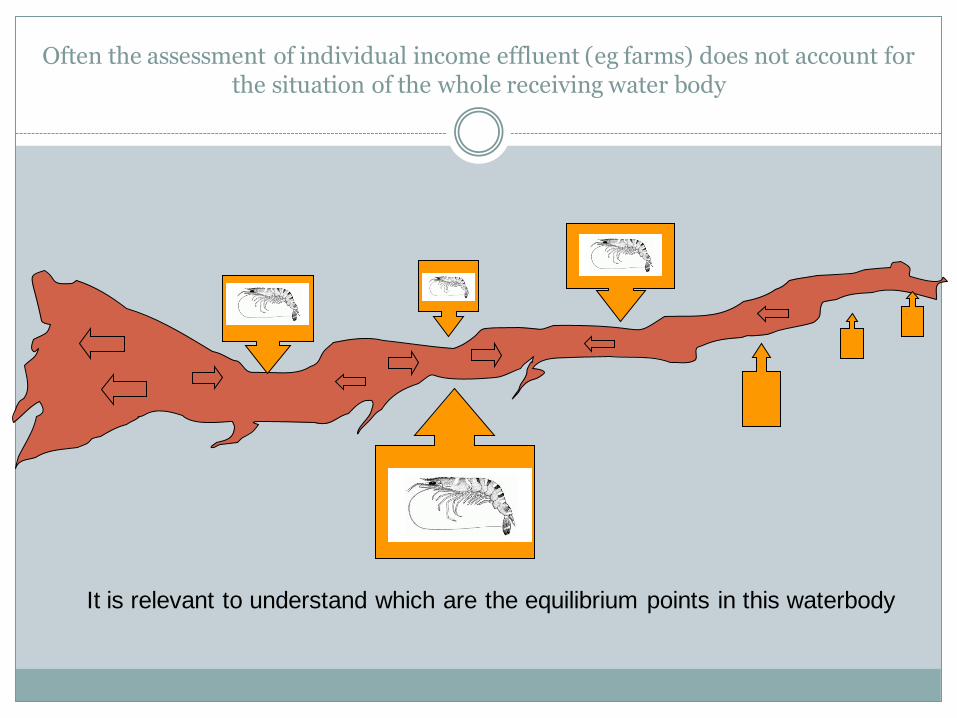
Often the assessment of individual income effluent (eg farms) does not account for
the situation of the whole receiving water body
It is relevant to understand which are the equilibrium points in this waterbody

Estimating social carrying capacity
Considering the existing communities and social structure we must ask what changes they are willing to experience
It is necessary to prevent changes and social pressures during the construction phase of aquaculture projects, during the operation stage and also during abandonment
This is a participatory process! The EAA requires a balance! Economic cost /
benefits

Phase 3: Holistic decision support
Considering all the criteria for selection of sites and the estimated carrying capacity we proceed to the decision and provide licenses
We must ensure that there is a supporting legislation or normative system for proper implementation and
enforcement

Phase 4: monitoring, evaluation and framing adaptive management measures
Monitoring and Evaluation Establishing the threshold values for key indicators
(ecological, social, productive) of carrying capacity status
Permanent monitoring such indicators and regular analysis and interpretation of the information
Aplication of corrective measures when appropriate
THERE IS NO POINT IN ESTABLISHING CARRYING CAPACITY AND MAXIMUM BIOMASS IF THERE IS NO FOLLOW UP MONITORING. This is because the Ccap is “estimate”!!!!!

Monitoring and evaluation
Integrated monitoring is a must!!!
The monitoring programme should allow to understand the development of the environmental and sanitary conditions, identify trends and potential threats to aquaculture
It will tell us if we are approaching carrying capacity!
A “water body or neighborhood“ authority is needed to facilitate decision making and to implement decisions


Example
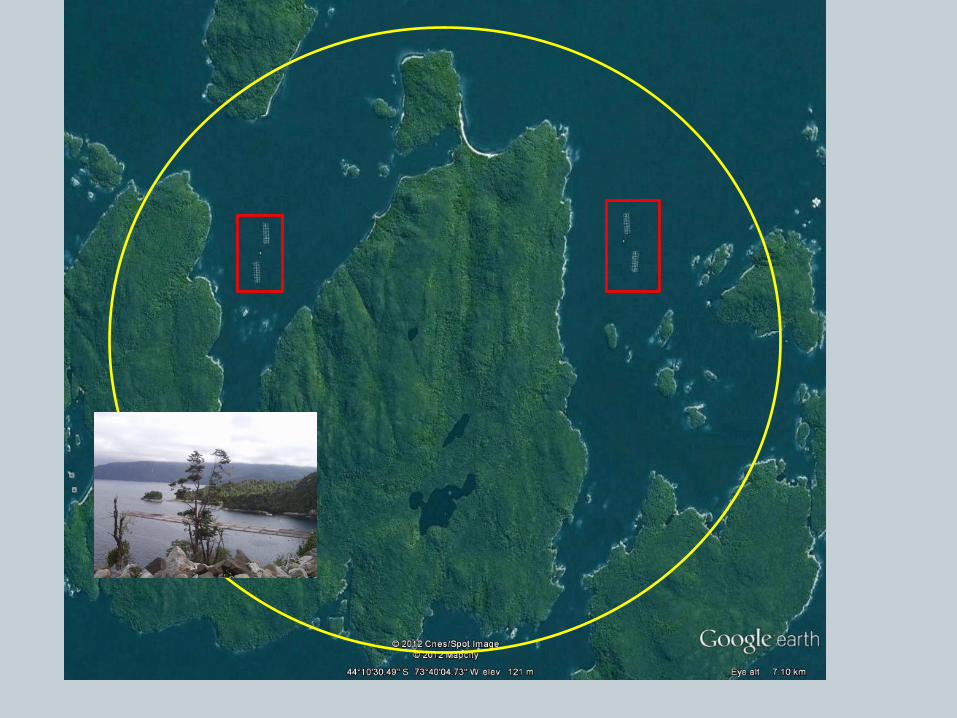

Scoping
Isolated area, transportation and limited access Average depth 50 m, salinity 30 small coastal communities and withdrawals, scarce labor
Artisanal fisheries present relevant but seasonal Job for localities in the region but something more withdrawals Pristine environment, high biodiversity and coastal benthic

Identify and priorize the main issues /element for the selection criteria
Depth, currents and salinity etc.
Preserving biodiversity and coastal aquatic
Challenging to attract workforce
No infrastructure (will need to build / provide
housing services)
Create social and support services
Diseases!!!!!!!


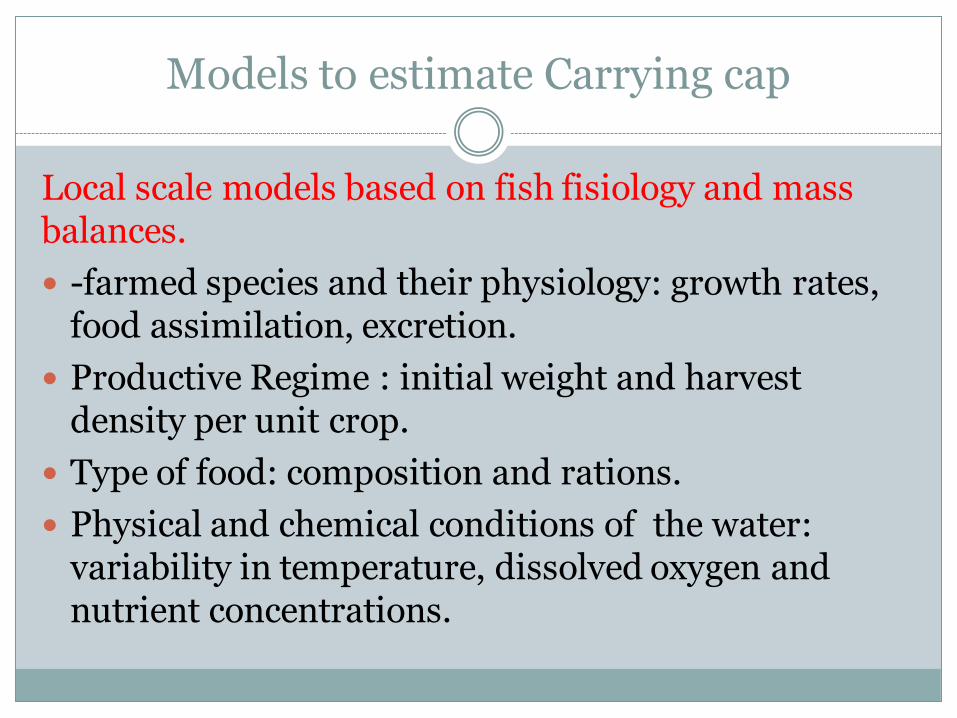
Models to estimate Carrying cap
Local scale models based on fish fisiology and mass balances.
-farmed species and their physiology: growth rates, food assimilation, excretion.
Productive Regime : initial weight and harvest density per unit crop.
Type of food: composition and rations.
Physical and chemical conditions of the water: variability in temperature, dissolved oxygen and nutrient concentrations.

2. Models based on bethic conditions
- Batimetría del área de ubicación del cultivo. - Régimen de corrientes y circulación en el área. - Tipo de alimento y tasa de alimentación de los peces. - Factor de conversión y tasas de asimilación de los peces. - Tasas de sedimentación de partículas: pellets de alimento y fecas. - Acumulación de materia orgánica en el fondo. - Granulometría del sedimento. - Niveles de oxígeno disuelto en el agua sobre el fondo. - Metabolismo del bentos: demanda de oxígeno para metabolizar
materia orgánica acumulada. - Balances de oxígeno y amonio: en sedimento y agua suprayacente. - Condición del bentos: presencia-ausencia, abundancia y/o
diversidad de infauna bentónica.

4. Broader hydrodynamic models
- Batimetría y topografía de la cuenca de estudio (fiordo, canal, estuario).
- Régimen de circulación (forzamiento por mareas, viento y aportes de agua dulce).
- Ingreso de nutrientes (ríos, estuarios, escorrentía, descargas humanas, y cultivos de camarones, peces).
- Ingreso de oxígeno (ríos, mezcla vertical inducida por viento o forzamiento oceánico).

INFORMATION NEEDED
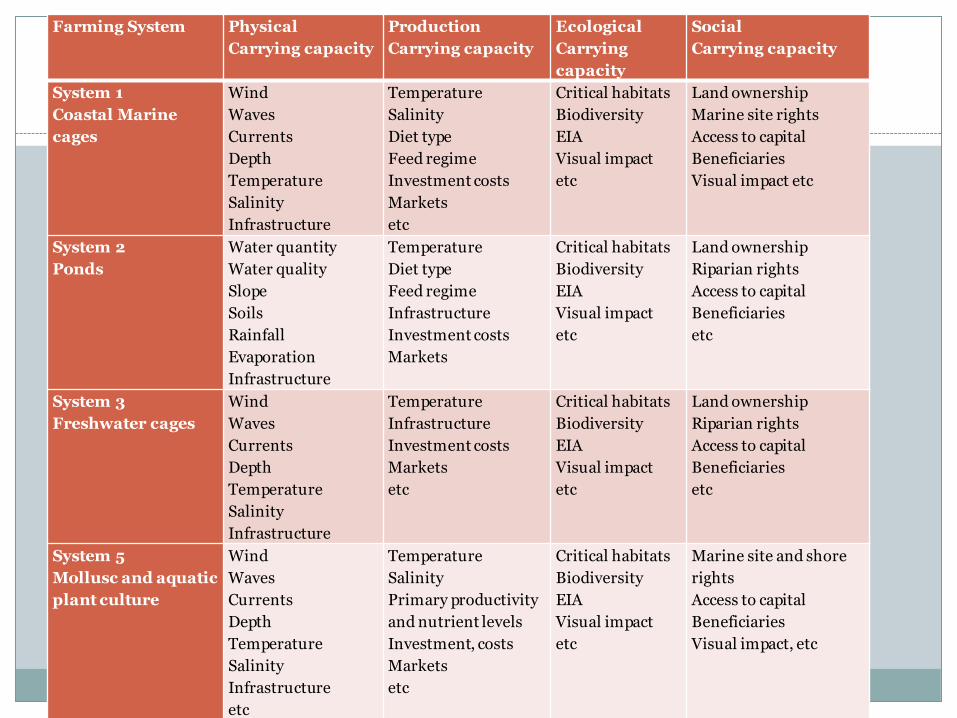
Farming System Physical
Carrying capacity
Production
Carrying capacity
Ecological
Carrying
capacity
Social
Carrying capacity
System 1
Coastal Marine
cages
Wind
Waves
Currents
Depth
Temperature
Salinity
Infrastructure
Temperature
Salinity
Diet type
Feed regime
Investment costs
Markets
etc
Critical habitats
Biodiversity
EIA
Visual impact
etc
Land ownership
Marine site rights
Access to capital
Beneficiaries
Visual impact etc
System 2
Ponds
Water quantity
Water quality
Slope
Soils
Rainfall
Evaporation
Infrastructure
Temperature
Diet type
Feed regime
Infrastructure
Investment costs
Markets
Critical habitats
Biodiversity
EIA
Visual impact
etc
Land ownership
Riparian rights
Access to capital
Beneficiaries
etc
System 3
Freshwater cages
Wind
Waves
Currents
Depth
Temperature
Salinity
Infrastructure
Temperature
Infrastructure
Investment costs
Markets
etc
Critical habitats
Biodiversity
EIA
Visual impact
etc
Land ownership
Riparian rights
Access to capital
Beneficiaries
etc
System 5
Mollusc and aquatic
plant culture
Wind
Waves
Currents
Depth
Temperature
Salinity
Infrastructure
etc
Temperature
Salinity
Primary productivity
and nutrient levels
Investment, costs
Markets
etc
Critical habitats
Biodiversity
EIA
Visual impact
etc
Marine site and shore
rights
Access to capital
Beneficiaries
Visual impact, etc

Category
(pillar)
Indicators Measures / approaches Models / tools
Physical Water availability
Water access
Water quality
Hydrography
Hydrodynamics
Inventory of aquaculture
Site selection
Zoning
Water management
ICZM, climate change Risk
Assessment
Transboundary waterbodies /
watersheds
GIS. e.g.:
Arc-info (ESRI®),
IDRISI™ (Clark Labs)
Mapinfo™ (Pitney Bowes)
GRASS (grass.fbk.eu)
Google Earth (earth.google.com)
Surfer™ (Golden Software)
Production Intensity of production
Yield
Investment
Market value
Economic indicators
Optimisation
Management
Area Management
Cluster management
POND (www.longline.co.uk)
FARM (www.longline.co.uk)
Winshell (www.longline.co.uk)
INVESTMENT (FAO model)
Many proprietary model options (e.g.
operated by aquaculture companies)
Ecological Waste dispersion
Habitat deterioration
Dissolved nutrients
Eutrophication Benthic
hypoxia
Monitoring
Risk assessment
Biodiversity and Exotics
Resource (e.g. habitat)
mapping
DEPOMOD (Cromey et al., 2002ª,b)
STELLA™ (www.iseesystems.com)
Vensim® (www.vensim.com)
Powersim™ (www.powersim.com)
GIS (see above)
Social Space conflict
Employment
Livelihood
Acceptability
Value to the community
Developed: regulation
Developing: flexibility
Participatory
Transparency
Advocacy
Identify stakeholders
PRA
Based on perceptions
May be non-quantitative