proceedings of the canadian freshwater aquaculture...
TRANSCRIPT


Proceedings of the Canadian Freshwater Aquaculture Symposium – Aquaculture Canada 2004
AAC Spec. Publ. No. 11 (2006) 1
Aquaculture CanadaOM 2004 – Proceedings of Contributed Papers – Canadian Freshwater Aquaculture Symposium. Part of the 21st Annual Meeting of the Aquaculture Association of Canada, Québec City, Québec, October 17-20, 2004. OM Aquaculture Canada is an Official Mark of the Aquaculture Association of Canada and may not be used without permission. Aquaculture Association of Canada Special Publication Number 11, 2006. Éric Gilbert, Daniel Stechey and Melissa Struthers, editors ISBN 0-9780943-0-1 Published by Aquaculture Association of Canada, St. Andrews, NB Printed by Transcontinental Express, St. John’s, NL © 2006 Aquaculture Association of Canada Printed in Canada Front Cover: Photos courtesy of Steve Naylor, Ontario Ministry of Agriculture

Proceedings of the National Freshwater Aquaculture Symposium – Aquaculture Canada 2004
2 AAC Spec. Publ. No. 11 (2006)
Aquaculture CanadaOM 2004 October 17-20, 2004 Québec City, Québec Proceedings of Contributed Papers – Canadian Freshwater Aquaculture Symposium Table of Contents Introduction Freshwater Aquaculture in Canada: Addressing Challenges – Realizing Potential Éric Gilbert and Daniel Stechey ...................................................................................................................... 4 Contributed Papers Freshwater Aquaculture in Canada: Status, Potential and Developmental Challenges................................ 14 Éric Gilbert U.S. National Technology-based Effluent Pollutant Control Requirements for Concentrated Aquatic Animal Production ........................................................................................................................................... 21 Marvin Rubin Freshwater Aquaculture in Denmark: A New Platform for Sustainable Growth ............................................ 26 Brian Thomsen Environmental Regulation of Freshwater Aquaculture in Canada.................................................................. 31 Daniel Stechey and Jan Linquist Panel Discussion: Toward an Enabling Policy and Regulatory Framework in Canada ................................ 40 Moderator: David Rideout, Canadian Aquaculture Industry Alliance Future Directions in Feed Formulation for Waste Reduction.......................................................................... 48 Dominique P. Bureau and Katheline Hua Phosphorus and Feeding Fish: Issues and Perspectives.............................................................................. 53 Grant W. Vandenberg and Gabriel Koffi D. Koko Use of Computer Models to Establish the Feeding Standards for Fish Performance and Waste Reduction for Sustainable Aquaculture: A TREATISE........................................................................................................... 63 C. Young Cho Technologies to Improve Feeding Efficiency in Land-Based and Cage Culture Systems ............................. 74 Daniel Stechey
A Comparison of Alternative Designs and Technologies in Recirculating Aquaculture.................................. 86 Denis Delong and Thomas M. Losordo Les circuits fermés et les coûts d’énergie ....................................................................................................... 91 Robert Champagne et Gilles Filion

Proceedings of the Canadian Freshwater Aquaculture Symposium – Aquaculture Canada 2004
AAC Spec. Publ. No. 11 (2006) 3
Mass Balance and Nutrient Flows in Freshwater Aquaculture ....................................................................... 98 Dominique P. Bureau and Katheline Hua La STRADDAQ, un partenariat pour le développement durable de l’aquaculture en eau douce au Québec............................................................................................................................................................ 103 Sylvain Lareau, Michel Groleau et Guy Ouellet Management Approaches for Coldwater Disease Caused by Flavobacterium psychrophilum...................... 111 John S. Lumsden, Karrie Young, Katie Welsh and Shohreh Heshami A Review of Epidemiological Investigations of Bacterial Gill disease in Ontario Ministry of Natural Resources Fish Hatcheries............................................................................................................................. 118 Chris M. Good and Mary A. Thorburn Temperature Dependent Immune System Suppression in Teleost Fish: Do Pathogens Dominate in the Cold? ............................................................................................................................................................... 125 Brian Dixon, Julie Parks, Suchita Nath, Steve Kales, Kazuhiro Fujiki and Patricia Schulte Is Antibiotic Resistance in Freshwater Aquaculture a Problem: A Québec Perspective ............................... 131 Carl Uhland Use of Hybrid Membrane Filtration Technology Combined with Chemical Precipitation to Control Phosphorus Release from Recirculation Aquaculture Systems ..................................................................... 134 Ling Yang, Hongde Zhou and Rich Moccia Aquaculture Development In Alberta .............................................................................................................. 142 Eric Hutchings Species Selection in Freshwater Aquaculture: A Prioritization Model for Industry Diversification ................ 147 Gord M. Durant Aquaculture as an Agricultural Diversification Strategy .................................................................................. 159 Daniel Stechey and Éric Gilbert Techniques Used for the Intensive Culture of Lake Whitefish (Coregonus clupeaformis) in Ontario, Canada............................................................................................................................................................ 169 Glenn W. Hooper Intensive Culture of Walleye in the United States........................................................................................... 173 Robert C. Summerfelt Pathways to Privatization of Fish Stocking ..................................................................................................... 183 Duane S. Radford

Proceedings of the National Freshwater Aquaculture Symposium – Aquaculture Canada 2004
4 AAC Spec. Publ. No. 11 (2006)
Introduction
Freshwater Aquaculture in Canada: Addressing Challenges – Realizing Potential Éric Gilbert, Chair, Canadian Freshwater Aquaculture Symposium Daniel Stechey, Co-Chair, Canadian Freshwater Aquaculture Symposium Freshwater aquaculture in Canada is relatively small compared to the marine sector, accounting for only 6% of total tonnage and 11% of total value of the 2002 aquaculture output in Canada. In comparison, European countries like Denmark, France, the U.K. and Italy each produce more than 25,000 tonnes of trout annually in freshwater systems. With the largest reserve of freshwater in the world comprised of millions of lakes, rivers, reservoirs and aquifers, it is an understatement to say that Canada is not meeting its potential in freshwater aquaculture. Moreover, with the world’s second largest seafood market located only hours to the south, there is a considerable potential to enhance the capacity of freshwater aquaculture in Canada. Nevertheless, despite the enormous potential to become a major force in the agri-food sector within the interior of Canada, the sector has demonstrated little to no growth over the last five years. In some regions, production is in decline. Growth in freshwater aquaculture has been significantly impeded by concerns related to the potential negative environmental impact of fish culture practices. These concerns have led to an ‘unofficial’ moratorium on industry expansion in a number of key areas. Consequently, the challenges faced by the industry are considerable and, under the current policy and regulatory climate, the outlook is bleak if appropriate action is not taken. To realize its potential, industry and governments must address the challenges to sustainable aquaculture development in freshwater. Identifying sectoral needs and establishing priorities for technology transfer, research and development activities are fundamental requirements for industry expansion.
Objectives of the Canadian Freshwater Aquaculture Symposium Historically, efforts to identify and resolve the developmental challenges (real or perceived) to freshwater aquaculture have largely been addressed at a regional level. This approach, although producing some benefits, has not been functionally effective or efficient. A broader, national approach could serve to generate leveraged results from over-taxed and under-funded research, development and technology transfer programs and services. Therefore, industry and government stakeholders developed, through the Inter-provincial Collaborative Initiative for Sustainable Freshwater Aquaculture, a National Freshwater Aquaculture Action Plan to focus efforts on priorities areas in freshwater aquaculture R&D and Technology Transfer - namely Nutrition; Waste Management; Farm Management; and Environmental Carrying (Assimilative) Capacity. To facilitate implementation of this Plan, the Canadian Freshwater Aquaculture Symposium provided a forum to increase awareness and transfer knowledge with respect to those issues that continue to constrain freshwater aquaculture development in Canada, including: • Policy and regulatory approaches for
sustainable development; • Fish feeding strategies for enhanced
sustainability and profit; • Advances in recirculating systems; • Technologies to advance knowledge
regarding environmental interactions; • Fish health management; • Effluent treatment and waste management;
and • Production’s diversification. Experts in freshwater aquaculture from across Canada were invited to participate in the Symposium. Additionally, international experts from leading freshwater aquaculture nations were also invited to share their expertise and thus enable Canada to benefit from the experience of other progressive countries. In total, the Freshwater Aquaculture Symposium consisted of 32 separate presentations and a panel discussion grouped into seven thematic sessions as follows.

Proceedings of the Canadian Freshwater Aquaculture Symposium – Aquaculture Canada 2004
AAC Spec. Publ. No. 11 (2006) 5
Note: Lead author name and affiliation only listed in session summary. Asterik (*) indicates paper unavailable.

Proceedings of the Canadian Freshwater Aquaculture Symposium – Aquaculture Canada 2004
6 AAC Spec. Publ. No. 11 (2006)
Canadian Freshwater Aquaculture Symposium – Session Summary Session 1 Legal and Regulatory Framework for Freshwater Aquaculture Chair: Éric Gilbert
1. Freshwater Aquaculture in Canada: Status, Potential and Developmental Challenges Éric Gilbert, Fisheries and Oceans Canada
2. U.S. National Technology-based Effluent Pollutant Control Requirements for Concentrated
Aquatic Animal Production Marvin Rubin, US Environment Protection Agency
3. Freshwater Aquaculture in Denmark: A New Platform for Sustainable Growth
Brian Thomsen, Danish Aquaculture Association 4. Environmental Regulation of Freshwater Aquaculture in Canada
Daniel Stechey, Canadian Aquaculture Systems Inc. 5. Panel Discussion: Toward an Enabling Policy and Regulatory Framework in Canada
Moderator: David Rideout, Canadian Aquaculture Industry Alliance Session 2 Feeding Fish for Environmental Sustainability and Profit Chair: Grant Vandenberg
6. Future Directions in Feed Formulation for Waste Reduction
Dominique P. Bureau, University of Guelph 7. Phosphorus and Feeding Fish: Issues and Perspectives
Grant W. Vandenberg, Université Laval 8. Use of Computer Models to Establish the Feeding Standards for Fish Performance and Waste
Reduction for Sustainable Aquaculture: A TREATISE C. Young Cho, University of Guelph
9. Technologies to Improve Feeding Efficiency in Land-Based and Cage Culture Systems
Daniel Stechey, Canadian Aquaculture Systems Inc. Session 3 Advances in Freshwater Recirculation Systems Chair: Daniel Stechey
10. A Comparison of Alternative Designs and Technologies in Recirculating Aquaculture
Denis Delong, North Carolina State University 11. Recirculating Systems and Energy Costs
Robert Champagne, Ministère de l’Agriculture, des Pêcheries et de l’Alimentation 12. *Overview of Gas Supersaturation and Degassing Strategies for Freshwater Hatcheries
Trudy Pitre, Point Four Systems Inc. 13. *Phosphorous Emissions of a Land-based Salmon Smolt Recirculation Hatchery
T. Trofimencof, University of New Brunswick

Proceedings of the Canadian Freshwater Aquaculture Symposium – Aquaculture Canada 2004
AAC Spec. Publ. No. 11 (2006) 7
Session 4 Environment Sustainability in Freshwater Aquaculture Chair: Richard Moccia
14. *Environmental Sustainability? Issues and Concepts of an Enhanced Decision-Making System.
Rich Moccia, University of Guelph 15. *Ecosystem Effects: Unique Aspects of Water Quality and Benthic Impacts in Freshwater
Murray Charlton, Environment Canada 16. *Results from Sediment Surveys in the Vicinity of Freshwater Net-pen Aquaculture Operations in
the North Channel Mary Thorburn, Ontario Ministry of the Environment
17. Mass Balance and Nutrient Flows in Freshwater Aquaculture
Dominique P. Bureau, University of Guelph 18. *Forensic Analysis of a Case Study of Environmental Management of Freshwater Cage
Aquaculture Steve Naylor, Ontario Ministry of Agriculture
19. STRADDAQ : A Partnership for Environmental Sustainability of Freshwater Aquaculture in
Québec Sylvain Lareau, Association des Aquaculteurs du Québec
Session 5 Fish Health Management in Freshwater Aquaculture Chair: Rod Penney
20. Management Approaches for Coldwater Disease Caused by Flavobacterium psychrophilum
John S. Lumsden, University of Guelph 21. A Review of Epidemiological Investigations of Bacterial Gill disease in Ontario Ministry of Natural
Resources Fish Hatcheries Chris M. Good, University of Guelph
22. Temperature Dependent Immune System Suppression in Teleost Fish: Do Pathogens Dominate
in the Cold? Brian Dixon, University of Waterloo
23. Is Antibiotic Resistance in Freshwater Aquaculture a Problem: A Québec Perspective
Carl Uhland, University of Montreal

Proceedings of the Canadian Freshwater Aquaculture Symposium – Aquaculture Canada 2004
8 AAC Spec. Publ. No. 11 (2006)
Session 6 Effluent Treatment / Waste Management Chair: Gord Durant
24. Use of Hybrid Membrane Filtration Technology Combined with Chemical Precipitation to Control Phosphorus Release from Recirculation Aquaculture Systems Ling Yang, University of Guelph
25. *Near-field Loading Dynamics of Phosphorus at a Rainbow Trout Cage Farm: Implications for
Environmental Monitoring Gregor Reid, University of Guelph
26. *Biological Means for Removing Phosphorus from Aquaculture Effluents
Sebastien Sauve, University of Montreal
27. Aquaculture In Alberta Eric Hutchings, Alberta Agriculture, Food and Rural Development
Session 7 Diversification of Freshwater Aquaculture Chair: Pierre Dubé
28. Species Selection in Freshwater Aquaculture: A Prioritization Model for Industry Diversification Gord M. Durant, Ontario Ministry of Natural Resources
29. Aquaculture as an Agricultural Diversification Strategy
Daniel Stechey, Canadian Aquaculture Systems Inc. 30. Techniques Used for the Intensive Culture of Lake Whitefish (Coregonus clupeaformis) in
Ontario, Canada Glenn W. Hooper, Ontario Ministry of Natural Resources
31. Intensive Culture of Walleye in the United States
Robert C. Summerfelt, Iowa State University 32. Pathways to Privatization of Fish Stocking
Duane S. Radford, Alberta 33. *Stocking Opportunities of Artificially-produced Fish in Washington State, USA
John Kerwin, WA Department of Fish and Wildlife Symposium Sponsors The generous support and financial assistance provided by the following sponsors was invaluable in making the Canadian Freshwater Aquaculture Symposium a success. • Aquaculture Association of Canada (AAC) • Association des Aquaculteurs du Québec (AAQ) • Fisheries and Oceans Canada (DFO) • Inter-Provincial Initiative for Sustainable Freshwater Aquaculture Development • Northern Ontario Aquaculture Association (NOAA) • Ontario Aquaculture Association (OAA) • Société de Recherche et Développement en Aquaculture Continentale (SORDAC) • University of Guelph

Proceedings of the Canadian Freshwater Aquaculture Symposium – Aquaculture Canada 2004
AAC Spec. Publ. No. 11 (2006) 9
Introduction
L’aquaculture en eau douce au Canada : Faire face aux enjeux – Tirer parti du potentiel Éric Gilbert, président, Symposium canadien sur l’aquaculture en eau douce Daniel Stechey, coprésident, Symposium canadien sur l’aquaculture en eau douce L’aquaculture en eau douce au Canada est une activité relativement restreinte comparativement au secteur marin, puisqu’elle ne représentait que 6 %, en poids, et 11 %, en valeur, de la production aquacole totale du Canada en 2002. Comparativement, des pays européens comme le Danemark, la France, le Royaume-Uni et l’Italie, produisent chacun plus de 25 000 tonnes de truites par année dans des installations d’eau douce. Quand on sait que le Canada dispose des plus grandes réserves d’eau douce du monde, qui se composent de millions de lacs, de cours d’eau, de réservoirs et d’aquifères, il est indéniable que son potentiel d’aquaculture en eau douce n’est pas pleinement mis en valeur. Sans oublier que le deuxième plus grand marché de poissons et fruits de mer du monde se trouvant à quelques heures seulement au sud, il est indéniable qu’il existe des possibilités d’expansion considérables pour le secteur canadien des eaux douces. Néanmoins, malgré ses possibilités énormes de devenir un élément moteur important du secteur de l’agro-alimentaire dans les régions rurales du pays, le secteur de l’aquaculture en eau douce a connu une croissance plutôt faible sinon inexistante au cours des cinq dernières années. Dans certaines régions, la production est même à la baisse. En fait, sa croissance a été largement entravée par des préoccupations liées aux répercussions négatives que pourraient avoir sur l’environnement les pratiques aquacoles. Ces préoccupations ont entraîné l’imposition d’un moratoire « officieux » à l’expansion de l’industrie dans un certain nombre de régions clées. Par conséquent, les enjeux auxquels est confrontée l’industrie sont importants et, compte tenu des politiques et du climat réglementaire actuels, les perspectives apparaissent plutôt ternes si aucune mesure n’est prise. Afin d’en réaliser le plein potentiel,
l’industrie et les gouvernements doivent relever les défis liés au développement d’une aquaculture durable en eau douce. Une définition claire des besoins du secteur et l’établissement de priorités pour les activités de transfert technologique, de recherche et de développement sont des exigences préalables fondamentales à l’expansion de l’industrie. Objectifs du Symposium canadien sur l’aquaculture en eau douce Historiquement, les efforts visant à cerner les enjeux (réels ou perçus) du développement de l’aquaculture en eau douce et à y apporter des solutions ont été déployés en grande partie à l’échelle régionale. Cette approche, bien qu’elle ait des avantages, n’a pas été très efficace ou efficiente sur le plan opérationnel. Une approche plus étendue, à l’échelle nationale, pourrait contribuer à tirer parti des résultats de programmes et de services de recherche, de développement et de transfert de technologie déjà trop lourdement souscrits et sous-financés. Par conséquent, les intervenants de l’industrie et des gouvernements, dans le cadre de l’Initiative interprovinciale pour le développement durable de l’aquaculture en eau douce, ont élaboré un Plan d’action national pour l’aquaculture en eau douce en vue d’orienter les efforts vers les domaines prioritaires de R-D et de transfert technologique, soit la nutrition, la gestion des déchets, la gestion des exploitations, et la capacité réceptrice du milieu naturel (auto-épuration). Afin de faciliter la mise en œuvre de ce Plan, le Symposium canadien sur l’aquaculture en eau douce constitue une tribune visant à accroître la sensibilisation et à échanger des connaissances sur les problèmes qui continuent de limiter le développement de l’aquaculture en eau douce au Canada, notamment : • les politiques et le cadre réglementaire
favorisant le développement durable; • une stratégie d’alimentation du poisson
assurant la durabilité et la rentabilité; • les progrès réalisés dans les systèmes de
recirculation;

Proceedings of the Canadian Freshwater Aquaculture Symposium – Aquaculture Canada 2004
10 AAC Spec. Publ. No. 11 (2006)
• les technologies permettant d’améliorer les connaissances sur les interactions environnementales;
• la gestion de la santé des poissons; • le traitement des effluents et la gestion des
déchets; et • la diversification de la production. Des experts en aquaculture d’eau douce de tout le Canada ont été invités à participer au Symposium. De plus, des experts internationaux d’États qui sont des chefs de file dans le domaine ont aussi été invités à partager leurs connaissances et, d’ainsi, permettre au Canada de bénéficier de leurs expériences innovatrices. Au total, le Symposium sur l’aquaculture en eau douce comportait 32 présentations distinctes et des débats d’experts regroupés en sept sessions thématiques, comme il est indiqué ci--après. Remarque : ne sont indiqués que le nom et l’affiliation de l’auteur principal dans le résumé de la séance. Un astérique (*) indique que le document n’est pas disponible.

Compte rendu du Symposium canadien sur l’aquaculture en eau douce – Aquaculture Canada 2004
AAC Spec. Publ. No. 11 (2006) 11
Symposium canadien sur l’aquaculture en eau douce – Résumé de la session Session 1 Cadre légal et réglementaire appliqué à l’aquaculture en eau douce Président : Éric Gilbert
1. Aquaculture en eau douce au Canada : situation actuelle, potentiel de développement et enjeux Éric Gilbert, Pêches et Océans Canada
2. Exigences nationales américaines relatives au contrôle technologique des polluants dans
l’effluent pour la production intensive d’animaux aquatiques Marvin Rubin, Environment Protection Agency, États-Unis
3. Aquaculture en eau douce au Danemark : Une nouvelle plate-forme pour la croissance durable
Brian Thomsen, Association aquacole danoise 4. Réglementation environnementale de l’aquaculture en eau douce au Canada
Daniel Stechey, Canadian Aquaculture Systems Inc. 5. Débat d’experts : Vers une politique et un cadre réglementaire habilitant au Canada
Modérateur : David Rideout, Alliance de l’industrie canadienne de l’aquaculture Session 2 Stratégies nutritionnelles pour un développement durable et une maximisation
des profits Président : Grant Vandenberg
6. Orientations futures pour l’élaboration des moulées en vue de réduire les déchets
Dominique P. Bureau, Université de Guelph 7. Phosphore et alimentation du poisson : Enjeux et perspectives
Grant W. Vandenberg, Université Laval 8. Usage de modèles informatiques pour l’établissement de normes d’alimentation permettant d’assurer
le rendement du poisson et la réduction des déchets pour une aquaculture durable : TRAITÉ C. Young Cho, Université de Guelph
9. Technologies pour améliorer l’efficacité de l’alimentation dans les systèmes d’aquaculture
terrestre et en cages Daniel Stechey, Canadian Aquaculture Systems Inc.
Session 3 Les derniers développements dans les systèmes de recirculation d’eau douce Président : Daniel Stechey
10. Comparaison de différents modèles et technologies de systèmes de recirculation en aquaculture
Denis Delong, North Carolina State University 11. Les circuits fermés et les coûts d’énergie
Robert Champagne, ministère de l’Agriculture, des Pêcheries et de l’Alimentation 12. *Aperçu de la sursaturation de gaz et des stratégies de dégazage pour les écloseries en eau
douce Trudy Pitre, Point Four Systems Inc.

Proceedings of the Canadian Freshwater Aquaculture Symposium – Aquaculture Canada 2004
12 AAC Spec. Publ. No. 11 (2006)
13. *Émissions de phosphore d’une écloserie terrestre de saumoneaux en circuit fermé T. Trofimencof, Université du Nouveau-Brunswick
Session 4 La protection de l’environnement et l’aquaculture en eau douce Président : Richard Moccia
14. *Développement durable? Enjeux et concepts d’un système décisionnel amélioré
Rich Moccia, Université de Guelph 15. *Effets sur l’écosystème : aspects uniques de la qualité de l’eau et répercussions benthiques en
eau douce Murray Charlton, Environnement Canada
16. *Résultats de relevés de sédiments à proximité de cages en eau douce dans le Noth Cahnnel
Mary Thorburn, ministère de l’Environnement de l’Ontario 17. Bilan massique et circulation des nutriments dans les installations d’aquaculture en eau douce
Dominique P. Bureau, Université de Guelph 18. *Analyse d’une étude de cas de gestion écologique de l’aquaculture en cages en eau douce
Steve Naylor, ministère de l’Agriculture de lOntario 19. La STRADDAQ, un partenariat pour le développement durable de l’aquaculture en eau douce au
Québec Sylvain Lareau, Association des Aquaculteurs du Québec
Session 5 Gestion de la santé des poissons Président : Rod Penney
20. Approche de gestion de l’infection à bactérie cryophile causée par Flavobacterium psychrophilum
John S. Lumsden, Université de Guelph 21. Examen des études épidémiologiques sur la maladie bactérienne des branchies dans les
écloseries du ministère des Richesses naturelles de l’Ontario Chris M. Good, Université de Guelph
22. Suppression du système immunitaire thermodépendante chez les poissons téléostéens : les
pathogènes dominent-ils au froid? Brian Dixon, Université de Waterloo
23. La résistance aux antibiotiques en aquaculture en eau douce est-elle un problème? : Perspective
québécoise Carl Uhland, Université de Montréal
Session 6 Traitement des effluents / gestion des rejets Président : Gord Durant
24. Utilisation de la technologie hybride de filtration par membrane combinée à la précipitation chimique pour limiter les rejets de phosphore par les systèmes d’aquaculture en circuit fermé Ling Yang, Université de Guelph
25. *Dynamique de la charge en phosphore à proximité d’un élevage en cage de truite arc-en-ciel :
Répercussions pour le suivi environnemental Gregor Reid, Université de Guelph

Compte rendu du Symposium canadien sur l’aquaculture en eau douce – Aquaculture Canada 2004
AAC Spec. Publ. No. 11 (2006) 13
26. *Méthodes biologiques d’élimination du phosphore des effluents d’aquaculture
Sébastien Sauvé, Université de Montréal
27. L’aquaculture en Alberta Eric Hutchings, ministère de l’Agriculture de l’Alberta, Alimentation et développement rural
Session 7 Diversification de l’aquaculture en eau douce Président : Pierre Dubé
28. Sélection d’espèces pour l’aquaculture en eau douce : Un modèle d’établissement de priorités pour la diversification de l’industrie Gord M. Durant, ministère des Richesses naturelles de l’Ontario
29. L’aquaculture en tant que stratégie de diversification agricole
Daniel Stechey, Canadian Aquaculture Systems Inc. 30. Techniques utilisées pour la culture intensive du grand corégone (Coregonus clupeaformis) en
Ontario, Canada Glenn W. Hooper, ministère des Richesses naturelles de l’Ontario
31. Culture intensive du doré jaune aux États-Unis
Robert C. Summerfelt, Université d’État de l’Iowa 32. Modes de privatisation de l’ensemencement
Duane S. Radford, Alberta 33. *Possibilités d’ensemencement de poissons d’élevage dans l’État de Washington, É.-U.
John Kerwin, WA, Department of Fish and Wildlife Commanditaires du symposium Le succès du Symposium canadien sur l’aquaculture en eau douce est attribuable en grande partie au généreux soutien et à l’aide financière inestimable des commanditaires suivants : • Association aquacole du Canada (AAC) • Association des Aquaculteurs du Québec
(AAQ) • Pêches et Océans Canada (MPO)
• l’Initiative interprovinciale pour le
développement durable de l’aquaculture en eau douce
• Northern Ontario Aquaculture Association (NOAA)
• Ontario Aquaculture Association (OAA) • Société de recherche et développement en
aquaculture continentale (SORDAC) • L’Université de Guelph

Proceedings of the Canadian Freshwater Aquaculture Symposium – Aquaculture Canada 2004
14 AAC Spec. Publ. No. 11 (2006)
Freshwater Aquaculture in Canada: Status, Potential and Developmental Challenges Éric Gilbert Aquaculture Management Directorate, Fisheries and Oceans Canada, 200 Kent Street, Ottawa K1A 0E6 Au Canada, la production aquacole en eaux douces stagne depuis quelques années bien que dans plusieurs provinces des avantages comparatifs indéniables pourraient supporter un développement économique important de ce secteur agro-alimentaire et que le marché nord-américain soit en pleine expansion. Après une revue de la situation actuelle qui prévaut (volume généré, emplois créés, répartition géographique, contribution au PIB, etc.), le potentiel de développement de cette production sera ensuite discuté sur la base d’une expansion de la base industrielle existante (productions traditionnelles), et des possibilités de diversification de cette activité économique. Cependant, la réalisation de cet important potentiel de développement fait face à des contraintes majeures dont la plus importante est sans contredit l’accès aux sites nécessaires à l’établissement de nouvelles entités de production tant en milieu terrestre qu’en milieu aquatique. La levée de ces contraintes passera nécessairement par la coordination des efforts et la collaboration de tous les intervenants des secteurs public et privé, notamment par la mise en œuvre d’initiatives concertées telles que l’Initiative Interprovinciale pour le Développement Durable de l’Aquaculture en Eaux Douces. In Canada, freshwater fish farming has been stagnating in recent years, although in several provinces, undeniable comparative advantages could support major economic development of this agro-food sector, given that the North American market is experiencing strong growth. Following a review of the current prevailing situation (volume generated, jobs created, geographic distribution, contribution to GDP, etc.), the development potential for this production will be discussed in light of expansion of the existing industrial base (traditional products) and opportunities for diversification of this economic activity. However, realization of this large development potential faces major constraints, the most serious being access to the required sites for establishing new production entities on land and in water. Removal of these constraints will, of necessity, require coordinated efforts and cooperation by all players in the public and private sectors, especially by implementing concerted initiatives such as the Inter-Provincial Initiative for Freshwater Aquaculture Sustainable Development. Introduction In 1986, Canadian aquaculture production amounted to only 10,488 tonnes, valued at $35 million. Aquaculture production tonnage increased at an average annual rate of 19.3% between 1986 and 2002, when output reached 176,696 tonnes valued at $639 million. Aquaculture now accounts for 14% of the tonnage and 23% of the value of Canada’s fish and seafood sector. Five species dominate aquaculture production: salmon 69.0%, blue mussels 14.2%, oysters 7.0%, trout 4.3% and steelhead 3.1%. Finfish represents 81% of the tonnage and 91% of the value, respectively. Salmon is by far the most important species grown by Canadian aquaculturists, accounting for 83% of the value of Canada's aquaculture industry in 2002 (1).
The value and economic potential of freshwater aquaculture in Canada was thoroughly assessed in 1999 when 9,784 tonnes of freshwater fish were produced in Canada having a value of $69.6 million (2,3). In the nineties, production of fish for human consumption accounts for the majority of the output (80%) while the remainder was produced for stocking private and public waters. Ontario and Québec are the dominant producers of freshwater fish in Canada, followed by Saskatchewan, Alberta and New Brunswick (Figure 1).

Proceedings of the Canadian Freshwater Aquaculture Symposium – Aquaculture Canada 2004
AAC Spec. Publ. No. 11 (2006) 15
Figure 1: Provincial distribution of freshwater aquaculture production (2002). More than 1,260 full-time jobs have been created by this sector - some 900 direct employment positions and approximately 360 indirect jobs in the aquaculture supplies and services sector (3). Three years later, some 785 freshwater aquaculture ventures produced approximately 10,132 tonnes of product with a farm-gate value of more than $72 million (Figure 2), but freshwater production was still representing only 5,6% of the total Canadian aquaculture production and 11% of its value.
Figure 2: Tonnage and value of total aquaculture and freshwater aquaculture output in Canada (1993 – 2002). On a global scale, Canada ranks 13th in total trout and char aquaculture output (Figure 3). In 2002, France, Italy, Turkey, Spain and Denmark were the five most important trout producing countries totalling all together for 51% of the world production. For trout only, the world production ranged from 271 986 tons in 1993 to 336 103 tons in 2002, with a peak level at almost 360 000 tons in 2001.
Figure 3: Global trout and char production by major country (2002). In Canada salmonid species account for more than 88% of the production tonnage and 70% of total value (Table 1). Rainbow trout is the most dominant culture species, representing ¾ of the tonnage (7,684 tonnes) and more than ½ of the total value of freshwater aquaculture in Canada. A number of factors account for the dominance of rainbow trout culture (4): • Culture techniques, based on more than 100
years of research and practice, are well established;
• Domesticated strains of trout have been bred to improve performance and yield;
• Nutritional requirements are well defined and efficient commercial feeds are available from several suppliers;
• Water temperatures throughout much of Canada are near ideal for the species;
• A ready market exists for rainbow trout; and • Rainbow trout is a naturalized species in
most parts of the country and thus the species poses no genetic threat to feral fisheries populations.
Looking to the future (i.e. 5-10 years), Canada will undoubtedly continue to be, first and foremost, a trout and salmonid farming country owing the nature of our biophysical resource base and the status of culture technologies for alternative production species.

Proceedings of the Canadian Freshwater Aquaculture Symposium – Aquaculture Canada 2004
16 AAC Spec. Publ. No. 11 (2006)
Table 1: Relative abundance of freshwater aquaculture species produced in Canada (2002).
Species Tonnage Percent Rainbow trout 7,684 76% Brook trout 1,200 12% Arctic char Tilapia Lake trout Brown trout Others
1,248 12%
TOTAL 10,132 100% Freshwater aquaculture operations in Canada are not standardized. Several different production systems exist, as described briefly below. Land-Based Systems typically consist of confined culture operations in tanks or ponds located on land. Process water may be taken from wells and/or from surface water supplies (e.g. streams, lakes, rivers, springs, etc.). Juvenile fish are generally purchased from a commercial hatchery and are fed a commercially prepared diet. Land-based commercial aquaculture facilities exist in every province of the country and are far more numerous than cage culture operations (even with consideration of marine sites). The scale of these ventures ranges from the smallest hobby farms where operators supplement their incomes with the production of fish, to large corporately owned facilities for the production of juveniles and food fish. The diversity of culture species is also greater in land-based systems largely due to the increased control and management that such systems enable. Nevertheless, salmonids (rainbow and speckled trout and Arctic char) remain the most commonly cultured species. Land-based systems account for 55% of freshwater aquaculture output in Canada. Lake Cage Culture of fishes in lakes consists of floating net pen systems that are anchored to a lake bed. These may or may not be directly attached to shore. Juvenile fish are typically purchased from a commercial hatchery and are grown to market size in the cages. The only specie raised in lake cage is rainbow trout. Lake-based cage culture of salmonid fishes is a sizeable industry in central Canada with considerable growth potential in Québec, Ontario, Manitoba, Saskatchewan, Alberta and British Columbia. In recent years, however, industry development has been stagnant as no
new leases or licences have been granted. Cage culture systems account for 45% of total freshwater aquaculture output in Canada. Constraints Facing Freshwater Aquaculture in Canada Today, the absence of transparent and consistent federal and provincial regulatory processes and the lack of credible science-based best management practices and performance-based standards with which industry must comply have created a crisis in confidence regarding the sustainability of aquaculture in Canada. Future development of the sector necessitates that confidence be restored in all aspects of aquaculture, from site selection and planning to operations and product safety. For freshwater aquaculture in particular, governments have been strengthening environmental controls due to pressures imposed by increasing conflict between the industry and other resource users and various environmental groups. Nutrients and solid fecal matter discharged from aquaculture operations are ‘perceived’ as a major cause of environmental degradation in bodies of water receiving aquaculture effluent. Poor communication of available knowledge regarding the environmental effects of aquaculture effluents, the scope of mitigation measures available and the assimilative capacity of the receiving environment exacerbate this crisis in confidence. Furthermore, rather than lending confidence to development, the cumbersome and inconsistent legislative and regulatory environment hinders development of a sustainable aquaculture sector in Canada. Commencing in 1999, the Government of Québec imposed enhanced environmental restrictions on aquaculture operations, leading directly to a decline in production in subsequent years. Similarly, increased controls on the Ontario sector imposed in 2001/2002 resulted in production declines (Figure 4). These regulatory pressures imposed a non-official moratorium of further aquaculture development. Not surprisingly, therefore, the economic potential on further socio-economic development in Canadian communities is not being fulfilled. In view of the potential that exists, it is an understatement to say that Canada is not meeting its potential in freshwater aquaculture.

Proceedings of the Canadian Freshwater Aquaculture Symposium – Aquaculture Canada 2004
AAC Spec. Publ. No. 11 (2006) 17
Figure 4: Ontario and Québec aquaculture output (1999-2003). Increased environmental controls were imposed in Québec in 1999 and Ontario in 2001/2002. Market Conditions and Factors For more than a decade, per capita consumption of seafood in the US has remained relatively constant at approximately 6.8 kilograms (15 lbs), however, the types of fish consumed have changed significantly in recent years. Owing to the highly consistent supply, pricing, and availability of aquaculture products, farm-raised species continue to displace wild harvest species from the list of most consumed seafood. Today, of the top 10 seafood items consumed in the US, four are leading aquaculture products – shrimp, salmon, catfish and tilapia (Table 2). Collectively, these four products amount to approximately 52% of total US per capita seafood consumption. Table 2: Per Capita Consumption of Seafood in the US. Top 10 Species 1990 – 2003 (lbs/person/yr).
Species 2003 1990 Change
Shrimp 4.00 2.20 82%Tuna 3.40 3.70 -8%Salmon 2.22 0.73 204%Pollock 1.71 1.27 34%Catfish 1.14 0.70 62%Cod 0.64 1.38 -53%Crab 0.61 0.29 110%Tilapia 0.54 0.00 >2000%Clams 0.53 0.61 -14%Scallops 0.33 0.30 10%Total - Top 10 15.11 11.18 35%
Source: USDA Economic Research Service
A cursory review of Canadian data for trout imports, exports and domestic production suggests that the Canadian market consumes approximately 10 500 tonnes (live weight) of trout annually. Québec (39%) and Ontario (23%) represent the principal Canadian markets for trout while the remaining eight provinces and the three territories consume the balance (38%) (Figure 5). With a population of approximately 31.5 million in 2002, however, Canadian per capita consumption of trout is only 330 grams (live weight equivalent) – the equivalent of a 6.6 ounces fillet per person per year.
Figure 5: Canadian market demand for rainbow trout by province (2002). In 2004, US trout production increased by 8 percent over 2003; the first increase in production since 1999 (Table 3). Producers in more than 20 States generated almost 25,000 tonnes of trout valued at US $57 million. Although production was up, the average price remained the same at US $2.29 per kilogram. US trout prices are influenced by other farm-raised fish such as catfish, and they are also impacted by overall tilapia and salmon supplies. Most of the increase in 2004 came from higher production in Idaho, the largest producing State. Trout production in the other major producing States (California, North Carolina, Pennsylvania, and Washington) was all lower in 2004 (5). The availability of suitable water supplies is a constraint to increased production in the US, particularly for producers in western areas that have experienced drought conditions for several years. Domestic production of trout accounts for about 94 percent of overall supply in the US and imports are playing an increasing role.

Proceedings of the Canadian Freshwater Aquaculture Symposium – Aquaculture Canada 2004
18 AAC Spec. Publ. No. 11 (2006)
Table 3: US farmed trout production (1999 – 2004). Year Tonnes
(000) Value (US $ 000)
Unit Value (US $/kg)
1999 27,309 $ 64.7 $ 2.37 2000 26,842 $ 63.7 $ 2.37 2001 25,800 $ 64.4 $ 2.50 2002 24,699 $ 58.3 $ 2.36 2003 23,063 $ 52.9 $ 2.29 2004 24,937 $ 57.1 $ 2.29 Source: USDA Economic Research Service The US imported almost 4,000 tonnes of trout in 2004 at a value of more than US $14 million (Table 4). In spite of a 5% decrease in imports in 2004, imports have increased significantly over the last five years. More significantly, however, is the noted discrepancy in value between US domestic and imported trout. Imports are consistently valued at a premium of 38% to 60% (49% average), due in part to the different product forms – in the US 85% of trout is a white-flesh (un-pigmented) product whereas in Canada it is almost entirely a red-flesh (pigmented) product for which consumers are willing to pay a premium. Table 4: US Trout imports, fresh and frozen (1999 – 2004). Year Tonnes
(000) Value (US $ 000)
Unit Value (US $/kg)
1999 2,385 $ 8.50 $ 3.56 2000 3,213 $ 11.29 $ 3.51 2001 3,348 $ 11.51 $ 3.44 2002 4,485 $ 14.51 $ 3.24 2003 4,093 $ 14.97 $ 3.66 2004 3,889 $ 14.15 $ 3.64 Source: USDA Economic Research Service Freshwater Aquaculture in Canada – Future Potential Freshwater aquaculture in Canada has significant growth potential, provided governments develop an enabling economic and regulatory environment in which aquaculture can prosper. Canada is well-positioned to benefit from the following competitive advantages:
• Plentiful resource base (i.e. water supplies, low cost energy, etc.);
• Industry experience, expertise and desire to support development;
• Substantial export potential with proximity to the US market which is increasingly dependent on imported seafood;
• Global demand for fish and seafood continues to expand due to population growth, increased affluence and the recognized health benefits of the products;
• A considerable potential and need for agricultural diversification and latent infrastructure to support development; and
• The potential to increase private sector participation in stocking public waters for fisheries enhancement.
Furthermore, expansion would appear to be feasible. At an average growth rate of 7.5%, freshwater aquaculture would generate an additional 10,000 tonnes of products by 2015. That is, the sector could double its capacity in only ten years. From a domestic market perspective, this would require all Canadians to eat only one additional trout meal annually. A recent study to assess the potential for aquaculture to augment agricultural diversification strategies suggests that freshwater aquaculture could supplement current output by 15,000 tonnes valued $60 million over a 7-year implementation period (cf Stechey and Gilbert, Session 7 and 4). Any expansion would likely necessitate further development of the US trout market as well; however, in a market dependent upon imported seafood to satisfy demand, this presents an attractive opportunity. Foremost, however, any expansion in the Canadian freshwater aquaculture sector will be dependent upon the resolution of several outstanding challenges. Challenges to Growth of Sustainable Freshwater Aquaculture in Canada Several challenges (real and perceived) continue to thwart aquaculture development in Canada. Industry and governments, therefore, must continue to develop collaborative approaches and solutions to resolve these challenges and restore public and consumer confidence in the safety and sustainability of aquaculture and its products. Fundamental issues remain, including:

Proceedings of the Canadian Freshwater Aquaculture Symposium – Aquaculture Canada 2004
AAC Spec. Publ. No. 11 (2006) 19
• Equitable and affordable access to production sites;
• The environmental effects of aquaculture operations and effective mitigation strategies;
• The lack of consistent science-based standards governing aquaculture operations;
• Food safety and product traceability from farm to market;
• User group conflict concerning the shared use of public resources;
• The containment of fish to avoid potential interactions among wild and escaped farmed fish; and
• A cumbersome and uncertain federal and provincial policy and regulatory framework governing aquaculture.
Investment is essential to drive industry growth, development, diversification and sustainability. Industries that are profitable or have the potential to generate substantial profits can readily attract investment. Investment, however, does not flow to industries or sectors that are deemed only marginally profitable, that have cumbersome regulatory and/or management environments or that have inherent instability or uncertainty. It is critical, therefore, that governments remain focused on the development and implementation of an enabling economic and regulatory framework to facilitate the creation of an attractive and competitive investment climate (6). Currently, numerous federal and provincial departments and agencies are involved in complex and inter-connected ways to regulate and/or develop aquaculture in Canada. The absence of a cohesive policy objective and a coordinating mechanism creates a cumbersome operating environment for industry and governments alike. Horizontal (inter-departmental) and vertical (federal – provincial) coordinating mechanisms are lacking yet they are necessary to establish effective policy and priorities for the sustainable development and management of Canada’s fish and seafood sector (7). Specific elements of a targeted federal/provincial initiative in support of freshwater aquaculture could include: • Training and skills development to bring
awareness and knowledge to people interested in aquaculture development with
specific initiatives focused on the traditional agriculture sector and Aboriginals;
• Technology development and transfer through establishment of demonstration farms, extension services, and a more cooperative relationship between government, industry and academe, etc;
• Performance-based standards for environmental sustainability and appropriate science-based waste management and mitigation measures;
• Industry-Government agreements and infrastructure programs to encourage early adoption of the necessary programs and technologies to enhance sustainability (e.g. Québec’s Strategy for Sustainable Aquaculture Development - STRADDAQ), business competitiveness and profitability in order to attract new investment;
• Market information and intelligence to enable Canadian producers to benefit from current consumption trends;
• Development and facilitation of economic diversification strategies for those sectors in need of economic renewal; and
• Investment in targeted and strategic research (applied research) and technology transfer to continue to fill the knowledge gaps (e.g. Inter-Provincial Initiative for Sustainable Freshwater Aquaculture Development).
Conclusions Freshwater aquaculture is a highly productive and sustainable use of aquatic resources with considerable potential for growth throughout all regions of Canada. Many rural communities across the country have the bio-physical resources and socio-economic interests to participate in freshwater aquaculture development. To date, however, efforts to identify and resolve the developmental challenges confronting freshwater aquaculture have largely been addressed at a regional or provincial level. This approach has lead to sporadic development of freshwater aquaculture in Canada, with some areas attaining little to no development effort. A broader inter-provincial approach could establish synergies and leverage efforts to advance research, economic development and technology transfer programs and services and infrastructure support.

Proceedings of the Canadian Freshwater Aquaculture Symposium – Aquaculture Canada 2004
20 AAC Spec. Publ. No. 11 (2006)
To this end, in 2001, a joint effort was undertaken between the freshwater industry associations from many provinces, the Society for Research and Development in Continental Aquaculture (SORDAC) Inc., the Québec Aquaculture Network (RAQ), and the Fisheries and Oceans Canada’s Office of the Commissioner for Aquaculture Development (OCAD). This group sought out the views and participation of the major players in the Canadian freshwater aquaculture sector regarding the problems and constraints faced by the industry. As a result of these discussions, the Inter-Provincial Collaborative Initiative for Sustainable Freshwater Aquaculture was formed. The Initiative’s objective is to bring together the key human resources of the Canadian freshwater aquaculture industry, including representatives from the provincial and federal governments, in order to address the issues and constraints facing the sector. The Initiative proposes an innovative approach by establishing partnerships with Canadian experts in order to carry out specific projects related to the issues voiced by the industry stakeholders. This approach represents an opportunity to create a concerted consensus on industry priorities, identify potential R&D and technology transfer expertise, seek out synergies between the various resources, and avoid duplicating efforts. This initiative warrants the support of all partners concerned about the sustainable development of freshwater aquaculture in this country.
References and Endnotes 1. Aquaculture Statistics 2002, Statistics
Canada. 2. Throughout the present document,
freshwater production and value do not include production of juvenile salmon (i.e. smolt).
3. Doyon, M., I. Charron, S. Julien and É. Gilbert. Value and Economic Impact of Freshwater Aquaculture in Canada: Current State (1999) and Potential for Development. Report prepared for the Office of the Commissioner for Aquaculture Development (OCAD). Ottawa, Ontario: 2001.
4. Stechey, D. and E. Gilbert. 2004. The scope and potential of aquaculture as a diversification strategy for traditional agriculture operations. Final Report. Prepared for Agriculture and Agri-Food Canada, Food Bureau and Office of the Commissioner for Aquaculture Development. 65 p.
5. Harvey, D.J. (2005). Aquaculture Outlook. USDA Economic Research Service, LDP-AQS-21.
6. Canadian Aquaculture Systems, Inc. (2003). Toward A Holistic Government Response in Canada’s Fisheries, Aquaculture and Seafood Processing Sectors. A report to the Seafood Value Chain Roundtable - Holistic Government Response Committee. Agriculture and Agri-Food Canada, Ottawa.
7. Please note: Since the Symposium was held in 2004, the Canadian Council of Fisheries and Aquaculture Ministers, through the work of its Task Group on Aquaculture, has begun addressing this issue by developing the Aquaculture Framework Agreement project, which aims to develop, among other things, a more effective governance framework for the Canadian aquaculture sector.

Proceedings of the Canadian Freshwater Aquaculture Symposium – Aquaculture Canada 2004
AAC Spec. Publ. No. 11 (2006) 21
U.S. National Technology-based Effluent Pollutant Control Requirements for Concentrated Aquatic Animal Production Marvin B. Rubin Engineering and Analysis Division, US EPA, 1200 Pennsylvania Ave., NW, Washington, DC 20460 The Clean Water Act (CWA) establishes a comprehensive program for protecting our nation’s waters. Among its core provisions, the CWA prohibits the discharge of pollutants from a point source to waters of the U.S. except as authorized by a National Pollutant Discharge Elimination System (NPDES) permit. The CWA also requires EPA to establish national technology-based effluent limitations guidelines and standards (effluent guidelines or ELGs) for different categories of sources, such as industrial, commercial and public sources of waters. Congress recognized that regulating only those sources that discharge effluent directly into the nation's waters may not be sufficient to achieve the CWA's goals. Consequently, the CWA also requires EPA to promulgate nationally applicable pretreatment standards that restrict pollutant discharges from facilities that discharge wastewater indirectly through sewers flowing to publicly-owned treatment works (POTWs). EPA issues national effluent limitations guidelines for three classes of pollutants: (1) conventional pollutants which are specifically identified in the Act or by regulation (i.e., total suspended solids (TSS), oil and grease, biochemical oxygen demand (BOD), fecal coliform and pH); (2) toxic pollutants which are identified based on the priority toxic listing in the Act (e.g., toxic metals such as chromium, lead, nickel and zinc; toxic organic pollutants such as benzene, benzo-a-pyrene, phenol and naphthalene); and (3) nonconventional pollutants which are all of the remaining pollutants. The technology-based effluent limitations guidelines and standards are established for categories of industrial dischargers and are based on the degree of control that can be achieved using various levels of pollution control technology and consideration of a number of factors. Overview The U.S. Congress passed the Federal Water Pollution Control Act (1972), also known as the Clean Water Act (CWA), to “restore and maintain the chemical, physical, and biological integrity of the Nation’s waters.” (33 USC. 1251(a)). The CWA establishes a comprehensive program for protecting our nation’s waters. Among its core provisions, the CWA prohibits the discharge of pollutants from a point source to waters of the US except as authorized by a National Pollutant Discharge Elimination System (NPDES) permit. The CWA also requires EPA to establish national technology-based effluent limitations guidelines and standards (effluent guidelines or ELGs) for different categories of sources, such as industrial, commercial and public sources of waters. Effluent guidelines are implemented when incorporated into an NPDES permit, and can include numeric and narrative limitations, including Best Management Practices, to control the discharge of pollutants from categories of point sources.
Congress recognized that regulating only those sources that discharge effluent directly into the nation's waters may not be sufficient to achieve the CWA's goals. Consequently, the CWA also requires EPA to promulgate nationally applicable pretreatment standards that restrict pollutant discharges from facilities that discharge wastewater indirectly through sewers flowing to publicly-owned treatment works (POTWs). (See Section 307(b) and (c), 33 USC. 1317(b) and (c)). National categorical pretreatment standards are established only for those pollutants in wastewater from indirect dischargers that may pass through, interfere with, or are otherwise incompatible with POTW operations. Generally, pretreatment standards are designed to ensure that wastewaters from direct and indirect industrial dischargers are subject to similar levels of treatment. In addition, POTWs must develop local treatment limits applicable to their industrial indirect dischargers. Any POTWs required to develop a pretreatment program must develop local limits to implement the general and specific national pretreatment standards. Other POTWs must develop local limits to ensure compliance with their NPDES permit for pollutants that result in pass through or interference at the POTW.

Proceedings of the Canadian Freshwater Aquaculture Symposium – Aquaculture Canada 2004
22 AAC Spec. Publ. No. 11 (2006)
(See 40 CFR 403.5). In the event of pass through that causes a violation of a POTW’s NPDES limit, the POTW must develop local limits for its users to ensure compliance with its permit. Direct dischargers must comply with effluent limitations in NPDES permits. Permit limits derived from the technology-based effluent limitations guidelines and new source performance standards promulgated by EPA, as well as occasionally from best professional judgment analyses are minimum requirements. Additional, or more stringent permit limits can also be derived from water quality standards on a site-specific basis. EPA issues national effluent limitations guidelines for three classes of pollutants: (1) conventional pollutants which are specifically identified in the Act or by regulation (i.e., total suspended solids (TSS), oil and grease, biochemical oxygen demand (BOD), fecal coliform and pH); (2) toxic pollutants which are identified based on the priority toxic listing in the Act (e.g., toxic metals such as chromium, lead, nickel and zinc; toxic organic pollutants such as benzene, benzo-a-pyrene, phenol and naphthalene); and (3) nonconventional pollutants which are all of the remaining pollutants. The technology-based effluent limitations guidelines and standards are established for categories of industrial dischargers and are based on the degree of control that can be achieved using various levels of pollution control technology and consideration of a number of factors which are described below: 1. Best Practicable Control Technology Currently Available (BPT) – Section 304(b)(1) of the CWA EPA may promulgate BPT effluent limits for conventional, toxic, and nonconventional pollutants. In specifying BPT, EPA looks at a number of factors. EPA first considers the cost of achieving effluent reductions in relation to the effluent reduction benefits. This primary factor is a cost per pound test that compares the estimated annualized cost to the pounds of pollutants removed. Historically, this test has resulted in a cost per pound range of less than $1 to approximately $40. The Agency is also required to consider the age of the equipment and facilities, the processes employed, engineering aspects of the control technologies, any required process changes, non-water quality environmental impacts (including
energy requirements), and such other factors as the Administrator deems appropriate. (See CWA 304(b)(1)(B)). Traditionally, EPA establishes BPT effluent limitations based on the average of the best performance of facilities within the industry, grouped to reflect various ages, sizes, processes, or other common characteristics. Where existing performance is uniformly inadequate, EPA may establish limitations based on higher levels of control than currently in place in an industrial category, if the Agency determines that the technology is available in another category or subcategory and can be practically applied. 2. Best Conventional Pollutant Control Technology (BCT) – Section 304(b)(4) of the CWA The 1977 amendments to the CWA required EPA to identify additional levels of effluent reduction for conventional pollutants associated with BCT technology for discharges from existing industrial point sources. In addition to other factors specified in Section 304(b)(4)(B), the CWA requires that EPA establish BCT limitations after consideration of a two-part "cost-reasonableness" test. EPA explained its methodology for the development of BCT limitations in July 1986 (51 FR 24974). The first part test is a comparison of the cost per pound of conventional pollutant removals for the BCT options with a $0.26 cost per pound (in 1976 Dollars) that represents POTW cost; the second test requires that the cost per pound does not exceed 1.4 times the cost of the category, or subcategory, determined to meet BPT requirements. Section 304(a)(4) designates the following as conventional pollutants: biochemical oxygen demand measured over five days (BOD5), TSS, fecal coliform, pH, and any additional pollutants defined by the Administrator as conventional. The Administrator designated oil and grease as an additional conventional pollutant on July 30, 1979 (44 FR 44501). 3. Best Available Technology Economically Achievable (BAT) – Section 304(b)(2) of the CWA In general, BAT effluent limitations guidelines represent the best economically achievable performance of facilities in the industrial subcategory or category. The CWA establishes BAT as a principal national means of controlling the direct discharge of toxic and nonconventional pollutants. The factors considered in assessing BAT, other than economic achievability, include
Proceedings of the Canadian Freshwater Aquaculture Symposium – Aquaculture Canada 2004
AAC Spec. Publ. No. 11 (2006) 23
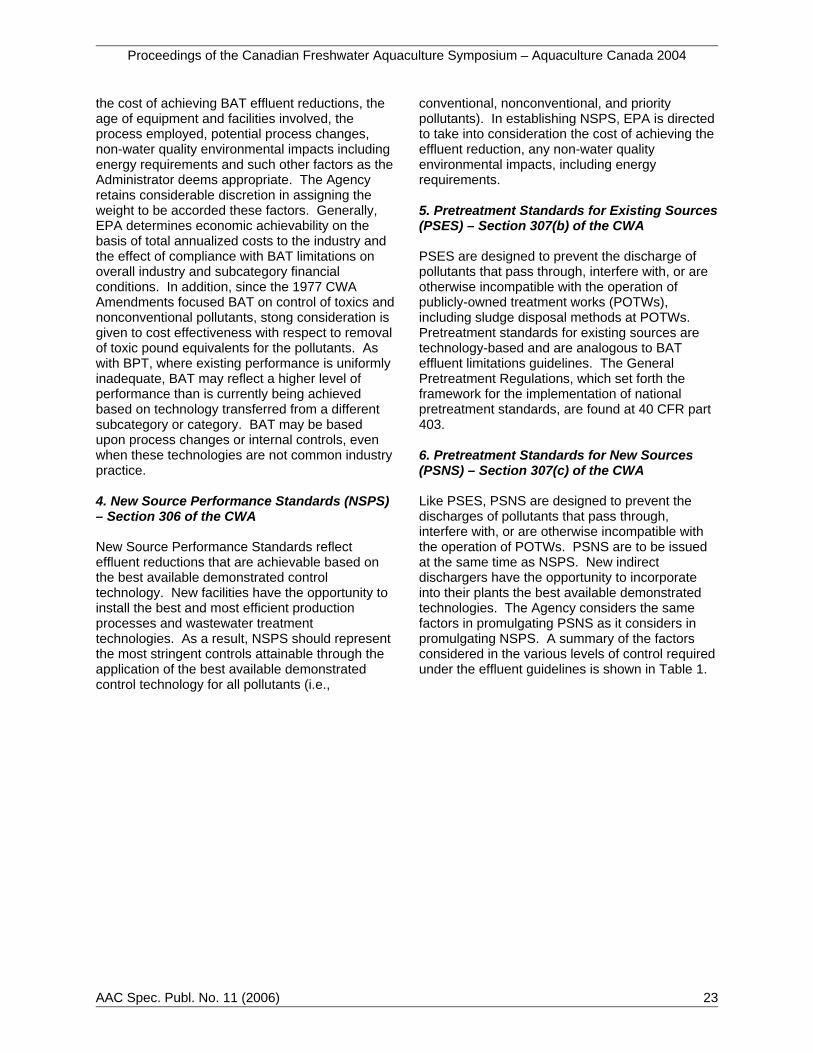
the cost of achieving BAT effluent reductions, the age of equipment and facilities involved, the process employed, potential process changes, non-water quality environmental impacts including energy requirements and such other factors as the Administrator deems appropriate. The Agency retains considerable discretion in assigning the weight to be accorded these factors. Generally, EPA determines economic achievability on the basis of total annualized costs to the industry and the effect of compliance with BAT limitations on overall industry and subcategory financial conditions. In addition, since the 1977 CWA Amendments focused BAT on control of toxics and nonconventional pollutants, stong consideration is given to cost effectiveness with respect to removal of toxic pound equivalents for the pollutants. As with BPT, where existing performance is uniformly inadequate, BAT may reflect a higher level of performance than is currently being achieved based on technology transferred from a different subcategory or category. BAT may be based upon process changes or internal controls, even when these technologies are not common industry practice. 4. New Source Performance Standards (NSPS) – Section 306 of the CWA New Source Performance Standards reflect effluent reductions that are achievable based on the best available demonstrated control technology. New facilities have the opportunity to install the best and most efficient production processes and wastewater treatment technologies. As a result, NSPS should represent the most stringent controls attainable through the application of the best available demonstrated control technology for all pollutants (i.e.,
conventional, nonconventional, and priority pollutants). In establishing NSPS, EPA is directed to take into consideration the cost of achieving the effluent reduction, any non-water quality environmental impacts, including energy requirements. 5. Pretreatment Standards for Existing Sources (PSES) – Section 307(b) of the CWA PSES are designed to prevent the discharge of pollutants that pass through, interfere with, or are otherwise incompatible with the operation of publicly-owned treatment works (POTWs), including sludge disposal methods at POTWs. Pretreatment standards for existing sources are technology-based and are analogous to BAT effluent limitations guidelines. The General Pretreatment Regulations, which set forth the framework for the implementation of national pretreatment standards, are found at 40 CFR part 403. 6. Pretreatment Standards for New Sources (PSNS) – Section 307(c) of the CWA Like PSES, PSNS are designed to prevent the discharges of pollutants that pass through, interfere with, or are otherwise incompatible with the operation of POTWs. PSNS are to be issued at the same time as NSPS. New indirect dischargers have the opportunity to incorporate into their plants the best available demonstrated technologies. The Agency considers the same factors in promulgating PSNS as it considers in promulgating NSPS. A summary of the factors considered in the various levels of control required under the effluent guidelines is shown in Table 1.

Proceedings of the Canadian Freshwater Aquaculture Symposium – Aquaculture Canada 2004
24 AAC Spec. Publ. No. 11 (2006)
Table 1: Levels of Control in Effluent Guidelines and Standards.
Level of Control Technology Considerations
Economic Considerations
Best Practicable Control Technology (BPT)
Average of best existing
Comparison of costs and effluent reduction benefits
Best Conventional Pollutant Control Technology (BCT)
Conventional pollutant reduction
Cost-reasonableness (two-part cost test)
Best Available Technology Economically Achievable (BAT)
Best available Economic achievability
New Source Performance Standards (NSPS)
Best demonstrated Consider costs
Pretreatment Standards for Existing Sources (PSES)
Analogous to BAT Economic achievability
Pretreatment Standards for New Sources (PSNS)
Analogous to NSPS Consider costs
NOTE: Other factors considered are the age of equipment and facilities, processes employed, engineering aspects of control technologies, non-water quality environmental impacts and such other factors as the Administrator deems appropriate. Concentrated Aquatic Animal Production Rule On August 23, 2004, the US EPA issued effluent limitations guidelines and standards for the Concentrated Aquatic Animal Production (CAAP) Point Source Category. The CAAP regulation applies to about 250 facilities that generate wastewater from aquatic animal production operations and discharge directly to waters of the United States. When implemented through NPDES permits, this final rule will help reduce discharges of conventional pollutants, mainly Total Suspended Solids (TSS), non-conventional pollutants such as nutrients, drugs and chemicals, and to a lesser extent toxic pollutants (metals and PCBs). To which Facilities does this Rule Apply? The final rule applies to direct discharges of wastewater from these existing and new facilities: • Facilities that produce at least 100,000 pounds
per year in flow-through and recirculating systems that discharge wastewater at least 30 days per year (used primarily to raise trout, salmon, hybrid stripped bass and tilapia); and
• Facilities that produce at least 100,000 pounds
per year of aquatic animals in net pens or submerged cage systems (used primarily to raise salmon).
What are the Impacts of the Regulation? EPA expects that, when the rule is implemented through National Pollutant Discharge Elimination System (NPDES) permits, the discharge of total suspended solids (TSS) will be reduced by more than 500,000 pounds per year and biochemical oxygen demand (BOD) and nutrients will be reduced by about 300,000 pounds per year. Water quality improvements will increase opportunities for swimming and fishing and will reduce stress on aquatic ecosystems. EPA estimates it will cost a total of about $1.4 million per year for all subject facilities to comply with this rule, and our analyses indicate that the affected entities can afford these costs. What does the Rule Require? The rule requires that all applicable facilities: • Prevent discharge of spilled drugs and
pesticides, and minimize excess feed discharges.
• Regularly maintain the production systems. • Keep records on numbers and weights of
aquatic animals, feed amounts, and frequency of cleaning, inspections, maintenance, and repairs.
• Train staff in spill prevention, spill response, and proper operation and maintenance of production and wastewater treatment systems.

Proceedings of the Canadian Freshwater Aquaculture Symposium – Aquaculture Canada 2004
AAC Spec. Publ. No. 11 (2006) 25
• Report the use of any drug that is an investigational new animal drug or is not used in accordance with label requirements.
• Report any failure of or damage to an aquatic animal containment system.
• Develop, maintain, and certify a Best Management Plan (BMP) that describes how to achieve the requirements.
For the flow through and recirculating discharge subcategory, the rule requires that these facilities also: • Minimize discharge of solids from sources
such as uneaten feed, settled solids, and animal mortalities.
• Regularly maintain the wastewater treatment systems.
For the open water systems subcategory, the rule requires that these facilities also: • Minimize the accumulation of uneaten feed
beneath the nets though active feed monitoring and management strategies.
• Collect and properly dispose of feed bags, packaging materials, waste rope, and netting.
• Minimize discharge associated with transporting or harvesting aquatic animals.
• Prevent discharge of aquatic animal carcasses.
How can I get Copies of the Rule or Additional Information? You can get electronic copies of the preamble, rule, and major supporting documents at the CAAP web page at: www.epa.gov/guide/aquaculture or in E-Docket at www.epa.gov/edocket. Once in the E-Docket system, select "search," then key in the CAAP docket identification number (OW-2002-0026).

Proceedings of the Canadian Freshwater Aquaculture Symposium – Aquaculture Canada 2004
26 AAC Spec. Publ. No. 11 (2006)
Freshwater Aquaculture in Denmark: A New Platform for Sustainable Growth Brian Thomsen Danish Aquaculture Association, Silkeborg, Denmark In 1989 a new legal framework was introduced for the Danish freshwater fish farms. The decision was right because there was a need for regulation, but the sector was weakly organized and the legislative powers had limited insight into aquaculture. A bad combination but a ministerial decree was enforced: Feed quotas were imposed on every fish farm. The quota could be increased if a farm invested in water treatment facilities and provided adequate documentation for its effectiveness. It never worked out. There was a huge gap between the farmers and the authority’s definition of “documentation”. For more than 10 years the parties argued. A number of farmers exceeded their feed quota. Lawsuits were common and at the end of the nineties communications were at best non-existent. Slowly but steadily the sector approached extinction. The sector had to change or die and the overall strategic approach was changed from confrontation to collaboration – and it paid off. A ministerial committee was established. All parties with a legitimate interest in the water streams were invited. The objective was to build a platform for sustainable growth. It took 18 months of hard work before the chairman could announce: “We have an agreement”. Introduction The paper discusses a new Danish platform for sustainable growth in freshwater aquaculture. An introduction is given to the European Union’s strategy for sustainable aquaculture. The Danish aquaculture sector used to be fragmented with many small associations. In a broader perspective the European Commission sees lack of organization as one of the sector’s weakest points. The issue has been discussed for many years in Denmark, but this year the sector succeeded in merging the major players into one strong association called “Dansk Akvakultur” (The Danish Aquaculture Association). The members are the major feed companies, the fish farmers and the processing companies. It is important to note that the sector now takes responsibility for the whole value chain as growth calls for actions all along the chain. European Aquaculture Aquaculture in the European Union (EU) can be divided into 3 major segments: Freshwater, molluscs and marine farming. The total value of the whole sector is approximately $4 billion Canadian Dollars (CAD). That is about one third the value of the total fishery production of the EU. The main species are trout and seabass/bream. The EU has skilled aquaculture scientists and good research facilities, which have contributed significantly to the growth of the sector. However,
in the last decade the annual growth rate of EU aquaculture (3.4 %) has been slower than the world average (11 %). In 1998 aquaculture in the EU employed at least 57,000 people full-time. Aquaculture has experienced a tremendous growth globally and the EU´s market share is now well below 2%. In that context the EU is a very small player. The EU Commission presented its proposal for an aquaculture strategy in late 2002 and it was subsequently adopted both by the European Parliament and the Council of Ministers. So for the first time ever, the European fish farmers now share a common vision: In ten years time aquaculture must reach the status of a stable industry which guarantees long term secure employment and development providing alternatives to the fishing industry, both in terms of products and employment. This requires that the sector must be economically viable, that it must be market driven, that the range of products must be enlarged and better marketing strategies also have to be implemented. The evolution of the European seafood market creates a good potential for farmed products, as they comply with the key requirements of the supermarkets: regularity of supply, availability and homogeneity of products. But there are serious challenges that have to be addressed.

Proceedings of the Canadian Freshwater Aquaculture Symposium – Aquaculture Canada 2004
AAC Spec. Publ. No. 11 (2006) 27
Many aquaculture branches have experienced falling market prices since the early 1990s. This stimulated productivity but additional improvements are difficult to achieve and the low profit margins leave few resources for investments in research, development, and marketing. Seafood is good for human health and it is, of course, essential that aquaculture products are hygienic and safe and that adequate measures are taken to ensure fish welfare. It is equally important that farmed products are not only acceptable to consumers in terms of price, quality and safety but also in terms of environmental cost. Aquaculture is often accused of producing negative environmental effects, although many of these are not scientifically substantiated. Finally there is a need for further investments in research, but the low profit margins makes this difficult. The strategy sets three key objectives: 1. To create long term secure employment; 2. To assure the availability to consumers of
products that are healthy, safe and of good quality, as well as promoting high animal health and welfare standards; and
3. To ensure, that the industry is environmentally sound.
The strategy should create 10,000 new jobs in 2003 - 2008 by increasing annual production growth rate to 4%, solving the conflicts for space, promoting market development and improving the governance. The EU supports aquaculture development via the Financial Instruments for Fishery Guidance. In relation to production increases aid should be restricted to either modernization of existing farms or to diversification measures. The conflicts for space should be solved by further development and use of water re-circulating systems in order to reduce water demand and to transfer farms to areas with less landscape value. The sector is encouraged to take advantage of the possibilities offered by existing EU schemes for product marketing and use official quality marks, but “the most important marketing measure that farmers should take is to further develop co-operatives, trade organizations, and producer’s organizations. These are essential
tools to prevent upheavals in supply as well as to compensate for the lack of economy of scale of small farms”. That is a key point to remember. From a Danish perspective it was very interesting to note, that the EU calls for the inclusion of broader consultations in the decision-making process and that stakeholder participation in policy planning should also be further developed. That was actually the fundamental issue in the Danish sectors strategy for building a new platform for freshwater aquaculture in Denmark. The principal question asked was: Is it possible to come up with a solution that links technology to production increase and how can it be ensured, that the solution will be accepted by all relevant parties? Before providing at least one answer a little bit of history is needed. Introducing Feed Quotas in Denmark 1989 was a milestone in the history of Danish trout farming due to the introduction of the fixed feed quota system. From 1989 farms were only allowed to use a certain fixed amount of feed per year. The size depended on several factors including past usage. The quota could be increased, if a farmer could prove that the subsequent production increase would not harm the environment, but that was a “mission impossible”. If a farmer did modernize his farm and applied for an increased feed quota, it would typically be rejected by the authorities; and if they did approve it, the NGOs would appeal it. The key word was “documentation.” In many cases it would take more than 10 years before a decision was finally taken. The farmers naturally became frustrated. Some trusted in their own logic and used more feed than allowed. They were taken to court and they lost. The farmers generally found, that a great injustice had been done. The farmers association followed a very aggressive policy and at the end of the 1990’s there was basically no communication between the sector and the authorities. Fish farming ended up with a very poor image and the key consequence was that politicians would not even consider touching fish farming. The situation caused the structural development to escalate and a number of farms were closed each year. Naturally the sector focused on optimizing the limiting factor: Feed and the feed conversion rate (FCR) improved from approximately 1.25 in 1989 to approximately 0.95 due to improvements in feed quality and better farm management. That
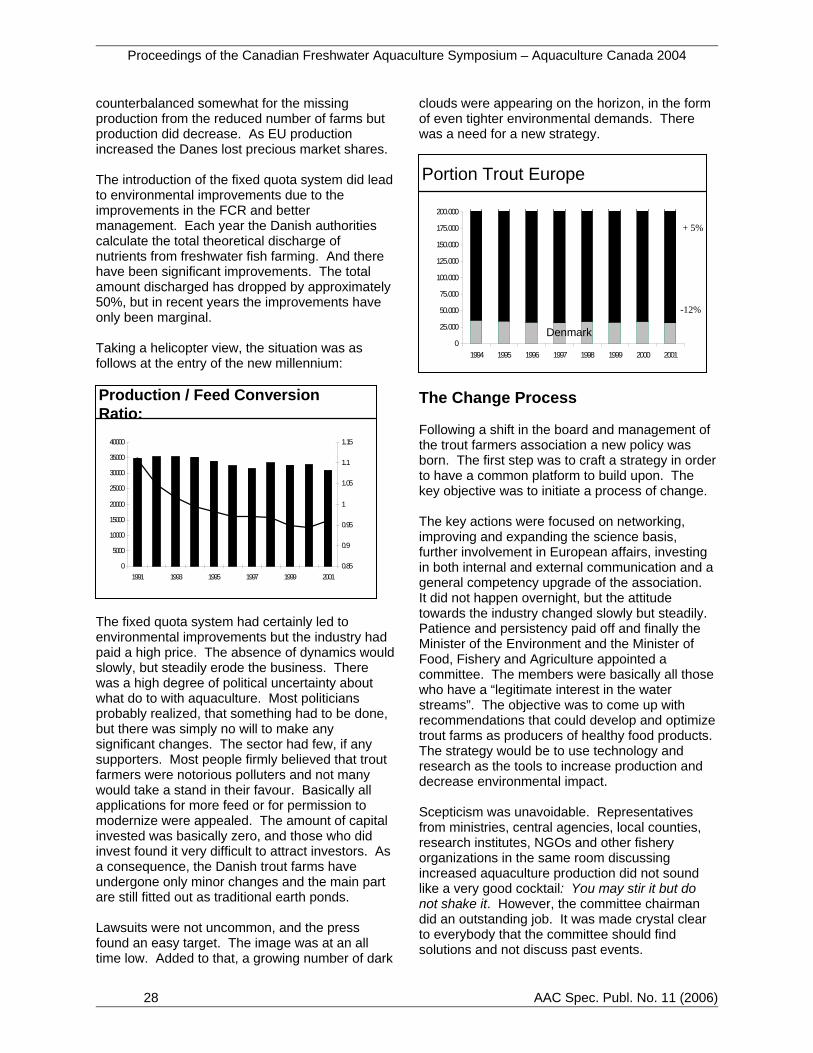
Proceedings of the Canadian Freshwater Aquaculture Symposium – Aquaculture Canada 2004
28 AAC Spec. Publ. No. 11 (2006)
counterbalanced somewhat for the missing production from the reduced number of farms but production did decrease. As EU production increased the Danes lost precious market shares. The introduction of the fixed quota system did lead to environmental improvements due to the improvements in the FCR and better management. Each year the Danish authorities calculate the total theoretical discharge of nutrients from freshwater fish farming. And there have been significant improvements. The total amount discharged has dropped by approximately 50%, but in recent years the improvements have only been marginal. Taking a helicopter view, the situation was as follows at the entry of the new millennium:
The fixed quota system had certainly led to environmental improvements but the industry had paid a high price. The absence of dynamics would slowly, but steadily erode the business. There was a high degree of political uncertainty about what do to with aquaculture. Most politicians probably realized, that something had to be done, but there was simply no will to make any significant changes. The sector had few, if any supporters. Most people firmly believed that trout farmers were notorious polluters and not many would take a stand in their favour. Basically all applications for more feed or for permission to modernize were appealed. The amount of capital invested was basically zero, and those who did invest found it very difficult to attract investors. As a consequence, the Danish trout farms have undergone only minor changes and the main part are still fitted out as traditional earth ponds. Lawsuits were not uncommon, and the press found an easy target. The image was at an all time low. Added to that, a growing number of dark
clouds were appearing on the horizon, in the form of even tighter environmental demands. There was a need for a new strategy.
The Change Process Following a shift in the board and management of the trout farmers association a new policy was born. The first step was to craft a strategy in order to have a common platform to build upon. The key objective was to initiate a process of change. The key actions were focused on networking, improving and expanding the science basis, further involvement in European affairs, investing in both internal and external communication and a general competency upgrade of the association. It did not happen overnight, but the attitude towards the industry changed slowly but steadily. Patience and persistency paid off and finally the Minister of the Environment and the Minister of Food, Fishery and Agriculture appointed a committee. The members were basically all those who have a “legitimate interest in the water streams”. The objective was to come up with recommendations that could develop and optimize trout farms as producers of healthy food products. The strategy would be to use technology and research as the tools to increase production and decrease environmental impact. Scepticism was unavoidable. Representatives from ministries, central agencies, local counties, research institutes, NGOs and other fishery organizations in the same room discussing increased aquaculture production did not sound like a very good cocktail: You may stir it but do not shake it. However, the committee chairman did an outstanding job. It was made crystal clear to everybody that the committee should find solutions and not discuss past events.
Production / Feed Conversion Ratio:
0
5000
10000
15000
20000
25000
30000
35000
40000
1991 1993 1995 1997 1999 20010.85
0.9
0.95
1
1.05
1.1
1.15
Portion Trout Europe
0
25.000
50.000
75.000
100.000
125.000
150.000
175.000
200.000
1994 1995 1996 1997 1998 1999 2000 2001
+ 5%
-12%
Denmark

Proceedings of the Canadian Freshwater Aquaculture Symposium – Aquaculture Canada 2004
AAC Spec. Publ. No. 11 (2006) 29
There were different opinions and agendas, but after 13 meetings and 14 months the chairman could tell the ministers that a unanimous committee had agreed upon a number of constructive and ambitious recommendations. In other words: we had a deal. A New Platform The committee rapidly agreed upon the key issues, which had to be addressed. Firstly, what system could combine the dual objective of increased production and reduced environmental impact? Secondly, the Danish approval system is very complicated and a more flexible device was needed in order to ensure the necessary dynamics. The concept of so called ‘model fish farms’ proved to be a viable compromise. When a farm is rebuilt or modernized the question of documentation always pops up: What is the water treatment efficiency? That question has been asked many times, but the farmer and the approving authority seldom had the same answer. A sub group worked for months with the design of the model fish farms and the corresponding documentation. The concept actually builds upon a “win/win/win” concept. The environment benefits from reduced water intake and reduced discharge. The authorities win because they have a blue print to approve and they need not evaluate a number of different ideas and concepts. Finally, the farmer wins because the system rewards performance through a higher feed quota. Three different types of model farms were designed ranging from extensive to intensive farming. The formula is remarkably simply, but it took a long time and many discussions before an agreement was reached. Basically, it assumes discharge neutrality. In each case, the amount of feed is calculated for organic matter, phosphorous and nitrogen and the lowest value is then used. RT is the water treatment efficiency rate for a traditional fish farm. They are predefined in the before mentioned 1989 legislation. RM is the water treatment efficiency rate for the corresponding model farm. It is basically calculated by dividing net discharge with the theoretical production discharge. But the key problem was once again lack of documentation for treatment efficiency. It turned out that nitrogen was the limiting factor because evidence for nitrogen removal is basically non-
existent. Consequently, only minor feed increases were allowed. If a traditional fish farm is rebuilt to a type 2 model fish farm the amount of feed is only increased by 10 tons per 100 initial feed. Despite the fact that it is equipped with sludge traps, micro sieves, contact filter, bio filter and uses only 60 l/sec of new water per 100 tons fish production. It was estimated, that the investment needed for rebuilding to a type 2 would be somewhere between $0.5 – 1.0 million CAD. It is evident that an extra 10 tons is not economically viable. However, if the next limiting parameter, which is phosphorous, could be used that would help the situation somewhat.
It was finally decided politically to test the performance in a real size trial in which a number of farms would be allowed to operate with phosphorous as the limiting factor for a trial period of 2 years. Within that period, a monitoring program should provide more documentation about the efficiency and the actual emissions. And there is much to win. If the water treatment removal rate for nitrogen is for example 35%, the feed quota can be increased by a factor of 1.4. However, if the rate is 70% it can increase by a factor of 3. Marginal improvements are therefore very interesting, and it should motivate for further developments. Investing in a model fish farm is a risky business because there are a number of “Do not knows”. If the farm is not as efficient as anticipated the feed quota will be reduced. There is only little know-how about how to prevent and treat fish diseases in re-circulated systems, how to ensure fish quality and general farm management issues.
Feed =100 - RT (BI5, P, N)100 - RM (BI5, P, N) * 100
RM Treatment efficiency rates model farms RT Treatment efficiency rates traditional fish farm

Proceedings of the Canadian Freshwater Aquaculture Symposium – Aquaculture Canada 2004
30 AAC Spec. Publ. No. 11 (2006)
Currently 8 farms are participating in the trial. The total investment is approximately $12 million CAD and the farms are allowed to double their current production from 1,600 to 3,200 tons. Two major projects will support the trial. The first one is the monitoring project. Not only input and output will be monitored, but also the efficiency of the individual treatment facilities. Hence the cost is pretty high, around $6.5 million CAD. The second project is a master management project which is aiming at getting more know-how about veterinary aspects, general management and the use of more efficient IT systems. This project still awaits approval. In conclusion, we are convinced, that the model fish farms will perform much better than anticipated, and that we now have both the political and technical framework for a new flexible regulation mechanism that rewards investments in new technology. It is difficult to forecast the long term effects. There are yet many questions to be answered, but we certainly expect, that our production will increase. This forces us to invest also in the marketing side. We need to develop both new markets and new products to ensure market stability. Growth is, whether we like it or not, both market and production drive.
Proceedings of the Canadian Freshwater Aquaculture Symposium – Aquaculture Canada 2004
AAC Spec. Publ. No. 11 (2006) 31
Environmental Regulation of Freshwater Aquaculture in Canada Daniel Stecheya and Jan Linquistb aCanadian Aquaculture Systems, Inc., 1076 Tillison Avenue, Cobourg, ON bN.A.R. Environmental Consultants, Inc., 1130 Southlane Road, Sudbury, ON P3G 1N6 Freshwater aquaculture operations exist in all ten Canadian provinces and in the Yukon Territory and encompass a wide scope in scale of operations. Ranging from small “mom and pop” facilities to large land-based farms and open water cage culture systems, the commercial nature of fish farming requires the intensive utilization of water, space and feed, and generates metabolic by-products that may potentially have an adverse effect on the surrounding environment. Consequently, to manage the development of aquaculture in a sustainable manner, most jurisdictions have specific policies and/or regulations pertaining to the environmental management of the sector. The regulatory management frameworks of several leading Canadian provinces are presented and compared with those of several US States and European countries.
Introduction Governments in leading western aquaculture nations have introduced various regulatory and non-regulatory measures to minimize the potential environmental impacts of intensive aquaculture. Tacon and Forster (1) note that several measures have been designed to address multiple aspects of aquaculture environmental interaction, including: • Requiring the treatment of farm effluents prior
to discharge, through the use of settlement basins, specific filtration devices, waste water treatment systems, etc.;
• Limiting the concentration of specific dissolved/suspended inorganic/organic materials and/or nutrients contained within the effluent discharged from the farm;
• Establishing maximum permissible amounts of specific nutrients (such as total nitrogen or phosphorus) that the farm is able to discharge over a fixed time period;
• Limiting the total number of licenses that can be issued and/or size of farm, depending upon the vicinity of other farming operations and the assimilative environmental carrying capacity of the receiving aquatic ecosystem;
• Limiting or fixing the total quantity of feed the farm is able to use over a fixed time period;
• Fixing maximum permissible specific nutrient levels within the compound feeds to be used to rear the species in question;
• Banning the use of specific potentially high-
risk feed items such as fresh/trash fish and invertebrates;
• Banning the use of certain chemicals on-farm, including specific chemical therapeutic agents, drugs and chemicals (i.e., potentially toxic herbicides and pesticides, etc.);
• Prescribing minimum feed performance criteria, such as specific levels of allowable dust/fines, feed efficiency or nutrient digestibility;
• Requiring the use of specific Codes of Conduct, including appropriate Good/Better/Best Management Practices for farm operations, including feed manufacture and use, and environmental management;
• Requiring the development of suitable farm/pond sediment management strategies for the storage and disposal of sediments; and/or
• Requiring the implementation of an environmental monitoring program.
Aquaculture regulation in eleven European Union nations is summarized in Table 1. For comparative purposes, the regulatory approach governing land-based operations in Ontario and Québec is also presented in Table 1. Notably, Denmark has the most stringent aquaculture regulations while Spain, Portugal and Belgium have the most lenient. Restrictions in the amount of nutrients (namely N and P) released from fish farms and the requirements to treat effluent before discharge are the most prevalent regulatory controls applied in these jurisdictions.

Proceedings of the Canadian Freshwater Aquaculture Symposium – Aquaculture Canada 2004
32 AAC Spec. Publ. No. 11 (2006)
Table 1: Aquacultural environmental legislation in several European Union nations with comparative reference to land-based operations in Ontario. (Source: Tacon and Forster 2003; Ontario and Québec information added) Aquaculture regulations pertaining to freshwater aquaculture in Canada have been reviewed in seven provincial jurisdictions – British Columbia, Saskatchewan, Ontario, Québec, Prince Edward Island, New Brunswick and Nova Scotia. The regulatory framework in each jurisdiction is discussed separately in the following sections. British Columbia BC’s Fisheries Act – Aquaculture Regulation requires all fish farms in the province to be licensed, thereby imposing conditions pertaining to operational standards, record-keeping and reporting. Aquaculture effluent is specifically regulated under the BC Waste Management Act – Land-Based Finfish Waste Control Regulation. The latter requires operators of land based finfish ventures to submit a receiving water quality report prior to the initiation of construction (or expansion exceeding 20% of current capacity) for all ventures in which the effluent stream has a dilution ratio in the receiver of less than 20 to 1 (2). Receiving water quality reports are not generally required where the dilution ratio exceeds 20 to 1. The receiving water quality report is to identify the potential effect of aquaculture operations with regard to hydraulics, nutrient loading (TAN, TP) and eutrophication of receiving waters and any anticipated changes in temperature or dissolved oxygen level. Additionally, if requested, fish farm
operators must prepare and submit a written waste management plan. Effluent standards specified in the BC Land-Based Finfish Waste Control Regulation are presented in Table 2. Table 2: Aquaculture effluent standards prescribed by the BC Land-Based Finfish Waste Control Regulation. Parameter Dilution
< 20:1 Dilution > 20:1
TSS (mg/L) 10 20 TP (mg/L)* 0.1 0.2 Chlorine (mg/L)
0 0
*TP limits may be more or less stringent on a site-specific basis Saskatchewan The SK Watershed Authority, under the Saskatchewan Watershed Authority Act and Regulations, issues Water Rights Licences authorizing access to ground water and surface waters for commercial purposes, including aquaculture. The provincial Environmental Management and Protection Act specifies that “no person shall discharge or allow the discharge of a substance into the environment in an amount, concentration or level or at a rate of release that
CountryEIA
RequiredLimit on
ProductionLimitations on N &/or P
Dietary Contents
Maximum FCR
Water Treatment
Belgium N N N N N NDenmark N Y Y Y Y YGermany N N Y N N NGreece Y N N N N NSpain N N N N N NFrance Y Y N N N NIreland Y Y Y N N Y/NItaly Y/N N Y N N NNetherlands N N Y N N Y/NPortugal N N N N N NUK—England and Wales N N Y N N Y/NUK—Scotland N Y Y N N Y/NQuébec Y Y Y N N YOntario - Land-Based N N Y N N Y
EIA = Environmental Impact Assessment Y = YesFCR = Feed Conversion Ratio N = No

Proceedings of the Canadian Freshwater Aquaculture Symposium – Aquaculture Canada 2004
AAC Spec. Publ. No. 11 (2006) 33
may cause or is causing an adverse effect unless otherwise expressly authorized”. Adversity is governed in accordance with the provincial Surface Water Quality Objectives, which state that "nitrogen or phosphorus or other nutrient concentrations should not be altered from natural levels by discharges of effluents such that nuisance growths of algae or aquatic weeds result". To date, aquaculture operations have not impaired the water quality in receivers over background (ambient) levels nor have they resulted in nuisance growths of algae or aquatic plants (3). Ontario The Ontario Ministry of Natural Resources (OMNR) administers the Fish and Wildlife Conservation Act (FWCA), the Public Lands Act (PLA) and portions of the Fisheries Act (Canada) to manage Ontario’s natural resources and the ecologically sustainable development of aquaculture in the public interest. Section 47 of the FWCA requires that all fish culture operations (4) obtain an Aquaculture Licence authorizing the culture and sale of eligible fish species for human consumption, stocking, use as bait and fee-for-fishing operations. The licence is valid only for the location(s) and species named. The FWCA also enables OMNR to attach conditions to the licence for the purposes of refining the intent, scope or limitations of fish culture activities. The OMNR may refuse to issue an aquaculture licence if such a decision is deemed to be in the best interests for the conservation and management of fish. Similarly, the FWCA also enables the Minister to cancel a licence in situations where the cancellation is reasonably necessary for the conservation and management of fish, providing that enforcement of regulations and licence conditions has been ineffective in remedying the problem. Prior to launching an aquaculture operation in Ontario, additional approvals may be required from other local and regional authorities (e.g. a Conservation Authority regarding construction in flood plains; a Municipality regarding zoning; the Canada Coast Guard regarding possible navigation hazards at cage sites). Beyond obtaining an aquaculture licence, Ontario has two processes governing the use of public waters and the management of nutrient by-products released from aquaculture – one for land-
based ventures and another for cage culture operations. Land-Based Operations The Ministry of Environment (MOE) regulates effluents discharged to surface and ground waters under the Ontario Water Resources Act (OWRA), which specifies in Section 53(1) that “No person shall establish, alter, extend or replace new or existing sewage works except under and in accordance with an approval granted by a Director.” The Act requires all producers to obtain a Certificate of Approval (CofA) prior to commencement of construction activities. The CofA governs the design and operation of works for the treatment of effluent prior to discharge from a facility; hence, the use of in-raceway settling areas, off-line settling basins, mechanical filtration, etc. are governed by the CofA. A typical CofA includes a description of the licensed treatment work(s), the production capacity of the facility, and specifies terms for establishing a monitoring program, reporting requirements and compliance criteria. All new or amended CofA applications with effluent standards have been subject to a public comment period according to the Environmental Bill of Rights (EBR). In accordance with the Interim Environmental Guidelines for Salmonid Aquaculture Facilities in Ontario, a CofA for a land-based fish farm typically requires that effluent treatment facilities be designed to produce a concentration in the final effluent of 5 mg/L TSS above the background levels in the source water and 0.05 mg/L TP. Compliance, however, is based on TSS in the final effluent not exceeding background plus 10 mg/L and TP not exceeding 0.1 mg/L. The guiding principle in this approach is the efficient and effective removal of solid wastes from the rearing areas (process water) to a non-discharging sludge-holding facility to maintain water quality suitable for discharge. There is no limit on the time period for which a CofA is valid provided that there are no material changes to operations or treatment systems. Certificates of Approval typically specify monitoring and reporting requirements, including: • Measuring the concentration of TSS and TP in
influent and effluent water measured once per month at the farm intake (source water) and at the point of discharge (end-of-pipe);
• Recording monthly feed use (tonnage);

Proceedings of the Canadian Freshwater Aquaculture Symposium – Aquaculture Canada 2004
34 AAC Spec. Publ. No. 11 (2006)
• Recording the frequency of cleaning in-line and off-line settling and manure storage facilities;
• When applicable, outlining the nature of mitigation measures taken to correct water quality and/or manure management problems; and
• Preparing and submitting an annual report to the Ministry of Environment regarding the above monitoring measures.
All land-based facilities that utilize in excess of 50,000 litres of water on any given day (approx. 35 Lpm continuous flow) from either a surface or ground water source require a Permit to Take Water (PTTW) from MOE. Commencing in 2005, all PTTW issued in the province will include a reporting requirement specifying the actual amount of water taken. Cage Culture Operations An Aquaculture Licence governing the culture and sale of fish is required from the Ontario Ministry of Natural Resources. Under the authority of the Public Lands Act, OMNR utilizes the Land Use Permit (LUP) as the legal instrument to give site tenure for operations that are on Crown land (e.g. cage culture in the Great Lakes). OMNR has a responsibility to ensure that public lands are used wisely and an obligation to the taxpayers of the province to receive fair compensation for use of a Crown resource. Prior to authorizing LUPs and licences, therefore, provincial staff are required to determine whether or not the proposed activity may have significant adverse effects on the environment and, where a significant effect or public concern is anticipated, to provide public notice. Aquaculture licences involving a land tenure document issued under the Public Lands Act must follow the direction set out in the “Class Environmental Assessment for Resource Stewardship and Facility Development Projects” for disposition of rights to Crown resources under the Environmental Assessment (EA) Act. Both the aquaculture licence and LUP are typically valid for a period of five years. Historically, cage culture operations in Ontario were required to obtain a Certificate of Approval from MOE. In the mid-1990s, however, it was determined that the CofA instrument was inapplicable to cage culture since there is no sewage works for collection or treatment of wastes.
Cage culture operations are largely regulated via the OMNR’s Aquaculture Licence, which specifies operating, monitoring and reporting requirements with respect to escapement, transfers, disease and water quality monitoring. “It is a condition of an aquaculture licence that authorizes aquaculture involving the use of a cage on public lands that the holder test and at all times maintain water quality as required in the licence and, where required, report on water quality to the Minister” (O. Reg. 664/98, s. 21 (2)). The MOE works closely with the OMNR on the required licence conditions for environmental protection, such as water quality monitoring. Generally, water quality must be monitored at designated sampling stations around the perimeter of the licensed area and at up-current and down-current reference sites in the Spring and Fall and throughout the open-water season. The parameters to be monitored include TP, clarity and dissolved oxygen. Median TP concentrations must not exceed 10 µg/L (0.01 mg/L) in Lake Huron and Georgian Bay and dissolved oxygen levels must be maintained above 54% saturation throughout the water column. Water clarity at the near cage stations should not be more than 10 % less than the reference stations. Under the terms of the aquaculture licence, cage culture operations are also required to: • Abide by a maximum specified production
capacity; • Submit an annual water quality monitoring
report to the Ministry; and • Complete a sediment sampling program in the
year prior to licence renewal. Failure to meet these criteria could result in a reduction in the allowable production in the subsequent year and the implementation of additional monitoring requirements. Québec The quality of effluent discharged from land-based fish culture operations in Québec is regulated under the general provisions of Québec’s Environmental Quality Act and is consistent with the regulation of all industries in Québec. As in BC, effluent quality in QC is governed using a dilution model based on the annual mean flow rate of the fish farm effluent, the lowest flow rate of the receiving river or stream (the 2-year return period 7-day low flow), the ambient concentrations of the
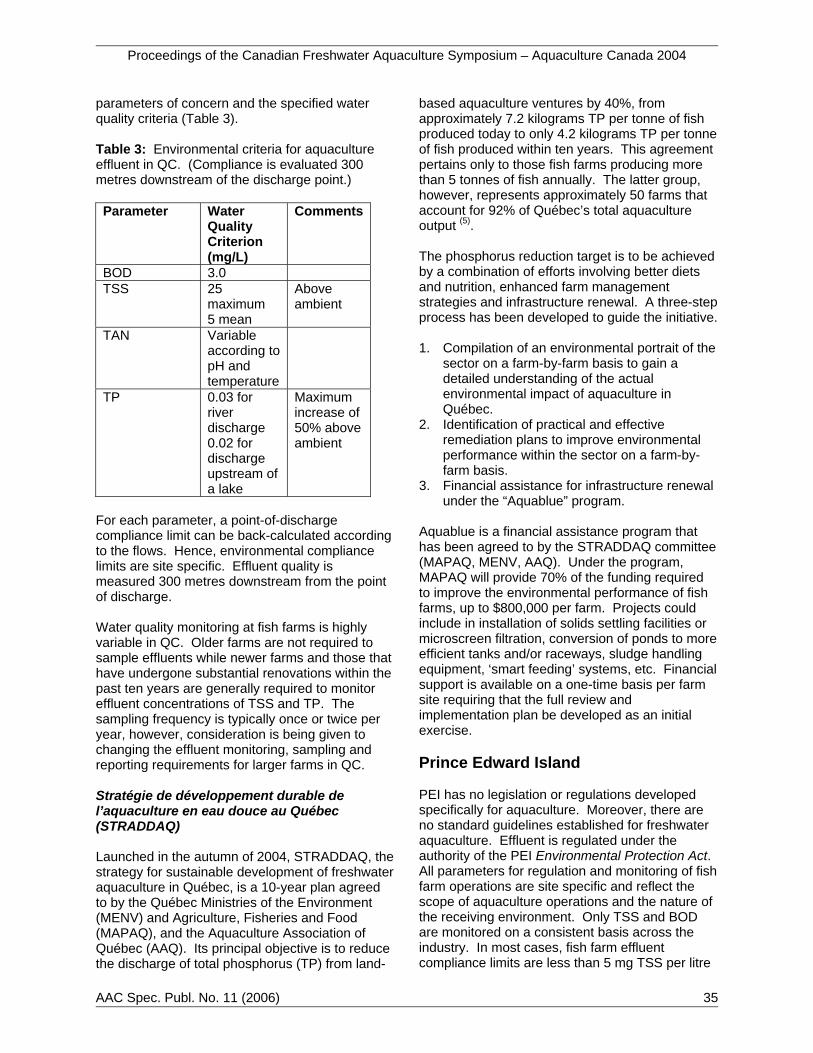
Proceedings of the Canadian Freshwater Aquaculture Symposium – Aquaculture Canada 2004
AAC Spec. Publ. No. 11 (2006) 35
parameters of concern and the specified water quality criteria (Table 3). Table 3: Environmental criteria for aquaculture effluent in QC. (Compliance is evaluated 300 metres downstream of the discharge point.) Parameter Water
Quality Criterion (mg/L)
Comments
BOD 3.0 TSS 25
maximum 5 mean
Above ambient
TAN Variable according to pH and temperature
TP 0.03 for river discharge 0.02 for discharge upstream of a lake
Maximum increase of 50% above ambient
For each parameter, a point-of-discharge compliance limit can be back-calculated according to the flows. Hence, environmental compliance limits are site specific. Effluent quality is measured 300 metres downstream from the point of discharge. Water quality monitoring at fish farms is highly variable in QC. Older farms are not required to sample effluents while newer farms and those that have undergone substantial renovations within the past ten years are generally required to monitor effluent concentrations of TSS and TP. The sampling frequency is typically once or twice per year, however, consideration is being given to changing the effluent monitoring, sampling and reporting requirements for larger farms in QC. Stratégie de développement durable de l’aquaculture en eau douce au Québec (STRADDAQ) Launched in the autumn of 2004, STRADDAQ, the strategy for sustainable development of freshwater aquaculture in Québec, is a 10-year plan agreed to by the Québec Ministries of the Environment (MENV) and Agriculture, Fisheries and Food (MAPAQ), and the Aquaculture Association of Québec (AAQ). Its principal objective is to reduce the discharge of total phosphorus (TP) from land-
based aquaculture ventures by 40%, from approximately 7.2 kilograms TP per tonne of fish produced today to only 4.2 kilograms TP per tonne of fish produced within ten years. This agreement pertains only to those fish farms producing more than 5 tonnes of fish annually. The latter group, however, represents approximately 50 farms that account for 92% of Québec’s total aquaculture output (5). The phosphorus reduction target is to be achieved by a combination of efforts involving better diets and nutrition, enhanced farm management strategies and infrastructure renewal. A three-step process has been developed to guide the initiative. 1. Compilation of an environmental portrait of the
sector on a farm-by-farm basis to gain a detailed understanding of the actual environmental impact of aquaculture in Québec.
2. Identification of practical and effective remediation plans to improve environmental performance within the sector on a farm-by-farm basis.
3. Financial assistance for infrastructure renewal under the “Aquablue” program.
Aquablue is a financial assistance program that has been agreed to by the STRADDAQ committee (MAPAQ, MENV, AAQ). Under the program, MAPAQ will provide 70% of the funding required to improve the environmental performance of fish farms, up to $800,000 per farm. Projects could include in installation of solids settling facilities or microscreen filtration, conversion of ponds to more efficient tanks and/or raceways, sludge handling equipment, ‘smart feeding’ systems, etc. Financial support is available on a one-time basis per farm site requiring that the full review and implementation plan be developed as an initial exercise. Prince Edward Island PEI has no legislation or regulations developed specifically for aquaculture. Moreover, there are no standard guidelines established for freshwater aquaculture. Effluent is regulated under the authority of the PEI Environmental Protection Act. All parameters for regulation and monitoring of fish farm operations are site specific and reflect the scope of aquaculture operations and the nature of the receiving environment. Only TSS and BOD are monitored on a consistent basis across the industry. In most cases, fish farm effluent compliance limits are less than 5 mg TSS per litre

Proceedings of the Canadian Freshwater Aquaculture Symposium – Aquaculture Canada 2004
36 AAC Spec. Publ. No. 11 (2006)
and less than 10 mg BOD per litre. Some facilities are required to monitor pH (between 6.5 and 8.0), ammonia (< 1.0 mg/L) and TKN (<10% increase over ambient). Phosphorus is not a parameter of concern due to the very nominal contribution of phosphorus to the watershed from aquaculture ventures in comparison to that from agricultural runoff. Monitoring is usually required 3 to 4 times per year and one period is to coincide with the time of heaviest feeding. New Brunswick Although there are trout farms in New Brunswick, freshwater aquaculture in the province is dominated by the production of Atlantic salmon smolts for transfer to marine cage culture operations. Historically, New Brunswick’s environmental management regime was similar to that applied in Ontario and in 1990 compliance limits of 5 mg TSS per litre and 0.05 mg TP per litre were the basis of this model. In recent years, however, the majority of the industry implemented recirculation technologies (only two hatcheries remain as flow-through facilities) to conserve water and improve productivity. In recirculation systems, water conservation measures serve to concentrate the metabolic wastes and, therefore, although the total daily mass load (TDML) of nutrients remains unchanged, their concentration in discharged effluent increased 10-fold or more. Hence, historical compliance limits were inappropriate. A review of monitoring and performance records by the NB Department of Environment suggested that the freshwater aquaculture sector had presented no serious challenges to water quality in receiving streams, rivers or lakes. Moreover, the review examined standard industry monitoring reports and concluded that non-compliance with the TSS standard was rare. Therefore, the NB Department of Environment amended its discharge standard for freshwater fish culture facilities. The current standard requires that fish culture operations not generate a TP concentration in excess of 0.03 mg/L measured 100 metres below the farm discharge (6). This allows for a suitable mixing zone to accommodate recirculation technologies. Phosphorus is the only parameter observed. Monitoring is largely site specific, based on historical performance. Sampling periods may be as frequent as every two weeks (generally in late summer and early autumn) at facilities where the
dilution factor is not significant to as little as twice annually. Nova Scotia Freshwater aquaculture in Nova Scotia consists of the production of trout for food fish and stocking and production of Atlantic salmon smolts for transfer to marine grow-out operations. Nova Scotia’s Environment Act (1994-1995) stipulates that provincial approvals are required for the “installation or maintenance of fishing equipment, a fishway, a counting fence, a fish habitat improvement structure, an aquaculture cage or any similar structure in a watercourse” and for the “construction, operation or reclamation of a commercial, land-based aquaculture facility” (7). Other requirements governing freshwater aquaculture include: • A preference for the use of water recirculation
technologies to conserve water and facilitate waste removal;
• The required use of appropriately designed and managed waste management systems;
• Application of more extensive waste treatment technologies when necessary in accordance with the assimilative capacity of receiving waters; and
• The disposal of waste solids (manure), filter backwash or other residuals in an approved manner.
Effluent discharge limits restrict the release of total phosphorus in concentrations that exceed 0.03 mg/L at a location 100 meters downstream from the point of discharge. Additionally, the chlorophyll α content of the receiver cannot exceed 300 g/m2 (by weight). Both discharge limits are based on minimum low flow conditions in the receiver. The latter is defined as the seven consecutive day average low stream flow occurring once in 20 years. Effluent quality guidelines for total suspended solids, Secchi depth, pH, dissolved oxygen, ammonia and nitrate shall comply with Canadian Water Quality Guidelines for aquatic life protection or with natural background levels. In cases where the aquaculture effluent is discharged into a stream with a lake located downstream the net annual load of TP (effluent minus background) cannot exceed the assimilative capacity of the downstream water body. Nova Scotia’s water quality monitoring and reporting requirements are extensive (Table 4).

Proceedings of the Canadian Freshwater Aquaculture Symposium – Aquaculture Canada 2004
AAC Spec. Publ. No. 11 (2006) 37
Table 4: Monitoring requirements at Nova Scotia aquaculture operations.
Summary of Freshwater Aquaculture Regulations in Canada The policy and regulatory approach for governing freshwater aquaculture in seven Canadian provinces is summarized in Table 5. This review has identified several common features; namely: • The discharge of phosphorus is regulated in
almost all jurisdictions and generally within the boundaries of the provincial water quality objectives;
• Discharge limits for suspended particulate material are also common;
• Other parameters (e.g. TAN, chemicals, BOD) are infrequently monitored and are usually site-specific requirements;
• 5 provinces monitor compliance down-stream in the mixing zone rather than at the end-of-pipe;
• Monitoring and reporting requirements are highly variable; and
• Incentive-based ‘smart’ regulatory and non-regulatory initiatives have yet to be incorporated into the regulatory frameworks.
References and Endnotes 1. Tacon AGJ, Forster, IP. 2003. Aquafeeds and
the environment: policy implications. Aquaculture (226):181–189.
2. BC Regulation defines “dilution ratio” by dividing the best estimate of the 10-year return period 7-day low flow in the receiving stream by the maximum 7 day average effluent flow, where: (a) the 10-year return period 7-day low flow is the magnitude of flow such that the average flow for 7 consecutive days is expected to be less than this magnitude once in any 10 year period, based on statistical analysis of observed stream flow, and (b) if sufficient data is not available to calculate the 10-year return period 7-day low flow or the discharge is to a lake, the dilution ratio must be calculated using a method and data that are to the satisfaction of the manager. (Source: BC Reg 68/94 OC 276/94)
3. Personal Communication – Richard Zitta, Environmental Sciences Section, Environmental Protection Branch, Saskatchewan Environment.
Station Parameter Time Period Frequency Method1,2,3 TP, Jan1 - Dec 31 W eekly Composite
Temp/ DO (7 daily grab samples)
1,2,3 TSS Jan1 - Dec 31 Monthy Grab
4,5 TP,TSS, May1 - Nov30 Monthly Grab Temp/ DO
3,5 TP, TSS, pH, Temp Ist week of Quarterly GrabDO, TN, NH3, NO3 Jan, Apr, July, Oct
4,5 periphytin/macrophyte 3rd week of Aug Twice / year See Note 1 (dry weight chlorophyll α) 2nd week of Sept
1,3,5 Full General Analysis, Low flow period (Fall) Twice / year GrabMetal Scan, TSS, High flow period (Spring)TP, TN, DO, Temp
Notes:1)
2) 3)
Stations:12345
Effluent (pre-treatment)Effluent (post-treatment)Receiving stream (immediately u/s but outside influence of discharge)Receiving stream (100 meters d/s of discharge unless altered by an administrator)
Periphytin /macrophtyte stations are to be established at 1/4 and 3/4 of the stream width. Samples to be taken in accordance with protocol acceptable to NSDEL. Sampling for chlorophyll α concentrations in receiving water may be required at discretion of administrator. Sampling dates at all stations are to coincide were possible.Total P to be analysed at detection limit of 1ug/l or less and reported as P.
Source water

Proceedings of the Canadian Freshwater Aquaculture Symposium – Aquaculture Canada 2004
38 AAC Spec. Publ. No. 11 (2006)
4. Certain exemptions exist, such as for the aquarium industry.
5. STRADDAQ. 2003. Stratégie de développement durable de l’aquaculture en eau douce au Québec. Table Filière de L’aquaculture en Eau Douce Du Québec et le Ministère De L’environnement Du Québec. 21 p.
6. Personal Communication - Greg Shanks, NB Department of Environment.
7. Nova Scotia Department of Environment and Labour. 2002. Guidelines for siting and operation of commercial land-based aquaculture facilities. Draft - May 16, 2002. 22 p.

Proceedings of the Canadian Freshwater Aquaculture Symposium – Aquaculture Canada 2004
AAC Spec. Publ. No. 11 (2006) 39
Tabl
e 5:
S
umm
ary
of e
nvi
ronm
enta
l reg
ulat
ory
fram
ew
ork
s fo
r fre
shw
ater
aqu
acul
ture
in s
eve
n C
anad
ian
pro
vinc
es.
U
nles
s no
ted,
the
gui
delin
es
appl
y to
lan
d-ba
sed
faci
litie
s.
BC
S
K
QC
N
B
PEI
N
S
ON
- L
and
ON
- C
ages
Yes
No
Yes
Yes
No
Yes
No
No
TSS
(mg/
L)
10-2
0 10
M
ean:
5
na
5 si
te s
peci
fic
10
na
Ma
x: 2
5 >
back
grou
nd
TP (m
g/L)
0.
1-0.
2 N
o nu
isan
ce
alga
e 0.
02 -
0.03
0.
03
na
0.03
0.
1 <P
WQ
O
(0.0
1 - 0
.02)
B
OD
(mg/
L)
na
5 3
na
10
na
na
na
TAN
na
na
va
riabl
e na
<1
0%
site
spe
cific
na
na
C
hem
ical
s / O
ther
>9
6hr L
C 20
1/10
0 96
hr L
C 50
na
na
site
spe
cific
na
na
DO
>54%
, no
ch
ange
in c
larity
C
omm
ents
Par
amet
ers
Non
e TP
, TK
N,
TAN
,
sedi
men
ts
TSS
, TP
TP
A
s ab
ove
Ext
ensi
ve
TP,
TSS
TP,
DO
, cl
arity
Freq
uenc
y N
ot R
eq'd
2X p
er
yea
r 1-
2X
per
yea
r 2
wks
- 6
mos
4X
pe
r y
ear
Par
amet
er s
peci
fic
mon
thly
11
X pe
r y
ear
PE
I E
nviro
nmen
tal
Pro
tect
ion
Act
O
N -
Fis
h an
d
Wild
life
Con
serv
atio
n A
ct;
Wat
er R
esou
rces
A
ct;
Env
ironm
enta
l P
rote
ctio
n A
ct
ON
- F
ish
and
Wild
life
Con
serv
atio
n A
ct;
Pub
lic L
ands
Act
; W
ater
Res
ourc
es
Act
; E
nviro
nmen
tal
Pro
tect
ion
Act
Des
igne
d to
mee
t TP
=0.
05 a
nd
TSS
=5 m
g/L
abov
e
back
grou
nd.
No
in
crea
se if
ba
ckgr
ound
ex
ceed
s
com
plia
nce
lev
els
TP li
mits
bas
ed o
n
med
ian
open
wat
er
conc
'n;
DO
and
cl
arity
in
com
paris
on t
o
refe
renc
e st
atio
n;
ecee
ding
crit
eria
tr
igge
rs m
itiga
tion
by
ope
rato
r
Com
plia
nce
limits
m
easu
red
in t
he
rece
iver
100
m
dow
nstr
eam
. S
ite
spec
ific
assi
mila
tive
capa
city
con
side
red
Wat
er Q
ualit
y M
onito
rin
g
Com
plia
nce
limits
ar
e in
exc
ess
of
ambi
ent
lev
els
Com
plia
nce
limits
ba
sed
on d
ilutio
n of
<
or >
20:1
QC
Act
Res
pect
ing
the
Con
serv
atio
n an
d
Dev
elop
men
t of
W
ildlif
e -
Reg
ulat
ion
of
Aqu
acul
ture
and
S
ale
of F
ish;
E
nviro
nmen
tal
Qua
lity
Act
SK
Wat
ersh
ed
Aut
horit
y A
ct a
nd
Reg
ulat
ions
; S
K
Env
ironm
enta
l M
ana
gem
ent
and
P
rote
ctio
n A
ct
Com
plia
nce
limits
m
easu
red
in t
he
rece
iver
300
m
dow
nstr
eam
NB
Cle
an
Env
ironm
ent
Act
-
Wat
er Q
ualit
y
Reg
ulat
ion;
NB
A
quac
ultu
re A
ct
SK
Gen
eral
Sur
face
W
ater
Qua
lity
O
bjec
tives
- p
ost
mix
ing
zone
Com
plia
nce
limits
m
easu
red
in t
he
rece
iver
100
m
dow
nstr
eam
Juri
sdic
tion
Aqu
acul
ture
Leg
'n /
Reg
'n
Com
plia
nce
Lim
its
BC
Fis
herie
s A
ct -
A
quac
ultu
re R
egn.
;
BC
Was
te
Man
age
men
t A
ct -
La
nd-b
ased
Fis
h
Was
te C
ontr
ol R
egn
Lega
l Aut
hori
ty(ie
s)
Aqu
acul
ture
Act
E
nviro
nmen
t A
ct

Proceedings of the Canadian Freshwater Aquaculture Symposium – Aquaculture Canada 2004
40 AAC Spec. Publ. No. 11 (2006)
Toward an Enabling Policy and Regulatory Framework in Canada Panel Discussion Discussion Report edited by Éric Gilbert, Daniel Stechey and Jean McNulty Moderator: David Rideout, Executive Director, Canadian Aquaculture Industry Alliance Participants: Pierre Baril, Adjunct Deputy Minister Directorate of Environment Policy for Water, Agriculture and Municipalities Québec’s Ministry of Environment Quentin Day, Manager Fish Culture Section Ontario Ministry of Natural Resources Éric Gilbert Aquaculture Management Directorate Department of Fisheries and Oceans Jean-Paul Lussiàa-Berdou, Aquaculture Coordinator, Québec’s Ministry of Agriculture, Fisheries and Food Marvin Rubin Engineering and Analysis Division US Environmental Protection Agency Daniel Stechey, President Canadian Aquaculture Systems Inc. Brian Thomsen, Executive Director Danish Aquaculture Association ------ David Rideout We had planned to see if we could stimulate a very productive dialogue on where fresh water aquaculture can go in Canada, and as Dan Stechey was speaking, I was thinking the one thing he forgot is the “you better not deceive me” act - the regulation that the consumer uses when they buy the product. They want to know that it’s been produced in an environmentally sustainable way, and they want to know that it’s good for their health. It’s interesting that the real criteria I think we all use is “Will I feed this to my children?’’ and that’s what I do. I’m sure that’s
what you do, and that’s what we all do, because we have great confidence in this industry in which we work. But I think there are some issues about how we can move this industry forward. We have some additional panellists’ join the table and I will ask if they want to make a couple of opening comments, and then we’ll throw the floor open for questions. I think that this is the one real opportunity where we can try to drive to a discussion with some very important people about how we can move forward and look to the future. In addition to the speakers of this session, the people who’ve joined the head table are Jean-Paul Lussiàa-Berdou who is the aquaculture coordinator with MAPAQ here in Québec, Quentin Day, manager of the OMNR Fish Culture Section, and Pierre Baril, who is the adjunct Deputy Minister, Directorate of Environment Policy for Water, Agriculture and Municipality within Québec’s Ministry of Environment. Jean-Paul Lussiàa-Berdou Québec’s freshwater sustainable aquaculture development strategy (STRADDAQ) is a key component that we have developed with the industry in particular, but also with the Table Filière en aquaculture d’eau douce, 24 months ago now. It consists of an attempt to resolve the crisis that emerged in 1999. We continue to push forward with this cooperative approach involving regulators, producers and development agencies. The environmental crisis that emerged in freshwater aquaculture in the late 1990s led to a significant decline in output. This decline was due both to closure of companies under the existing regulations, with financial compensation, and to cutbacks in output by companies facing financial difficulties. We must not lose sight of that fact. With STRADDAQ we believe we can make a new start on more solid ground, although the target of a 40-percent cut in phosphorus waste must be met over a 10-year period. A large part of this time will also be required to revive interest among investors and developers in this sector. One problem we face is that the situation has in fact seriously eroded

Proceedings of the Canadian Freshwater Aquaculture Symposium – Aquaculture Canada 2004
AAC Spec. Publ. No. 11 (2006) 41
interest in investing in freshwater aquaculture in Québec. Another factor we face, which is not related to the regulations but is still an important consideration, is that fact that most of our sales are to the Québec market and any significant growth can only target the table market. In theory, there is room in this table market, but we also face very strong competition from countries such as Chile that have relatively low production costs. Thus, one avenue for significant growth is definitely linked to strategic aspects such as improved environmental performance, as well as environmental certification of output to target the most lucrative markets. Pierre Baril Québec seriously updated its water policy in 2002. And in my opinion, fish farmers must adopt a new water management dynamic in Québec. This new policy institutes orientations on water governance. In Québec we are gradually seeing the establishment of management by watershed in which all water users participate in a forum on decisions about volume, collection, and quantity or quality of water. In these forums, fish farmers, like all other water users, must operate within the decisions that will be made. For the moment, this approach of managing by watershed is not very spectacular, but is very practical. Everyone involved takes part in decisions within the watershed committees. We are currently completing the profiles of Québec’s various watersheds. This will be followed by development of water management plans for each watershed. Ultimately, contracts may be signed between users and the agency responsible for managing a given watershed. Thus, if a person is a water user in a given watershed and produces waste in that watershed, there is every interest in participating in the entire management dynamic resulting from this approach based on watersheds. Moreover, the policy also strives to implement the principle of user, polluter, and payer. Those who collect, take water and discharge any contaminants after its use will have to help cover the costs that incur, and here again, fish farmers like all other water users, will have to be part of the solution. I believe that STRADDAQ has introduced a new tool that in my opinion will combine our more classical approach of legislation, regulations and standards with a much more participatory approach involving the
entire industry. By common agreement, targets have been set to reduce the pressure on our water resources in Québec, especially the discharge of phosphorus. This is a very important factor to be managed since 60 to 70 percent of the large rivers that flow into the St. Lawrence in southern Québec have three to four times the allowable limits of phosphorus for maintaining aquatic life. In some bodies of water in Québec, such as Baie Missisquoi, the central stretches of the Nicolet or Bécancour Rivers as well as Lac Maskinongé, algae blooms have severely limited water use. In conclusion, I believe that with STRADDAQ, fish farmers are choosing the right path for implementing a strategy designed to reduce pressure on the environment and a vision of sustainable aquaculture development. Quentin Day I would like to thank the conference organizers for holding this conference with a focus on freshwater. And thanks for inviting myself and other staff from the Ontario Ministry of Natural Resources to participate in the conference. On my way over to Québec on the train yesterday I was reading one of those magazines that you find in the back in trains and I came across some advice which I thought was probably appropriate to the things that we’re talking about today, and that advice was to play with the cards that you have been dealt, and not the cards that you wish you had. As we discuss over the next couple of days moving towards a more enabling policy and regulatory framework for freshwater aquaculture in Canada, it will be important for us to consider, and account for, the significant regional differences in context in which aquaculture operations occur. While an overarching Canadian action plan is necessary to address the broad national and international context, I think regional action plans are also important that address significant differences we face in the different regions, and local context, across the country. I wanted to try and give you a sense of some of the context that I think is important to consider, specifically in Ontario. Aquaculture is relatively new. It’s a small but growing sector in Ontario. The annual production has increased from about twenty-eight hundred tons in 1992 to about 4500 tons in 2003. That's about a 62% increase over 10 years. Rainbow trout produced for human consumption makes up about 95% of Ontario's

Proceedings of the Canadian Freshwater Aquaculture Symposium – Aquaculture Canada 2004
42 AAC Spec. Publ. No. 11 (2006)
production. However, the rate of expansion has fallen far below the industry's expectations. Right now the industry consists of about 190 establishments. The vast majority of these are small land-based farms located in southern and central Ontario. There is a smaller number of cage farms located in the northern region of Ontario; about ten. Their production accounts for about 80% of the provinces total. Expansion in the last decade has occurred primarily in cage culture in the Georgian Bay and North Channel area of Lake Huron. Lake Huron is one of the five Great Lakes. These lakes are a vast inland fresh water sea that together holds about 20% of all the surface fresh water in the world. And this bountiful resource is located in close proximity to large markets - Toronto, Montreal, and major cities in the United States. It would appear to provide an ideal context for a growing aquaculture sector. There are, however, a number of other important factors that play in this regional context. There is more than 33 million people who inhabit the Great Lakes basin including a third of Canada's population. The Great Lakes and the other lakes and rivers in the basin provide drinking water to millions of people. And the Great Lakes basin is home to about 45% of Canada's industry. That growing population and continuous economic development during the 20th century has brought significant changes to the Great Lakes - not all of them have been positive. By the middle of the 20th century, governments and environmental groups were seeing signs of an ecosystem that is clearly under stress. So for the past 30 years, since about 1970, the Governments of Canada, Ontario, and the eight Great Lakes States who share the Great Lakes with us, have been working together with the area citizens to restore the health of the basin’s ecosystem. Over the past 20-30 years, many millions of dollars have been spent and significant progress has been made. Discharges of harmful pollutants to the Great Lakes are down and quality of the water is improving. We’re seeing species recover like the pilgrim falcon, the bald eagle, osprey, and the lake trout which are clearly evidence that the ecosystem is improving. Many of the stakeholders that we have to work with in developing an aquaculture sector in Ontario have been a part of these efforts to improve the Great Lakes basin ecosystem. And many of them are also familiar with the environmental issues associated with
aquaculture being debated in other jurisdictions like BC. There were two unfortunate events related to cage aquaculture which occurred in late 1997 which significantly raised the concerns of these environmental groups. There were 350,000 rainbow trout that escaped in Lake Ontario. Then there was also serious water quality impairment in the section of the North Channel - LaCloche channel. There's also a number of First Nation communities in the north shore and there's a number of active land claims that are under negotiation. The First Nations involved in those active land claims have opposed several recent applications for new aquaculture sites. Working with Aboriginal communities to improve economic conditions, and improve relationships, is a high priority of the current Government of Ontario. There was a major land use strategy initiative in the late 1990s that designated a long stretch of Lake Huron and Lake Superior coastline as the Great Lakes heritage coast. This area includes an extensive network of parks and conservation areas, and nature-based tourism has been identified as a significant opportunity for the future of this area. The existing cage farms are located within the Great Lakes heritage coast area. Finally in the late 1990s, the tragic loss of life in the community of Walkerton as a result of contamination of the community’s drinking water was linked to nutrient runoff from aquaculture operations. It has greatly heightened the government’s concern relating to anything that might potentially adversely affect water quality. So all of these factors are an important part of the context in which cage aquaculture has been attempting to expand in Lake Huron over the past 10 to 15 years. Shared stewardship is an important part of OMNR’s operating philosophy, and involvement of all affected stakeholders and decisions concerning the management of the Province’s natural resources is very important to OMNR. Reaching a consensus among the government agencies involved in cage culture industry, and the key environmental organizations on the impact of agricultural operations in the North Channel, so far has not been possible. There's a real need for data collection and scientific evaluation of the impacts of current cage culture practices in the North Channel, and the sharing of that information among all the affected stakeholders. The required model development data collection and scientific evaluation will take time, and in the meantime, the potential for risk and level of

Proceedings of the Canadian Freshwater Aquaculture Symposium – Aquaculture Canada 2004
AAC Spec. Publ. No. 11 (2006) 43
uncertainty involved have resulted in a cautious approach by the regulatory agencies. Neither the industry nor the environmental groups are happy with the current state of affairs. The industry feels the present environment is a major factor in stifling development of the industry. Several large environmental organizations have increased their lobbying efforts to government to undertake a review of their policy permitting cage aquaculture in the Great Lakes, and to implement a moratorium on cage aquaculture. Looking to the future, there are number of initiatives underway right now in Ontario which I think are reason for a cautious degree of optimism. There's a significant number of good research projects underway in Ontario that will, over time, support the needed policy development. The Ministry of the Environment has just completed a review of their policies, and the results of that review are to roll out in November of this year. The regulatory agencies involved are working much closer together than they have in the past. OMNR, Ontario Ministry of the Environment, Ontario Ministry of Agriculture and Food, DFO, Environment Canada, and the University of Guelph have initiated discussions concerning a collaborative project to develop two products that would help harmonize and streamline the review of cage aquaculture applications. We’re talking about developing harmonized guidelines, and a decision support tool to help with sighting of aquaculture cage culture operations. The Ministry of Agriculture and Food, with the support of the Ministry of Health and OMNR, is leading the Ontario food safety system review to modernize Ontario's food safety system. The Northern Ontario Agricultural Association has been making good efforts to increase the understanding of their industry among the local communities by participating in local fairs, and by conducting tours of their operations. Considering the current context that exists for aquaculture in Ontario, I think it's important to manage our expectations. For the next five years, I believe that in Ontario, we are more likely to see continued slow, steady, incremental growth in the sector rather than a fast major increase in growth. I think it's also important that the sector not put all of their eggs in one basket, - being cage culture - but that we should continue to explore opportunities for expanding land-based operations, and recirculation technology in a greater diversity of species.
David Rideout We now have time for questions. This is a really important time to get to these key people within the bureaucracies of Québec and Ontario, as well as specialists and folks from overseas. Question: With regard to the Danish model
farms, there was $2 million dollars of funding that was supplied for monitoring work and development of new management techniques. Where did the money come from for the model farm project? And what were the roles of industry and government in the design and operations of the farms?
Brian Thomsen As to where the money comes from, the European Union has a scheme that supports the development of not only aquaculture, but fisheries in general. And it works such that the European Union contributes 50% of the money, and then the state will contribute another 50%, if it is for research. If it is for business subsidies, like a model fish farm, then the European Community will add 15% and the Danish Government will add another 15%. So in this case, if a farm costs for example one million Canadian dollars, the subsidy will be 30% of that amount. If we take the role of different parties in designing the model fish farms, our key objectives were to ensure that the farms were operational and that the farmers would earn money once the farms were built. Now if we look at the authorities, they were mostly worried about the efficiency of the model fish farms. Mainly, would they provide enough fish to clean the water? That's basically what the discussion was. We found that we had enough documentation for the efficiency, and the authorities would say – no, that is not the limitation. That's only empirical evidence which we cannot use. That's when the researchers come into play to provide the scientific documentation that will count at the end of the day. Question: Dan, you gave a nice sort-of historical
overview, and compared what you called environmental regulations, but you dealt pretty narrowly, I think, with just the nutrient load aspects of it, and

Proceedings of the Canadian Freshwater Aquaculture Symposium – Aquaculture Canada 2004
44 AAC Spec. Publ. No. 11 (2006)
it's the way we do it now. What do you sort-of envision as the emerging paradigm of the environmental regulations that aren't going to go with respect to metals, loading and habitat impacts, others zenobiotics… things which will be, in the end actually, a lot more difficult to deal with in solids and phosphorus. Because when it comes right down to it, those are pretty easy compared to some of these other things. So my question is where do you see us going in terms of that aspect of environmental regulations?
Daniel Stechey: That's a valid point, and I think we could have a whole other presentation on that. What we need to do is move away from a very strict command and control type of regulatory framework. While it does work in some situations, it doesn't cover all aspects. If we move more towards going to the opposite extreme, which I would call self regulation, where we are using codes of conduct and best management practices. You can't have both - one or the other. Really you need a combination of both and everything that’s in the middle, because if we go to things like the therapeutic agents, which I think you mentioned - zenobiotics - we have practices in place that are designed and developed to appropriately put into these codes, and even using things like third party certification, as we heard in the presentations this morning. I think what we’ll end up with is a much more diverse, but comprehensive mechanism that will allow us to look at all those different aspects of the environmental impacts of fish farms and best manage them, because no one system is going to be best. And you're absolutely right; in that presentation, I looked at what happens in Canada. What happens in Canada is largely controlling phosphorus and solids output, without looking at much of anything else. We need to look at a much broader picture because as David said, at the end of the day, it's the consumer who’s ultimately going to judge whether they're going to buy our product or not. If we don't have a system in place that the consumer has confidence in, this industry fails. And it's going to be a combination. I think a lot of people are already aware of the movement towards smart regulation, which takes us away from the strictly command and control approach, and allows a lot more of user intervention and academic intervention. More stakeholder
participation in the process to come up with systems that are much more effective. I don't know if that's an answer. Question: I guess I was looking more for your
insight into what you see as the next emerging tier of issues that we’re going to have to deal with in terms of environmental regulations. You've got nutrient loads in some of the aspects that you talked about, but then on the next horizon are we going to have way more problems dealing with metals, zenobiotic contaminants and other things that have nothing to do with food safety issues in consumer? They're going to be basically all about environmental impact.
Daniel Stechey: I would argue, first of all, that metals contamination doesn’t have anything to do with the consumer because…that part’s got nothing to do with the consumer… It's an environmental impact. And I think you're referring to copper and zinc from feed ingredients. When the consumer hears about that and hears about this process, it’s not necessarily green. There’s an obvious impact back on the industry. We have to deal with that. One of the key aspects of all those approaches is… I think when we look at aquaculture… my personal impression is that in a lot of cases we look at aquaculture and we see a potential problem on the horizon like metals or any therapeutic agents, for arguments sake right? The immediate response in many cases is to try and curtail the activity, as opposed to finding a solution for that. And I would argue that there are no other industries that I know of where, when there is a problem, you stop the industry. You find a solution to the problem and you move beyond it. The solutions are usually found, and usually quite expediently, once a problem is identified. What we need to do it is take a look at that more holistic approach to environmental management and move beyond simply phosphorus and total suspended solids. I think in a lot of cases, we’re moving back - only looking at phosphorus and total suspended solids and I think that's a bit myopic on the industry's part and the regulator’s part. Look at a much more comprehensive approach to this industry, not only in what we need to control from environmental perspective and the

Proceedings of the Canadian Freshwater Aquaculture Symposium – Aquaculture Canada 2004
AAC Spec. Publ. No. 11 (2006) 45
consumer perspective, but also to look at our approach, and to see that it doesn't have to be strictly regulatory. There are a whole range of options. I think that the use of codes of conduct and best management of practices is one area with third-party certification that we have barely begun to scratch. Question: STRADAQ does not support short-
term growth of the industry. Would it be possible to introduce a mechanism that factors in the principle of fairness for growth compared with other types of human activity, to allow a critical mass of development to ensure survival of the industry?
Pierre Baril This is a very good question and I think it ties in with what I was saying in my introduction. For example, for phosphorus, there are many watersheds in Québec that have exceeded the maximum capacity. Establishing a new activity in these watersheds that would add a little more phosphorus to the natural environment is difficult, and in our view, this just adds to the problem. So recently we held rather similar discussions on hog production in Québec. Can we produce even more hogs in areas that already have far too much phosphorus? Because you know that in hog production, there is a lot of phosphorus discharge that becomes diffused pollution, unlike aquaculture which creates concentrated pollution. It is clear to us that in our watersheds that are already overloaded with phosphorus, there are serious constraints on the growth of aquaculture. Although aquaculture operations often are developed upstream in watersheds, the impact is cumulative and the phosphorus is added to all other sources, while the impact is felt primarily downstream. And there is clear agreement that for people living downstream in a given watershed, it is easy to form common cause with those living upstream. But for those living upstream, it is difficult to form common cause with those living downstream, because they are far away and those living upstream do not have to suffer the consequences of eutrophication, for example. In Québec, however, there are many rivers and great potential capacity to support phosphorus available elsewhere in the densely settled, highly industrialized and intensively agricultural
area. And I believe that with STRADDAQ, there is a concerted approach with room for development in areas with capacity in the environment. Especially since the agricultural sector is participating as a water user, I believe that fish farmers will be able to voice their needs and advocate their approach, which I would describe as sustainable. Some American states have even begun attempts to establish Water Quality Trading Programs and Policies. It is not beyond the realm of possibility in Québec of having tradable phosphorus quotas or licences at some point. David Rideout Statistically speaking, everybody in this room has got a 50% chance of living forever. That's because half the people that ever lived are still alive. We've got 6 billion people and it's growing, and we’re running out of water. I believe that the next war will be fought over water. We’re sitting on greater than 20% of the freshwater in the world. I believe that our food production systems are going to be under tremendous stress. We're seeing it in terms of pork; we’re seeing it in terms of beef. We're seeing lots of issues that they have to deal with and lots of issues that we have to deal with. But the big issue is going to be how they’re going to get water for their animals to drink, water for the crops to grow. We don't use water. In other words, we’re not a consumer. Our farms don't really consume the water. I said that backwards, we use the water for which to grow fish, but they're not water consumers in the way that other food production systems are. So we have got to find a way to get this done right. The question is, is this the cure? Is the regulatory policy framework going to kill us in the process? So is there a future for us? Can we move it forward? Or should we just look to the other countries and just say OK, you're going to do freshwater even though we have over 20% of the freshwater in the world today? It's a challenge to us all. So how are we going to do it? That's a question I ask you. And that's a question I ask the panel. I don't know if anybody has any final comments, but I’ll tell you we’re coming into a very critical time in the evolution of mankind. I once was in a meeting with a chap who was in the Pasteur Institute and he said that things have changed. He said we used to be working for mankind. He said we’re now into the profit motive. I believe that this industry, while it looks for profit, is working for mankind. Because we’re developing processes that are going to

Proceedings of the Canadian Freshwater Aquaculture Symposium – Aquaculture Canada 2004
46 AAC Spec. Publ. No. 11 (2006)
feed the world. So how do we get it done right? What do we need to do? And how do we make sure that the environment is the way it should be? That's a commentary, I know, but I'm hoping that somebody will get up and say, Rideout you’re crazy. It's not going to happen like that, it's going to happen like this. Do we have a future? Can we find a way to work together? Scientists, industry and government or should we pack it up and go to the mussel forums? I don't know what's the answer? Is there an answer? Are we in a desperate situation? Is it food production systems? How are we going to feed these people? 10 billion people they’re talking about. We’re either going to feed them or they're going to get really sick and die. What's the future? Brian Thomsen At least in the Danish perspective the overall picture is that the demand for fish is going to grow. It’s not going to decline. It's not going to remain stable. It's going to grow. We're going to need more fish tomorrow than we need today, and were not going to get that fish from the oceans. That's also for sure. So the only way we can get it in the future is from farming. My question is, as a country, do we want to participate in this or not? That is basically only a political decision to make because the technologies are available. The Danish politicians said that they have changed their mind. Before they didn't really have an opinion. They would be sort of blunt when you’d ask them. But if you asked them today they would say “Yes we want to have aquaculture. But of course we want to have it in a sustainable way”. That is merely a question of technology. So I think the answer to your question will have to be addressed to the politicians. Do they want to have aquaculture in Canada? David Rideout Then maybe I'll ask the bureaucratic members of the panel. And is there a way that we can get to yes? Is what we're doing going to get us to yes? In terms of the industry, and as I said in my opening remarks this morning, the industry is facing a very critical time in all sectors. So how do we get to yes? Is it possible? Pierre Baril I think this is possible if we clean up current operations. After that, everything is possible
because we will have well established procedures and processes that allow us to set benchmarks. Audience Member I appreciate the invitation to say you're crazy and you’re all wrong, but I’m not going to say that. Just to throw out a comment I guess, and that is when comparing to other terrestrial livestock industries, they’re no more or less sustainable in the short, medium and long-term than we are. They have all the same problems. In fact, they even have bigger problems in some areas, maybe smaller in others. It's not strictly speaking true that we’re not a net user of water even though we all say that. It's not really true either. But I would say that in most of the industrialized countries, it's also true that the only way terrestrial agriculture survives is that it's highly subsidized and safety-netted by government. That's something that is a very different paradigm with aquaculture in Canada because by and large it's not a subsidized or safety-netted kind of an industry. So we may have to wrap our minds around that one if we want to go 50 to 100 years down the road. Maybe we need to rethink our philosophy about not getting hooked to that sort of public subsidy program, because the pork industry in Canada wouldn't be alive if it weren’t for that. The dairy industry wouldn't be alive in Ontario if it weren’t supply managed. I mean it's a $1.4 billion industry but it survives because it’s supply managed with quota. The poultry industry is the same way. There’s a whole bunch of different paradigms in here that we have to merge together in looking down the road. If you go really far down the road, it's hard to say whether or not all fish will have to come from farms. Some experts predict that the ocean harvests will increase dramatically with global warming and access nutrients into the sea. In fact, in a hundred years, we may have no way to even predict how much productivity will come back from the ocean harvests again because of those two factors. Of warming climate change, mixing of oceans that never occurred before, and the addition of nutrients that might be a new ecological good thing in the end in terms of ocean productivity. I don't know – you asked some pretty big questions. Looking that far down the road, I think we have to narrow our focus to five and 10 years down the road because beyond that I don't know whether we even need to be worried about that. We’re not

Proceedings of the Canadian Freshwater Aquaculture Symposium – Aquaculture Canada 2004
AAC Spec. Publ. No. 11 (2006) 47
going to be alive that long if we think too far down the road right now. Quentin Day I think there is a role very much for freshwater aquaculture in Canada. But I think we need to focus on what that role should be for Canada. I think there's probably a sector of the market that we should focus on. You know the aspect of marketing Canadian products as clean products from clean environment; I think that rings with my sense of where most Canadians stakeholders are coming from. They're not going to sacrifice environmental quality for jobs. Food is not a problem in Ontario. I think, maybe I’m being too blunt but I would say based on what I’ve seen, Ontarians and probably Canadians in general, are quite happy to sit back and see the food produced in other countries. If it involves a lot of environmental damage, they’re quite happy to see it happen in other countries. They're not that concerned about it being a big part of the economy here. I think if we were to take the approach of trying to find a niche in the aquaculture market for Canada, I think that's the direction we should be heading. Jean-Paul Lussiàa-Berdou To say that in Canada the future of aquaculture lies in the problem of feeding a growing world population seems to me to take a difficult approach to development when we have production costs that do not allow us to establish a genuine presence in these markets. This is a difficult question to answer. However, producing fish for our own needs may become increasingly necessary. We can also well imagine that developing countries at some point will no longer want to use their water resources to feed the developed countries. Thus, we must consider the possibility that we will be compelled to produce all our own aquaculture products. In the dynamic of water use in Canada, which is something very difficult, I do not agree that aquaculture is a type of use that does not use water in the same way as others. The water cycle in fact is a global cycle. For example, there
are water users who water their plants and the water returns to the ground in one way or another. In so doing, it loads up with nutrients just as it does in passing through a fish farm. Thus, aquaculture uses water in the same way as other users and there are tradeoffs that must be made through various methods. However, to answer the question, I believe there is room for aquaculture, especially in Québec, for aquaculture serving the local market and not necessarily initially destined to generate phenomenal economic growth. Now it is a fact that we will use water specifically in areas where the watersheds can still bear human activities that have an impact. These new aquaculture activities will generate economic development in regions where we are trying to find activities to replace a decline in other sectors such as forestry or mining. I believe there is still room for aquaculture development, but this is aquaculture with output targeting our own markets and meeting our own needs, not aquaculture primarily focused on export markets. David Rideout Well I guess we’re getting close to the end of this discussion and so what I want to say that yes there is an opportunity here. The industry has things to do. Scientific and research people have things to do. Government has things to do. But we have to get there and do it quickly. I would suggest, because you people probably don't know this, but there has been a tremendous amount of behind the scenes work done in terms of this freshwater aspect of this conference. And from what I've seen, it’s been Éric Gilbert who's done a tremendous amount of effort. So I'm hoping that any new program we have is either called the Gilbert program, or the Éric program, or at least the farmers will name their new production fish Éric or Gilbert, or something like that. Hopefully today is the day that we really launch forward to the future for an industry that can really reach its potential and provide continued, good, safe, healthy products from a good, safe, sound, environment in Canada.
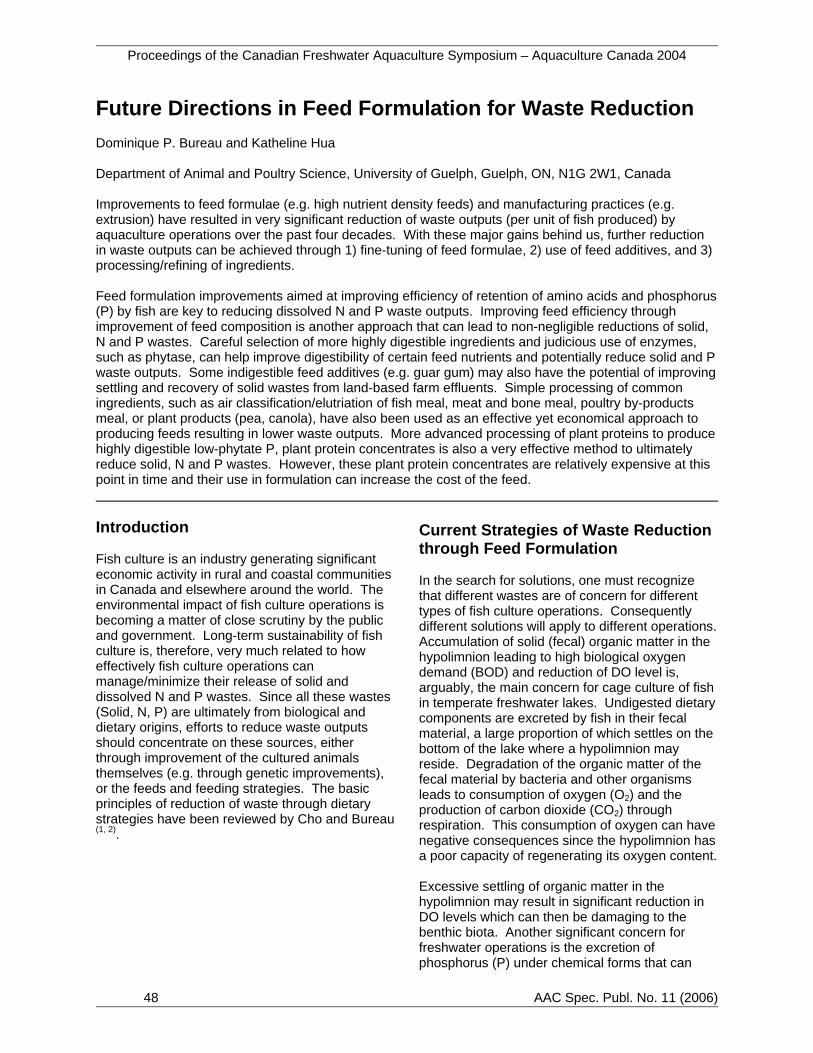
Proceedings of the Canadian Freshwater Aquaculture Symposium – Aquaculture Canada 2004
48 AAC Spec. Publ. No. 11 (2006)
Future Directions in Feed Formulation for Waste Reduction Dominique P. Bureau and Katheline Hua Department of Animal and Poultry Science, University of Guelph, Guelph, ON, N1G 2W1, Canada Improvements to feed formulae (e.g. high nutrient density feeds) and manufacturing practices (e.g. extrusion) have resulted in very significant reduction of waste outputs (per unit of fish produced) by aquaculture operations over the past four decades. With these major gains behind us, further reduction in waste outputs can be achieved through 1) fine-tuning of feed formulae, 2) use of feed additives, and 3) processing/refining of ingredients.
Feed formulation improvements aimed at improving efficiency of retention of amino acids and phosphorus (P) by fish are key to reducing dissolved N and P waste outputs. Improving feed efficiency through improvement of feed composition is another approach that can lead to non-negligible reductions of solid, N and P wastes. Careful selection of more highly digestible ingredients and judicious use of enzymes, such as phytase, can help improve digestibility of certain feed nutrients and potentially reduce solid and P waste outputs. Some indigestible feed additives (e.g. guar gum) may also have the potential of improving settling and recovery of solid wastes from land-based farm effluents. Simple processing of common ingredients, such as air classification/elutriation of fish meal, meat and bone meal, poultry by-products meal, or plant products (pea, canola), have also been used as an effective yet economical approach to producing feeds resulting in lower waste outputs. More advanced processing of plant proteins to produce highly digestible low-phytate P, plant protein concentrates is also a very effective method to ultimately reduce solid, N and P wastes. However, these plant protein concentrates are relatively expensive at this point in time and their use in formulation can increase the cost of the feed. Introduction Fish culture is an industry generating significant economic activity in rural and coastal communities in Canada and elsewhere around the world. The environmental impact of fish culture operations is becoming a matter of close scrutiny by the public and government. Long-term sustainability of fish culture is, therefore, very much related to how effectively fish culture operations can manage/minimize their release of solid and dissolved N and P wastes. Since all these wastes (Solid, N, P) are ultimately from biological and dietary origins, efforts to reduce waste outputs should concentrate on these sources, either through improvement of the cultured animals themselves (e.g. through genetic improvements), or the feeds and feeding strategies. The basic principles of reduction of waste through dietary strategies have been reviewed by Cho and Bureau (1, 2).
Current Strategies of Waste Reduction through Feed Formulation In the search for solutions, one must recognize that different wastes are of concern for different types of fish culture operations. Consequently different solutions will apply to different operations. Accumulation of solid (fecal) organic matter in the hypolimnion leading to high biological oxygen demand (BOD) and reduction of DO level is, arguably, the main concern for cage culture of fish in temperate freshwater lakes. Undigested dietary components are excreted by fish in their fecal material, a large proportion of which settles on the bottom of the lake where a hypolimnion may reside. Degradation of the organic matter of the fecal material by bacteria and other organisms leads to consumption of oxygen (O2) and the production of carbon dioxide (CO2) through respiration. This consumption of oxygen can have negative consequences since the hypolimnion has a poor capacity of regenerating its oxygen content. Excessive settling of organic matter in the hypolimnion may result in significant reduction in DO levels which can then be damaging to the benthic biota. Another significant concern for freshwater operations is the excretion of phosphorus (P) under chemical forms that can

Proceedings of the Canadian Freshwater Aquaculture Symposium – Aquaculture Canada 2004
AAC Spec. Publ. No. 11 (2006) 49
potentially become available for plant and algae since P is, in general, a limiting factor for algae growth in freshwater. Ammonia (NH3) is also a concern for land-based freshwater fish culture operations. Ammonia is toxic at low concentration and it is a determinant factor of water exchange requirement of land-based aquaculture operations. High water exchange limits the effectiveness (or cost-effectiveness) of various technological approaches aimed to reducing waste outputs (e.g. settling ponds, filters, etc.). The various industry stakeholders (feed manufacturers, scientists, etc.) have been proactive in the search for solutions. The invested efforts have resulted in very significant reduction of waste outputs (per unit of fish produced) by fish culture operations over the past four decades. In the 1970’s, for example, commercial steam-pelleted trout feed formulae were relatively low in protein (approx. 36% protein), fat (8-12% fat) and digestible energy (<14 MJ) but rich in starch and fiber (35-40%) as well as being high in P (>2%). The realization that many components were of no, or little nutritive value for fish has led to the removal of a very significant proportion of these components from the feed formulae. This, together with the introduction of extrusion technology, has resulted in the production of feed with higher digestible/useful nutrients (protein and fat) density and significant reduction in the amount of feed required to produce one unit of biomass (e.g. 1 kg of fish). In the 1970’s and early 1980’s, feed conversion ratio (FCR, feed/gain) of 2 to 2.5 were common for market size rainbow trout (1 kg) fed the commercial feeds available at that period. Today, the use of higher digestible nutrient density extruded feeds (e.g. >40% digestible protein, >25% fat, >19 MJ digestible energy) allows FCR of about 1.2 for these fish. This significant decrease in FCR was also accompanied by very significant reductions in waste outputs (Table 1)
and biological oxygen demand (BOD) resulting from these wastes. Noteworthy is these improvements were achieved without any investment required or increase in production costs for fish culture operations. Further Reduction in Waste Outputs With these major gains behind us, further reduction in waste outputs can be achieved through 1) fine-tuning of feed formulae, 2) use of feed additives, and 3) processing/refining of ingredients. 1) Fine-Tuning of Feed Formulae Reducing Solid Waste Output Solid waste (SW) outputs by fish fed practical diets consist largely of undigested starch and fiber from grain and various plant products, and minerals from the various ingredients. Reduction of SW outputs from aquaculture operations can be fairly simply done by selecting more highly digestible ingredients and excluding poorly digested ingredients. Careful selection and/or quality control of the ingredients are very simple, yet effective, approaches to controlling solid waste outputs. Further reduction of solid waste can be achieved through optimization of the composition of the feed to improve feed efficiency. Since it is difficult to reduce indigestible matter content in feeds to levels below 12 to 15%, a reduction of the amount of feed required to produce one unit of biomass is an avenue to reducing the contribution of these “inevitable” losses. Improving feed efficiency can be achieved by further increasing the digestible nutrient density of feeds beyond what is currently done (e.g. conceptual feed in Table 1).

Proceedings of the Canadian Freshwater Aquaculture Symposium – Aquaculture Canada 2004
50 AAC Spec. Publ. No. 11 (2006)
Table 1: Theoretical waste outputs1 associated with different historical feed formulae.
1970’s 2000’s Conceptual3 Parameters Feed Feed Feed
Crude Protein, % 36 45 54 Lipid (Fat) 8 25 31 Digestible Energy, MJ/kg 12.0 20.5 23.5 Phosphorus 2.5 1.1 0.9 Theoretical FCR1 , feed:gain 1.86 1.10 0.96 Total Solid Waste2 , kg Per metric tonne (MT) feed fed 314 203 162 Per MT fish produced2 584 224 155 P Wastes2 , kg Solid P, per MT fish produced 23.3 6.1 3.9 Dissolved P, per MT fish produced 19.6 2.4 1.0 N Wastes2, kg Solid N, per MT fish produced 11 8 9 Dissolved N, per MT fish produced 71 45 50
1 Based on an estimated digestible energy requirement of 21.5 MJ to grow a rainbow trout from 10 g to 1000 g. 2 Estimated using the biological method of Cho et al. (5). 3 Conceptual feed formula produced with highly digestible refined feed ingredients. Reducing P Waste Outputs P wastes are generally composed of fecal (solid) waste, and dissolved metabolic P waste. Both digestibility and quantity will determine the fate of P fed to fish. The undigested fraction of the P of the diet is egested in the feces by fish, whereas digestible P supplied over requirement of maintenance and growth is excreted mostly as phosphates via the urine. P requirement of rainbow trout is believed to be approximately 0.4 to 0.5% digestible P (0.20 - 0.25 g/MJ DE) (3). Minimizing P waste outputs can be achieved by formulating to lower total P level and digestible P levels closely meeting, but not exceeding, the requirement of fish. This can be a difficult task since estimates of the digestibility of P in common feed ingredients in the literature are highly variable or often contradictory. The following model, developed by Hua (4), was shown to accurately estimate digestible P content of salmonid fish feeds: Digestible P (g/kg diet) = 0.68 bone-P + 0 phytate-P + 0.84 organic P + 0.89 Ca monobasic / Na / K Pi supplement + 0.64 Ca dibasic Pi supplement + 0.51 phytase (100 FTU/g phytate) – 0.02 (phytase)2 - 0.03 (bone-
P)2 - 0.14 bone-P * Ca monobasic / Na / K Pi supplement. Careful selection and quality control of ingredients is also a critical step for the production of feeds resulting in minimal P waste outputs. Reducing N waste outputs The main factors affecting dissolved nitrogenous waste (DNW) outputs are those that influence the catabolism and deposition (retention) of amino acids (protein) by the fish. Amino acid composition of the diet is a factor with a determinant effect on DNW. Feeding amino acids in excess of requirement will result in the catabolism of the amino acid with associated excretion of ammonia and loss of energy. Diet formulated with protein sources of poorer amino acid profile will result in lower digestible nitrogen retention efficiency and greater DNW. Another key factor is the balance between digestible protein (DP) and digestible energy (DE) of the diet (DP/DE ratio). Decreasing the dietary DP/DE ratio, by increasing dietary non-protein energy content, results in an increase in nitrogen retention efficiency and a decrease in DNW of numerous fish species. The improvement in N retention and decrease in N excretion is due to

Proceedings of the Canadian Freshwater Aquaculture Symposium – Aquaculture Canada 2004
AAC Spec. Publ. No. 11 (2006) 51
the utilization of non-protein energy sources for meeting energy requirements, resulting in a reduction of catabolism of amino acid, in what is commonly referred to as “protein sparing”. Protein-sparing by dietary lipids has been shown to occur in most fish species. Protein-sparing by digestible carbohydrate such as gelatinized starch has also been demonstrated but may be limited especially when the diet already contains a high level of lipids or a relatively low DP/DE ratio. Overall experimental data suggest that DP/DE ratio of about 18 g/MJ effectively reduces amino acid catabolism (and consequently DNW) without affecting growth rate and feed efficiency of salmonid fish species. 2) Use of Feed Additives Numerous studies have shown that dietary incorporation of microbial phytase improved the apparent digestability coefficient (ADC) of P of fish fed diets containing phytic acid. The activity of this enzyme is affected by environmental temperature and its activity may be limited at low water temperatures (6). The use of phytase only makes sense for diets with digestible P contents below the requirement of the fish and containing significant levels of plant ingredients, i.e. in which indigestible P is mostly phytate-P. Dietary supplementation of citric acid, Na citrate, and EDTA was able to improve fish meal P digestibility in rainbow trout (7). The effect was probably due to the solubilization of bone minerals in fish meal, as well as a chelating effect that reduces the antagonistic interaction between Ca and P that could precipitate Ca and P at the intestinal brush border. Vielma and Lall (8) utilized formic acid 4 and 10 ml/kg in diet to significantly improve phosphorus digestibility from 70% to 74%, 75% for fish meal based diet. Vielma et al. (9) found that supplementing citric acid 4, 8, 16 g/kg diet to 28% of herring bone meal linearly increased body ash concentration but had no significant effect on body P concentration. They cautioned the use of acidified diets because of the possible disturbance of acid-base balance and mineral homeostasis. More research is warranted in this aspect. Non-starch polysaccharides (NSP) degrading enzymes can help improve digestibility of feed nutrients and potentially reduce solid and P waste outputs. Various commercially available enzymes and organic acids that have been shown to effectively improve digestibility of
organic matter (NSP, protein) and P in monogastric animals (e.g. poultry and swine). Their effectiveness and usefulness for salmonid fish, however, are far from conclusive, probably due to the fact that most salmonid fish feed ingredients are generally low in NSP and already very highly digestible. Another approach, suitable for certain types of operations (e.g. land-based farms), could be modifying the composition of the feed to allow better recovery of solid wastes during treatment of effluents (e.g. settling ponds, filters, etc.). Recent study has shown that low incorporation levels (0.1 to 0.3%) of guar gum in feed greatly improved stability and settling characteristics of fecal material egested by rainbow trout, thereby facilitating recovery of solid wastes from land-based farm effluents (10). 3) Processing - Refining of Ingredients Simple processing of common ingredients, such as air classification or elutriation of fish meal, meat and bone meal, poultry by-products meal, or plant products (pea, canola, soybean) to reduce ash, starch, and NSP contents of these ingredients, have also been used as an effective yet economical approach to producing feeds resulting in lower waste outputs. More advanced processing of plant proteins to produce highly digestible, low-phytate P, plant protein concentrates is also a very effective method to ultimately reduce solid, N and P wastes produced by feeding. However, these plant protein concentrates are relatively expensive at this point in time and their use in formulation can increase the cost of the feed. Work is currently underway to develop more economical methods of producing these concentrates. References 1. Cho CY, Bureau DP. 1997. Reduction of
waste output from salmonid aquaculture through feeds and feeding. Prog. Fish-Cult. 59: 155-160.
2. Cho CY, Bureau DP. 2001. A review of diet formulation strategies and feeding systems to reduce excretory and feed wastes in aquaculture. Aquacult. Res. 32: 349-360.
3. Rodehutscord M. 1996. Response of rainbow trout (Oncorhynchus mykiss) growing from 50 to 200 g to supplements of dibasic sodium phosphate in a semipurified diet. J. Nutr.126: 324-331.

Proceedings of the Canadian Freshwater Aquaculture Symposium – Aquaculture Canada 2004
52 AAC Spec. Publ. No. 11 (2006)
4. Hua K. 2005. Modeling Phosphorus Utilization in Salmonid Fish Species. Ph. D. Thesis. University of Guelph, Guelph, Canada.
5. Cho CY, Hynes JD, Wood, KR, Yoshida, HK. 1994. Development of high nutrient-dense, low pollution diets and prediction of aquaculture wastes using biological approaches. Aquacult. 124: 293-305.
6. Forster I, Higgs DA, Dosanjh BS, Rowshandeli M, Parr J. 1999. Potential for dietary phytase to improve the nutritive value of canola protein concentrate and decrease phosphorus output in rainbow trout (Oncorhynchus mykiss) held in 11 °C fresh water. Aquacult. 179: 109-125.
7. Sugiura SH, Dong FM, Hardy RW. 1998. Effects of dietary supplements on the availability of minerals in fish meal; preliminary observations. Aquacult. 160: 283-303.
8. Vielma J, Lall SP. 1997. Dietary formic acid enhances apparent digestibility of minerals in rainbow trout, Oncorhynchus mykiss (Walbaum). Aquac. Nutr. 3: 265-268.
9. Vielma J, Ruohonen K, Lall, SP. 1999. Supplemental citric acid and particle size of fish bone-meal influence the availability of minerals in rainbow trout Oncorhynchus mykiss (Walbaum). Aquac. Nutr. 5: 65-71.
10. Brinker A, Koppe W, and Röscha R. 2005. Optimized effluent treatment by stabilised trout faeces. Aquacult. 249: 125-144.

Proceedings of the Canadian Freshwater Aquaculture Symposium – Aquaculture Canada 2004
AAC Spec. Publ. No. 11 (2006) 53
Phosphorus and Feeding Fish: Issues and Perspectives Grant W. Vandenberg and Gabriel Koffi D. Koko Département des sciences animales, Pavillon Paul Comtois, Université Laval, Ste-Foy, Québec Canada G1K-7P4 The goal of freshwater aquaculture producers is to produce high quality, nutritious products in a profitable manner while respecting legislative guidelines related to, amongst other issues, those associated with limits on effluent nutrient discharge. The environmental impact of freshwater fish farms is the subject of increasing attention in several provinces, and among various levels of government. Environmental concerns account in part for the halt in the expansion of the aquaculture industry in Ontario. In Québec, new guidelines related to nutrient output from fish farms limit the growth of aquaculture production. It is likely that other provinces will have to deal with the same issues in the short or medium term. Nutrients and solid faecal matter are perceived as being the main causes of environmental problems stemming from commercial freshwater fish farms; given that these products are largely feed-derived, commercial formulations taking into account waste output have been developed over the past decade. Formulation of such rations is a complex interplay between dietary requirements, nutrient bioavailability from a range of ingredients, and ingredients cost and availability, all of which can vary over time and must be understood for differing output parameters (i.e organic matter, phosphorus output as the main concerns in freshwater production settings). Add to this the key issue of least-cost formulation, and the result is an increasingly challenging equation for nutritionists formulating diets for freshwater fish. Introduction All food-producing sectors are currently facing problems of environmental degradation and increasing pressure on land and water resources. In particular, the intensive agricultural sector is encountering increasing competition for water resources from industrialization and urbanization, and from growing requirements for safe drinking water supplies (1). During the last decade, issues such as sustainable development, environmental interactions and long-term sustainability of aquaculture have received increasing attention at local, national and international levels (2). The negative impacts of aquaculture have been related mainly to high-input, high-output intensive production (e.g., culture of salmonids in raceways and cages), the effects of which include the misapplication of chemicals, collection of seed from the wild and introduction of exotic species (3). Furthermore, the direct effect of feeding aquatic organisms in this manner results in nutrient and organic enrichment of recipient waters, resulting in build-up of anoxic sediments, changes in benthic communities and the eutrophication of adjacent water bodies (4). In freshwater culture facilities, phosphorus discharge from aquaculture
production has been cited as particularly problematic given that it is the factor limiting algae growth; its presence initiates the chain of events leading the eutrophication phenomenon (5). Phosphorus Phosphorus (P) is an essential element in all living systems. Phosphorus is involved in many critical biological processes, including reproduction, growth, and development and it provides a key element to the framework of many organisms. Phosphorus is a component of deoxyribonucleic and ribonucleic acids (DNA and RNA, respectively) and adenosine di- and triphosphate (ADP and ATP, respectively) which are involved in the transfer of high energy-P as well as that of low energy-P bonds of glucose-6-phosphate and glycerol phosphate during energy metabolism. Phosphorus is a component of membrane-forming phospholipids, is a cofactor in a number of enzyme systems involved in carbohydrate, fat and amino acid metabolism, is a major intracellular buffer, and is involved in overall body acid-base balance (6). A variety of forms of inorganic phosphate play critical roles in the formation of the structural framework providing support to a wide variety of organisms.

Proceedings of the Canadian Freshwater Aquaculture Symposium – Aquaculture Canada 2004
54 AAC Spec. Publ. No. 11 (2006)
Sources of Phosphorus Pollution Increased trophic status of water bodies resulting from P enrichment is not a new phenomenon. During the 1960’s, this problem was first observed in the Great Lakes regions, followed later by additional reports of P enrichment of freshwater bodies in Western Europe. The demonstration of nutrient loading-trophic level relationship (7) permitted corrective measures to be developed, including the diversion of sewage water, construction of sewage treatment plants, and the widespread reduction or outright ban of phosphates in detergents (8). Although these measures did reduce the trophic level of many water bodies, others were less responsive to point P source (i.e., discriminate source) controls, likely as a result of relatively large and growing non-point-source (i.e., diffuse source) inputs. Since this time, additional point-source P contributors continue to be identified and controlled. Furthermore, strict controls have been put in place or proposed for non-point P sources, including those directed toward the contribution of agriculture to overall P loading (9). This is particularly challenging, as non-point P sources are far more complex and difficult to control than point sources of P. Terrestrial Agriculture and Phosphorus Loading The contribution of agriculture to non-point P sources is difficult to quantify, as it requires knowledge related to background P losses (from natural and atmospheric inputs), as well as the understanding of complex issues including overall balance of P inputs, site characteristics and soil properties (9). Furthermore, mathematical models employed to evaluate per capita agricultural P contribution tend to overestimate its impact. For example, the contribution of livestock tends to dominate a P budget for a given area, as the potential P losses are considerable, whereas the actual losses are often a fraction of this potential (10). Small differences in assumed fractional loss significantly affect calculated P contribution from animal production. Clearly however, agriculture is a major contributor to overall P loss, and its impact has been amplified with increasing intensification of production systems. This observation is particularly relevant in agricultural systems dominated by animal production, which has a major influence on overall P efficiency, the magnitude of P surplus, soil P accumulation, and subsequent catchment losses (11).
Contribution of Aquaculture to Phosphorus Loading The rapid expansion and intensification of the aquaculture industry over the past 20 years has brought about increasing concerns related to its environmental impact. Effluent from aquaculture production contains a number of waste products, including chemicals used in production (therapeutics, disinfectants, antifoulants etc.), metabolic wastes, and those from uneaten feed and feces (3). The release of organic matter, nitrogenous compounds and P from production sites has received particular attention, due to their potential to affect water quality in receiving water bodies. For the reasons outlined above, effluent P is particularly problematic in freshwater or brackish water environments. A number of studies have summarized the release of P resulting from aquaculture production using different culture methods and compared P loss from other point and non-point sources (4,12). Of particular note is the relatively small contribution that aquaculture makes to the overall P budget within a given geographical area. Enell (12) calculated that in 1994, combined aquaculture production in Sweden, Finland and Denmark was responsible for only 0.3% of the total P load in these countries, equivalent to 3% of that attributed to total background P losses from natural and atmospheric inputs. Severe nutrient enrichment of the Baltic Sea has prompted governments in many Nordic countries to take action and reduce P loading from all sources (13). These countries have lead the way in developing strategies to reduce P loading from aquaculture; from the period of 1979-1994, the typical P content in the feed has been reduced by 59% and the P load decreased from 31 to 4.8 kg P excreted per tonne fish produced (12). Phosphorus in Fish Nutrition Phosphorus is an essential macro-mineral for all fish species. As in higher vertebrates, P plays a key role in a variety of biological processes, including development, growth and reproduction. Given its physiological importance, P is found throughout the body, and ranks second only to calcium in abundance in the tissues of bony fish (14). Phosphorus is found mainly in fish bone, accounting for 86-89% of the total body P, and found mainly as calcium phosphate and hydroxyapatite (15). Bone acts as the principle P reservoir, although P is ubiquitous, being found in

Proceedings of the Canadian Freshwater Aquaculture Symposium – Aquaculture Canada 2004
AAC Spec. Publ. No. 11 (2006) 55
cells and extracellular fluids as organic phosphoric acid esters, phosphoproteins, phospholipids, and inorganic phosphate ions (16). Fish scales represent another important site of P deposition, where as with bony tissue, P is complexed with calcium (17). The majority of phosphorus required by fish is derived from dietary sources. Although the uptake of 32P from the water has been documented (18), this route provides only a minor proportion of required P. In most monogastrics, the majority of P is absorbed in the jejunum; the P absorption capacity decreases along the length of the intestinal tract (19). Although the duodenum has a relatively high P absorptive potential, the residence time of the digesta in this segment is limited, thus the contribution of this region to overall P absorption is relatively minor (20). Profile of Phosphorus Excretion Despite the significant reduction of P loading from aquaculture, fish P retention remains relatively low. P retention estimates as high as 55% have been reported (21), although a summary of work done in this area (14) shows that P retention rarely exceeds 30% under practical conditions. Variation of P retention between studies can be attributed to differences in diet composition (P level and bioavailability, digestible energy) and the size and physiological status of the fish (22). Non-assimilated phosphorus in the feces represents 40-50% of that supplied by the diet with 60-80% being in of particulate form (23). Approximately 20% of the dietary P is excreted by the kidneys, but can account for over 90% of the unretained P excreted as inorganic phosphate (14). An important potential source of P is that found in uningested feed, which is particulate in nature, but may represent an important factor in the accounting of P loss from feeding fish (24). Practical Aspects of Phosphorus Nutrition Over the past two decades, increasing concerns over excessive P loading have resulted in a large number of studies aimed at better understanding issues related to phosphorus output from aquaculture production. Given that undigested, un-utilized and wasted feeds are the sole sources
of waste-derived P, a large body of work related to nutritional issues has resulted in increased understanding of the role of P in physiological processes. In particular, much effort has been directed toward defining the P requirements for a range of cultured fish species. As well, the development of nutrient-dense diets and replacement of fishmeal with ingredients containing lower levels of P has permitted the formulation of diets that approach the P requirements to a greater degree. These developments, together with technological advances in feeding systems and those that remove uningested feed and feces from effluent water, have greatly reduced the release of P in effluent from aquaculture facilities. Nutritional Requirement of Phosphorus Specific nutrient requirements are determined using empirical methods involving feeding purified or semi-purified diets that are nutritionally complete apart from the nutrient under study. The supplementation of the basal diet with highly available nutrient concentrates permits the formulation of diets with increasing levels of a particular nutrient. Predetermined criteria are followed during a subsequent feeding trial and the response to increasing levels analyzed to determine the required dietary level. To date, only one study has attempted using a factorial approach (25); calculation of P requirement using a factorial model incorporating measurements of P availability, feed efficiency and normal whole-body P concentration resulted in a significantly higher P requirement that previously reported (25). Further work in this area will result in more appropriate models to estimate P requirements. The nutritional requirements for P have been reported for many economically-important aquatic species; Table 1 provides a brief summary of the methodologies and results of these studies. Whereas initial studies on P requirements were aimed at determining inclusion levels to avoid the development of P deficiency, more recent studies have been undertaken to minimize the level of dietary P inclusion and limit P excretion from culture facilities.

Proceedings of the Canadian Freshwater Aquaculture Symposium – Aquaculture Canada 2004
56 AAC Spec. Publ. No. 11 (2006)
Table 1: Summary of experiments evaluating the nutritional requirements of P (g·kg-1 DM) in a number of cultivated fish species. Req (%) Species Source2 Mass (g) G:F3 Response4 Analysis5 Ref. 3.7-5.6 RT NaP 50 1.1 1,2,3,4,5,7,8 REG A 3.4-5.4 RT NaP 35 1.0 1,3,6,7 ANOVA B 7-8 RT K2P+NaP 1.2 1.1 1,6,7 BL C 4.1 RT NaP 390 1.0 8 REG D 4.0 CF NaP 6 1.1 1,3,4,6 ANOVA E 8 CF CaP 6 0.99 1,3,6 ANOVA F 8 CF NaP 1.8 - 1,6 ANOVA G 6-7 C K2P+NaP 5 0.8 1,3,6 BL H 6 C NaP 34 0.9 1,2,3,5 ANOVA I 6 AS CaP 6.5 0.5 1,3,6 ANOVA J 6 AS K2P+NaP 57 0.9 1,3,4,6,8 ANOVA K 5.6 AS CaP2 15 0.9 1,3,4,7,8 REG L 10 AS CaP2 1.4 1.45 7 REG M 5 TIL NaP 0.8 0.52 1,2,6 ANOVA N 5 SB KP 10-20 0.6 1,3,6,8 REG O 5.8 SB KP 48 0.7 1,3,6,7 BL P
1Species: RT: rainbow trout (Oncorhynchus mykiss); CF: catfish (Ictalurus punctatus); C: carp (Cyprinus carpio); AS: atlantic salmon (Salmo salar) ; TIL: tilapia (Oreochromis niloticus); SB: striped bass (Morone chrysops x M. saxatilis). 2Source of P: NaP: sodium phosphate monobasic; KP: potassium phosphate monobasic; K2P: potassium phosphate dibasic; CaP2: calcium phosphate monobasic; CaP: calcium phosphate dibasic. 3Wet mass gain/feed intake (as is basis). 4Response variable 1: gain; 2: feed intake; 3: feed efficiency; 4: plasma inorganic phosphorus; 5: P retention; 6: scale and bone ash 7: bone or carcass P; 8 other variables. 5Analysis: REG: regression; ANOVA: analysis of variance; BL: broken line 6Reference: a: (26) ; b: (27) c: (28) ; d: (29) ; e: (30); f: (31) ; g: (32) ; h: (33) i: (34) ; j: (35) ; k: (36) ; l: (37) ; m: (25) ; n: (38) ; o: (39) ; p: (40). Bioavailability and Sources of Dietary Phosphorus The bioavailability of a nutrient is defined as the fraction of intake that is absorbed by the intestine and made available for metabolic use or tissue storage (41). Most of the required minerals are partially supplied by dietary ingredients, although the bioavailability of many minerals varies greatly. Depending on the mineral availability and the particular species requirement, some macro- and micro-minerals are provided as supplements, the bioavailability of which may also vary. Thus it is important to have specific information on the absolute or relative bioavailability of minerals in feedstuffs and supplements in order to accurately meet dietary requirements. Phosphorus bioavailability in monogastric diets has received particular attention in recent years, and has been evaluated using a variety of techniques, including balance methods that provide information related to absolute absorption or retention, relative
bioavailability versus a reference source, and in vitro tests of P solubility. Factors Affecting Phosphorus Bioavailability The bioavailability of dietary P ultimately depends on its form and origin; that from mineral and animal sources shares common constraints, whereas P from plant-protein ingredients has distinct characteristics affecting P bioavailability. Phosphorus from mineral and animal origin are generally inorganic, and their bioavailability for terrestrial monogastrics is largely related to their solubility (42). Similar trends are observed in salmonids; sodium and potassium phosphate salts are essentially completely available (43), with decreasing bioavailability for less soluble salts of calcium phosphate (availability of monocalcium phosphate > dicalcium phosphate > tricalcium phosphate (15)). More complex forms of Ca-P, such as hydroxyapatite found in bone are sparingly available (44). As the proportion of bone meal in the diet increases, there is a concomitant

Proceedings of the Canadian Freshwater Aquaculture Symposium – Aquaculture Canada 2004
AAC Spec. Publ. No. 11 (2006) 57
decrease in apparent P digestibility (45) and P retention (46). Important species differences exist related to calcium phosphate availability, as agastric species, such as carp, are observed to have a low capacity to retain P from mineral (44) and bone (47) sources of calcium phosphate, likely due to the lack of gastric acid secretion. The effect of gastric acidity on increasing mineral bioavailability has been previously linked to regulation of the chelation and complex formation of the element and by altering mineral transport mechanisms (48). A number of recent studies have reported that apparent P digestibility and retention from diets containing complex forms of inorganic calcium phosphate increased as a result of dietary supplementation with citric (46,47) or formic (49) acid, the effect of which was duplicated by reducing the particle size of fish bone-meal from 350 µm to <60 µm (46). Sugiura et al. (47) also reported that addition of sodium bicarbonate, thus increasing gastric pH, reduced the apparent digestibility of P in a fish meal-based diet. Therefore, by decreasing the gastric pH and increasing the surface area of the P source, certain P fractions can be more effectively solubilized and bioavailability increased. In plant-protein sources, between 40-90% of the phosphorus is found bound to phytate (50), an organic complex that renders P unavailable to monogastric animals due to the lack of endogenous phytase activity required to hydrolyse phytate-bound P (51). Phytate-P is sparingly available to fish (44); phytate also decreases the availability of a number of other essential minerals (52,53). Exogenous microbial phytase added to the feed containing phytate-P has been successfully used to improve P bioavailability in a variety of terrestrial monogastrics, and more recently incorporated in diets of a number of aquatic animals with varying degrees of success (54). Strategies for Reduced Phosphorus Loading Excess P loading from aquaculture production arises uniquely from the feed, either as uningested feed or unassimilated and excreted fractions. This fact provides a clear opportunity in that it limits, and thereby simplifies the possible approaches to address the problem. To date, strategies to reduce P loading from aquaculture have centred on technologies that improve production efficiency or reduce feed waste, those that remove the solid and dissolved fractions of waste P from effluent water, and finally nutritional strategies that reduce
P at its source using a number of approaches to improve P bioavailability and retention. Technological Development Improved Feeding Systems A variety of approaches based on bioengineering and biotechnological strategies have been developed as means to reduce waste load from aquaculture. The use of automatic feeders designed to control distribution by detecting uneaten feed using hydroacoustic probes coupled to a microprocessor control assembly (55) is designed to distribute feed to the point of near satiation, while minimizing feed wastage. Related developments attempt to match feed distribution to species-specific diet and seasonal variations in feeding behaviour to maximize growth and reduce uneaten feed (56). Improved Solid and Dissolved Waste Removal Effluent water from land-based aquaculture facilities suffers from two major constraints: low concentration of potential pollutants and high flow rates (57,58). Treatment of effluent water to concentrate and remove particulate and dissolved P forms has been widely studied, and a number of technologies developed for domestic water treatment facilities have been adapted. A variety of mechanical technologies to remove suspended solids can be divided into those providing mechanical separation (stationary, rotary and vibrating screens, media filtration), sedimentation strategies (sedimentation tanks/ponds, swirl separators, lamella separators) alone or in combination with flocculation (59). Removal of dissolved forms of phosphorus is particularly problematic given their low concentrations in the effluent. Approaches to remove dissolved P using biological (60,61) or chemical (62) processes have been reported. Many of these technologies are subject to high initial capital investment, difficulty in controlling critical operational parameters (63), and are not applicable for cage culture operations (59).

Proceedings of the Canadian Freshwater Aquaculture Symposium – Aquaculture Canada 2004
58 AAC Spec. Publ. No. 11 (2006)
Nutritional Strategies A fundamental and key aspect to any waste management plan is its reduction at the source. Lall (15) proposed several aspects related to nutritional approaches to reduce P output from aquaculture including: decreased feed wastage, improved feed efficiency, inclusion of feed ingredients with high P bioavailability, reduction of P in feeds without affecting fish growth and production efficiency. High Nutrient-Dense Diets The formulation of high nutrient dense (HND) diets involves the selection of highly-digestible ingredients and elimination of those having low digestibility, energy and protein levels such as grain by-products rich in complex carbohydrates (64). This together with the selection of ingredients having low P contents along with properly balanced protein and energy rations results in highly-digestible diets promoting high growth rates, feed efficiency and reduced waste production, in terms of solids, and solid and soluble nitrogen and phosphorus. Cho and Bureau (65) reported that using a HND diet results in 30% less P waste (solid and dissolved fractions) than when a practical diet was fed to rainbow trout. As well, feed efficiency is significantly improved by feeding these diets, which would offset increased feed costs as a result of higher inclusion of high-quality ingredients. The formulation of HND diets is more costly on per kg basis, as higher nutrient dense (and higher cost) ingredients are employed, however the improved growth performance and reduced nutrient discharge as result of feeding justifies the use of these diets. Low-Phosphorus Diets Diets for salmonid fish species have traditionally been formulated to contain high levels of fish meal and other sources of animal by-products. These ingredients, while being highly digestible in terms of protein and energy (43,66), may also contain elevated levels of P, often complexed with calcium (hydroxyapatite), which is poorly available. Sugiura (45) reported that graded levels of fish bone meal fed to rainbow trout at dietary levels as low as 2%, resulted in a linear decrease in the apparent availability of a host of minerals including P. However, a number of animal by-products have been shown to have relatively high P apparent digestibility coefficients (ADCs), including blood meal, feather meal and low ash fish meal
and poultry by-product meal (67). The replacement of fish meal by blood meal was reported to support high growth rates in rainbow trout and significantly improve P retention (68). The ability of feather meal to replace up to 15% of the dietary fish meal (69), coupled with its low level of P versus other animal protein sources, indicates that it is a good candidate for inclusion in low-P diets. Removal of the bone-derived fraction of fish meal by mechanical deboning equipment (70) or of meat and bone meal by air-classification (66) effectively lowers the P and ash levels in these sources, resulting in significantly improved P bioavailability. Inclusion of Plant-Derived Protein The replacement of high phosphorus fish meal in rations with plant protein-based ingredients using a variety of oilseed, legume and processing byproduct sources (71,72,73) has been proposed as an approach to reduce dietary phosphorus levels. However, these plant protein sources suffer from the presence of specific antinutritional factors (74), in particular, phytate, which represents 50-90% of the P found in plant protein sources (75). Phytate-bound nutrients are largely unavailable to monogastric animal species, which lack sufficient activity of endogenous phytase to liberate phytate-P (51). Furthermore, the phytate molecule, being negatively charged, also forms complexes with a variety of divalent cations and proteins, leading to reduced digestibility of a number of additional essential nutrients. Phytate-protein interactions may decrease protein availability directly by association with dietary protein and/or indirectly through binding to proteolytic enzymes. The addition of microbial phytase significantly increases P digestibility in domestic monogastric species; the addition microbial phytase increased up to 3-fold, the P digestibility of a practical swine diet (76). Similar increases in P availability following phytase supplementation have been reported in a variety of monogastric species, resulting in consistent and significant increases in P digestibility. The effect of phytase on P availability has been evaluated in a number of fish species, following pretreatment of ingredients with phytase (77) or direct addition to non-salmonid (77) and salmonid (78,79) diets. One major issue in evaluating the potential of phytase to affect nutrient availability in fish species (particularly carnivorous species) lies in the confounding effects of plant protein replacement of animal protein ingredients. The ability to remove the confounding effects of animal protein

Proceedings of the Canadian Freshwater Aquaculture Symposium – Aquaculture Canada 2004
AAC Spec. Publ. No. 11 (2006) 59
replacement lies in the careful choice of high quality, highly-digestible plant protein sources, so as to limit potential important interactions. The use of purified or semi-purified diets with added purified phytate may offer an alternative to more accurately understand the fundamental impacts of phytase supplementation to these species. For certain fish species fed plant protein-based diets supplemented with mineral phosphates (e.g., catfish, tilapia and carp) in an intensive or semi-intensive production setting, the utilization of phytase is immediately applicable, particularly those raised in temperate or warm water, given the influence of water temperature on phytase activity (In salmonid species, the use of phytase in practical diets has been questioned (65). These authors correctly argue that most commercial salmonid diets contain low levels of phytate-phosphorus and quantities of available phosphorus above the dietary requirement. Therefore, the inclusion of phytase is not warranted and in fact, would serve to make available phosphorus for absorption above the animal’s requirement (which would be excreted as soluble phosphorus) or possibly increase leaching potential of unassimilated P from the feces. However, as phosphorus level of the diet is decreased and the degree for fish meal substitution by plant proteins containing phytate increases, so does the potential for the judicious use of microbial phytase addition to these diets. Conclusions Irrespective of all of the above-mentioned strategies, successful nutritional approaches to reduce nutrient output originating from the culture of fish should revolve around basic concepts governing fundamental principles of nutrition. This includes careful formulation of diets that match the well-defined nutritional requirements of the animal. This combined with the utilization high quality and highly-digestible ingredients will result in diets that promote optimal growth rate, feed efficiency and result in minimal phosphorus excretion. Nutritional strategies must, of course, be one aspect of an overall strategy to reduce P coming from fish culture facilities, which includes coupling sound nutritional approaches with technologies that minimize feed waste and those that remove solids and treat the effluent to remove particulate and dissolved phosphorus. Adoption of these strategies, however, often imposes a financial burden; thus, market forces are frequently the determining factor to their implementation.
References 1. FAO. 1997a. Aquaculture Economics in
Developing Countries, FAO, Rome. 2. Pillay, TVR. 1996. The challenges of
sustainable aquaculture. World Aquaculture 27, 7-9.
3. Pillay, TVR. 1992. Aquaculture and the environment. Halsted Press, New York.
4. Ackefors, H, Enell, M. 1994. The release of nutrients and organic matter from aquaculture systems in Nordic countries. J. Appl. Icthyol. 10, 225-241.
5. Correll, DL. 1998. The role of phosphorus in the eutrophication of receiving water: a review. J. Environ. Qual. 27, 261-266.
6. Brody, T. 1999. Nutritional biochemistry. Academic Press, San Diego.
7. Vollenweider, RA. 1968. The scientific basis of lake eutrophication, with particular reference to phosphorusand nitrogen as eutrophication factors, OECD, Paris. pp. 159.
8. Cullen, P, Forsberg, C, 1988. Experiences with reducing point sources of phosphorus to lakes. Hydrobiologia 170, 321-336.
9. Sharpley, AN, Rekolainen, S. 1997. Phosphorus in agriculture and its environmental implications. In: Tunney, H, Carton, OT, Brookes, PC, Johnston, AE (Eds.), Phosphorus: Loss From Soil to Water, CAB International, New York, pp. 1-54.
10. Gibson, CE. 1997. The dynamics of phosphorus in freshwater and marine environments. In: Tunney, H, Carton, OT, Brookes, PC, Johnston, AE (Eds.), Phosphorus Loss from Soil to Water, CAB International, New York, pp. 119-136.
11. Sharpley, A, Foy, B, Withers, P. 2000. Practical and innovative measures for the control of agricultural phosphorus losses to water: An overview. J. Environ. Qual. 29, 1- 9.
12. Enell, M. 1995. Environmental impact of nutrients from nordic fish farming. Wat. Sci. Tech. 31, 61-71.
13. Persson, G. 1991. Eutrophication resulting from salmonid fish culture in fresh and salt waters: Scandinavian experiences. In: Cowey, C. B., Cho, C.Y. (Eds.) Nutritional strategies and Aquaculture Waste, Guelph, Ontario, Canada, pp. 163-185.
14. Dosdat, A. 1992. L'excrétion chez les poissons téléostéens II- le phospohre. La pisciculture française 109, 18-29.
15. Lall, SP. 1991. Digestibility, metabolism and excretion of dietary phosphorus in fish. In: Cowey, CB, Cho, CY (Eds.) Nutritional

Proceedings of the Canadian Freshwater Aquaculture Symposium – Aquaculture Canada 2004
60 AAC Spec. Publ. No. 11 (2006)
strategies and Aquaculture Waste, Guelph, Ontario, Canada, pp. 21-36.
16. Shearer, KD. 1984. Changes in elemental composition of hatchery-reared rainbow trout (Salmo gairdneri) associated in growth and reproduction. Can. J. Fish. Aquat. Sci. 41, 1592-1600.
17. Lall, SP. 1989. The minerals. In: Halver, J E (Ed.), Fish Nutrition, Second Edition, Academic Press, New York, pp. 219-257.
18. Coffin, CC, Hayes, FR, Jodrey, LH, Whiteway, SG. 1949. Exchange of materials in a lake as studied by the addition of radioactive phosphorus. Can. J. Res. 27, 202-222.
19. Barlet, JP, Davicco, MJ, Coxam, V. 1995. Physiologie de l'absorption intestinal du phosphore chez l'animal. Reprod. Nutr. Dev. 35, 475-489.
20. Schroeder, B, Breves, G, Rodehutscord, M. 1996. Mechanisms of intestinal phosphorus absorption and availability of dietary phosphorus in pigs. DTW Deutsche Tieraerztliche Wochenschrift 103, 209-214.
21. Azevedo, PA, Cho, CY, Leeson, S, Bureau, DP. 1998. Effects of feeding level and water temperature on growth nutrient and energy utilization and waste outputs of rainbow trout (Oncorhynchus mykiss). Aquat. Living Resour. 11, 227-238.
22. Wiesmann, D, Scheild, H, Pfeffer, E. 1988. Water pollution with phosphorus of dietary origin by intensively fed rainbow trout (Salmo gairdneri Rich.). Aquaculture 69, 263-270.
23. Cripps, S, Bergheim, A. 2000. Solids management and removal for intensive land-based aquaculture production systems. Aquacult. Eng. 22, 33 - 56.
24. Garcia-Ruiz, R, Hall, GH. 1996. Phosphorus fractionation and mobility in the food and feces of hatchery reared rainbow trout (Oncorhynchus mykiss). Aquaculture 145, 183-193.
25. Åsgård, T. Shearer, KD. 1997. Dietary phosphorus requirement of juvenile Atlantic salmon, Salmo salar L. Aquacult. Nutr. 3, 17-23.
26. Rodehutscord, M., 1996. Response of rainbow trout (Oncorhynchus mykiss) growing from 50 to 200 g to supplements of dibasic sodium phosphate in a semipurified diet. J. Nutr. 126, 324-331.
27. Ketola, HG, Richmond ME. 1994. Requirement of rainbow trout for dietary phosphorus and its relationship to the amount discharged in hatchery effluents. Trans. Am. Fish. Soc. 123, 587-594.
28. Ogino, C., Takeda, H., 1978. Requirements of rainbow trout for dietary calcium and phosphorus. Bull. Jap. Soc. Scient. Fish. 44, 1019-1022.
29. Sugiura, S., Dong, F., Hardy, R., 2000b. A new approach to estimating the minimum dietary requirement of phosphorus for large rainbow trout based on nonfecal excretions of phosphorus and nitrogen. J. Nutr. 130, 865 - 872.
30. Wilson, RP. Robinson, EH. Gatlin, DM. III, Poe, .E. 1988. Dietary phosphorus requirement of channel catfish. J. Nutr. 112, 1197-1202.
31. Andrews, JW. Murai, T., Cambell, C., 1973. Effects of dietary calcium and phosphorus on growth, food conversion, bone ash and hematocrit leves of catfish. J. Nutr. 103, 766-771.
32. Lovell, RT., 1978. Dietary phosphorus requirement of channel catfish (Ictalurus punctatus). Trans. Am. Fish. Soc. 107, 617-621.
33. Ogino, C., Takeda, H., 1976. Mineral requirements in fish. III- Calcium and phosphorus requirements in carp. Bull. Jap. Soc. Scient. Fish. 42, 793-799.
34. Kim, JD., Kim, KS. Song, JS. Kang, MW. Lee, SB., Yoon, KS. Jeong, KS. 1996. Dietary phosphorus requirement of juvenile Israeli carp (Cyprinus carpio) of 34g fed practical diets. Korean J. of Anim. Nut. Feed. 20, 489-496.
35. Ketola, HG. 1975. Requirement of Atlantic salmon for dietary phosphorus. Treans. Am. Fish. Soc. 104, 587-594.
36. Lall, SP., Bishop, F.J., 1977. Studies on mineral and protein utlization by Atlantic salmon grown in sea water. Tech. Rep. Fish. Mar. Serv. Dev. No. 688, 1-16.
37. Vielma, J., Lall, SP., 1998a. Control of phosphorus homeostasis of Atlantic salmon (Salmo salar) in fresh water. Fish. Physiol. Biochem. 19, 83-93.
38. Robinson, E.H., Labomascus, D., Brown, P.B., Linton, TL. 1987. Dietary calcium and phosphorus requirements of Oreochromis aureus reared in calcium-free water. Aquaculture 64, 267-276.
39. Brown, ML, Jaramillo, FJ. Gatlin, DM., III, 1993. Dietary phosphorus requirement of juvenile sunshine bass, Morone chrysops female X Morone saxatilis male. Aquaculture 113, 355-363.
40. Dougall, DS, Woods, LC., Douglass, LW., Soares, J.H., 1996. Dietary phosphorus

Proceedings of the Canadian Freshwater Aquaculture Symposium – Aquaculture Canada 2004
AAC Spec. Publ. No. 11 (2006) 61
requirement of juvenile striped bass Morone saxatilis. J. World Aquacult. Soc. 27, 82-91.
41. Kotb, AR, Luckney, TD. 1972. Markers in nutrition. Nutr. Abs. Rev. 42, 814-845.
42. Soares, JH. 1995. Phosphorus bioavailability. In: Ammerman, CB, Baker, DH, Lewis, AJ (Eds.), Bioavailability of Nutrients for Animals, Academic Press, New York, pp. 257-294.
43. NRC. 1993. Nutrient Requirements of Fish. National Academy Press, Washington, D.C.
44. Ogino, C, Takeuchi, L, Taheda, H, Watanabe, T. 1979. Availability of dietary phosphorus in carp and rainbow trout. Bull. Jpn. Soc. Sci. Fish. 45, 1527-1532.
45. Sugiura, SH. 1998. Development of Low-pollution Feeds for Sustainable Aquaculture, Ph.D. thesis, University of Washington, Seattle, WA.
46. Vielma, J., Ruohonen, K., Lall, S., 1999b. Supplemental citric acid and particle size of fish bone-meal influence the availability of minerals in rainbow trout Oncorhynchus mykiss (Walbaum). Aquacult. Nutr. 5, 65 - 71.
47. Sugiura, SH, Dong, FM, Hardy, RW. 1998a. Effects of dietary supplements on the availability of minerals in fish meal; preliminary observations. Aquaculture 160, 283-303.
48. Cross, HS, Debeic, H, Peterlik, M. 1990. Mechanism and regulation of of intestinal phosphate absorption. Miner. Electrolyte Metab. 16, 115-124.
49. Vielma, J, Lall, SP. 1997. Dietary formic acid enhances apparent digestibility of minerals in rainbow trout, Oncorhynchus mykiss (Walbaum). Aquacult. Nutr. 3, 265-268.
50. Ravindran, V, Ravindran, G, Sivalogan, S. 1994. Total and phytate phosphorus contents of various foods and feedstuffs of plant origin. Food Chem. 50, 133-136.
51. Pointillart, A, Fountaine, N, Thomasset, M. 1984. Phytate phosphorus utilization and intestinal phytases in pigs fed low phosphorus wheat and corn diets. Nut. Rep. Int. 29, 473-483.
52. Spinelli, J, Houle, CR, Wekell, JC. 1983. The effect of phytates on the growth of rainbow trout (Salmo gairdneri) purified diets containing varying quantities of calcium and magnesium. Aquaculture 30, 71-84.
53. Higgs, DA, McBride, JR, Dosanjh, BS, Fagerlund, UHM, Archdekin, C, Hammons, AM, Clarke, WC. 1988. Nutritive value of plant protein sources for fish with special emphasis on canola products. Aquaculture International Congress and Exposition. Sept 6-9, 1988. Vancouver, B.C., Canada, p. 29.
54. Coelho, MB. 1999. Ecological nutrition: A costly or smart move. In: Coelho, MB, Kornegay, ET (Eds.), Phytase in Animal Nutrition and Waste Management, BASF Corp., Mount Olive, New Jersey, pp. 41-60.
55. Summerfelt, ST, Holland, KH, Hankins, JA, Durant, MD. 1995. A hydroacoustic waste feed controller for tank systems. Water Sci. Technol. 31, 123-129.
56. Thorpe, JE, Cho, CY. 1995. Minimizing waste through bioenergetically and behaviourally based feeding strategies. Water Sci. Technol. 31, 29-40.
57. Foy, RH, Rosel, R. 1991. Loadings of nitrogen and phosphorus from a Northern Ireland fish farm. Aquaculture 96, 17-30.
58. Axler, RP, Tikkanen, C, Henneck, J, Schuldt, J, McDonald, ME. 1997. Characteristics of effluent and sludge from two commercial rainbow trout farms in Minnesota. Prog. Fish Cult. 59.
59. Cripps, SJ. 1994. Minimizing outputs: treatment. J. Appl. Icthyol. 102, 84-294.
60. Dumas, A, Laliberté, P, Lessard, P, de la Noüe, J. 1998. Biotreatment of fish farm effluents using the cyanobacterium Phormidium bohneri. Aquacult. Eng. 17, 57-68.
61. Hussenot, J, Lefebvre, S, Brossard, N. 1998. Open-air treatment of wastewater from land-based marine fish farms in extensive and intensive systems: Current technology and future perspectives. Aquat. Living Resour. 11, 297-304.
62. Drizo, A, Frost, CA, Smith, KA, Grace, J. 1997. Phosphate and ammonium removal by constructed wetlands with horizontal subsurface flow, using shale as a substrate. Wat. Sci. Tech. 35, 95-102.
63. Chevalier, P, Proulx, D, Lessard, P, Vincent, WF, de la Noüe, J. 2000. Nitrogen and phosphorus removal by high latitude mat-forming cyanobacteria for potential use in tertiary wastewater treatment. J. Appl. Phycol. 12, 105-112.
64. Cho, CY, Hynes, JD, Wood, KR, Yoshida, HK. 1994. Development of high-nutrient-dense, low-pollution diets and prediction of aquaculture wastes using biological approaches. Aquaculture 124, 293-305.
65. Cho, CY, Bureau, DP. 1997. Reduction of waste output from salmonid aquaculture through feeds and feeding. Prog. Fish Cult. 59, 155-160.
66. Bureau, DP, Harris, AM, Cho, CY. 1999. Apparent digestibility of rendered animal protein ingredients for rainbow trout

Proceedings of the Canadian Freshwater Aquaculture Symposium – Aquaculture Canada 2004
62 AAC Spec. Publ. No. 11 (2006)
(Oncorhynchus mykiss). Aquaculture 180, 345-358.
67. Sugiura, S, Babbitt, J, Dong, F, Hardy, R. 2000a. Utilization of fish and animal by by-product meals in low-pollution feeds for rainbow trout Oncorhynchus mykiss (Walbaum). Aquacult. Res. 31, 585 - 593.
68. Johnson, J, Summerfelt, R. 2000. Spray-dried blood cells as a partial replacement for fishmeal in diets for rainbow trout Oncorhynchus mykiss. J. World Aquacult. Soc. 31, 96 - 104.
69. Bureau, D, Harris, A, Bevan, D, Simmons, L, Azevedo, P, Cho, C. 2000. Feather meals and meat and bone meals from different origins as protein sources in rainbow trout (Oncorhynchus mykiss) diets. Aquaculture 181, 281 - 291.
70. Babbitt, JK, Hardy, RW, Reppond, KD, Scott, TM. 1994. Processes for improving the quality of whitefish meal. J. Aquat. Food. Prod. Technol. 3, 59-68.
71. Adelizi, PD, Rosati, RR, Warner, K, Wu, YV, Muench, TR, White, MR, Brown, PB. 1998. Evaluation of fish-meal free diets for rainbow trout, Oncorhynchus mykiss. Aquacult. Nutr. 4, 255-262.
72. Riche, M, Brown, PB. 1999. Incorporation of plant protein feedstuffs into fish meal diets for rainbow trout increases phosphorus availability. Aquacult. Nutr. 5, 101 - 105.
73. Carter, CG. 2000. Fish meal replacement by plant meals in extruded feeds for Atlantic salmon, Salmo salar L. Aquaculture 185, 299-311.
74. Tacon, A.G.J. 1997a. Feeding tomorrow's fish: Keys for sustainability. Proceedings of Feeding Tomorrow's Fish. Tacon, A., Basurco, B. (Eds.), Zaragoza (Spain), 24-26 June 1996, pp. 11-33.
75. Graf, E. 1986. Chemistry and applications of phytic acid: an overview. In: Graf, E (Ed.), Phytic Acid: Chemistry and Applications, Pilatus Press, Minneapolis, MN, pp. 1-23.
76. Jongbloed, AW, Mroz, Z, Kemme, PA. 1992. The effect of supplementary Aspergillus niger phytase in diets for pigs on concentration and apparent digestibility of dry matter, total phosphorus, and phytic acid in different sections of the alimentary tract. J. Anim. Sci. 70, 1159-1168.
77. Van Weerd, JH, Khalaf, KA, Aartsen, FJ, Tijssen, PAT. 1999. Balance trials with African catfish Clarias gariepinus fed phytase-treated soybean meal-based diets. Aquacult. Nutr. 5, 135-142.
78. Rodehutscord, M, Pfeffer, E. 1995. Effects of supplemental microbial phytase on phosphorus digestibility and utilization in rainbow trout (Oncorhynchus mykiss). Water Sci. Technol. 31, 131-147.
79. Forster, I, Higgs, DA, Dosanjh, BS, Rowshandeli, M, Parr, J. 1999. Potential for dietary phytase to improve the nutritive value of canola protein concentrate and decrease phosphorus output in rainbow trout (Oncorhynchus mykiss) held in 11 degree C fresh water. Aquaculture 179, 109-125.

Proceedings of the Canadian Freshwater Aquaculture Symposium – Aquaculture Canada 2004
AAC Spec. Publ. No. 11 (2006) 63
Use of Computer Models to Establish the Feeding Standards for Fish Performance and Waste Reduction for Sustainable Aquaculture: A TREATISE C. Young Cho University of Guelph, Guelph, Ontario, Canada New feeding standards have been developed by Cho et al. (1976-92) and these are based on principle of nutritional energetics in which the digestible energy (DE) content of diet, digestible protein (DP):DE ratio and the amount of DE required to produce per unit of live weight gain. The gain expressed as retained energy (RE) in carcass and maintenance energy at different water temperatures is the main criteria for daily energy and feed allocations. Series of bioenergetic models were developed and a stand-alone multimedia computer program “Fish-PrFEQ” for the Windows™ platform was written in MS Visual C++.NET language with database functionality. This program predicts energy, nitrogen and phosphorus retention, requirements and/or excretions to determine feeding standards, growth, waste output and effluent water quality. The models require initial and final body weights, water temperature, growth coefficient, carcass energy content, waste coefficients and retention coefficients to estimate input and output. Accurate determinations of the thermal-unit growth coefficient (TGC) and waste coefficients are essential, and these coefficients are determined by biological experiments in the laboratory and field. Oxygen requirement and water exchange rate etc. are included to aid environmental control in fish culture systems. The Fish-PrFEQ program also contains modules for production records, performance calculations and database management for input and output data which may be exported for further data and graphic manipulations. Introduction Scientific approaches have been used in the feeding of land animals for over a century. The first feeding standard for farm animals was proposed by Grouven in 1859, and included the total quantities of protein, carbohydrate and ether extract (fat) found in feeds, as determined by chemical analysis. In 1864, E. Wolf published the first feeding standard based on the digestible nutrients in feeds (1). Empirical feeding charts for salmonids at different water temperatures were published by Deuel et al. (2) and were likely intended for use with meat-meal mixture diets widely fed at that time. Since then several methods of estimating daily feed allowance have been reported (3,4,5,6). Unfortunately all methods have been based on the body length increase or live weight gain, and dry weight of feed and feed conversion, rather than on biologically available dietary energy and nutrient contents in relation with protein and energy retention in the body. These methods are no longer suitable for today’s energy- and nutrient-
dense diets, especially in the light of the large amount of information available on the energy metabolism and partitioning in salmonids. Feeding standards may be defined as all feeding practices employed to deliver nutritionally balanced and adequate amount of diets to animals, so maintaining normal health and reproduction together with the efficient growth and/or performance of work. Until now the feeding of fish has been based mostly on instinct and folkloric practices. And the main preoccupation has been looking for “magic” diet formulae. Many “hypes” such as mega-fish meal and mega-vitamin C diets have come and gone, and we are now in the age of the “Norwegian Fish Doughnut” (>36% fat diet)! Whichever diet one decides to feed, the amount fed to achieve optimum or maximum gain while minimizing feed waste is the ultimate measure of one’s productivity in terms of economical benefit and environmental sustainability. Many problems are encountered when feeding fish, much more so than when feeding domestic animals. First, delivery of feed to fish in a water

Proceedings of the Canadian Freshwater Aquaculture Symposium – Aquaculture Canada 2004
64 AAC Spec. Publ. No. 11 (2006)
medium requires particular physical properties of feed together with special feeding techniques. It is not possible in the literal sense to feed fish on an "ad libitum" basis, like it is done with most farm animals. The nearest alternative is to feed to "near-satiety" or % body weight feed per day; however, this can be very subjective. Feeding fish continues to be an "art" and the fish culturist, not the fish, determines "satiety" as well as when and how often fish are fed. The amount of feed not consumed by the fish cannot be recovered and, therefore, all feed dropped in water must be assumed eaten for inventory and feed efficiency calculations. This can cause appreciable errors in feed evaluation as well as in productivity and waste output calculations. Feeding the pre-allocated amounts by hand or mechanical device based on daily energy requirement may be the only logical choice since uneaten feed represents an economical loss and becomes 100% solid and suspended wastes. Meal-feeding a pre-allocated amount of feed may not represent a restricted feeding regime as suggested by Einen et al. (7) since the amount of feed calculated is based on the amount of energy required by the animal to express its full growth potential. There are few scientific studies on feeding standards and practices; however, there are many duplications and "desktop" modifications of old feeding charts with little or no experimental basis. Since the mid-1980's, development of high fat diets has led to most rations being very energy-dense, but feeding charts have changed little to reflect these changes in diet composition. Fish, like other animals, eat primarily to meet energy requirements. Most feeding charts available today tend to over-estimate ration allowance and this overfeeding has led to poor feed efficiencies under most husbandry conditions, and this represents a significant, yet avoidable, waste of resources for aquaculture economy. In addition, it will result in considerable self-pollution which in turn may affect the sustainability of aquaculture operations. Recent governmental regulations imposing feed quota, feed efficiency guidelines and/or stringent waste output limit may somewhat ease the problem. Sophisticated and expensive systems, such as underwater video cameras or feed trapping devices, have been developed to determine the extent of feed wastage and are promoted by many as a solution to overfeeding (8). However, regardless of the feeding method used, accurate growth and feed requirement models are needed in order to forecast growth and objectively determine biologically achievable feed efficiency based on feed and carcass composition. These
estimates can be used as useful yardsticks to adjust feeding practices or equipment and to compare the results obtained. The development of scientific feeding systems is one of the most important and urgent subjects of fish nutrition and husbandry because, without this development, nutrient dense and expensive feeds are partially wasted. Sufficient data on nutritional energetics are now available to allow reasonably accurate feeding standards to be computed for different aquaculture conditions (9). Presented here is a TREATISE of a nutritional energetic approach to tabulate ration allowance and waste output estimation of fish culture operation as well as the introduction of the Fish-PrFEQ computer program. Results obtained from a field station are presented and provide a framework to examine the type of information that can be derived from bioenergetic models and generate a feed requirement for a production scenario. Prediction of Growth and Energy Retention Predicting growth performance of a fish culture operation requires firstly production records of past performance. These records become essential databases for calculating growth coefficients, temperature profiles during growth periods and feed intake and efficiency of various seasons, etc. One such production record for a lot of rainbow trout from a field station is shown in Table 1. A lot of 100,000 fish was reared over a 14-month (410 days) production cycle. Cumulated live weight gain (fish production) was 72 tonnes with feed consumption of 60 tonnes which gave an overall feed efficiency (gain/feed) of 1.19 (ranged between 1.11 – 1.22). Water temperature ranged from 0.5oC in winter to 21oC in summer which is typical of most lakes in Ontario. In spite of the wide fluctuation in water temperature, the thermal-unit growth coefficients (TGC) were fairly stable ranging between 0.177 – 0.204. Total mortality was around 9% over 410 days. From the production record (Table 1) one can extrapolate an overall growth coefficient of 0.191 (0.177 – 0.204) and this coefficient can be used for the growth prediction of future production cycles assuming of similar rearing conditions and fish stock are used. Total feed requirement and setting weekly feeding standards can be computed on the basis of this growth prediction plus the quality of feed being purchased (see Table 3). A more accurate and useful thermal-unit growth coefficient for fish growth prediction in relation to

Proceedings of the Canadian Freshwater Aquaculture Symposium – Aquaculture Canada 2004
AAC Spec. Publ. No. 11 (2006) 65
water temperature is based on the exponent 1/3 power of body weight in contrast to widely known specific growth rate (SGR) based on natural logarithm. Such a cubic coefficient has been applied both to mammals (10) and to fish (11). The following modified formulae were applied by Cho et al. (12) and Cho (13,14) for many nutritional experiments: Thermal-unit Growth Coefficient (TGC) =
[FBW(g)1/3 - IBW(g)1/3] / Σ [Temp.(oC) x Day] x 100
Estimated Final Body Weight (Est. FBW) =
[IBW(g)1/3 + Σ (TGC/100 x Temp.(oC) x Day)]3
where T is water temperature in Celsius. (NOTE: 1/3 exponent must contain at least 4 decimals (e.g. 0.3333) to maintain good accuracy). This model equation has been shown by experiments in our laboratory to represent very faithfully the actual growth curves of rainbow trout, lake trout, brown trout, chinook salmon and Atlantic salmon over a wide range of temperatures. Extensive test data were also presented by Iwama and Tautz (11). An example of growth, water temperature and TGC is shown in Figure 1. Growth of some salmonid stocks used for our experiments gave the following TGC: Rainbow trout-A 0.174 Rainbow trout-B 0.153 Rainbow trout-C 0.203 Lake trout 0.139 Brown trout 0.099 Chinook salmon 0.098 Atlantic salmon-A 0.060 Atlantic salmon-B 0.100 Since these TGC values and growth rates are dependent on species, stock (genetics), nutrition, environment, husbandry and others factors, it is essential to calculate the TGC for a given aquaculture condition using past growth records or records obtained from similar stocks and culture conditions (Table 1). Because of large proportion of the nutrients (e.g. amino acids, lipids) and, consequently of the dietary energy, consumed by fish is retained as carcass body constituents, carcass energy is a major factor driving dietary energy requirement of the fish. Carcass moisture, protein and fat
contents in various life stages dictate energy level of fish (15). These factors are influenced by species, genetics, age, nutritional status and husbandry. The water and fat contents of the fish produced are, in general, the most variable factors and have a determinant effect on energy content of the fish. For example, relatively fatty Atlantic salmon and rainbow trout may require more dietary energy per unit of live body weight than leaner salmonids such as brown trout, lake trout and charr. Fish containing less moisture (more dry matter) and more fat require more energy allocation in feeding standards. The simplistic assumption of the constant body composition within a growth stanza by Einen et al. (7) is not valid for different species and sizes. Dry matter and energy content of fish can increase dramatically within a growth stanza, especially in the case of small fish. Underestimation or overestimation of the feed requirement is likely to occur if constant carcass energy content is assumed in calculations. Reliable measurements of carcass composition of fish at various sizes are essential. Nutrient and energy gains should be calculated at relatively short size intervals, at least for small fish. Additionally, composition of the diet, notably the digestible protein to digestible energy ratio and the lipid content of the diet, can have a very significant influence on the composition and energy content of the carcass. Estimation of carcass composition and energy content should rely on data obtained with fish fed diets similar to those one intends to use. Estimation of Excretory and Feed Wastes Waste output from aquaculture operations can be estimated using simple principles of nutrition and bioenergetics as applied by Cho et al. (16,17) and it is a "biological" approach rather than a chemical one. Ingested feedstuffs must be digested prior to utilization by the fish and the digested protein, lipid and carbohydrate are the potentially available energy and nutrients for maintenance, growth and reproduction of the animal. The remainder of the feed (undigested) is excreted in the faeces as solid waste (SW), and the by-products of metabolism (ammonia, urea, phosphate, carbon dioxide, etc.) are excreted as dissolved waste (DW = DNW + DPW) mostly by the kidneys.

Proceedings of the Canadian Freshwater Aquaculture Symposium – Aquaculture Canada 2004
66 AAC Spec. Publ. No. 11 (2006)
Table 1: Rainbow trout production records from a field station. *
Month-End
Days
No. Fish
Weight (g/fish)
TGC
Total Biomass (kg)
Total Feed (kg)
Gain/ Feed
Temp (°C)
Flow Rate (L/min)
Initial 100000 10.0 May 15 98900 12.1 0.184 1191.8 167 1.22 5.0 2500 Jun 30 95000 36.5 0.189 3462.8 2000 1.18 18.0 6000 Jul 31 95000 89.8 0.197 8534.8 4300 1.18 19.0 10000 Aug 31 94500 177.4 0.175 16767.1 7200 1.15 21.0 16000 Sep 30 94000 296.3 0.184 27848.4 9500 1.18 19.0 20000 Oct 31 93500 396.1 0.199 37031.6 7800 1.20 11.0 25000 Nov 30 93200 451.0 0.197 42036.0 4300 1.19 5.5 25000 Dec 31 93000 455.9 0.176 42394.1 400 1.12 0.5 25000 Jan 31 92000 460.8 0.178 42390.8 400 1.14 0.5 25000 Feb 28 91500 465.2 0.177 42568.6 370 1.11 0.5 25000 Mar 31 91200 470.4 0.184 42899.6 420 1.12 0.5 25000 Apr 30 91000 475.5 0.188 43274.1 420 1.12 0.5 25000 May 31 91000 534.7 0.200 48653.2 4500 1.20 5.0 30000 Jun 30 90800 783.4 0.204 71130.0 18500 1.22 18.0 50000 TOTAL 410
days 0.191 60277
kg feed1.19 13.5x10⁶ m3
water used * Fish were reared in 1200L fibreglass tanks with 1-2 exchanges/h flow through water system
Figure 1: An example of the relationship among body weight (BW = 10-50 g/fish), water temp (T = 3-12C) and thermal-unit growth coefficient.
The total aquaculture wastes (TW) associated with feeding and production is made up of SW and DW, together with apparent feed waste (AFW): TW = SW + DW + AFW SW, DW and AFW outputs are biologically estimated by: SW = [Feed consumed x (1-ADC)] DW = (Feed consumed x ADC) - Fish produced (nutrients retained)

Proceedings of the Canadian Freshwater Aquaculture Symposium – Aquaculture Canada 2004
AAC Spec. Publ. No. 11 (2006) 67
Measurements of apparent digestability coefficient (ADC) and feed intake provide the amount of SW (settled and suspended, AFW-free) and these values are most critical for accurate quantification of aquaculture waste. ADC for dry matter, nitrogen and phosphorus should be determined using reliable methods by research laboratories where special facility, equipment and expertise are available. More information on the equipment and procedures may be obtained from Cho and Kaushik (18) and the website “www. uoguelph.ca/fishnutrition”. Dissolved waste can be calculated as the difference between digestible N (DN) or P (DP) intake and retained N (RN) or P (RP) in the carcass if this information is available. These data should be determined or estimated for each type of diet used by research laboratories where expertise is available. However, controlled feeding and growth trials with particular diets at production sites are also essential to validate and fine-tune the coefficients from the laboratory. Dissolved nitrogen waste output depends very much on dietary protein and energy and amino acid balances (19) and rate of protein deposition by the fish, therefore all coefficients must be determined on a regular basis, particularly when feed formulae are changed. Accurate estimation of total solid waste (TSW) requires a reliable estimate of AFW. Feeding the fish to appetite or near satiety is very subjective and unfortunately TSW contains a considerable amount of AFW under most fish farming operations. The use of “biomass gain x feed conversion” as an estimate of real feed intake of the fish to calculate waste output as suggested by Einen et al. (7) can grossly overestimate the real feed intake in many operations where overfeeding is common and result in an underestimation of the TSW output. It is very difficult scientifically to determine the actual feed intake by fish in spite of many attempts (mechanical, radiological and biological) that have been made by biologists. Since estimation of AFW is almost impossible, the best estimates can be made based on energy requirements and expected gain
described by Cho (14) in which the energy efficiency (energy gain/intake) indicates the degree of AFW for a given operation. Theoretical feed requirement (TFR) can be calculated based on nutritional energetic balance as follows: TFR = Retained + Excreted (including heat loss) The amount of feed input above the TFR should be assumed to be AFW and all nutrient contents of AFW must be included in solid waste quantification. This approach may yield a relatively conservative estimate. Biological procedures based on the ADC for SW and comparative carcass analyses for DW provide very reliable estimates. Biological methods are flexible and capable of adaptation to a variety of conditions and rearing environments. It also allows estimation of the TFR and waste output under circumstances where it would be very difficult or impossible to do so with a chemical/limnological method (e.g. cage culture). Properly conducted biological and nutritional approaches to estimate aquaculture waste outputs are not only more accurate but also much more economical than chemical/limnological methods (16,17,20). The waste outputs from the field station are tabulated in Table 2 using Fish-PrFEQ computer models. SW was estimated at 10610 kg (fish production 72 t; 60 t feed input over 14 months). SW represented 90% of TSW, since AFW (AFI – TFR) was estimated at 1201kg or 2.2 % of feed input (60277 kg). The TSW outputs were equivalent to 164 kg per tonne fish produced. Phosphorus waste was 5.11 kg / t fish produced and nitrogen 30.64 kg. Total water consumption during 14 months was 13469 m3, therefore the average effluent quality can be estimated at: solid 0.877 mg/L, phosphorus 0.027 and nitrogen 0.163 (Table 2). The diet used, the detailed procedures to estimate waste production as well as comparative data of chemical and biological estimations from the field experiments at the Ontario Ministry of Natural Resources (OMNR) Fish Culture Stations are described in Cho et al. (16,17).

Proceedings of the Canadian Freshwater Aquaculture Symposium – Aquaculture Canada 2004
68 AAC Spec. Publ. No. 11 (2006)
Table 2: Model estimation of waste outputs and effluent quality from the rainbow trout production operation in Table 1. WASTE OUTPUT (Total Load Estimate)
Solid (kg)
Nitrogen (kg)
Phosphorus (kg)
Apparent Feed Wastage (2 %) * 1201 80.69 12.01 Solid 10610 356.49 212.19 Dissolved - 1764.60 143.23 TOTAL 11811 2201.79 367.43 - per tonne fish produced 164.3 30.64 5.11 - % of dry matter fed 21.8 % 60.4 % 67.7 % Average CONCENTRATION (mg/L) in EFFLUENT (13469 x 106 L) during 410 days
0.877 0.163 0.027
* (Actual feed input – Theoretical feed requirement) Diet Selection and Ration Allowance Selection of diets for aquaculture production is a complex decision by fish culturists and is beyond the scope of this writing. However, all diets selected must contain adequate levels of digestible energy and essential nutrients per kg feed and most importantly also have an optimally balanced digestible protein and energy ratio for the species being cultured. Without meeting these nutritional conditions the feeding standard concept in this treatise should not applied. Ration allowance (or feeding standard) is tabulation of energy and nutrients needs to maintain normal health and reproduction together with the efficient growth and/or performance of work. A considerable portion of dietary energy is expended for maintenance including basal metabolism, which is the minimum energy and nutrients required necessary to maintain basic life processes. The maintenance energy requirements are approximately equal to the heat production of a fasting animal. This amount of dietary energy represents as an absolute minimum "energy-yielding" nutrients that must be covered before any nutrients can be used for growth and reproduction of the animal. Otherwise body tissues will be catabolized because of a negative energy balance between intake of dietary fuels and energy expenditure. Poikilotherms, such as salmonid fish, require far less maintenance energy (approx. 40 kJ per kg BW0.824/day for rainbow trout at 15oC (18)) than do homeotherms (approx. 300 kJ per kg BW0.75/day (1)). A review of available data suggest that a maintenance energy requirement (HEf) of about
36-40 kJ/kg0.824 per day appear accurate for rainbow trout at 15°C, at least for fish between 20 and 150 g live weight with which most of studies have been conducted (21,22,23,18,24). Cho and Kaushik (18) estimated the heat increment of feeding (HiE, heat loss to utilize ingested feed) of rainbow trout fed a balanced diet to be approximately 30 kJ/g digestible N or the equivalent of 60% HEf, but the latter relationship does not always hold true. Studies with farm animals suggest that HiE is independent of maintenance and is related to protein and lipid deposition rates separately (25). Based on experimental results, it was observed that HiE was approximately equivalent of 20% of net energy intake, i.e. 0.20 (RE + HEf) and this value is used in the bioenergetic model presented here. Studies are underway to quantify HiE as a function of protein and lipid deposition. Biological oxygen requirement of feeding fish is equal to the total heat production (HEf + HiE / Qox) in which the oxycalorific coefficient (Qox) is 13.64 kJ energy per g oxygen. This represents the absolute minimum quantity of oxygen that must be supplied to the fish by the aquatic system. Oxygen requirement per unit of BW per hour will vary significantly for different fish sizes and water temperatures.

Proceedings of the Canadian Freshwater Aquaculture Symposium – Aquaculture Canada 2004
AAC Spec. Publ. No. 11 (2006) 69
Tabulation of Total Energy Requirement and Ration Allowance 1. Allocation of approximate maintenance energy
requirement (HEf) at a given body weight (BW), water temperature (T) and period:
HEf = (- 0.0104 + 3.26T - 0.05T2) (kg BW 0.824)
kJ per day x days 2. Calculation of expected live weight gain (LWG
= FBW - IBW) using TGC and retained energy (RE) based on carcass energy content:
RE = (0.004 g BW2 + 5.58 g BW + 7.25) kJ per g BW x g LWG
3. Allocation of approximate heat increment of
feeding for maintenance and growth:
HiEM+G = (HEf + RE) x 0.2 4. Allocation of approximate non-fecal energy
loss:
ZE + UE = (HEf + RE + HiEM+G) x 0.1 5. Theoretical (minimum) energy requirement
(kJ):
TER = HEf + RE + HiEM+G + UE + ZE 6. Ration Allowance or feeding standard (g):
RA = TER / kJ DE per g feed The minimum digestible energy requirement that should be fed to the fish is the sum of energy retained (RE) and energy lost as HEf + HiE + ZE + UE. The Fish-PrFEQ software applies this procedure to compute feeding standards. The amount of feed can be estimated on a weekly or monthly basis, and recalculated if any parameter (growth rate, water temperature, etc.) is changed. The computed quantity of feed should be regarded as a minimum requirement under normal husbandry conditions and minor adjustment of the feeding level may be made by fish culturists for local conditions. Table 3 summarizes the monthly fish sizes and ration allowance tabulated by the Fish-PrFEQ program for the field station based on the actual production record (see Table 1). The feed requirements were calculated using a single TGC (0.191) for the entire production cycle (14 months) and the actual water temperature profile. The nutrient and energy gains used in the calculations
were based on carcass composition values for rainbow trout of various sizes obtained in different laboratory trials at the University of Guelph. The main discrepancy is between the actual and predicted feed amount for the first four months with actual feed input being greater than predicted allocation. This may indicate that overfeeding occurred, however, real feed intake by the fish could be somewhere between the predicted amount and the actual amount. Using this information, the fish culturist can adjust or fine-tune his feeding strategies in the next production period. In the remaining 10 months, the ration allowance by the model estimated slightly (e.g. 7%) higher feed requirement than the actual feed input. The accuracy of the prediction can be considered acceptable and the largest discrepancies (in terms of predicted and actual) occurring at very low temperatures. Feeding Strategies In spite of widespread feeding practice of high fat (energy) diets for salmonids today, adjustment of old feeding charts has not followed and feed efficiency has not improved accordingly. Many salmonid aquaculture operations still entertain feed conversions (feed/gain) of nearly 1.5 (26). These situations lead not only to an increased feed cost, but also create considerable aquaculture waste problems in rivers, lakes and coastal waters. Whichever efforts and techniques are employed to feed to appetite or near-satiety, the actual amount of feed fed under practical conditions can unknowingly be one of the five situations illustrated in Figure 2. Targetting maximum gain and best feed efficiency may be desirable, but achieving these under farming conditions is difficult and almost impossible on a daily basis even with aid of computer programs and sophisticated feeding equipment. True daily gain and actual feed input are not known until next inventory measurements, therefore maximum gain and minimum feed conversion are mere conceptual figures in daily operations. Real feeding situation will still fall in one of five categories as illustrated in Figure 2 with the experimental results with rainbow trout fed low nutrient-dense diet. At feeding level of category 3), the theoretical requirement will be optimum gain and feed efficiency; however, this level in daily situations may be a “moving target”. With the aid of the bioenergetic models fish culturists can maintain the feeding levels between categories 1)

Proceedings of the Canadian Freshwater Aquaculture Symposium – Aquaculture Canada 2004
70 AAC Spec. Publ. No. 11 (2006)
and 3), and aim near category 2) on a weekly or monthly basis. Since "ad lib" feeding in fish is not possible, the only way to supply requirements of energy and nutrients with minimal waste is a more accurate estimation of ration allowance using the nutritional energetic models and computer program. Results from carefully conducted feeding trials in our laboratory with rainbow trout and Atlantic salmon (27,24) suggest that feed efficiency reaches its maximum at moderate feed restriction (ca. 50-70% of near-satiation) and this optimum is
maintained up to near-satiation (maximum voluntary feed intake) of the fish. Results obtained elsewhere apparently support this observation (28). The hypothesis of Einen et al. (7) that maximum feed efficiency is attained at maximum intake is, therefore, valid. It might be important to note that as the feed distributed approaches the amount corresponding to near-satiation for the fish, feed wastage may increase because of slower response of the fish to the presentation of feed (8). This may results in a reduction of apparent feed efficiency (due to feed wastage) but slightly higher weight gain as observed in Figure 2.
Table 3: Model prediction of fish body weight and feed requirement based on production records in Table 1.
**Overall TGC = 0.191 from Table 1 was used to redict body weight and total feed requirement Theoretical energy and feed requirement prediction models and computer software cannot replace common-sense in feeding fish. The Fish-PrFEQ program could represent a convenient and valuable management tool to help improve husbandry practices and may provide considerable benefits if one fine-tunes the model based on his own production records and readjustment based on actual performance. Accurate growth and feed requirement prediction models can help objectively examining one’s performance by providing a yardstick with which performance can be compared and results obtained with the feeding system and practice in use validated. With nutritional energetics-based
models and programs, production forecast, feed requirement, oxygen requirement and waste output can be estimated a priori. This may prove very useful for aquaculture operations when forecasting production and environmental impacts, negotiating yearly feed and oxygen supply contracts, etc.
Month-End
No. Fish
TGC (%)
Body Weight (g/fish)
Total Feed (kg)
Gain/ Feed Ratio
Body Weight (g/fish)**
Total Feed (kg)**
Gain/ Feed Ratio
Temp (°C)
Actual production records
Predicted production scenario
Initial
100000
10.0
10.0
May 98900 0.184 12.1 167 1.22 12.2 120 1.81 5.0 Jun 95000 0.189 36.5 2000 1.18 37.4 1498 1.68 18.0 Jul 95000 0.197 89.8 4300 1.18 87.9 3446 1.47 19.0 Aug 94500 0.175 177.4 7200 1.15 181.9 6732 1.40 21.0 Sep 94000 0.184 296.3 9500 1.18 310.2 9495 1.35 19.0 Oct 93500 0.199 396.1 7800 1.20 406.6 7775 1.24 11.0 Nov 93200 0.197 451.0 4300 1.19 461.5 4602 1.19 5.5 Dec 93000 0.176 455.9 400 1.12 466.7 451 1.16 0.5 Jan 92000 0.178 460.8 400 1.14 471.9 454 1.16 0.5 Feb 91500 0.177 465.2 370 1.11 477.2 452 1.17 0.5 Mar 91200 0.184 470.4 420 1.12 482.6 453 1.18 0.5 Apr 91000 0.188 475.5 420 1.12 488.0 456 1.18 0.5 May 91000 0.200 534.7 4500 1.20 544.0 4627 1.21 5.0 Jun 90800 0.204 783.4 18500 1.22 780.8 18228 1.30 18.0

Proceedings of the Canadian Freshwater Aquaculture Symposium – Aquaculture Canada 2004
AAC Spec. Publ. No. 11 (2006) 71
0.91
0.92
0.93
0.940.95
0.96
0.970.98
0.991.00
1.01
Ctrl - 15% Control Ctrl + 15%300
310
320
330
340
350
360
370
380
390
Feeding Levels
Gain/Feed Gain, g/fish
2.)
3.)
4.)
1.)5.)
Figure 2: Effects of feeding level on gain and feed efficiency (gain/feed) of rainbow trout (10 g initial weight) fed a low nutrient-dense diet for 32 weeks at 15C. The figure illustrates 5 feeding categories: 1) Overfeeding – feed waste; 2) Upper range of optimum feeding level – maximum gain; 3) Most optimum feeding level – theoretical requirement; 4) Lower range of optimum feeding level – best feed efficiency; 5) Underfeeding and restricted feeding – lower gain. Pre-allocated weekly amounts may be divided into the desired number of meals each day, but each meal must be provided in sufficient quantity for the whole population as long as total ration fed does not exceed the quantity estimated in advance. However, ration allowance may be adjusted according to improvement of fish performance and feed efficiency. Properly sized feed should be dispensed widely over the water surface by hand or mechanical devices in such manner that feed wastage is minimized. With any feeding methods, dominant fish will probably consume enough feed to express their full growth potential; however, the effort made to ensure adequate feed intake of “weakling” fish may dictate the extent of feed waste. Furthermore detection of feed waste by under-water cameras may already be beyond optimal feeding level. The goal of most feeding systems employed today is fast and maximum body weight gain and less concerned for feed efficiency and wastage, but this approach is not economical, and will not promote a lasting cohabitation of sustainable aquaculture and a cleaner environment. Fish-PrFEQ Computer Programs A stand-alone multimedia computer program (Fish-PrFEQ) for the MS Windows™ platform was written in MS Visual C++.NET™ language with database functionality. The program has 4
modules for fish growth prediction, feeding standard/oxygen requirement, production record and waste output estimation, and is based on the bioenergetic models presented above. Feed composition, body weight, water temperature, flow rate and mortality are entered by the user but waste, retention and other coefficients are parameters that are locked and may only be revised with an authorized program update diskette. These coefficients should be determined by qualified nutritionists from feed manufacturers or research institutions since specific coefficients are required for each type of diet and species. The use of unrelated coefficients may result in under or overestimation of feed requirement and waste output. The various outputs are printed and stored using MS Excel™ so that further manipulation of the output data by users is facilitated. Live weight gain, feed efficiency, growth coefficients, solid, nitrogen, phosphorus in the effluent, total waste load, feeding standard and oxygen requirements are some of the output parameters generated by the Fish-PrFEQ program. Presented above are relatively simple steps on how to feed fish using scientific principles of nutritional strategies and management of aquaculture waste (NSMAW). The Fish-PrFEQ program will simplify prediction of growth rate, allocation of feed required and estimation of waste outputs, but may not necessarily be accurate unless the coefficients are fine-tuned. Feeding fish using almost folkloric approaches must become something of the past. The largest portion of fish production costs (over 40%) is expended on feed and fish feed is among the highest quality and most expensive types of animal feed on the market. Dispensing this expensive commodity using most out-dated mode is an undeniably wasteful practice. Much more attention and time should be devoted to feeding systems quantitatively rather than qualitatively, to seek better/cheaper feeds! References 1. Lloyd, L.E., B.E. McDonald, E.W. Crampton,
1978. Fundamentals of Nutrition, Second Edition. W.H. Freeman and Company, San Francisco, CA, 466 pp.
2. Deuel, C.R., D.C. Haskell, D.R. Brockway, O.R. Kingsbury, 1952. New York State Fish Hatchery Feeding Chart, 3rd Edition. N.Y. Conservation Department, Albany, N.Y.

Proceedings of the Canadian Freshwater Aquaculture Symposium – Aquaculture Canada 2004
72 AAC Spec. Publ. No. 11 (2006)
3. Haskell, D.C. 1959. Trout growth in hatcheries. New York Fish and Game Journal, 6, 204-237.
4. Buterbaugh G.L. and H. Willoughby, 1967. A feeding guide for brook, brown and rainbow trout. Prog. Fish Cult. 29, 210-215.
5. Freeman, R.I., D.C. Haskell, D.L. Longacre, E.W. Stiles, 1967. Calculations of amounts to feed in trout hatcheries. Prog. Fish Cult., 29, 194-215.
6. Stickney R.R., 1979. Principles of Warmwater Aquaculture. John Wiley and Sons, New York, NY. 375 pp.
7. Einen, O., I. Holmefjord, T. Asgard, C. Talbot, 1995. Auditing nutrient discharges from fish farms: theoretical and practical considerations. Aquaculture Res., 26, 701-713.
8. Ang K.P., R.J. Petrell, B.E. March, 1996. Feeding end-points associated with different feeding methods in seacage farming of salmonids. Bull. Aquacult. Assoc. Canada, 96, 52-53.
9. Cho, C. Y., D. P. Bureau. 1998. Development of bioenergetic models and the Fish-PrFEQ software to estimate production, feeding ration and waste output in aquaculture. Aquat. Living Resour. 11 (4) 199-210.
10. Kleiber, M., 1975. The Fire of Life. An Introduction to Animal Energetics. Robert E. Krieger Publ. Co., Huntington, New York, 453 pp.
11. Iwama, G.K., A.F. Tautz, 1981. A simple growth model for salmonids in hatcheries. Can. J. Fish. Aquat. Sci., 38: 649-656.
12. Cho C.Y., C.B. Cowey, T. Watanabe, 1985. Finfish Nutrition in Asia. Methodological Approaches to Research and Development. International Development Research Centre, Ottawa. Publication No. IDRC-233e. 154 p.
13. Cho C.Y., 1990. Fish nutrition, feeds, and feeding with special emphasis on salmonid aquaculture. Food Rev. Int., 6, 333-357.
14. Cho, C.Y., 1992. Feeding systems for rainbow trout and other salmonids with reference to current estimates of energy and protein requirements. Aquaculture, 100, 107-123.
15. Bureau, D.P., S.J. Gunther, C.Y. Cho. 2003. Chemical composition and preliminary theoretical estimates of waste outputs of rainbow trout reared in commercial cage culture operations in Ontario. North Am. J. Aquaculture 65: 33-38.
16. Cho, C.Y., J.D. Hynes, K.R. Wood, H.K. Yoshida, 1991. Quantitation of fish culture wastes by biological (nutritional) and chemical
(limnological) methods; the development of high nutrient dense (HND) diets. Pages 37-50 in C.B. Cowey and C.Y. Cho, editors. Nutritional Strategies and Aquaculture Waste. Proceedings of the 1st International Symposium on Nutritional Strategies in Management of Aquaculture Waste. 275 p.
17. Cho, C.Y., J.D. Hynes, K.R. Wood, H.K. Yoshida, 1994. Development of high nutrient-dense, low pollution diets and prediction of aquaculture wastes using biological approaches. Aquaculture, 124, 293-305.
18. Cho C.Y., S.J. Kaushik, 1990. Nutritional energetics in fish: energy and protein utilization in rainbow trout (Salmo gairdneri). In: G.H. Bourne (ed.), Aspects of Food Production, Consumption and Energy Values. World Rev. Nutr. Diet. Karger, Basel, 61, 132-172.
19. Watanabe, T., M. Ohta, 1995. Endogenous nitrogen excretion and non-fecal energy losses in carp and rainbow trout. Fisheries Sciences, 61, 53-60.
20. Cho, C.Y., D.P. Bureau, 1997. Reduction of waste output from salmonid aquaculture through feeds and feeding. Prog. Fish. Cult., 59, 155-160.
21. Cho C.Y., H.S. Bayley, S.J. Slinger, 1976. Energy metabolism in growing rainbow trout: Partition of dietary energy in high protein and high fat diets. pp. 299-302. In: Energy Metabolism of Farm Animals (Vermorel, M. ed.). Proceedings of the 7th Symposium on Energy Metabolism, Vichy, France. EAAP Publication No.19, G. de Bussac, Clermont-Ferrand, France.
22. Cho C.Y., S.J. Slinger, 1980. Effect of water temperature on energy utilization in rainbow trout (Salmo gairdneri). Pp. 287-291. In: Mount L.E. (ed.). Energy metabolism. EAAP Publication No.26, Butterworths, London, U.K.
23. Kaushik S.J., E.F. Gomes, 1988. Effect of frequency of feeding on nitrogen and energy balance in rainbow trout under maintenance conditions. Aquaculture, 73, 207-216.
24. Bureau D.P., 1997. The Partitioning of Energy from Digestible Carbohydrates by Rainbow Trout (Oncorhynchus mykiss). Ph.D. Thesis, University of Guelph, Guelph, Ontario, Canada. 170 pp.
25. Emmans, G.C. 1994. Effective energy: a concept of energy utilization applied across species. Br. J. Nutr., 71, 801-821.
26. Costello, M.J., D.T.G. Quigley, S. Dempsey, 1996. Seasonal changes in food conversion ratio as an indicator of fish feeding

Proceedings of the Canadian Freshwater Aquaculture Symposium – Aquaculture Canada 2004
AAC Spec. Publ. No. 11 (2006) 73
management. Bull. Aquacul. Soc. Canada, 96, 58-60.
27. Azevedo P.A., D.P. Bureau, C.Y. Cho, 1997. The effect of feed intake level and protein to energy ratio on waste production by rainbow trout and Atlantic salmon. III International Symposium on Nutritional Strategies and Management of Aquaculture Waste, 2-4 October 1997, Universidade de Trás-os-Montes e Alto Douro, Portugal. P.11 (abstract).
28. Alanara A., 1997. Balancing maximal production and minimum waste in fish farms: A mission impossible? III International Symposium on Nutritional Strategies and Management of Aquaculture Waste, 2-4 October 1997, Universidade de Trás-os-Montes e Alto Douro, Portugal. P.17 (abstract).

Proceedings of the Canadian Freshwater Aquaculture Symposium – Aquaculture Canada 2004
74 AAC Spec. Publ. No. 11 (2006)
Technologies to Improve Feeding Efficiency in Land-Based and Cage Culture Systems Daniel Stechey Canadian Aquaculture Systems Inc., 1076 Tillison Avenue, Cobourg, ON K9A 5N4 Feeding strategy is a significant factor in the financial viability of an aquaculture venture. A nutritionally complete diet delivered in a ration that meets the needs of the fish for growth and health is essential to attain the market demands for a quality and safe food product. Additionally, feed is the ultimate source of manure and other metabolic waste by-products that are discharged into the water in fish culture operations. Feed, therefore, has a determining influence on the environmental effects of an aquaculture operation and achieving the low-waste potential of modern diets is also contingent upon an effective and efficient feeding strategy. Many factors influence feeding efficiency, including: the quality and digestibility of the diet, fish size, pellet size, water temperature, daily ration, and the time, frequency and method of feed delivery. The care with which the feeding strategy is developed, implemented and monitored is a major factor in determining whether or not production goals are met. These factors are reviewed in an effort to identify practical means to enhance feeding efficiency and environmental sustainability in the culture of rainbow trout. Introduction Since feed can readily account for 40 to 60 % of the cost of growing fish, “feeding strategy” is a significant factor in the financial viability of an aquaculture venture. Additionally, feed is the ultimate source of manure and other metabolic waste by-products that are discharged into the water from fish culture operations; thus, feed and feeding strategy have a determining influence on the environmental effects of an aquaculture operation. In reviewing its regulatory framework governing aquaculture, the United States Environmental Protection Agency (EPA) concluded that a rigorous feed management program alone will achieve significant reductions in solids discharged from aquaculture facilities (1). An efficient feeding strategy that optimizes growth while minimizing the amount of unconsumed (waste) feed depends on the following factors: • Selection of a high quality, nutritionally
balanced diet that is appropriate for the species and size of fish being raised;
• Accurate records of water temperature, water quality and dissolved oxygen;
• Accurate fish inventory (numbers and average size);
• Accurate production modeling to project expected growth;
• Calculation of a feed ration that fulfils the growth potential of the fish based on the fish inventory, water temperature and other
environmental conditions (e.g. dissolved oxygen);
• A feed delivery system that ensures feed is consumed by all fish in the tank or cage; and
• Effective monitoring of feeding activity to ensure that little feed is wasted.
Feed Composition The relation between feed formulation and the wastes produced by rainbow trout is well established (2,3,4,5,6). Formulation and manufacturing of fish feed is a complicated process. Fish feeds must: • Deliver the nutritional needs of the fish for
growth and health in a form that has a suitable shelf-life;
• Resist excessive breakage during handling; • Withstand immersion in water for a period of
time before being consumed without loss of nutrients;
• Be palatable and attractive to the fish; and • Minimize the environmental impacts of
metabolic and faecal wastes produced (7). Feed formulation technologies have advanced significantly over the past two decades resulting in vastly improved feed conversion ratios and reduced production of solid and soluble waste by-products. Manure production per tonne of fish produced has been reduced by about 80% while waste nitrogen and phosphorus (soluble and

Proceedings of the Canadian Freshwater Aquaculture Symposium – Aquaculture Canada 2004
AAC Spec. Publ. No. 11 (2006) 75
particulate) have been reduced by approximately 75% and 50%, respectively (8). Fish, like other animals, consume the quantity of feed required to meet their energy requirements (9). To optimize feed utilization, therefore, it is important to balance the ratio of digestible protein (DP) to digestible energy (DE) in feed formulation (10). Fish utilize protein as the principal source of energy, although lipid can spare protein use to some extent (9). Dietary energy and protein requirements vary with fish size, age and growth rate so it is important to adjust feed rations to maximize efficiency at different growth stages (9). Efficient diets for rainbow trout generally should have a DP:DE ratio in the range of 18 to 24 grams DP per mega-joule DE (9). The use of highly digestible ingredients that provide an optimal balance of nutrients is fundamental to reducing waste output (5,10). That is, each nutrient should ideally be provided in the proportion required without exceeding the quantity that the fish can utilize. Feed conversion ratio (total feed fed : total weight gain) is influenced by the quality and digestibility of the diet, fish size (smaller fish have a better conversion ratios) and temperature. Conversion ratios of 1:1 or better (i.e. 1 kg of feed per kg growth) can be achieved under commercial conditions (11,12,13,14,15) ; however only under ideal conditions and with smaller fish. Given the size of fish commonly produced in the Ontario trout industry (i.e. stocked at 20–50 grams and raised to 900-1,400 grams) and the water temperature regime under which the industry operates, a feed conversion ratio approximating 1.25:1 is typical. Waste Production Aquaculture production models have been developed to calculate the quantity of feed required based on the nutrient and energy requirement of fish to fulfill their growth potential in accordance with the digestible energy content of the diet (16). The models can also accurately project the solid (faecal and waste feed) and soluble wastes produced during the production of fish based on the feed consumed and the digestibility and retention of the diet (4,6,10). Figure 1 illustrates the quantities of dissolved and solid wastes resulting from the production of one tonne of rainbow trout on a well-managed cage farm using a feeding strategy based on a well-formulated, high-nutrient dense diet delivered in a manner that limits feed wastage to 5% (3). Of the
total phosphorus discharged from fish culture operations, approximately 39% is excreted in dissolved form; 58% is contained in the faeces and 3% in the wasted feed. For nitrogen, approximately 80% is excreted in dissolved form, 16% in the faeces and 4% in the wasted feed. The mass balance must reflect the dry matter content and digestibility of the feed, as explained in the following calculations. • Production: 1,000 kg • Feed Delivered: 1,140 kg • Feed Wasted (assumed 5%): 57 kg
o Feed Consumed = 1,140 – 57 = 1,083 kg
• Dry Matter of Feed: 95% • Apparent Digestibility Coef. 85%
o Total Solid Waste (kg) = 1,083 x 0.95 x (1- 0.85) + 57 x .95 = 154 + 54 = 208 kg
Figure 1: Typical inputs and outputs associated with cage culture of rainbow trout per tonne of fish produced (3). A nutritional-bioenergetics model developed by Bureau et al. (3) with minor updates (D.P. Bureau, personal communication, June 2004) was used to project and compare the feed efficiency and waste output from six commercial feed formulations currently used in Ontario. For comparative purposes, three ‘environmentally friendly’ Danish feeds were also modelled. The following assumptions were applied in modelling:
Feed1,140 kg
* incl. in Total Solid Waste
Harvested Fish1000 kg
Diss: 38.0 kg
Waste Feed57 kg*
PhosphorusSolid: 5.8 kg*Diss: 1.7 kg
NitrogenSolid: 9.3 kg*
Total Solid Waste208 kg

Proceedings of the Canadian Freshwater Aquaculture Symposium – Aquaculture Canada 2004
76 AAC Spec. Publ. No. 11 (2006)
• Projections were based on the digestible energy requirement of the fish and the digestible energy content of the feed (i.e. they are not based on the feed companies’ recommended ration);
• Feed composition was entered from manufacturers’ product specification sheets;
• Digestible energy content was entered as the lower of the label specification or the value calculated by the model (differences were subtle);
• Phosphorus digestibility and retention was based on empirical data;
• Growth and feed projections were based on growing rainbow trout from 50 grams to 1,000 grams at a constant water temperature of 9oC and a constant temperature growth coefficient of 1.8; and
• The model projected fish size (growth) and feed ration weekly.
Typically during feeding some feed is wasted; therefore the model outputs reflect two scenarios – one in which no feed is wasted and a second in which 5% of feed is not consumed by the fish. In the 5% feed waste scenario, feed conversion ratios between 1.13 and 1.26 are projected for the growth of rainbow trout from 50 to 1,000 grams in 9oC water. Total solid waste (faeces and waste feed) ranged from 217 to 292 kg/tonne of fish produced. Total phosphorus waste ranged from 6 to 12 kg/tonne fish produced with soluble phosphorus ranging from 1 to 4 kg/tonne fish produced (Table 1). Two of the Danish feeds yielded results consistently superior to the North American feeds, due principally to their higher level of lipid and lower concentration of total phosphorus. While such diets are practical for producing fish at 340-400 grams (characteristic of Danish production), they are impractical for the production of larger fish (>600 grams). Changes in the digestion and metabolism of larger trout reduce the efficiency of lipid and protein utilization and, therefore, lipid-rich diets generate excessive visceral fat and reduce product yield. In comparison, Denmark Feed 2, which utilizes protein and lipid concentrations similar to those in North American diets performed similar to the North American diets, illustrating that feed formulation has a considerable effect on feed efficiency and the quantity of wastes produced.
Phosphorus The production of waste phosphorus from freshwater aquaculture operations is of particular environmental concern. The data in Table 1 illustrate the impact of the total phosphorus content in the feed on waste phosphorus output. All of the Danish diets resulted in less waste phosphorus per tonne of fish produced than did the North American diets, owing to their lower concentration of phosphorus. The feed formulation with the highest total phosphorus content (North America D - 1.25%) generated approximately twice as much total phosphorus waste and two to four times as much soluble phosphorus waste as the feeds with the lowest phosphorus content (Denmark 1 and 2 - 0.9%). In Idaho, where the aquaculture industry is under intense pressure to reduce phosphorus discharges, feed ingredient control has had the most significant effect on effluent waste loads. Presently, the phosphorus content of trout feeds used in Idaho ranges between 0.9% and 1.15%, compared to about 1.3% in 1990. Use of low-phosphorus fish meal has enabled this reduction although it has also increased the cost of feed by about 10%. This change in diet formulation, however, has produced a 40% decrease in effluent phosphorus (17). The dietary phosphorus requirement to achieve normal growth and skeletal development in juvenile rainbow trout is between 0.55% and 0.7% (18), which equates to a total dietary phosphorus content of 0.9% (19). Phosphorus deficiency typically reduces growth rate and causes skeletal deformities, both of which impair productivity. Surplus phosphorus and/or un-digestible phosphorus contained in the feed are excreted as inorganic phosphate mainly in the form of urine or in the faeces (10,19). Recent research findings indicate that available phosphorus levels can be reduced in rainbow trout diets to 0.60% at 200 g, 0.30% at 300 g or to 0.15% at 400 g live weight without loss in the production or product quality in fish harvested at 550 g suggesting that phase feeding of phosphorus can greatly reduce the amount of phosphorus required in trout diets toward the end of the production period (20). These results are preliminary, however, and current feed manufacturing technologies do not enable the economic production of such ultra-low phosphorus feeds.

Proceedings of the Canadian Freshwater Aquaculture Symposium – Aquaculture Canada 2004
AAC Spec. Publ. No. 11 (2006) 77
Table 1: Comparative evaluation of trout feed using actual formulations from manufacturers’ product specification sheets.
Denmark Feed 1
Denmark Feed 2
Denmark Feed 3
North America A
North America B
North America C
North America D
North America E
OMNR Formula
95.0 92.1 95.0 92.0 93.0 94.0 91.5 91.0 95.040.0 47.0 44.0 41.0 45.0 37.0 42.0 46.0 45.033.0 26.0 31.0 23.0 22.0 25.0 24.0 24.0 22.015.0 11.6 12.0 20.0 19.0 25.3 13.5 13.0 20.07.0 7.5 8.0 8.0 7.0 6.7 12.0 7.0 8.0
0.90 0.90 0.95 1.00 1.15 1.00 1.25 1.00 1.00
Calculated 22.3 20.8 22.1 19.3 19.6 19.7 19.2 20.0 19.7Label Value 21.2 19.4 20.6 19.1 n/a n/a 19.9 20.0 20.0
17.0 21.8 19.2 19.3 20.6 16.9 19.7 20.7 20.5
Waste Output with 0% Apparent Feed Waste (kg / tonne fish produced - except FCR)
FCR (kg feed / kg gain) 1.08 1.18 1.11 1.20 1.17 1.16 1.19 1.15 1.16
168 186 181 206 191 194 239 188 2047 9 8 8 8 7 8 8 85 5 5 6 7 6 7 6 6
Dissolved Nitrogen 36 54 44 45 49 36 46 50 49Dissolved Phosphorus 1 2 2 2 3 2 4 2 2
Total Nitrogen 43 63 52 52 58 43 54 58 57Total Phosphorus 6 7 7 8 10 8 11 8 8
Plus Waste Output from 5% Apparent Feed Waste (kg / tonne fish produced)
Total Solid Waste 49 52 51 53 52 52 52 50 53Solid Nitrogen 3 4 4 4 4 3 4 4 4Solid Phosphorus 0.5 0.5 0.5 0.6 0.6 0.6 0.7 0.6 0.6
Waste Output - 5% Apparent Feed Waste (kg / tonne fish produced - except FCR)
FCR (kg feed / kg gain) 1.13 1.24 1.17 1.26 1.22 1.22 1.25 1.20 1.22
217 239 232 259 243 246 292 238 25710 13 12 12 12 10 12 12 125 6 6 7 7 6 8 6 6
Dissolved Nitrogen 36 54 44 45 49 36 46 50 49Dissolved Phosphorus 1 2 2 2 3 2 4 2 2
Total Nitrogen 46 67 56 56 62 46 58 62 61Total Phosphorus 6 7 7 9 10 8 12 8 8
Dry MatterCrude Protein
Composition (%)
Phosphorus
Total Solid WasteSolid Nitrogen Waste
LipidN-Free ExtractAsh
Digestible Energy (kJ/g)
DP : DE
Solid Phosphorus Waste
Total Solid WasteSolid Nitrogen WasteSolid Phosphorus Waste
The ingredients used to formulate the diet can significantly alter the digestibility of phosphorus in the diet (Table 2). Depending on quality, the phosphorus in fish meal is readily digested by fish since it is largely in the form of hydroxyapatite or bone phosphate. In contrast, the phosphorus contained in plant ingredients is phytate-bound and is only partially available to fish (10,19), however, the availability of the phosphorus in plant ingredients can be increased with phytase supplementation (19). Feed processing techniques also affect phosphorus digestibility (10). Using current feed processing technology, fish diets having a total phosphorus content of 0.9% to 1.0% are practical and are appropriate to deliver the digestible phosphorus content required by the fish.
It is not currently cost-effective to reduce total phosphorus content below approximately 0.9%.

Proceedings of the Canadian Freshwater Aquaculture Symposium – Aquaculture Canada 2004
78 AAC Spec. Publ. No. 11 (2006)
Table 2: Estimates of apparent digestibility coefficient (ADC) of phosphorus in various feed ingredients. Ingredient ADC (%) Fish meal 17-81 Meat and bone meal 22-67 Poultry by-product meal 38-66 Feather meal 68-82 Blood meal 70-104 Soybean meal 27-46 Corn gluten meal <10 NaH2PO4 95-98 Ca(H2PO4) 90-94 CaH PO4 54-77 Hydroxyapatite or Ca3(PO4)2
37-64
Feeding Fish Feeding fish is more challenging than feeding terrestrial animals due to the water medium which necessitates special feed characteristics and feeding techniques. For instance, since the feed must be suspended in the water column, it is not possible to feed fish (especially salmonids) ad libitum (9). Fish, therefore, are normally fed according to a calculated ration which is delivered in the form of discrete ‘meals.’ Moreover, feed is typically delivered at a time of day, for a duration and at a frequency determined, not by the fish, but by the farmer. As a result, feeding strategies are usually designed to accommodate the working hours of the farm staff and the economic efficiencies of delivering the feed rather than the biological and behavioural needs of the fish (21). To meet production goals and optimize feed conversion, the feed delivery process must reflect physiological and nutritional needs of the fish and their feeding behaviour so that feed is delivered at a time, rate and frequency that will optimize growth. Once delivered, monitoring of feeding activity by the fish is often subjective and can result in inefficient practices leading to increased waste, cost and environmental impact. Much is known about salmonid feeding behaviour and the physiological processes that determine appetite in fish, however, the practical application of this knowledge at the farm level is often lacking (21,22,23). This may be because the feeding behaviour of salmon and trout is sufficiently plastic that the fish adapt to the feed delivery methods employed by farmers with only modest changes in growth rate (23,24). Given the low profit margins in food production industries, however, even modest
increases in feeding efficiency gained through the application of feed delivery methods based on the behaviour and physiology of the fish could enhance the financial viability of the farm; reduced environmental effects are a supplemental benefit. The results of research on feeding behaviour, digestive physiology and practical on-farm experience have led to the following basic principles for feeding salmon and trout: • Peak feeding activity in salmonids is usually at
dawn and dusk with greater activity at dawn although there is some seasonal variation (23,25). Feeding at other times of the day may affect growth and feed conversion efficiency (6).
• When feed is delivered in a predictable location at a slow rate, dominant fish are able to defend the location and consume feed to match their appetite while preventing subordinate fish from feeding efficiently, resulting in wasted feed and an increase in the size variation of the population. Defence of feeding territories can be overcome by distributing the feed widely across the surface of the rearing unit as fast as the population can consume it., giving all fish equal access to the feed (11,21,22,26).
• Initial feeding by fish is rapid, however, as they reach satiation the feeding rate slows (22). Feed delivery should be adjusted accordingly (Figure 2).
• Feeding frequency (number of meals per day) is determined by the size of the fish and the water temperature, both of which affect the rate of passage of feed through the digestive tract (9,25). Swim-up fry just being introduced to feed are fed frequently – often hourly or even continuously. Feeding frequency is gradually reduced as the fish grow. For the size of fish typically raised in grow-out cage farms or land-based facilities, two meals per day are sufficient (25). This can be reduced to once per day or less at very cold water temperatures.
• Due to natural variation in feeding rate, it is necessary to monitor feeding activity at each meal to avoid wasting feed at times when appetite is suppressed.
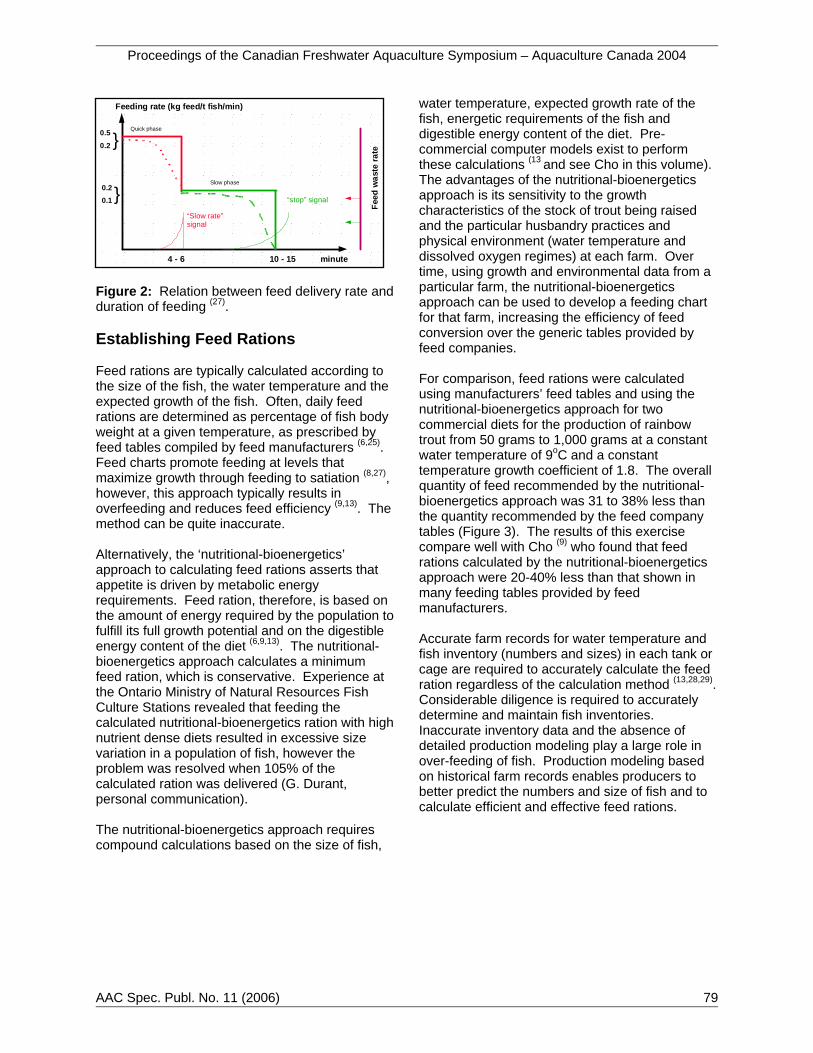
Proceedings of the Canadian Freshwater Aquaculture Symposium – Aquaculture Canada 2004
AAC Spec. Publ. No. 11 (2006) 79
Figure 2: Relation between feed delivery rate and duration of feeding (27). Establishing Feed Rations Feed rations are typically calculated according to the size of the fish, the water temperature and the expected growth of the fish. Often, daily feed rations are determined as percentage of fish body weight at a given temperature, as prescribed by feed tables compiled by feed manufacturers (6,25). Feed charts promote feeding at levels that maximize growth through feeding to satiation (8,27), however, this approach typically results in overfeeding and reduces feed efficiency (9,13). The method can be quite inaccurate. Alternatively, the ‘nutritional-bioenergetics’ approach to calculating feed rations asserts that appetite is driven by metabolic energy requirements. Feed ration, therefore, is based on the amount of energy required by the population to fulfill its full growth potential and on the digestible energy content of the diet (6,9,13). The nutritional-bioenergetics approach calculates a minimum feed ration, which is conservative. Experience at the Ontario Ministry of Natural Resources Fish Culture Stations revealed that feeding the calculated nutritional-bioenergetics ration with high nutrient dense diets resulted in excessive size variation in a population of fish, however the problem was resolved when 105% of the calculated ration was delivered (G. Durant, personal communication). The nutritional-bioenergetics approach requires compound calculations based on the size of fish,
water temperature, expected growth rate of the fish, energetic requirements of the fish and digestible energy content of the diet. Pre-commercial computer models exist to perform these calculations (13 and see Cho in this volume). The advantages of the nutritional-bioenergetics approach is its sensitivity to the growth characteristics of the stock of trout being raised and the particular husbandry practices and physical environment (water temperature and dissolved oxygen regimes) at each farm. Over time, using growth and environmental data from a particular farm, the nutritional-bioenergetics approach can be used to develop a feeding chart for that farm, increasing the efficiency of feed conversion over the generic tables provided by feed companies. For comparison, feed rations were calculated using manufacturers’ feed tables and using the nutritional-bioenergetics approach for two commercial diets for the production of rainbow trout from 50 grams to 1,000 grams at a constant water temperature of 9oC and a constant temperature growth coefficient of 1.8. The overall quantity of feed recommended by the nutritional-bioenergetics approach was 31 to 38% less than the quantity recommended by the feed company tables (Figure 3). The results of this exercise compare well with Cho (9) who found that feed rations calculated by the nutritional-bioenergetics approach were 20-40% less than that shown in many feeding tables provided by feed manufacturers. Accurate farm records for water temperature and fish inventory (numbers and sizes) in each tank or cage are required to accurately calculate the feed ration regardless of the calculation method (13,28,29). Considerable diligence is required to accurately determine and maintain fish inventories. Inaccurate inventory data and the absence of detailed production modeling play a large role in over-feeding of fish. Production modeling based on historical farm records enables producers to better predict the numbers and size of fish and to calculate efficient and effective feed rations.
Feeding rate (kg feed/t fish/min)
minute
Feed
was
te ra
te
0.5
0.2
0.20.1
}
“Slow rate”signal
“stop” signal
4 - 6 10 - 15
Quick phase
Slow phase
}

Proceedings of the Canadian Freshwater Aquaculture Symposium – Aquaculture Canada 2004
80 AAC Spec. Publ. No. 11 (2006)
Figure 3: Comparative feed rations calculated using manufacturers’ feeding tables and the nutritional-bioenergetics methodology. Feed Delivery Feed is dispensed to fish in tanks and cages by three principal methods; hand feeding, demand feeding and powered feeding. When feeding by hand, the person feeding the fish can constantly and instantly observe the surface feeding behaviour of the fish. When done carefully and consistently, feed can be administered where fish are actively feeding to better ensure that all fish gain access to the feed. Except in shallow tanks with clear water, the operator is generally unable to observe any un -consumed feed that by-passes the fish, making it difficult to ensure that the fish are fed to satiation and that waste feed is minimized. Maintaining the required level of diligence while feeding day-after-day in varying weather conditions is difficult and careless hand feeding is a major source of wasted feed. By enabling fish to dispense feed ‘on-demand’, demand feeders have the potential to provide ad libitum feeding. However, because the feeders usually provide feed in discrete positions, aggressive fish may dominate the feeding location. Demand feeders must be routinely maintained to ensure that the rate of feed delivery is not excessive. As well, fish sometimes ‘play’ with the trigger mechanism without consuming the feed; accumulation of uneaten feed under demand feeders is not uncommon. In larger systems, the
trigger mechanism can activate a blower or other device to distribute a large quantity of feed over the surface of the water; however, if only a few fish are hungry, this technology can waste substantial amounts of feed. Weather conditions, such as excessive wind, waves and spray ice, render demand feeders less suitable for exposed conditions. As the number and size of rearing units increases, powered feeders present a more practical method to administer feed to tanks and/or cages. Powered feeders distribute the ration by blowing (pneumatic) or throwing (mechanical) the feed across the rearing unit. There are two general types – those that are under the direct control of a farm worker who triggers the feeder and observes the feeding behaviour of the fish and those that are fully automated and deliver feed according to a set ration and timing for each ‘meal’. Monitoring Feeding Response in Fish The feed dispensed to a cage or tank of fish is either consumed by the fish or not. Feed that is not consumed by the fish reduces overall feed efficiency and contributes toward excess nutrient loading to the environment. For both economic and environmental reasons, therefore, it is in the farmer’s best interest to minimize feed waste. While waste feed can account for 30% or more of total feed used in poorly managed farms, well-managed farms are generally able to maintain feed wastage below 5% (30). Many factors combine to cause variation in fish feeding behaviour; for instance fish health and level of stress, water clarity, lighting conditions, water temperature, dissolved oxygen concentration, etc. Accommodating such variation often requires on-the-spot adjustment of feed quantity and/or rate of delivery. It is essential, therefore, to monitor feeding activity to ensure that feed is not wasted and that feed conversion and growth are optimized. With careful monitoring, wasted feed can be kept below 5% (30). Visual Monitoring from the Surface On most trout farms, feed is delivered under the direct control of farm workers either through hand-feeding or by directly controlled mechanized feeders. Visual monitoring of feeding activity is relatively easy in land-based farms where feed accumulating on the bottom of shallow tanks can be readily observed. In cage culture operations, however, it is more difficult to observe whether all
0.00
10.00
20.00
30.00
40.00
50.00
60.00
70.00
50 65 83 104
128
156
188
223
263
307
356
410
468
533
603
678
760
849
943
Fish Weight (g)
Feed
Rat
ion
(g /
fish
/ wee
k)
Denmark Feed 2 - Feed ChartDenmark Feed 2 - Metabolic EnergyNorth America C - Feed ChartNorth America C - Metabolic Energy

Proceedings of the Canadian Freshwater Aquaculture Symposium – Aquaculture Canada 2004
AAC Spec. Publ. No. 11 (2006) 81
of the fish are able to consume the dispensed feed (indicative of poor feed delivery technique) or if unconsumed feed is by-passing the fish (indicative of satiation); furthermore, the decision to cease feeding is usually based on declining feeding activity by the fish at the surface. As the fish’s appetite is satisfied, however, fish tend to feed deeper in the water out of sight of the farm worker (21,28) and they also feed at a slower rate (see Figure 2). Consequently, monitoring feeding activity visually from above the surface of the water often results in the fish not being fed to satiation and does not prevent feed waste through the bottom of the cage (11,22). Mechanical Monitoring A variety of devices (air lifts, ultrasonic detectors, underwater cameras, etc.) have been developed and are marketed to monitor feeding activity from below the surface as a means of improving growth and feed conversion efficiency and to reduce feed wastage (11,12,22,31). These devices detect feed pellets as they appear below the fish and provide feedback to the feeder, whether human or mechanical. These devices have also been effective in reducing fish mortality, probably through improved control of feed delivery rates encouraging the fish to feed in the water column rather than at the surface (11). Submersible video cameras can be installed near the bottom of fish cages with the lens facing upwards. The farm worker feeding the fish observes the feeding activity of the fish on a monitor while dispensing the feed (11,32,33). Systems specifically designed for aquaculture are commercially available. The use of video-cameras has the advantage of allowing direct visual observation of fish feeding activity, although this becomes more difficult in turbid water or low light levels. The system is adaptable to any method of delivering the feed to the fish. Computer controlled feed back systems with automated detection of feed pellets and control of mechanized feeders is possible allowing feeding to occur unattended by staff. More sophisticated systems involve use of Doppler, hydro-acoustic and ultrasonic systems to detect feed pellets (Figures 5 and 6). These
systems use sensors located near or below the bottom of the cage or in the effluent piping from a land-based tank farm, to detect uneaten pellets or monitor feeding activity and provide feedback to a computer controlled mechanized feeding system (8,31,34,35) . Some systems include video cameras and wireless transmission to permit off-site monitoring of feeding activity by farm management and alarm functions (31,34). These systems effectively reduce the amount of uneaten feed and provide direct control of unattended mechanized feeders. They also provide accurate data on feed dispensed to each cage or tank and on feeding behaviour of the fish. Trials with these types of sophisticated feed-back control system have demonstrated that they can produce equal or better growth rates and feed conversion than traditional feeding practices (Table 3). Although meticulous hand feeding produced the best performance, the ultrasonic waste feed controller produced better growth rate and equal or better feed conversion than either demand or ration feeding (35,6). Hydro-acoustic systems have the added advantage of being able to detect changes in the biomass of fish and provide warning of theft or escape of fish through a damaged net (34). The systems function less effectively on sites where strong currents may cause pellets to drift undetected through the sides of the cages. As well, technological malfunctions may not be immediately detectable by farm staff. Table 3: Comparative performance of four feeding methods with rainbow trout (35). Feeding Method
Growth (g/d)
FCR (kg gain/kg feed)
Increase in Prod’n Efficiency (%)
Ration Diet 2.69 1.12 --
Demand Feeder 3.44 1.21 13
Ultrasonic Waste Feed Controller
4.37 1.15 29
Hand 5.12 1.15 51

Proceedings of the Canadian Freshwater Aquaculture Symposium – Aquaculture Canada 2004
82 AAC Spec. Publ. No. 11 (2006)
Figure 4: Common methods of delivering feed: Left – Hand Feeding; Centre – Demand Feeders; Right – Powered Feeder.
Figure 5: An adaptive feeding system for detecting feed that has passed the active feeding zone of the fish (36).
Figure 6: A hydroacoustic device for monitoring feeding response in fish (35). Economics of Monitoring Feed Delivery with Underwater Cameras A simple economic model was developed for a conventional four-cage trout farm having a capacity to produce approximately 259 tonnes of trout annually at a harvest size of 1,000 grams. Applying a feed conversion ratio of 1.25, which is typical for Ontario cage culture operations, annual feed consumption is 324 tonnes. Bureau et al. (3),
however, project that rainbow trout can be raised from 50 grams to 1,000 grams using only 1,120 kg of feed per tonne of fish produced when no feed is wasted (Table 1). Thus, a feed conversion ratio of 1.25 suggests that apparent feed waste is about 6.8%. This waste represents 76 kilograms and $99 per tonne of fish produced. Moreover, it also contributes 37% more solid waste and 9% more phosphorus into the environment (Table 4). Cost estimates from two Canadian suppliers for underwater camera systems for use with the four-cage trout farm model ranged from $6,500 to $7,000, including delivery. Assuming that feed wastage can be reduced by 50% (to 3.4% from 6.8%) by using underwater cameras to observe feeding behaviour, the use of cameras could yield a net savings of 38 kilograms feed valued at $49 per tonne of fish produced and FCR would be reduced to 1.21 (Table 5). Consequently, the breakeven point for purchasing underwater camera systems is only 133 to 144 tonnes, indicating that the capital outlay for these systems is returned rapidly; within one year for even the smallest operations. Furthermore, reducing apparent feed waste by 50% would reduce the discharge of total suspended solids and total phosphorus by 14% and 5% respectively. In Ontario, where the cage culture sector produces approximately 4,300 tonnes of fish annually, this is equivalent to a 155-tonne reduction in TSS output and a 2.1-tonne reduction in TP output. Submersible camera systems are commonly used throughout the cage culture sector to observe fish feeding behaviour. Using visual cues as fish behaviour markers, experienced fish culture technicians are able to better judge where, how much and how fast to broadcast feed pellets. The underwater perspective provides additional input to the guide feed delivery. Moreover, the economics of such systems appear to warrant the investment.

Proceedings of the Canadian Freshwater Aquaculture Symposium – Aquaculture Canada 2004
AAC Spec. Publ. No. 11 (2006) 83
Table 4: Comparison of productivity, environmental and economic factors in cage culture of rainbow trout at different levels of apparent feed waste.
6.80% 3.40% 0%
Feed Conversion Ratio 1.25 1.21 1.17
262 226 19113.9 11.1 8.47.6 7.1 6.7
Dissolved Nitrogen 49.4 49.4 49.4Dissolved Phosphorus 3.0 3.0 3.0
Total Nitrogen 63.3 60.5 57.8Total Phosphorus 10.6 10.1 9.7
Feed Consumption (kg/tfp) 1,196 1,158 1,120Feed Cost @ $1.30/kg ($/tfp) $1,555 $1,505 $1,456
Parameter
Total Solid WasteSolid Nitrogen WasteSolid Phosphorus Waste
Apparent Feed Waste
Table 5: Economic benefits of using underwater cameras to monitor feed delivery. Capital Cost ($) $6,500 - $7,000 Feed Efficiency (kg feed / tonne fish produced)
38
($ / tonne fish produced)
$49
Breakeven (tonnes) 133 - 144 Conclusions Clearly, feed and feeding strategy have a determining influence on the economic performance and the environmental effects of aquaculture operations. Use of nutrient-dense diets having high overall digestibility and low phosphorus content, calculating feed rations according to the nutritional bioenergetic requirements of the fish in each rearing unit, and monitoring feed delivery to avoid feed waste can generate increased profit potential and reduce the environmental effects of aquaculture ventures.
References 1. US-EPA. 2004. Guidance for Aquatic Animal
Production Facilities to Assist in Reducing the Discharge of Pollutants – Final Rule. Office of Water, United States Environmental Protection Agency. Washington, DC
2. Azevedo, P.A., C.Y. Cho, S. Leeson and D. Bureau (1998) Effects of feeding level and water temperature on growth, nutrient and energy utilization and waste outputs of rainbow trout (Oncorhynchus mykiss). Aquat. Living Resour. 11(4):227-238.
3. Bureau, D.P., S.J. Gunther and C.Y. Cho 2003. Chemical composition and preliminary theoretical estimates of waste outputs of rainbow trout reared in commercial cage culture operations in Ontario. North American Journal of aquaculture, 65:33-38.
4. Cho, C.Y. and D.P. Bureau 1997. Reduction of waste output from salmonid aquaculture through feeds and feeding. Prog. Fish Cult. 59:155-160.
5. Gavine, F.M., Phillips, M.J. and Murray, A. 1995. Influence of improved feed quality and

Proceedings of the Canadian Freshwater Aquaculture Symposium – Aquaculture Canada 2004
84 AAC Spec. Publ. No. 11 (2006)
food conversion ratios on phosphorus loadings from cage culture of rainbow trout, Oncorhynchus mykiss (Walbaum), in freshwater lakes. Aquaculture Research 26:483-495.
6. Kaushik, S.J. 1998. Nutritional bioenergetics and estimation of waste production in non-salmonids. Aquat. Living Resour. 11(4):211-21.
7. Kaushik, S.J. 2000a. Feed formulation, diet development and feed technology. In Recent Advances in Mediterranean aquaculture finfish species diversification. May 24-28, 1999, Zaragoza, Spain. CIHEAM-IAMZ, 2000 p. 43-51.
8. Alvarado, J.L. 1997. Aquafeeds and the environment. CIHEAM – Options Mediterraneennes. p. 275-289 In: Tacon A.G.J. (ed.), Basurco B. (ed.). Feeding tomorrow's fish Zaragoza: CIHEAM-IAMZ, 1997. 307 p. (Cahiers Options Méditerranéennes; v. 22). Workshop of the CIHEAM Network on Technology of Aquaculture in the Mediterranean (TECAM), 1996/06/24-26, Mazarrón (Spain)
9. Cho. C.Y. 1992. Feeding systems for rainbow trout and other salmonids with reference to current estimates of energy and protein requirements. Aquaculture 100:107-123.
10. Bureau, D.P. and Cho, C.Y. 1999. Nutritional strategies for the management of aquaculture wastes. In Addressing Concerns for Water Quality Impacts from Large-Scale Great Lakes Aquaculture. Great Lakes Water Quality Board Report to the International Joint Commission and Habitat Advisory Board of the Great Lakes Fishery Commission. Pp. 28-31.
11. Ang, K.P., and Petrell, R.J. 1997. Control of feed dispensation in seacages using underwater video monitoring effects on growth and food conversion. Aquacult. Eng. 16:45-62.
12. Anon. 1997b. ‘Thinking’ feeders can bring big savings in farm costs. Fish Farming International 24(4):40-41.
13. Cho, C.Y. and Bureau, D.P. 1998. Development of bioenergetic models and the Fish-PrFEQ software to estimate production, feeding ration and waste output in aquaculture. Aquat. Living Resour. 11(4):199-210.
14. Myrseth, B. 2000. Automation of feeding management in cage culture. In I.C. Liao and C.K. Lin (Eds.) Cage Aquaculture in Asia: Proceedings of the First International Symposium on Cage Aquaculture in Asia. Asian Fishereis Society, Manila and World
Aquaculture Society, Southeast Asian Chapter, Bangkok. Pp. 151-155.
15. Smith, P. 2002. Aquaculture feeds – addressing key issues: environment, sustainability, food safety and quality. Business Challenges in Modern Aquaculture, June 11, 2002, Stavanger Norway, AquaVision Magazine pp. 57-59.
16. Bureau, D.P. and Cho, C.Y. 1998. Phosphorus utilization by rainbow trout (Oncorhynchus mykiss): estimation of dissolved phosphorus waste output. Aquaculture 179:127-140.
17. MacMillan, J.R., T. Huddleston, M. Woolley and K. Fothergill (2003). Best management practice development to minimize environmental impact from large flow-through trout farms. Aquaculture 226:91-99.
18. Hardy, R.W. and D.M. Gatlin (2002). Nutritional strategies to reduce nutrient losses in intensive aquaculture. In: Cruz-Suarez, L.E., D. Ricque-Marie, M. Tapia-Salazar, M.G. Gaxiola-Cortez and N. Simones (Eds.) Avances en Nutricion Acuicola VI. Memorias del VI Simposium Internacional de nutricion Acuicola. 3 al 6 de Septiembre del 2002. Cancun, Quintana Roo, Mexico.
19. Coloso, R.M., King, K., Fletcher, J.W., Hendrix, M.A., Subramanyam, J., Weis, P. and Ferraris, R.P. 2003. Phosphorus utilization in rainbow trout (Oncorhynchus mykiss) fed practical diets and its consequences on effluent phosphorus levels. Aquaculture 22:801-820.
20. Lellis, W.A., F.T. Barrows and R.W. Hardy (2004). Effects of phase-feeding dietary phosphorus on survival, growth and processing characteristics of rainbow trout, Oncorhynchus mykiss. Aquaculture (in press).
21. Ang, K.P. and R.J. Petrell 1998. Pellet wastage and subsurface and surface feeding behaviours associated with different feeding systems in sea cage farming of salmonids. Aquaculture Engineering 18:95-115.
22. Ang, R.J. and Ang, K.P. 2001. Effects of pellet contrast and light intensity on salmonid feeding behaviours. Aquacultural Engineering 25:175-186.
23. Eriksson, L-O. and Alanara, A. 1992. Timing of feeding behaviour in salmonids. In J.E. Thorpe and F.A. Huntingford (Eds.) The Importance of Feeding Behavior for the Efficient Culture of Salmonid Fishes. World Aquaculture Workshops, Number 2. The World Aquaculture Society, Baton Rouge, LA. Pp. 41-48.
24. Makinen, T., Suuronen, P., Tschernij, V. and Lehtonen, E. 1993. Feed wastage, feeding

Proceedings of the Canadian Freshwater Aquaculture Symposium – Aquaculture Canada 2004
AAC Spec. Publ. No. 11 (2006) 85
activity and behaviour of rainbow trout in net cages with pendulum feeders. International Council for the Exploration of the Sea C.M. 1993/F:48.
25. Kaushik, S.J. 2000b. Feed allowance and feeding practices. In: Recent Advances in Mediterranean aquaculture finfish species diversification. May 24-28, 1999, Zaragoza, Spain. CIHEAM-IAMZ, 2000 p. 53-59.
26. Noakes, D.L.G. and Grant, J.W. 1992. Feeding and social behaviour of brook and lake charr. In J.E. Thorpe and F.A. Huntingford (Eds.) The Importance of Feeding Behavior for the Efficient Culture of Salmonid Fishes. World Aquaculture Workshops, No. 2. The World Aquaculture Society, Baton Rouge, LA. Pp. 13-20.
27. Kadri, S. 2003. Creating a feed management strategy. Presentation at the 16th Annual Atlantic Aquaculture Exposition, Conference and Fair, St. Andrew’s-by-the-Sea, New Brunswick, June 12, 2003.
28. Braaten, B. 1991. Impact of pollution from aquaculture in six Nordic countries. Release of nutrients, effects, and waste water treatment. In: N. De Pauw and J. Joyce (Eds.) Aquaculture and the Environment. European Aquaculture Society Special Publication No. 16, Ghent, Belgium. Pp. 79-101.
29. Kumura, R., S. Kawaguchi, and S. Sugitani (1993). Automatic feeding control system for fish. In: Reinertsen, H. et al. (Eds) Fish Farming Technology. Balkema, Rotterdam. p. 217-225.
30. Cromey, C.J., Nickell, T.D. and Black, K.D. 2002. DEPOMOD – modelling the depositions
and biological effects of waste solids from marine cage farms. Aquaculture 214:211-239.
31. Anon. 1997a. Doppler technology may gain big saving in costs. Fish Farming Int. 24(4).
32. Bartlett, C. 2001. Recent developments and future challenges in feeding systems for the Atlantic salmon farming industry. In: S.T. Summerfelt, B.J. Watten and M.B. Timmons (Eds.) Proceedings from the Aquacultural Engineering Society’s 2001 Issues Forum, Shepherdstown, West Virginia, Nov. 11-14, 2001. pp. 147-149.
33. Petrell, R.J. 2001. Underwater cameras in aquaculture Part 2: Monitoring fish feeding. Aquaculture Magazine March/April 2001 pp. 72-74.
34. Lindem, T. and D. Al Houari. 1993. Hydroacoustic monitoring of fish in aquaculture – a method for automatic feeding control by detection of fish behaviour. ICES Statutory Meeting 1993 C.M. 1993/F:45/ Session T
35. Hankins, J.A., S.T. Summerfelt and M.D. Durant (1995). Impacts of feeding and stock management strategies upon fish production within water recycle systems. NRAES-90 Aquaculture Eng’g and Waste Mgmt. p. 70-86.
36. Noble, C. and S. Kadri (2002). Diurnal feeding rhythms and production of juvenile Atlantic salmon (Salmo salar) in freshwater cages. PowerPoint Presentation. University of Glasgow / Aquasmart.

Proceedings of the Canadian Freshwater Aquaculture Symposium – Aquaculture Canada 2004
86 AAC Spec. Publ. No. 11 (2006)
A Comparison of Alternative Designs and Technologies in Recirculating Aquaculture Dennis P. DeLong and Thomas M. Losordo Department of Biological and Agricultural Engineering, North Carolina State University Campus Box 7625, Raleigh, North Carolina, USA 27695 Interest in recirculating aquaculture technology has remained high worldwide. The need to profitably operate commercial systems has resulted in considerable effort to reduce capital and operating costs, increase maximum fish densities, and increase maximum feeding rates. This paper provides an overview of systems currently in use, their advantages and disadvantages, and innovative features with which they operate. Instances in which the tank and system design significantly impacts operational factors such as fish handling are presented. The discussion includes systems utilizing innovative solids removal technology, tank design, biofiltration technology, and stock management, and presents an overview of products and development work continuing in North America, Europe, Southeast Asia, and Australia. Introduction Recirculating aquaculture has seen steady advancement during the last fifteen years. With occasional steps backward, the general trend has been toward successes, both technically and economically. Even failures have added much to the body of knowledge that we have accumulated in the industry. In recent years, a recurring theme of aquaculture conferences has been “profitability and sustainability” (1). The attainment of these goals has generally been driven by a combination of the following: • Realizing or improving profitability of existing
species; • Attaining economic viability in the culture of
new species; and • Improving the environmental impact of
operations. In order to achieve these goals, innovation has occurred in the development of components and in the design, construction, and operation of recirculating aquaculture operations worldwide. In the following examples, we will present technologies that illustrate some innovative ideas in our industry. The technologies we will review consist of improvements developed at the components level as well as the systems level.
The North Carolina State University Fish Barn Project The original Fish Barn program was developed by Dr. Tom Losordo in 1989 to investigate the feasibility of water-reuse systems for use in water-limited areas of the Piedmont of North Carolina. The program continues to operate a facility consisting of a nursery, an advanced nursery, and growout systems for growing finfish, housed in a 390 m2 insulated pole barn structure. A complete description of the facility and operational characteristics are found in Losordo (2). The nursery and advanced nursery systems are stand-alone systems, each with separate water treatment components and housed in separate rooms at one end of the facility. These rooms allow for isolation of newly received fingerlings for a suitable time period before they are transferred to the larger growout units in the main room of the facility. Growout systems are designed with two tanks, each 56 m3. Solids filtration is accomplished using components developed and marketed by AquaOptima A/S of Trondheim, Norway. Center drains or particle traps (Eco-Trap 300, AquaOptima A/S, Trondheim, Norway) are designed to separate the flow stream out of the tank into two flow components. While the larger flow is routed through a drum screen filter (Hydrotech 802, Hydrotech AB, Vellinge, Sweden), the smaller flow stream with higher solids concentration is directed to a swirl settler, the sludge collector. Clarified effluent from the sludge collector then joins with the main flow from the

Proceedings of the Canadian Freshwater Aquaculture Symposium – Aquaculture Canada 2004
AAC Spec. Publ. No. 11 (2006) 87
tank and is passed through the drum screen filter, and then by gravity through a trickling biofilter. While each tank has a corresponding biofilter, the two individual biofilters of a two-tank growout unit are hydraulically coupled to allow water collected in the bottom of each biofilter to equalize the water level of the two units. A grid of membrane diffusers (FlexAirTM 9” Disc Diffuser, Catalog Number ED327, Aquatic Eco-Systems, Apopka, FL, USA) submerged within each biofilter unit provides aeration of the collected water for dissolved carbon dioxide removal. System water is then lifted by centrifugal pumps (Pirahna S45A, Aquatic Eco-Systems, Apopka, FL, USA), passed through downflow oxygen saturators (OY110, Aquatic Eco-Systems, Apopka, FL, USA), and routed to the culture tanks through two in-tank vertical manifolds. System water enters the tanks at an oxygen concentration of approximately 300% saturation. Southern Farm Tilapia, LLC. Located in north central North Carolina, Southern Farm Tilapia, LLC (SFT) currently operates two growout units, a hatchery, and a central office/processing facility. Completed in November, 2000, Growout Unit 1 is located near Castalia, North Carolina, and consists of two recirculating systems, with each system having three 95 m3 culture tanks. Each tank is equipped with internal particle traps (Eco-Trap 250, AquaOptima A/S, Trondheim, Norway) and external sludge collectors for solids removal. Combined flow from the three tanks on the system passes through a drum screen filter (Hydrotech 1203, Hydrotech AB, Vellinge, Sweden) before flowing by gravity to a series of floating bead biofilter units. Operated in a downflow configuration, each of the biofilter units consists of a vertical inner corrugated pipe to contain the floating bead material (Type C Polystyrene Beads, Modern Polymers, Inc., Cherryville, NC, USA), and is placed within a larger diameter vertical corrugated pipe which provides an aeration and pumping sump. System water is then returned to the culture tanks by centrifugal pumps (Pirahna S45A, Aquatic Eco-Systems, Apopka, FL, USA) via a pipe manifold, and is oxygenated by downflow oxygen saturator cones (OY60F, Aquatic Eco-Systems, Apopka, FL, USA) before release into the culture tanks via vertical manifolds. Individual oxygen saturators for each tank allow for flexibility in adjustment of both water and oxygen inputs, resulting in greater efficiency in oxygen use.
SFT’s second growout unit, located near Wilson, North Carolina, was built two years after the first unit, and illustrates the value of experience in building and operating a facility and the facility evolution that can occur. Tank size and layout is essentially identical in both units, however, Unit 2 represents a significant improvement in the design and operation of the biological filtration units. Figure 1 illustrates the comparative layouts of the two units. At Unit 2, microbead biofilter units have been located within a round tank that is identical to the main culture tanks. The main biofilter tank for each three-tank system has been dropped to a lower elevation to allow for gravity flow from the culture tanks, through a drum screen filter (Hydrotech 1203, Hydrotech AB, Vellinge, Sweden). Plastic corrugated pipes are placed vertically within the biofilter tank to retain microbeads and to allow downward flow through the multiple microbead beds. Water exits the bottom of the corrugated pipes and is retained in the main biofilter tank, where heavy aeration by a regenerative blower liberates dissolved carbon dioxide and adds oxygen. A recycle pump recirculates water from the biofilter tank back through the microbead filters for additional biofiltration and dissolved gas stripping. An additional significant improvement in the layout and operation of SFT Unit 2 is the placement of the main pumps in relation to the main biofilter tank. Pumps are placed in an easily accessible area at the base of the tank, and are connected to the tank so that each has a flooded suction. This arrangement provides greater pumping efficiency, as well as greater reliability of re-establishing flow in the event of power failure or shutdown.

Proceedings of the Canadian Freshwater Aquaculture Symposium – Aquaculture Canada 2004
88 AAC Spec. Publ. No. 11 (2006)
Southern Farm Tilapia, Unit 2Southern Farm Tilapia, Unit 1
Recycle Pump
BioSump with Microbead Biofilters
95,000 Liter Growout Tanks
Oxygen Saturators
Drum Screen Filter
Main Pumps
Main Pumps
Drum Screen Filter
Oxygen Saturators
95,000 Liter Growout Tanks
BioSumps with Microbead Biofilters
Figure 1: Schematic diagram comparison of recirculating system layouts of Southern Farm Tilapia, LLC, Unit 1 and Unit 2. Pneumatic “Drop” Bead Filters This filter is produced and marketed by Aquaculture Systems Technologies, LLC, of New Orleans, Louisiana. The patent holder and inventor, Dr. Ron Malone of Louisiana State University, was granted two patents for the “Air charged backwashing bioclarifier” on June 23, 1998 and February 11, 2003 (3). The unit consists of two chambers, a filter chamber for housing the floating bead material, and the charge chamber for accumulating air (4). The filter has a construction which allows for inlet and outlet water to enter and exit from either or both sides of the filter housing. Inlet water can be supplied by pumping or with air lifts. With a constant supply of low pressure (approx. 1 bar) air, an accumulation of air occurs in the charge chamber. As the charge chamber accumulates the maximum amount of air, the integral “air trigger” allows a sudden release of the accumulated air directly upward into the bead bed, displacing water and causing the bead bed to become agitated and to drop into the void created by the air, thus releasing trapped solids. Solids are then settled in the bottom chamber of the filter case for later draining. This backwashing sequence can occur with both air and water inputs uninterrupted, resulting in a filter that can be set up with a constant air flow to
accomplish automatic backwashing. Given the volume of the charge chamber and the proper regulation of air input, the frequency of backwashing can be manipulated. This new type of filter is beginning to be deployed for use on recirculating aquaculture systems. Preliminary testing has been done with a 0.08 m3 (nominal 3 cubic feet) model Drop Filter installed at the North Carolina State University Fish Barn. Similarly sized filters have been specified for use at the new wet laboratory of the Shrimp Biotechnology Business Unit of the National Center for Genetic Engineering and Biotechnology in Bangkok, Thailand. The McRobert Aquaculture System The first commercial installation in the United States of the McRobert Aquaculture System (5) is being operated by Deca J Farms of Clinton, North Carolina, USA. The system was conceived and developed in Australia, and is being used to culture a number of both marine and freshwater species. This unique and imaginative system consists of fiberglass tanks with tank liners that can be inflated with air and water to displace the entire volume of water and fish, in a flow that can be channelled to other tanks or to a central fish grader. The system allows movement of stock

Proceedings of the Canadian Freshwater Aquaculture Symposium – Aquaculture Canada 2004
AAC Spec. Publ. No. 11 (2006) 89
from tank to tank for purposes of sorting, ongrowing, or harvesting without having to net, handle, or otherwise touch the fish. This system is designed for those fish that are sensitive to handling or for those species that must be size graded frequently in order to reduce mortality caused by cannibalism. An additional advantage of the system is that after a tank liner has been inflated and stock has been moved from the tank, the liner can be cleaned and rinsed, and then allowed to dry or returned to service. This feature is obviously attractive from the system hygiene standpoint. In developing the tank system, one of the major obstacles that was overcome was the design of removable center drains and inlet manifolds which allows the tank liner to be inflated. These structures have been designed to be quickly and easily disconnected and removed so that the liner can be fully inflated. At Deca J Farms, evaluation of the system for growing yellow perch and hybrid striped bass is continuing. The McRobert Portable Fish Grader A further outgrowth of the McRobert Aquaculture System is the McRobert Portable Fish Grader. A permanently installed or fixed grader was originally a component of the McRobert Aquaculture System. The portable grader is similar in theory and design, but is made so that it can be moved on rollers throughout a facility to grade batches of fish in different tanks. Simple connections for water and air are required. Grader panels with fixed spacing can be installed in the grader. An external wheel is used to rotate the grader panel up through the grader tank from under the first batch of fish to be graded. By moving the grader panel alternately upward and downward, as well as raising and lowering the water level within the grader, fish can be subjected to a gentle “sieving” action of the grader bars. Smaller fish pass downward through the bars, while larger fish are retained above the grader panel and are then directed into transfer boxes designed to drain to a controlled level so that the
graded fingerlings can be transferred for restocking. The Mote Aquaculture Sturgeon Project Located near Sarasota, Florida, USA, the Mote Aquaculture Sturgeon project is a part of Mote Marine Laboratory’s Center for Aquaculture Research and Development. The sturgeon project is a facility comprised of four recirculating systems, with each system having four 36-cubic meter dual-drain tanks. A typical system layout is represented in Figure 2. The project will produce both sturgeon meat and caviar, and the systems have been designed to promote the effective removal of solid waste. In sturgeon culture, off flavor can affect both the meat and the caviar if waste solids are allowed to remain in the systems where they can be re-consumed by the fish, or if they contribute to the growth of heterotrophic bacteria (6). In two of the four systems, effluent water from the tanks is passed through a drum screen filter (RFM 4872 Drumfilter, PRAqua Supplies, Ltd., Nanaimo, British Columbia, Canada) and then to a moving bed biofilter for nitrification. Collected at the far end of the biofilter, water is then returned to the culture tanks with a 5-HP, low-head axial flow pump (American-Marsh Pumps, Collierville, TN, USA), controlled with an adjustable frequency drive (GE/Fuji Model AF-300 P11, GE Fuji Drives USA, Inc., Salem, Virginia, USA). The adjustable frequency drive allows the operator to vary the output of the axial flow pump to increase or decrease flow as feed rates and biofiltration needs change. Although capital costs for the pump and adjustable frequency drive are high, the operational flexibility and control that it provides in this necessary function, as well as savings in pumping cost over the longer term, should warrant the additional expense.

Proceedings of the Canadian Freshwater Aquaculture Symposium – Aquaculture Canada 2004
90 AAC Spec. Publ. No. 11 (2006)
FilterDrum Oxygenator
Feeder K-8 Feeder K-7 Feeder K-6 Feeder K-5
Tank K-5Tank K-6Tank K-7Tank K-8
Moving Bed Biofilter 1Sump
Aeration Moving Bed Biofilter 2Oxygenator
Axial Flow Pump
Figure 2: Components and system layout for four-tank recirculating system, Mote Sturgeon Project, Center for Aquaculture Research and Development, Mote Aquaculture Park, Sarasota, FL, USA. Conclusions As demonstrated in the past, creating profitable and sustainable recirculating aquaculture operations is a great motivator for innovation. In the hands of researchers and commercial aquaculturists, new equipment and operations methods have been developed. In our industry, there is generally an expectation that economic and environmental conditions will continue to create a business environment in which innovation will be required.
References 1. AustralAsian Aquaculture, 2004. Conference
Brochure, New South Wales Fisheries, Nelson Bay, NSW, Australia.
2. Losordo TM, Hobbs AO, and DeLong DP, 2000. The design and operational characteristics of the CPandL/EPRI Fish Barn, a demonstration of recirculating aquaculture technology. Aquacult. Eng. 22, 3-16.
3. United States Patent and Trademark Office, Washington, DC, USA, Homepage. http://www.uspto.gov/, Accessed October 5, 2004.
4. AST, 2003. Pneumatic “Drop” Bead Filter Manual. Aquaculture Systems Technologies, LLC, New Orleans, LA.
5. McRobert Aquaculture Systems. Homepage. http://www.mcrobert.com.au/, Accessed October 5, 2004.
6. Michaels J, Mote Aquaculture Park, Sarasota, FL, USA, personal communication.

Proceedings of the Canadian Freshwater Aquaculture Symposium – Aquaculture Canada 2004
AAC Spec. Publ. No. 11 (2006) 91
Les circuits fermés et les coûts d’énergie Robert Champagnea et Gilles Filionb aMinistère de l’Agriculture, des Pêcheries et de l’Alimentation, 200, chemin Sainte-Foy, Québec (Québec) G1R 4X6 bLes Consultants Filion, Hansen et ass. inc., 22, rue Leclerc, Baie-Saint-Paul (Québec) G3Z 3B6 En conditions nordiques, l’aquaculture en circuit fermé offre l’avantage d’avoir une régularisation possible de la température de l’eau pour une croissance optimale des poissons et une productivité accrue des bassins piscicoles. Cette régularisation et cette optimisation des conditions d’élevage amènent une plus grande consommation énergétique par rapport à une station piscicole en circuit ouvert. Dans une station piscicole en circuit fermé, en plus du pompage de l’eau nouvelle (eau souterraine) et de l’oxygénation, les points additionnels de consommation d’énergie sont : le chauffage de l’eau nouvelle, la ventilation pour le dégazage (contrôle du CO2), le maintien de la température de l’eau suite au dégazage, les équipements de traitement (filtration, écumage), le pompage de l’eau réutilisée, la désinfection ou la stérilisation et le chauffage du bâtiment. Dans une station piscicole en circuit fermé, la consommation d’oxygène par les poissons additionnée à celle des filtres bactériens est généralement le double de celle d’une station piscicole en circuit ouvert. De plus, afin de faciliter le traitement de l’eau dans les stations piscicoles en circuit fermé, l’oxygène pur est utilisé contrairement à l’aération en circuit ouvert. Des variantes sont aussi possibles dans une station piscicole en circuit fermé en ce qui concerne les techniques et les hauteurs de pompage et le système de dégazage. Le présent document fait donc un bilan des principaux points de consommation d’énergie dans le but d’établir des coûts unitaires comparatifs entre la technologie danoise et nord-américaine.
In Nordic conditions, fish farming in recirculation offers the advantage to have a possible regularization of water temperature for an optimal growth of fishes and an increased productivity of fish tanks. This regularization and this optimization of rearing conditions bring higher energy consumption compared to an open flow fish farm. In recirculated fish farming systems, besides the pumping of new water (groundwater) and the oxygenation, the additional points of energy consumption are: the heating of the new water, the ventilation for the degassing (control of the CO2), the preservation of the water temperature further to degassing, the equipments of water treatment (filtration, skimming), the pumping of reused water, the disinfection or the sterilization and the heating of the building. The oxygen consumption of fishes added to that of the biofilters doubles generally in recirculated fish farming systems compare to a flow trough system. Furthermore, pur oxygen is used to facilitate the water treatment in recirculated fish farms, contrary to aeration in traditional farms. Variants are also possible in water recycle technology regarding techniques and heights of pumping and system of degassing. This paper thus assesses main points of energy consumption with the aim of establishing comparative unit costs between Dane and North American technologies. Introduction L’intérêt du circuit fermé en production piscicole est croissant en raison de la faible quantité d’eau requise soit moins de 5 % d’une station piscicole en circuit ouvert. Plus de sites sont alors disponibles à l’établissement et il est envisageable de chauffer l’eau pour une plus grande productivité des installations piscicoles en situation nordique. De plus, il est possible d’être plus efficace pour réduire les rejets dans l’environnement.
Les stations piscicoles en recirculation consomment généralement plus d’énergie et d’oxygène que les stations piscicoles en circuit ouvert. Les points de consommation énergétique sont principalement au niveau du pompage, du chauffage de l’eau, du dégazage et du maintien des températures durant la période hivernale. La consommation d’oxygène est généralement le double de celle en circuit ouvert dû au besoin en oxygène des bactéries hétérotrophes et nitrifiantes qui est équivalente à celle des poissons (1). Le présent texte présente une analyse comparative des coûts en énergie et en oxygène de deux modèles de station piscicole en circuit

Proceedings of the Canadian Freshwater Aquaculture Symposium – Aquaculture Canada 2004
92 AAC Spec. Publ. No. 11 (2006)
fermé soit un premier basé sur une conception nord-américaine dans nos conditions climatiques et un autre modèle basé selon une conception danoise dans les conditions climatiques du Danemark. Le volume de production pour les deux modèles sera 200 tonnes de truites arc-en-ciel par année. Description des stations piscicoles La station piscicole nord-américaine serait construite ainsi :
- 4 unités distinctes avec 5 circulaires de type « Cornell » de 100 m3 chacun, volume total de contention de 2 000 m3;
- Traitement de l’eau par sédimenteurs circulaires (swirl) pour les eaux de fond, filtres micro-tamis pour les eaux des drains latéraux et provenant des « swirl », et des biofiltres à lits fluidisés;
- Oxygénation et dégazage assurés par colonnes de dégazage avec ventilation et des « LHO » (Low Head Oygenators);
- Pompes axiales pour les déplacements d’eau;
- Débit d’eau circulant de 3 000 m3/h, un temps de séjour de 40 minutes dans les bassins de production;
- Débit d’eau nouvelle de 90 m3/h ou 3 % du débit circulant, temps de séjour de l’eau nouvelle de 23 heures (volume de 2 100 m3);
- Température d’eau à 12°C toute l’année; - Installations piscicoles dans un bâtiment
isolé; et - Inventaire maximum dans l’année de 50 %
de la production annuelle soit à 100 tonnes pour un entassement moyen de 50 kg/m3.
La station piscicole danoise serait construite ainsi :
- 1 unité de production avec 4 « raceway »
en série pour un volume total de 2 640 m3, trois zones de contention de 200 m3 par raceway, volume total de contention de 2 400 m3;
- Traitement de l’eau par des zones de sédimentation (3 zones par raceway) munies de trappes à sédiments constitués de cônes, filtration avec micro-tamis et filtration biologique à lit submergé et aéré avec modules « kaldnes »;
- Oxygénation, dégazage et déplacement de l’eau assurés par 4 puits d’aération en mode « air-lift »;
- Débit d’eau circulant de 2 160 m3/h, temps de séjour dans les 4 « raceway » de 1,2 heures;
- Débit d’eau nouvelle de 115 m3/h ou 5 % du débit circulant, temps de séjour de l’eau nouvelle dans la station piscicole d’environ 24 heures (volume de 2 750 m3);
- Température d’eau de 4 à 11°C, eau nouvelle non chauffée;
- Installations piscicoles à l’extérieur; et - Inventaire maximum dans l’année de 60 %
de la production annuelle soit 120 tonnes pour un entassement moyen de 50 kg/m3.
Un coût de 0,065 $/kWh a été appliqué dans les deux cas de stations piscicoles pour fin de comparaison bien que le coût de l’électricité au Danemark est environ le double de celui du Québec. Le pompage de l’eau nouvelle Les deux modèles de station piscicole ont un approvisionnement en eau provenant d’un puits tubulaire avec une hauteur totale de pompage (relevage + friction) de 15 m. Les puits sont munis de pompes dont les efficacités hydrauliques et électriques sont respectivement de 70 % et de 85 %. Pour le modèle nord-américain utilisant un débit de 90 m3/h, la puissance requise est de 5,25 kW, pour une consommation annuelle de 54 130 kWh et une consommation unitaire de 0,27 kWh/kg de production. Le coût annuel pour le pompage en eau nouvelle est de 3 520 $ pour un coût unitaire de 0,018 $/kg. Pour le modèle danois utilisant un débit de 115 m3/h, la puissance requise est de 6,71 kW, pour une consommation annuelle de 69 170 kWh et une consommation unitaire de 0,35 kWh/kg de production. Le coût annuel pour le pompage en eau nouvelle est de 4 500 $ pour un coût unitaire de 0,022 $/kg. Le pompage de l’eau réutilisée Dans le modèle nord-américain, le débit d’eau à recirculer est de 2 910 m3/h en considérant que l’eau nouvelle est acheminée directement au haut des dégazeurs. Les pertes de charge (hauteur hydraulique) considérées pour déterminer la hauteur de pompage sont:

Proceedings of the Canadian Freshwater Aquaculture Symposium – Aquaculture Canada 2004
AAC Spec. Publ. No. 11 (2006) 93
- De 0,35 m pour celles dues à l’écoulement d’eau des drains de fond et des drains latéraux des bassins vers les équipements de traitement;
- De 0,35 m pour celles des équipements de traitement soit la perte de charge du sédimenteur circulaire (swirl) suivi du filtre à tambour;
- De 0,3 m afin d’assurer l’écoulement de l’eau dans le lit fluidisé;
- De 1,5 m pour le dégazeur et de 1,2 m pour le « LHO », ces deux éléments superposés; et
- De 0,50 m pour assurer la distribution de l’eau vers les bassins et disposer d’une certaine vitesse d’eau à l’entrée des bassins pour favoriser l’autonettoyage.
Le haut du lit fluidisé est positionné pour qu’il y ait un écoulement à gravité vers les dégazeurs, le « LHO » et dans les conduites de retour d’eau aux bassins. Ainsi, le filtre biologique pourrait être positionné à une élévation pour tout juste assurer cet écoulement à gravité afin qu’il ait une hauteur hydraulique équivalente à celle des dégazeurs, du « LHO » et des conduites de retour d’eau. Le filtre biologique serait enfoui en partie dans le sol. Cette configuration serait une des plus économiques en termes de fonctionnement (2). La hauteur totale de relevage d’eau recirculée est de 4,20 m (figure 1). En considérant des efficacités hydraulique et électrique respectives de 72 % et de 87 %, la puissance totale serait 46 kW. La consommation totale serait de 465 502 kWh ou sur une base unitaire de 2,33 kWh/kg de production. Le coût annuel d’exploitation serait de 30 258 $ ou 0,151 $/kg. La station piscicole de modèle danois doit alimenter en air 4 puits en mode « air-lift ». Selon des données récoltées lors d’une mission au Danemark, le débit spécifique en air est de 0,28 m3/h d’air /m3/h d’eau déplacée dans chacun des puits. La pression d’air à la sortie des compresseurs est de 0,4 bar, le puits « air-lift » à une profondeur de 4 m. Le débit d’eau de 2 160 m3/h est déplacé par 4 puits en séries, le débit d’air total requis est alors de 2 420 m3/h. En considérant l’utilisation de deux compresseurs à lobes rotatifs, ils nécessiteraient chacun une puissance de 25 bhp et un total de 50 bhp ou 37,5 kW. En considérant une efficacité électrique de 90 %, la consommation annuelle serait de 365 000 kWh ou 1,83 kWh/kg de production. Le coût
annuel d’exploitation serait de 23 725 $ ou 0,119 $/kg. L’aération des biofiltres Dans le modèle nord-américain, l’agitation du biofiltre est assurée par le déplacement assez rapide de l’eau dans un mouvement ascendant. Il n’y a pas d’énergie additionnelle à fournir. Le biofiltre sera un lit fluidisé constitué de 30 m3 (volume au repos) de sable. À 12°C, un taux de nitrification de 0,7 kg de TAN/m3/j a été considéré(1). Dans le modèle danois, il y a une diffusion d’air dans le biofiltre afin d’homogénéiser le milieu bactérien. Selon les données récoltées lors de la mission, le débit spécifique d’air est de 370 m3 d’air/h/100 m3 de volume de biofiltre. Le volume du biofiltre est déterminé par la ration journalière d’aliment. En considérant une ration journalière de 0,7 % de l’inventaire, la quantité maximale d’aliment servi est de 840 kg/j en été. La quantité d’ammoniac produit est de 30 g TAN/kg d’aliment soit 25 200 g de TAN/j (3). En considérant une température d’eau de 11°C, le taux de nitrification serait de 0,48 g de TAN/m2/j (4) et la surface nitrifiante serait de 52 500 m2. Les modules « Kaldnes » ont une surface spécifique de support bactérien de 500 m2/m3, le volume du biofiltre est alors de 105 m3. Le débit d’air requis est de 390 m3/h à une pression de 0,2 bar. La puissance requise pour actionner le compresseur est de 5 bhp ou de 3,75 kW. En considérant une efficacité électrique de 85 %, la consomation annuelle en électricité est de 38 647 kWh pour une consommation unitaire de 0,19 kWh/kg de production. Le coût annuel d’exploitation serait de 2 512 $ ou 0,013 $/kg.

Proceedings of the Canadian Freshwater Aquaculture Symposium – Aquaculture Canada 2004
94 AAC Spec. Publ. No. 11 (2006)
Figure 1: Schéma illustrant les élévations, modèle en Amérique du nord. Contrôle du CO2 Selon le modèle danois, la réduction de la concentration et le contrôle du CO2 sont faits par l’aération par bullage au niveau des 4 puits de type « air-lift ». Il n’y a pas de coût additionnel en énergie. Selon le modèle nord-américain, l’eau recirculée est acheminée dans des colonnes d’oxygénation/dégazage dans lesquelles on fait passer à contre-courant, un débit d’air équivalent à au moins 6 fois le débit d’eau (3). Le débit d’eau de l’ensemble des colonnes est de 3 000 m3/h, le débit d’air requis est de 18 000 m3/h. La pression statique de l’air à l’entrée des colonnes serait entre 0,4 et 1,1 po H2O ou entre 100 à 275 pascals (5). En consultant des fiches techniques de ventilateurs centrifuges, la puissance totale requise serait de 4 kW. Comme il y a 4 unités de production distinctes, il y aurait 4 ventilateurs de 1 kW. La consommation annuelle en électricité, en considérant une efficacité électrique de 80 %, serait de 43 800 kWh ou de 0,22 kWh/kg de production. Le coût annuel d’exploitation serait de 2 847 $ ou 0,014 $/kg.
Oxygénation La consommation en oxygène est proportionnelle à la consommation d’aliment soit de 0,5 kgO2/kg d’aliment servi (3). Pour la station piscicole modèle nord-américaine, la consommation journalière d’aliment est de 700 kg/j, le besoin en oxygène est de 350 kgO2/j. L’eau recirculée passe dans une colonne d’oxygénatio/dégazage, nous pouvons considérer que la concentration en oxygène est à au moins 95 % de la saturation à la sortie. Comme la consommation d’oxygène est davantage concentrée durant le jour, de façon arbitraire, une contribution des colonnes d’oxygénation/dégazage sur 15 heures sera considérée. Nous considérons que 35 % de l’O2 de l’eau est disponible aux poissons.
1,5 m
0,3 m
1,2 m
0,5 m
0,7 m
Pompe Filtre biologique
Dégazeur
LHO
Bassins
Contrôle du niveau d’eau Swirl
Micro-ta mis
Non à l’échelle

Proceedings of the Canadian Freshwater Aquaculture Symposium – Aquaculture Canada 2004
AAC Spec. Publ. No. 11 (2006) 95
L’apport en oxygène sera de: 3000 m3/h x 10,2 mgO2/l x 35 % x 15 hres x FU = 160 kgO2/j où : 10,2 mgO2/l : concentration à 12°C et 95 % de la saturation FU =1/1000, facteur d’ajustement des unités Il reste à combler un apport en oxygène de 190 kgO2/j par les sursaturateurs « LHO ». En considérant une efficacité de 65 % d’absorption d’oxygène, la consommation d’oxygène pur sera de 292 kgO2/j ou 219 m3O2/j (1,332 kgO2/m3 à 1 atm et à 20°C). En posant comme hypothèse que la consommation en oxygène est relativement constante toute l’année, l’achat annuel d’O2 est de 80 091 m3 pour un coût annuel de 29 634 $ à un coût unitaire de 0,37$/m3de O2 (location réservoir et achat de O2). Le coût unitaire en achat d’oxygène est de 0,148 $/kg. Pour la station piscicole suivant le modèle danois, la consommation en oxygène est en pointe en été et la demande maximale basée sur la moulée distribuées, soit 840 kg/j, est de 420 kgO2/j. L’apport en oxygène est apporté par les 4 puits en mode « air-lift ». En considérant que la concentration en oxygène est remontée à 95 % de la saturation à la sortie de chaque, l’apport en oxygène des puits est : 4 x 2 160 m3/h x 10,5 mgO2/l x 35 % x 15 hres x FU = 476 kgO2/h où: 10,5 mgO2/l : concentration en oxygène à 11°C et 95 % de la saturation FU =1/1000, facteur d’ajustement des unités Les puits de la station piscicole danoise en mode « air-lift », sont en mesure de combler la demande maximale en oxygène des poissons en été. Il n’y a pas de coût additionnel. Le chauffage de l’eau et du bâtiment Dans la région de Québec, les températures atmosphériques sont marquées par des écarts mensuels beaucoup plus grands qu’au Danemark (figure 2). Les températures froides en hiver
amèneraient un refroidissement important de l’eau d’une station piscicole en recirculation et celles d’été beaucoup plus chaudes pourraient amener un réchauffement de l’eau piscicole.
-12,8-11,1
-4,6
11,2
16,519,2 17,9
12,5
6,2
14
1
-9,1
-0,7
3,379
111110
7
2-2-2
-15
-10
-5
0
5
10
15
20
25
Janv
ier
Févr
ier
Mar
s
Avr
il
Mai
Juin
Juill
et
Aoû
t
Sept
embr
e
Oct
obre
Nov
embr
e
Déc
embr
e
Tem
péra
ture
(C)
QuébecDanemark
Figure 2: Températures moyennes atmosphériques
Au Danemark les bassins sont, soit à l’extérieur ou dans un bâtiment non isolé et non chauffé. L’eau n’est pas chauffée en hiver. Dans la région de Québec, il est donc préférable qu’une station piscicole en recirculation soit à l’intérieur d’un bâtiment isolé et chauffé. Idéalement, la température de l’eau devrait être augmentée (12°C) pour une plus grande productivité des installations. Pour compenser les pertes en chaleur durant l’hiver et s’assurer du maintien de la température d’élevage il faut maintenir une température ambiante de 12°C en chauffant le bâtiment. En considérant que l’eau nouvelle provient d’un puits et que sa température est constante à 7°C durant toute l’année, le système de chauffage devra assurer une augmentation de température de 5°C durant 10 mois sur 12. Le système de chauffage fonctionnera en récupération de chaleur à partir des eaux usées vers les eaux nouvelles, il sera constitué d’un échangeur passif et de pompes thermiques. Pour un débit de 90 m3/h, la puissance totale de chauffage requise est de 525 kW. En considérant que l’échangeur passif contribue à 60 % soit 315 kW, la partie à combler par les pompes thermiques est de 210 kW. Avec des pompes thermiques de type eau-eau, ayant un coefficient d’opération et de performance (COP) de 4,5, la puissance électrique est de 47 kW. La consommation annuelle en électricité est de 340 667 kWh, soit une consommation unitaire de 1,70 kWh/kg. Le coût annuel serait de 26 572 $ et le coût unitaire est de 0,133 $/kg.

Proceedings of the Canadian Freshwater Aquaculture Symposium – Aquaculture Canada 2004
96 AAC Spec. Publ. No. 11 (2006)
La superficie du bâtiment est de 2 875 m2. Les niveaux d’isolation seraient de RSI 3,2 (R18) pour le plafond, de RSI 2,64 (R15) pour les murs et les fondations seraient isolées en périphérie avec 50 mm de polystyrène (styrofoam). Un échange horaire d’air équivalent à 0,1 % du volume du bâtiment a également été considéré. Cet échange d’air est indépendant de celui requis pour le dégazage, il peut équivaloir aux échanges naturels présents dans un bâtiment dû aux ouvertures. Les températures moyennes mensuelles à Québec ont été utilisées pour calculer le besoin en chauffage. Sur la base d’un chauffage électrique, la consommation annuelle serait de 187 677 kWh et 0,938 kWh/kg. Le coût annuel de chauffage serait de 12 199 $ et pour un coût unitaire de 0,061 $/kg. Les pertes de chaleurs par le dégazage du CO2 Le débit d’air requis pour assurer le dégazage de l’eau est de 18 000 m3/h. Le contact dû à un seul passage de ce débit d’air dans le débit d’eau ne réduira pas de façon perceptible la température de l’eau. Cependant, l’effet cumulatif dans le temps dû à la recirculation de l’eau amène certainement un refroidissement qui peut atteindre près de 2°C par jour en hiver, si la température de l’air est à -13°C et à 40 % d’humidité relative (HR). La perte énergétique de l’eau résulte du réchauffement de l’air à 12°C et de l’évaporation de l’eau pour saturer cet air à 100 % HR (hypothèse de travail ou de calcul). Réchauffement de l’air En utilisant la température moyenne en janvier à Québec de –12,8°C, l’augmentation de la température de l’air est 24,8°C. La capacité de chaleur de l’air est de 1 kjoule/kg d’air sec/°C. La densité de l’air sec à –12,8°C est de 1,25 kg/m3. 18 000 m3/h x 1,25 kg/m3 x 1 kj/kg -°C x 24,8°C = 558 000 kj/h ou 155 kW. Augmentation de l’humidité relative À -12,8°C et à 70 % HR, l’air contient 0,001 kg d’eau/kg d’air sec et à 12°C et à 100 % HR, l’air contient 0,0087 kg d’eau/kg air sec. Pour évaporer l’eau, il faut fournir 2 471 kjoules/kg d’eau. 18 000 m3/h x 1,25 kg/m3 x (0,0087 – 0,001 kg d’eau/kg air sec) x 2 471 kj/kg d’eau = 428 101 kj/h ou 119 kW.
En janvier, la puissance de refroidissement de l’eau est donc de 274 kW. À chaque passage dans les colonnes d’oxygénation/dégazage, la température de l’eau peut diminuer de 0,08°C. Comme l’eau passera 24 fois par jour dans les colonnes, le refroidissement subi par l’eau est de 1,92°C/j. En été, les teneurs en humidité de l’air avant et après la colonne de dégazage sont à peu près identiques. Le phénomène d’évaporation ou de condensation de l’eau dans l’air, n’amènera pas d’effet sensible sur la température de l’eau. Sur une base annuelle, l’énergie requise pour compenser l’effet du dégazage est très importante soit 1 041 618 kWh ou 5,21 kWh/kg de production. En considérant que l’on met en place des équipements ou des systèmes pouvant récupérer 70 % de cette énergie, la consommation d’énergie serait alors de 312 485 kWh ou 1,56 kWh/kg de production. Le coût additionnel en chauffage d’eau 20 312 $ ou 0,102$/kg. Conclusions La plus grande différence en matière de consommation énergétique est au niveau des besoins en chauffage. Ces derniers représentent
2.33
0.22
1.7
0.94
1.56
7.02
00.27 0.190.35
2.37
0 0 0 0
1.83
0
1
2
3
4
5
6
7
8
Qea
u no
uvel
le
Qea
u re
circ
ulée
Qai
r bio
filtre
Qai
r dég
azag
e
Cha
uffa
ge e
au
Cha
uffa
gebâ
timen
t
Cha
uffa
ge a
irdé
gaza
ge (3
0%)
Tota
l
Kw
/kg
Amérique du Nord
Danemark
Figure 3: Consommation spécifique d'énergie

Proceedings of the Canadian Freshwater Aquaculture Symposium – Aquaculture Canada 2004
AAC Spec. Publ. No. 11 (2006) 97
0,627
0,0140
0,018
0,148 0,133
0,0610,102
0,151
0,022
0,119
0,0130 0 0 0 0
0,154
0
0,1
0,2
0,3
0,4
0,5
0,6
0,7Q
eau
nouv
elle
Qea
u re
circ
ulée
Qai
r bio
filtre
Qai
r dég
azag
e
Oxy
gène
Cha
uffa
ge e
au
Cha
uffa
gebâ
timen
t
Cha
uffa
ge a
irdé
gaza
ge (3
0%)
Tota
l
$/kg
Amérique du NordDanemark
Figure 4: Coûts unitaires en énergie
près de la moitié des besoins énergétiques en Amérique du Nord avec 4,2 kWh/kg et 0,296 $/kg de production (figures 3 et 4). Sans les besoins en chauffage, les coûts énergétiques en tenant compte de l’oxygénation sont quand même deux fois plus élevés pour la station en Amérique du Nord qu’au Danemark avec respectivement 0,331 $/kg et 0,154 $/kg (figures 3 et 4). En tenant compte du coût d’électricité au Danemark, les coûts unitaires de production pour le pompage, l’oxygénation et le dégazage sont similaires à ceux d’ici. Par contre, les coûts énergétiques globaux incluant ceux du chauffage, sont quand même 4 fois plus élevés ici qu’au Danemark pour un même coût unitaire de l’électricité, soit 0,627 $/kg et 0,154 $/kg respectivement. Les puits de type « air-lift » réalisent trois fonctions, soit le déplacement d’eau, l’oxygénation de l’eau et le dégazage du CO2. Est-ce que ces puits « air-lift » permettent un dégazage suffisant du CO2? Le débit d’air pour dégager le CO2 est équivalent au débit d’eau alors que dans l’approche américaine, le débit d’air requis est équivalent à plus de 6 fois le débit d’eau. De plus, n’y aurait-il pas une augmentation de la sursaturation en azote (N2) dans l’eau piscicole ? Le fait d’avoir des puits « air-lift » de 4 m de profond et l’effet cumulatif des passages à répétition de l’eau dans chacun des puits, ne peut–il pas favoriser cela ?
Ainsi, dans notre contexte climatique en Amérique du Nord, il faudra faire des choix judicieux et faire preuve d’ingéniosité pour réduire les coûts en énergie et atteindre une plus grande compétitivité de production des systèmes piscicoles en recirculation. À cet égard, on peut mentionner:
- Privilégier un approvisionnement en eau souterraine;
- Profiter des sites ayant des rejets thermiques;
- Aménager la station piscicole dans un bâtiment isolé;
- Optimiser le choix des pompes et le positionnement des équipements et bassins pour réduire la tête d’eau;
- Favoriser la récupération de chaleur des eaux usées pour le chauffage de l’eau nouvelle; et
- Viser à récupérer l’énergie accumulée dans l’air suite à la ventilation forcée dans les colonnes d’oxygénation/dégazage par des procédés pour la récupération de la chaleur sensible (échange thermique) et latente (évaporation/condensation).
Références 1. Timmons MB, Ebelling JM, Wheaton FW,
Summerfelt ST, Vinci Bj, Recirculating Aquaculture Systems 2nd Edition, Northeastern Regional Aquaculture Center, Cayuga Aqua Venture© 2002: 97, 231, 287-295.
2. Renaud NJ, Couturier MF, Enrgy Management at Aquaculture Facilities Operating Under Northern Climates, Proceedings of the Fifth International Conference on Recirculating Aquacutlture, Roanoke, July 22-25 2004: 462-472.
3. Timmons MB, Losordo TM, Aquaculture Water Reuse Systems: Engineering design and Management, Developpments in Aquaculture and Fisheries Science, Volume 27, 1994: 151
4. Wheaton W.W., Aquacultural Engineering, John Willey and Sons, New York, 1977: 576.
5. Summerfelt ST, Davidson J, Waldrop T, Vinci BJ, Evaluation of Full-Scale carbon Dioxide Stripping Columns in a Coldwater Recirculating System, Proceeding The Fourth International Conference on Recirculating Aquacutlture , Roanoke, July 18-21 2002: 439-450.

Proceedings of the Canadian Freshwater Aquaculture Symposium – Aquaculture Canada 2004
98 AAC Spec. Publ. No. 11 (2006)
Mass Balance and Nutrient Flows in Freshwater Aquaculture Dominique P. Bureau and Katheline Hua Department of Animal and Poultry Science, University of Guelph, Guelph, ON, N1G 2W1 Fecal and metabolic wastes produced by fish represent most of the wastes released by intensive fish culture operations. The release of solid wastes is a function of the digestibility of various components (dry matter, N, P, etc) of the feed. The release in the environment of dissolved N and P wastes is a function of the metabolic waste production of fish. Metabolic N and P waste outputs are determined by numerous endogenous (biological) and exogenous (dietary, environmental) factors. Nutrition and feeding obviously have determinant effects on amounts of metabolic N and P wastes produced. However, endogenous factors, such as fish species and size/age, may also have very significant impacts. Differences in feed composition, life stages, environmental conditions and methodological approaches amongst studies result in a wide variation in the estimates of N and P waste outputs from fish culture operations in the scientific literature. It is necessary to improve our understanding of the basis and relative contribution of the various determinants in order to develop nutritional, breeding and production strategies aimed at minimizing waste outputs from fish culture operations at the source. The construction of models that mathematically describe nutrient utilization by fish is an effective way of integrating and understanding available information. Strategies to minimize waste output for fish culture operations can then be examined using these relatively simple models. Introduction The environmental impact of waste from the fish culture industry, notably from cage culture operations, is increasingly a matter of close scrutiny by the public and various levels of government in Canada and elsewhere around the world. The main concern is the release of solid and dissolved N and P wastes by fish culture operations since these wastes can impose constraints to the productivity of operations and may lead to environmental degradation. Reducing outputs of these wastes, especially dissolved wastes, is considered a key element for the long-term sustainability of aquaculture in many parts of the world. Since these wastes are ultimately from biological and dietary origins, efforts to reduce waste outputs should concentrate on these sources, either through improvement of the cultured animals themselves (e.g. through genetic improvements), or the feeds and feeding strategies. Determinants of Metabolic Wastes The release of solid wastes from fish culture operations to the environment is a function of the digestibility of various components (dry matter, N, P, etc) of the feed, whereas the release of dissolved N and P wastes is a function of the metabolic waste production of fish. The output of N and P metabolic wastes by fish is determined by
numerous endogenous (biological) and exogenous (dietary, environmental) factors. Nutrition and feeding obviously have determinant effects on amounts of metabolic wastes produced. However, endogenous factors, such as fish species and size/age, may also have very significant impacts. It is necessary to improve our understanding of the basis and relative contribution of these various determinants in order to develop nutritional and breeding strategies aimed at minimizing waste outputs from fish culture operations. 1. Determinants of Nitrogenous Metabolic Wastes Approximately 80-90% of N metabolic wastes excreted by fish are as ammonia. Urea generally only represents 10 to 15% of dissolved N waste outputs (1). The main factors affecting N metabolic waste outputs are those that influence the catabolism and deposition (retention) of amino acids (protein) by the fish. Amino acid composition of the diet is consequently a factor that has a significant effect on the amount of ammonia produced by fish. Feeding amino acids in excess of requirement will result in the catabolism of the amino acid with associated excretion of ammonia and loss of energy. Diets formulated with protein sources of poorer amino acid profile will result in lower digestible nitrogen retention efficiency and greater ammonia excretion.

Proceedings of the Canadian Freshwater Aquaculture Symposium – Aquaculture Canada 2004
AAC Spec. Publ. No. 11 (2006) 99
The balance between digestible protein (DP) and digestible energy (DE) of the diet (DP/DE ratio) is another key factor. Numerous studies have shown that decreasing the dietary DP/DE ratio resulted in an increase in N retention efficiency and a decrease in dissolved N waste outputs of numerous fish species. The is due to the utilization of non-protein energy sources for meeting energy requirements, resulting in a reduction of catabolism of amino acid, commonly referred to as “protein sparing”. Digestible N retention efficiency (N retained/digestible N intake), nonetheless, rarely exceeds 50% in rainbow trout and 60% in Atlantic salmon fed diets with low DP/DE (16-18 g DP/MJ DE). It is not clear to what extent this significant catabolism of amino acids, despite ample supply of non-protein energy (indicated by high lipid deposition), is related to inevitable losses of amino acids or catabolism of amino acids that are in excess of requirement. Recent studies with rainbow trout have shown that preferential catabolism of essential amino acids for energy may be important even when intake of these amino acids is limited (2). Water temperature is frequently assumed to have a significant impact of metabolic N waste excretion by fish. However, studies with rainbow trout reared at different temperature showed that water temperature from 6 to 15ºC had no effect on digestible N retention efficiency (3). Increasing water temperature results in increasing feed intake, growth and N waste outputs per fish per unit of time but does not appear to have any effect on the ratio of N waste produced to digestible protein or N consumed. An increasing number of studies also indicate that catabolism of amino acids is very sensitive to a number of biological factors. Azevedo et al. (4) observed that Atlantic salmon retained a greater proportion of digestible amino acids consumed than rainbow trout of similar size, growing at similar rates, and fed similar diets. This translates into much lower N outputs for Atlantic salmon compared to rainbow trout (Figure 1). Fish size also appears to have a significant impact on efficiency of amino acid utilization in some species (Figure 1). These results highlight the need for detailed investigations into the regulation of the main metabolic pathways of amino acid utilization. This could then be translated to develop an approach for genetic selection or metabolic modulation.
Figure 1: Feed, N and energy utilization responses of rainbow trout and Atlantic salmon fed four diets with different protein/ lipid ratios as fish grew during a period of 308 days at 8.5oC in freshwater: A) Feed efficiency; B) N retention efficiency; C) Energy retention efficiency; NI = nitrogen intake; EI = energy intake. Source: Azevedo et al.(4). 2. Determinants of P Metabolic Wastes P waste output by cage culture operations is often identified as a concern because P is often the most limiting nutrient for algae growth in freshwater. P utilization by fish has been the topic of numerous research projects over the past 20 years and is now fairly well understood (reviewed by Hua (5)). P is an essential nutrient for fish; therefore, a certain amount of available P must be

Proceedings of the Canadian Freshwater Aquaculture Symposium – Aquaculture Canada 2004
100 AAC Spec. Publ. No. 11 (2006)
present in fish feeds. P content of feed ingredients is highly variable and P is found under different chemical forms in different ingredients. These forms can broadly be classified in four groups: organic P, phytate-P, mineral phosphates and bone-P (hydroxyapatite). Digestibility of these different forms of P differs widely for fish. Organic P compounds, such as phosphorylated protein, creatine, phospholipids and nucleic acids, are apparently highly digestible by fish (>90% digestible). Phytate-P, another form of organic P, however, is not digestible by fish. The digestibility of mineral phosphates, such as dicalcium phosphate and rock phosphate, varies with their degree of solubility but is generally high (60-95% digestible). Digestibility of bone-P is variable between fish species and depends mostly on gastric acid secretion by the animal. For rainbow trout, a fish with a true acid stomach, digestibility of bone-P is between 40 and 60%. Both digestibility and quantity will determine the fate of P fed to fish. The undigested fraction of the P of the diet is excreted in the feces. The digestible fraction of P that exceeds fish requirement is excreted through urine as metabolic wastes. Experimental evidence suggests that there is a difference in requirement between maximum growth and maximum P deposition and bone mineralization (6). There is evidence that efficiency of P utilization tends to decrease as digestible P level increases from the level required for maximum growth to the level required for maximum P deposition. Fish receiving only the amount of digestible P to meet requirements for growth excrete only minute amounts of metabolic P (ca. 5 mg P/kg BW/day) indicating that digestible P intake of the fish is directed almost completely toward deposition (6, 7). This is corresponding to a threshold of plasma phosphate concentration for minimal renal P excretion concentration (7). It might be reasonable to conclude that a digestible P level producing this threshold should be acceptable from a biological (the fish) point of view and optimal from a waste management point of view. Recent experimental evidences suggest that this level is around 0.4% digestible P (0.2 g/MJ DE) for rainbow trout. Not all forms of P excreted by fish are equally available to stimulate plant growth. In order to be utilized by algae and other plants, P must be soluble. Therefore, P excreted in the urine of fish is highly available to plants. The potential of other forms of P excreted by the fish (P excreted in the feces) is determined by their chemical nature. Fecal phytate-P and other organic forms of P can
be solubilized by bacteria and other organisms in the aquatic environment. Mineral phosphates may also be mineralized through the action of bacteria and other living organisms or through a simple chemical equilibrium process determined by the dissociation constant (pK) of the chemical forms present. Bone-P, or hydroxyapatite, is only soluble at very low pH (e.g. pH < 3-4) and, in practice, can be considered inert and it is doubtful any of it is potentially plant-available. Estimates of P waste outputs for cage farms should ideally take into account the different forms of P excreted, not the total P waste output. Estimating Waste Outputs It is difficult for fish culture operations to set goals for reducing environmental impacts without first having access to objective estimates of the amount of waste associated with production (actual or planned). Various attempts to directly monitor waste outputs from land-based salmonid fish culture facilities has been shown to be a costly process yet highly inaccurate (8). Estimation of waste outputs could be accurately and economically made with great flexibility based on feed inputs and feed components utilization by the fish (8). There have been few attempts to estimate waste outputs from salmonid cage culture operations (9,10,11) where direct monitoring and estimation of waste outputs is even more difficult, costly, and, likely inaccurate than it is for land-based operations. Inherent physical constraints related to this type of operation suggest that mass (nutrient) balance estimates of waste production are likely to provide more robust estimates of waste output than direct monitoring of waste outputs (10). Accurate estimation of waste output by cage culture operations through use of a nutrient balance approach requires accurate information on the chemical composition of fish produced, the chemical composition of feed used, and the digestibility of the feed components as well as the cost of fish growth (12). Significant research efforts have, therefore, been invested in generating the information needed and integrating this information into practical models and recommendations applicable to commercial salmonid fish cage culture operations. These efforts have resulted in the development of various practical bioenergetics models that have proven very useful (12,13,14,15,16). Example of estimates of waste outputs from cage culture operations using this type of models is found in Table 1 (Bureau et al. (16)).

Proceedings of the Canadian Freshwater Aquaculture Symposium – Aquaculture Canada 2004
AAC Spec. Publ. No. 11 (2006) 101
Table 1: Estimated waste outputs (kg/metric ton of fish produced) of rainbow trout growing from 10 to 1,000 g and fed various commercial feed formulae (assuming 5% feed wastage) (16). Feed Type A B C Feed conversion ratio (feed/gain)
1.14 1.29 1.22
kg/metric ton fish produced
Total solid waste
240 318 263
Solid N waste 9.3 12.3 10.0 Solid P waste 5.8 9.8 6.0 Dissolved N waste
38.0 58.8 42.6
Dissolved P waste
1.7 5.5 1.9
Total N waste (solid + dissolved)
47.3 71.1 52.6
Total P waste (solid + dissolved)
7.5 15.2 7.9
Source: Bureau et al. (16) Next Generation Models - Nutrient-Flow Models The current bioenergetics models have a very limited capability to provide the specific, focused information required to make management decisions that can effectively manipulate nutrient utilization efficiency in growing fish. In order to do this, a causal relationship must be established between nutrient intake (ultimately determined by feed composition, feed usage and wastage), nutrient retention in body components (protein, lipid, water, ash), and waste outputs. This link must be dynamic, i.e. responsive to current animal state and environmental conditions with time, and preferably mechanistic, i.e. representing the biological processes, which determine nutrient requirements. Therefore, dynamic, mechanistic growth models for fish need to be developed. One such model is currently being constructed based on the adaptation of an existing swine growth modeling framework (17) catering to dietary nutrient utilization
and partitioning in fish, biological principles of fish growth, and practical fish culture conditions. The model will represent the material flows of the energy-yielding nutrients and their metabolites explicitly. Dietary protein quality (AA composition) and intake level will be the driving force of utilization and partitioning of dietary energy in fish. AA metabolism (maintenance requirement, inevitable metabolism, deposition, excretion, and catabolism in excess of requirement) will be explicitly represented. Live weight gain and composition of gain will be predicted along with the solid and dissolved N waste output. The resulting salmonid growth model will then be validated through experiments. A phosphorus utilization model has been constructed for salmonid fish species (5). Phosphorus compounds present in ingredients and feeds were classified into chemical categories of bone-P, phytate-P, organic P, Ca monobasic / Na / K Pi (inorganic P) supplement, and Ca dibasic Pi supplement. Developed by integrating literature data on P utilization, the P model provides a simple and practical tool to estimate the effects of different dietary P sources and levels on P digestibility, retention, and waste output. This P model is currently integrated within the framework of the fish bioenergetic model and will be incorporated into the dynamic, mechanistic fish growth model when it is developed in the future. Transfer of these models to the industry will be done through the development of a simple model interface (software). The model and its software will be a useful tool for predicting N, P waste outputs from fish culture operations. It will also be useful to explore nutritional strategies to reduce and minimize N, P waste outputs and environmental impact of freshwater aquaculture operations. This interface will also provide a means to investigate the financial consequences of proposed modified feeding strategies aimed at reducing environmental impact.

Proceedings of the Canadian Freshwater Aquaculture Symposium – Aquaculture Canada 2004
102 AAC Spec. Publ. No. 11 (2006)
References 1. Kaushik SJ, Cowey CB. 1991. Dietary factors
affecting nitrogen excretion by fish. In, Nutritional Strategies and Aquaculture Waste. Proceedings of the 1st International Symposium on Nutritional Strategies in Management of Aquaculture Waste (CB Cowey, CY Cho, eds), pp. 3-19, Guelph, Ontario, Canada.
2. Encarnação PM, de Lange CFM, Rodehutscord M, Hoehler D, Bureau W, Bureau DP. 2004. Diet digestible energy content affects lysine utilization, but not dietary lysine requirement of rainbow trout (Oncorhynchus mykiss) for maximum growth. Aquaculture 235: 569-586.
3. Azevedo PA, Cho CY, Leeson S, Bureau DP. 1998. Effects of feeding level and water temperature on growth, nutrient and energy utilization and waste outputs of rainbow trout (Oncorhynchus mykiss). Aquat. Living Res. 11: 227-238.
4. Azevedo PA, Cho CY, Leeson S, Bureau DP. 2004. Growth, nitrogen, and energy utilization by four juvenile salmonid species: Diet, species, and size effects. Aquaculture 234: 393-314.
5. Hua K. 2005. Modeling Phosphorus Utilization in Salmonid Fish Species. Ph. D. Thesis. University of Guelph, Guelph, Canada.
6. Rodehutscord M. 1996. Response of rainbow trout (Oncorhynchus mykiss) growing from 50 to 200 g to supplements of dibasic sodium phosphate in a semipurified diet. J. Nutr.126: 324-331.
7. Bureau DP, Cho CY. 1999. Phosphorus utilization by rainbow trout (Oncorhynchus mykiss): Estimation of dissolved phosphorus output. Aquaculture 179:127-140.
8. Cho CY, Hynes JD, Wood KR, Yoshida H.K. 1994. Development of high nutrient-dense, low pollution diets and prediction of aquaculture wastes using biological approaches. Aquaculture 124: 293-305.
9. Merican ZO, Phillips MJ. 1985. Solid waste production from rainbow trout, Salmo gairdneri Richardson, cage culture. Aquaculture and Fisheries Management 1: 55-69.
10. Kelly LA, Stellwagen J, Bergheim A. 1996. Waste loadings from a freshwater Atlantic salmon farm in Scotland. Water Resour. Bull. 32: 1017-1025.
11. McDonald ME, Tikkanen CA, Axler RP, Larsen CP, Host G. 1996. Fish Simulation Culture Model (FIS-C): a bioenergetics based model for aquacultural wasteload application. Aquac. Eng.15: 243-259.
12. Bureau DP, Azevedo PA, Tapia-Salazar M, Cuzon G. 2000. Pattern and cost of growth and nutrient deposition in fish and shrimp: Potential implications and applications. In, Avances en Nutricion Acuicola V. Memorias del V Simposium Internacional de Nutricion Acuicola. 19-22 Noviembre, 2000 (LE Cruz-Suarez, Ricque-Marie D, Tapia-Salazar M, Olvera-Novoa MA, R Civera-Cerecedo, eds), pp.111-140, Merida, Yucatan, Mexico.
13. Cho CY.1992. Feeding systems for rainbow trout and other salmonids with reference to current estimates of energy and protein requirements. Aquaculture 100: 107-123.
14. Cho CY, Bureau DP. 1998. Development of bioenergetic models and the Fish-PrFEQ software to estimate production, feeding ration and waste output in aquaculture. Aquat. Living Resou. 11: 199-210.
15. Lupatsch I, Kissil GWI. 1998. Predicting aquaculture waste from gilthead seabream (Sparus aurata) culture using a nutritional approach. Aquat. Living Resour. 11: 265-268.
16. Bureau DP, Gunther S, Cho CY. 2003. Chemical composition and preliminary theoretical estimates of waste outputs of rainbow trout reared on commercial cage culture operations in Ontario. N. Am. J. Aquacult. 65: 33-38.
17. Birkett SH, de Lange CFM. 2001. A computational framewok for a nutrient flow representation of energy utilization by growing monogastric animals. Brit. J. Nutr. 86: 661-674.

Proceedings of the Canadian Freshwater Aquaculture Symposium – Aquaculture Canada 2004
AAC Spec. Publ. No. 11 (2006) 103
La STRADDAQ, un partenariat pour le développement durable de l’aquaculture en eau douce au Québec Sylvain Lareaua, Michel Groleaub et Guy Ouelletc aDirecteur, Association des aquaculteurs du Québec, 555 boul. Roland-Therrien, Longueuil, Québec, J4H 4E7 bMinistère de l’Environnement du Québec, Direction des politiques en milieu terrestre, 675 boulevard René-Lévesque Est, Boîte 26, Québec, Québec, G1R 5V7 cMinistère de l’Agriculture, des Pêcheries et de l’Alimentation du Québec, Direction de l’innovation et des technologies, 200 Chemin Sainte-Foy, Québec, Québec, G1R 4X6 La Stratégie de développement durable pour l’aquaculture en eau douce (STRADDAQ) est une entente tripartite entre l’Association des aquaculteurs du Québec, le ministère de l’Environnement et le ministère de l’Agriculture, des Pêcheries et de l’Alimentation du Québec. L’entente a pour but de susciter les entreprises piscicoles existantes à investir dans des systèmes permettant de réduire les rejets de phosphore d’environ 40% et atteindre l’objectif de 4.2 kg/P par tonne de production. Dans le présent document, nous examinerons les détails de l’entente, ainsi que les travaux du comité de pilotage et du comité technique qui supervise l’entente. Nous présenterons aussi l’état d’avancement de la recherche, et les travaux projetés ou débutés dans certaines entreprises piscicoles. The Québec’s Freshwater Aquaculture Sustainable Development Strategy (STRADDAQ) is a tripartite agreement between the Québec’s Aquaculture Association, The Ministry of Environment and the Ministry of Agriculture, Fisheries and Food. The agreement aims at securing fish farm investment in technologies that can reduce phosphorus discharge by 40% and achieve an objective of 4.2 kg of phosphorus waste by ton of fish produced. In this paper, we will examine the agreement’s details and the works of the Steering Committee and Technical Committee who supervise the agreement’s implementation. We’ll also present the current state of research, and the planned or ongoning investments in some fish farms.
Introduction NOTE : Ce document est une version abrégée et mise à jour d’un document produit par la Table filière de l’aquaculture en eau douce au Québec. Depuis le 17 mars 2005, le ministre de l’Environement du Québec (MENV) s’appelle le ministre du Développement durable, de l’Environement et des Parcs. Le document complet est disponible sur Internet à l’adresse suivante : http://www.mapaq.gouv.qc.ca/NR/rdonlyres/5A5A0795-B087-420B-9873-BAC4A0D0D311/2816/straddaq_table_filiere.pdf La production piscicole au Québec À travers le monde, l’aquaculture est perçue comme une voie d’avenir pour l’industrie alimentaire à cause de la stagnation des pêches commerciales. En 2000, l’aquaculture
représentait près du tiers (32 %) des approvisionnements mondiaux de produits aquatiques. La production mondiale était estimée à environ 46 millions de tonnes. La production canadienne se chiffrait à environ 177 000 tonnes en 2002, soit 0,3 % de la production mondiale. L’aquaculture canadienne a de bonnes perspectives, puisque le taux de croissance annuelle du secteur est estimé à 15 % en volume au cours des prochaines années. La production du Québec, quant à elle, compte pour 2 % de la valeur de la production canadienne et les opportunités de croissance sont bonnes.

Proceedings of the Canadian Freshwater Aquaculture Symposium – Aquaculture Canada 2004
104 AAC Spec. Publ. No. 11 (2006)
Figure 1: Production piscicole au Québec En 2002, la production de poissons d’élevage en eau douce au Québec était de 1640 tonnes, soit 77 % de l’aquaculture québécoise (le reste étant produit en eau marine). Cent quarante sept permis de piscicultures ont été délivrés cette année là. Les deux espèces principales qui dominent la production sont l’omble de fontaine et la truite arc-en-ciel. L’aquaculture en eau douce vise deux marchés fort différents : celui de la consommation et celui de la pêche récréative. En 2002, la valeur des ventes s’est élevée à 11,7 M$ et se répartissait entre les différents marchés pour des valeurs respectives de 3,5 M$ pour celui de la truite de table et 6,4 M$ pour celui de l’ensemencement. À ces ventes s’ajoute une vente directe du pisciculteur au consommateur dans le cadre de l’exploitation d’étangs de pêche (1,8 M$). L’impact économique de l’aquaculture en eau douce au Québec (ensemble des dépenses rattachées incluant les dépenses de pêche) a été évalué à 65,4 M$ en 2001. Le marché de la consommation au Québec a été estimé à 3200 tonnes en 1995, alors que la production québécoise pour répondre à cette demande est actuellement de 630 tonnes. Bien qu’ils soient présents, les producteurs qui ciblent le marché de la table font face à des concurrents bien organisés, dont l’Ontario et le Chili, qui produisent en cage à des coûts en général inférieurs à ceux d’ici. Quant au marché de l’ensemencement, il semble y avoir actuellement adéquation entre l’offre et la demande. Ce marché, qui est protégé de l’importation, recèle un potentiel de croissance intéressant.
Les impacts des activités piscicoles sur l’environnement et les directives environnementales actuelles La pisciculture peut entraîner certains impacts sur l’environnement. Les changements typiques à la qualité de l’eau après son utilisation à des fins piscicoles sont: • Augmentation des composés reliés au
métabolisme du poisson tels que les déchets organiques, les composés azotés et le phosphore;
• Changement de la température de l’eau; • Changement du pH selon le métabolisme du
poisson et la capacité tampon de l’eau; et • Augmentation des solides en suspension, des
solides sédimentables et du phosphore reliés aux aliments non ingérés.
La composition des aliments, leur digestibilité et le taux de conversion alimentaire conditionnent en grande partie le niveau des rejets dus à l’activité piscicole, et donc la libération dans le milieu naturel de matières organiques et de nutriments. Ceux-ci peuvent amener des changements dans les écosystèmes, particulièrement l’eutrophisation des milieux aquatiques par la hausse de la charge en éléments nutritifs, surtout le phosphore. De plus, les changements à la qualité de l’eau ainsi que les impacts sur les organismes aquatiques en relation avec l’utilisation de produits chimiques (désinfectants, fongicides, anesthésiants, antibiotiques, etc.) dans les opérations d’une pisciculture sont peu documentés pour l’industrie piscicole du Québec. Des problèmes d’eutrophisation accélérée du milieu, causés par les activités piscicoles, constituent la base des appréhensions du ministère de l’Environnement (MENV) concernant ce secteur et son développement. En 1999 et 2001, deux entreprises piscicoles ont dû fermer leur porte à cause d’impacts environnementaux jugés inacceptables. La majorité des pisciculteurs sont conscients des impacts de leur entreprise et des contraintes environnementales. Ils sont désireux d’y apporter des solutions, puisqu’ils ne veulent pas se retrouver en situation de conflit d’usage et qu’ils sont sensibilisés à préserver une eau de qualité parce qu'eux-mêmes ont besoin d'une eau d'approvisionnement de très bonne qualité. Pour contrôler l’impact de la pisciculture sur l’environnement, le MENV s’est fixé, à différentes époques, des règles administratives qui ont été

Proceedings of the Canadian Freshwater Aquaculture Symposium – Aquaculture Canada 2004
AAC Spec. Publ. No. 11 (2006) 105
modifiées à quelques reprises. Actuellement, les projets de pisciculture sont évalués en fonction de deux documents administratifs : des lignes directrices qui demeurent un projet pour consultation depuis 1999 et des orientations publiées en 2001 rendant les directives de 1999 plus sévères à différents égards, mais qui demeurent sous forme de projet. Ces directives et orientations, non encore édictées officiellement, sont utilisées comme règles administratives pour l’autorisation de projets par les directions régionales du MENV. En 1999, l’Association des aquaculteurs du Québec (AAQ), le ministère de l’Agriculture, des Pêcheries et de l’Alimentation (MAPAQ) et le MENV ont tenté de trouver un terrain d’entente permettant d’établir un cadre de normes environnementales satisfaisant aux exigences de protection du milieu, tout en permettant le développement durable de l’aquaculture. À l’automne 2000, le MAPAQ et le MENV ont reçu du Conseil des ministres le mandat d’établir un cadre de développement durable en aquaculture. Au même moment, le gouvernement du Québec a adopté la Politique québécoise des pêches et de l’aquaculture qui reconnaissait l’importance du développement de l’aquaculture. Le gouvernement affirmait ainsi vouloir soutenir les initiatives visant la croissance de la production aquacole. Pendant ce temps, l’industrie piscicole est en déclin. La production de l’aquaculture en eau douce a diminué de 26 % entre 1999 et 2002. Plusieurs causes peuvent expliquer cet état de fait mais les principaux problèmes reste le climat d’incertitude créé par le dossier environnemental et les difficultés financières éprouvées par quelques piscicultures. La stratégie de développement durable de l’aquaculture en eau douce au Québec La stratégie de développement durable de l’aquaculture en eau douce au Québec (STRADDAQ) est le fruit de nombreux mois de négociation entre l’AAQ, le MAPAQ et le MENV. La STRADDAQ a été entérinée par les trois parties à l’été 2004. Les principes de base de la STRADDAQ sont:
• Harmoniser et intégrer le développement du secteur avec les objectifs de protection de l’environnement aquatique.
• Mettre en oeuvre une approche d’adaptation dans le temps, réaliste techniquement et financièrement, basée sur un indice industriel de performance et des résultats à atteindre.
• Permettre l’adhésion volontaire et non réglementaire des piscicultures à la STRADDAQ.
• Donner le leadership à l’industrie dans la mise en œuvre de la STRADDAQ (contrat de performance avec le MENV).
• Obtenir l’équité avec d’autres secteurs. • Maintenir et faire progresser les marchés
actuels. • Établir un partenariat AAQ-MENV-MAPAQ
dans la réalisation de la STRADDAQ. Les enjeux de la STRADDAQ sont: • Améliorer la performance environnementale
des piscicultures québécoises de salmonidés en milieu terrestre.
• Préserver le milieu aquatique. • Préserver le marché occupé par des
producteurs québécois (améliorer l’autosuffisance du marché de la truite de consommation) et éviter que la production locale et les retombées économiques associées soient récupérées par les autres provinces canadiennes ou d’autres pays.
• Assurer la compétitivité des piscicultures. • Préserver les emplois essentiellement situés
en régions. • Préserver l’activité et les emplois en aval,
notamment ceux reliés à la transformation des produits pour le marché de la consommation et à la pêche récréative (pourvoiries, zec).
• Définir le rôle des différents intervenants dans l’atteinte des objectifs environnementaux.
La stratégie proposée s’articule autour des actions suivantes: • L’atteinte d’ici 10 ans, par les piscicultures
existantes qui auront adhéré à la stratégie, d’un objectif précis en matière de performance environnementale, par l’adoption d’une norme de rejets de phosphore établie à 4,2 kg de phosphore par tonne de production, ce qui équivaut à une diminution globale de 40 % de la quantité de phosphore rejetée dans les milieux récepteurs;

Proceedings of the Canadian Freshwater Aquaculture Symposium – Aquaculture Canada 2004
106 AAC Spec. Publ. No. 11 (2006)
• La sensibilisation des pisciculteurs à l’objectif et la formation de ceux-ci aux meilleures pratiques d’élevage par l’AAQ et le MAPAQ;
• L’adaptation, l’amélioration ou le changement des infrastructures de production, d’entreposage des fumiers et des systèmes de traitement des eaux contaminées avec le soutien financier du MAPAQ;
• Un programme de recherche et développement (R-D) soutenu conjointement par les gouvernements et l’industrie; et
• La mise en place d’un comité de pilotage formé de l’AAQ, du MAPAQ et du MENV, qui encadrera l’implantation et l’application de la STRADDAQ sans toutefois interférer sur les pouvoirs conférés à chacun des deux ministres par les lois qu’ils sont chargés d’appliquer.
Afin d’effectuer un virage vers une aquaculture durable et viable et pour améliorer ses performances environnementales, l’ensemble des piscicultures participantes s’engagent, avec la STRADDAQ, à diminuer leurs rejets moyens annuels estimés de 7,2 kg de phosphore par tonne de production à 4,2 kg par tonne de production. Ce programme d’amélioration de la performance environnementale des piscicultures participantes amènerait une réduction de 40 % de la charge globale rejetée dans les milieux aquatiques, soit de 16 tonnes de phosphore en l’an 2000 à 9,8 tonnes, si le même niveau de production piscicole se maintenait. Dans les limites de l’application de la STRADDAQ (2004 à 2014), chaque pisciculture participante devra, dans les trois ans suivant son adhésion à la Stratégie, atteindre la cible de 4,2 kg de phosphore par tonne de production, ce qui signifie que l’effort à fournir sera variable d’une pisciculture à l’autre, selon leur performance environnementale actuelle. La STRADDAQ s’applique en priorité aux piscicultures produisant plus de cinq tonnes annuellement. L’adhésion à celle-ci se fera sur une base volontaire. Cependant, les piscicultures qui n’y participent pas ne pourront bénéficier d’aucun avantage de la présente entente, tel que le programme d’aide financière Aquableu du MAPAQ. La mise en application de la STRADDAQ dans les piscicultures se fera graduellement sur un mode qui tient compte de la priorisation environnementale des dossiers et de la capacité gouvernementale à supporter financièrement et techniquement les piscicultures. La priorisation environnementale sera faite par le MENV.
En 2002, on évalue qu’il y avait, sur un total de 147 permis piscicoles actifs, 34 piscicultures produisant plus de 10 tonnes et 13 piscicultures produisant de 5 à 10 tonnes. Près d’une cinquantaine de piscicultures pourraient donc appliquer dans leurs installations les mesures prévues dans la STRADDAQ. Ces piscicultures représentaient, en 2002, plus de 85 % de la production totale, soit près de 1400 tonnes sur un total de 1640 tonnes. Un portrait aquaenvironnemental En pratique, la mise en application de la STRADDAQ se fera ainsi : à cause de l’absence de caractérisation des piscicultures existantes, la valeur de départ du rejet moyen de l’ensemble des piscicultures (7,2 kg de phosphore rejeté par tonne de production) a été calculée en utilisant la formule théorique et les valeurs fixées par le MENV dans son document du 7 juin 2001. Sous réserve du respect des dispositions prévues dans l’entente de partenariat relativement à la protection des renseignements personnels et à l’utilisation qui en sera faite, la première année, une première cueillette d’information sera effectuée dans toutes les piscicultures participantes avec pour objectifs: • De connaître la production actuelle de chaque
entreprise; • D’acquérir une meilleure connaissance de
l’équipement et des pratiques piscicoles des piscicultures et de leur impact sur l’environnement.
Les directions régionales du MENV établiront alors, avec la collaboration de la Direction du suivi de l’état de l’environnement (DSÉE), une priorisation environnementale des dossiers piscicoles de leur région. Le comité de pilotage prévu à l’entente établira ensuite une priorisation des dossiers qui tiendra compte notamment des priorités établies par le MENV. Un échantillonnage plus poussé (printemps, été, automne) sera par la suite réalisé dans les piscicultures selon cet ordre de priorité, afin de connaître leurs rejets réels et l’efficacité des systèmes de traitement. Une cible environnementale de rejet (CER) sera alors établie pour chaque pisciculture à l’aide des données recueillies dans le portrait aquaenvironnemental. Les valeurs de rejets moyens annuels en kilogrammes par tonne de production seront converties en valeurs de concentration (mg/l) plus faciles à suivre pour le

Proceedings of the Canadian Freshwater Aquaculture Symposium – Aquaculture Canada 2004
AAC Spec. Publ. No. 11 (2006) 107
pisciculteur, selon des modalités établies par le comité technique. Les valeurs utilisées pour vérifier si une pisciculture a déjà atteint la cible ne seront donc pas basées uniquement sur des calculs théoriques où les valeurs de taux de conversion et d’efficacité des systèmes de traitement sont fixées, mais sur les performances réelles (échantillonnage poussé à l’effluent et dans le milieu) des piscicultures afin de ne pas pénaliser indûment les pisciculteurs les plus efficaces. Les certificats d’autorisation Le pisciculteur qui adhère à la STRADDAQ doit obtenir un nouveau certificat d’autorisation de la part du MENV. La production reconnue au pisciculteur et, notamment, les infrastructures et les équipements de traitement, seront inscrits sur le nouveau certificat d’autorisation ainsi que la CER correspondant à la production. La CER sera exprimée en charge, mais aussi en concentration afin de faciliter le contrôle des performances avec le suivi de la qualité de l’effluent. Le comité de pilotage mettra sur pied un comité technique qui aura, entre autres, comme mandat d’établir les modalités pour le suivi à l’effluent (définition de la CER pour la pisciculture, échantillonnage, mesures de débit, etc.). Le pisciculteur qui adhère à la STRADDAQ devra s’engager par écrit auprès du MENV à respecter son programme de suivi. En ce qui concerne les autorisations pour les captages d’eau de surface, les piscicultures participantes existantes conserveront les niveaux de captage déjà autorisés. Les nouveaux sites de captage devront être autorisés par le MENV selon la réglementation et les normes en vigueur. Le pisciculteur pourra, au moment de l’adhésion, bénéficier de l’expertise du MAPAQ pour l’orienter dans ses choix de gestion de son établissement, du type d’aliment à utiliser et sur le système de traitement à installer pour atteindre sa CER. Le pisciculteur devra alors faire une demande de certificat d’autorisation à la direction régionale du MENV pour son projet. C’est la direction régionale qui est responsable de l’analyse du projet pour ce ministère. Le plan d’intervention dans la pisciculture sera donc élaboré conjointement par le pisciculteur et le MAPAQ, en collaboration avec le MENV. Le comité de pilotage en recevra une copie. Pendant la durée de la Stratégie, si l’évaluation d’une pisciculture a démontré:
• qu’un impact majeur et inacceptable est causé à l’environnement;
• qu’une étude sérieuse du milieu démontre que la pisciculture en est la principale responsable; et
• qu’il est prévisible immédiatement que la meilleure technologie de traitement connue ne permettra pas un enlèvement suffisant de phosphore pour améliorer la situation de façon satisfaisante ; le cas sera alors référé au comité de pilotage qui pourra recommander immédiatement, après son analyse du dossier, la relocalisation de la pisciculture (après entente entre le comité de pilotage et la pisciculture), sa fermeture ou toute autre mesure qu’il jugera opportun d’appliquer.
Dans tous les cas, dans la mesure du possible, le comité de pilotage veillera à ce que la viabilité économique d’une pisciculture qui a adhéré à la STRADDAQ ne soit pas menacée. Dans le cas exceptionnel d’une recommandation de fermeture de la pisciculture par le comité de pilotage, il y aurait offre de compensation pécuniaire par le gouvernement en contrepartie d’un retrait du certificat d’autorisation. Celle-ci serait toutefois conditionnelle à l’obtention des autorisations gouvernementales et ministérielles requises. Les démarches pour cette obtention seront entamées par le MENV. Cependant, le gouvernement ne compensera pas les dépenses encourues pour une production ou une augmentation de production établie sans qu’il y ait eu obtention, par la pisciculture, d’un certificat d’autorisation du MENV; dans le cas d’un détenteur d’un certificat d’autorisation pour une pisciculture dont on exige la fermeture, la compensation ne pourra viser que la production autorisée par le certificat d’autorisation. Cette procédure serait entreprise dans les cas où il est certain qu’il n’y a pas d’autre solution et dans le but d’éviter des dépenses inutiles d’argent et de temps de la part des ministères et du producteur. Tant qu’une pisciculture n’atteindra pas sa CER, aucune augmentation de production au-delà du niveau convenu dans le nouveau certificat d’autorisation émis à la suite de son adhésion à la STRADDAQ ne pourra être demandée au MENV. Si la CER n’a pas été atteinte après trois ans, le comité de pilotage examinera le dossier et fera des recommandations au pisciculteur. Celui-ci pourra alors bénéficier d’un délai supplémentaire de deux ans pour atteindre sa CER. Si, après cinq ans, la pisciculture est à plus de 10 % de sa CER, le comité de pilotage recommandera s’il y a

Proceedings of the Canadian Freshwater Aquaculture Symposium – Aquaculture Canada 2004
108 AAC Spec. Publ. No. 11 (2006)
lieu, selon la situation environnementale et les efforts déployés par le pisciculteur, une diminution de la production. Dans le cas des piscicultures participantes qui, après la période de trois à cinq ans, seraient à moins de 10 % de l’atteinte de la cible, le MENV, le MAPAQ et l’AAQ croient que la cible pourra être atteinte par une amélioration de la gestion de la pisciculture. Le comité de pilotage appuiera le pisciculteur dans cette démarche, ce qui permettra de préserver les efforts importants consacrés dans ces cas à l’amélioration des performances environnementales. Dans les cas où une pisciculture participante aurait atteint sa CER après la période de trois à cinq ans et qu’il est démontré qu’elle cause encore un impact trop important à l’environnement, le comité de pilotage recommandera soit une deuxième phase d’assainissement, soit une fermeture. Le comité de pilotage tiendra compte dans ses recommandations de la viabilité économique de la pisciculture et d’une analyse environnementale globale. Le producteur devra alors faire une demande de modification de certificat d’autorisation au MENV et s’engager à suivre la recommandation du comité de pilotage. Dans le cas d’une deuxième phase d’assainissement, le soutien technique et financier du MAPAQ sera accessible aux mêmes conditions. Ces dossiers seront traités en priorité. La fermeture de la pisciculture ne sera envisagée qu’après analyse de la problématique environnementale globale et que si une analyse technique démontre qu’il n’existe pas de technologie suffisamment performante pour régler l’impact environnemental à la satisfaction du MENV. Dans le cas exceptionnel d’une recommandation de fermeture de la pisciculture par le comité de pilotage, il y aurait offre de compensation pécuniaire par le gouvernement en contrepartie du retrait du certificat d’autorisation. Celle-ci serait toutefois conditionnelle à l’obtention des autorisations gouvernementales et ministérielles requises. Les démarches pour cette obtention seront entamées par le MENV. Ces dispositions permettent d’étaler les améliorations environnementales sur une certaine période, de la même façon que cela a été appliqué dans d’autres secteurs d’activité (Règlement sur les établissements agricoles, Règlement sur les fabriques de pâtes et papiers, Lignes directrices sur le phosphore applicables à l’industrie
agroalimentaire). Cette période de temps devrait permettre de finaliser et d’appliquer les résultats de plusieurs travaux de recherche actuels sur de nouveaux aliments et de nouvelles méthodes de traitement des effluents. La prise en compte du cours d’eau récepteur Pour tenir compte des préoccupations du MENV, le développement des piscicultures devra par contre être limité en fonction de la présence de milieux sensibles et de la taille du cours d’eau récepteur afin de tenir compte de sa capacité. Cette limitation sera basée sur les objectifs environnementaux de rejets (OER) tels que déterminés par le MENV. La définition de milieux sensibles est celle qui a été déterminée par le MENV. Les lacs seront toujours considérés comme étant des milieux sensibles. Aucune nouvelle pisciculture ne sera autorisée à rejeter son effluent dans un lac. Le délai pour atteindre l’objectif Le 31 décembre 2010 tous les pisciculteurs participants devront avoir terminé les modifications physiques à leur pisciculture et avoir adopté un nouveau mode de gestion si nécessaire. Lorsqu’une pisciculture aura terminé ses travaux, elle bénéficiera d’un délai variant entre trois et cinq ans pour atteindre sa CER, c’est-à-dire un rejet moyen annuel de 4,2 kg de phosphore par tonne de production. Les projets d’expansion des piscicultures participantes Aucune augmentation de production, au-delà du niveau de production convenu dans le nouveau certificat d’autorisation émis à la suite de son adhésion à la STRADDAQ, ne pourra être demandée au MENV par une pisciculture participante, tant qu’elle n’aura pas atteint sa CER. Pour celles qui voudront prendre de l’expansion par la suite, le MENV calculera leur OER pour le phosphore, et cette valeur sera comparée à leurs rejets actuels à 4,2 kg/tonne de production. Les rejets seront évalués avec les données réelles de la pisciculture (taux de conversion alimentaire, efficacité des équipements de traitement, résultats du suivi prévu dans l’application de la STRADDAQ). Deux situations seront alors possibles:

Proceedings of the Canadian Freshwater Aquaculture Symposium – Aquaculture Canada 2004
AAC Spec. Publ. No. 11 (2006) 109
• Les piscicultures dont le niveau de rejet après l’atteinte de leur CER est inférieur à leur OER pourront se voir autoriser une augmentation de leur production par le MENV, en autant que leurs rejets restent inférieurs à l’OER et soient maintenus au seuil de 4,2 kg/tonne de production; une nouvelle limite de rejet sera donc fixée à ces piscicultures et elles seront contrôlées en fonction du respect de cette limite; et
• Les piscicultures dont le niveau de rejet après l’atteinte de leur CER est supérieur à leur OER ne pourront obtenir du MENV l’autorisation d’accroître leur production que s’il n’y a pas d’augmentation de la charge rejetée au milieu récepteur et que si les rejets ne se font pas dans un milieu sensible. Ces piscicultures devront donc faire mieux que la cible de 4,2 kg/tonne de production. Par exemple, une pisciculture de 100 tonnes rejettera, à 4,2 kg/tonne de production, 420 kg de phosphore par an. Si cette pisciculture atteint 3,8 kg/tonne de production, elle pourrait augmenter sa production à 110 tonnes, ce qui donnerait un même rejet de 420 kg par an.
Dans les cas d’expansion, de nouvelles limites de rejet et de production seront donc fixées à ces piscicultures dans un nouveau certificat d’autorisation et elles seront contrôlées sur le respect de la limite de rejet. Les piscicultures existantes dont la production est de moins de 5 tonnes Les piscicultures existantes produisant moins de 5 tonnes annuellement ne sont pas visées par la STRADDAQ. Cependant, si le MENV entend intervenir, à la suite d’une situation jugée problématique, d’une plainte ou d’une demande pour un nouveau certificat d’autorisation, le dossier sera traité de façon différente selon la situation de la pisciculture: • Si le milieu récepteur n’est pas sensible, le
MENV exigera, en vertu de la Loi sur la qualité de l’environnement (L.R.Q., c. Q-2), un traitement minimum des effluents (20 % d’enlèvement du phosphore). La pisciculture pourra cependant adhérer de façon volontaire à la STRADDAQ. Elle devra alors atteindre la CER qui lui sera indiquée, mais elle pourra bénéficier des autres avantages prévus dans l’entente; et
• Si le milieu récepteur est sensible, le MENV pourra référer le cas au comité de pilotage et
proposer que la pisciculture adhère à la STRADDAQ.
Des suivis à l’effluent Chaque pisciculteur qui aura adhéré à la STRADDAQ devra participer à un programme de suivi de son effluent final. Cela implique donc que les piscicultures devront être équipées pour mesurer leur débit de façon adéquate. Ce sont les résultats de ce suivi qui serviront à déterminer l’atteinte de la CER pour une pisciculture. Les normes générales de ce programme de suivi seront élaborées par le comité technique. À partir de ces normes, le MENV verra à établir un programme de suivi propre à la pisciculture. Une lettre d’engagement du pisciculteur à suivre ce programme sera fournie au MENV et fera partie intégrante du certificat d’autorisation. Le pisciculteur devra tenir un registre des produits chimiques (désinfectants, fongicides, anesthésiants, antibiotiques, etc.) et de la quantité de moulée qu’il utilise dans les opérations de sa pisciculture. L’aide au entreprises : L’adaptation, l’amélioration ou le changement des infrastructures Afin de faciliter l’adoption par l’industrie d’infrastructures appropriées pour les piscicultures existantes, le MAPAQ a fait approuver par le Conseil du trésor un programme normé de soutien financier, le programme AquaBleu, pour l’amélioration des performances environnementales des piscicultures. Un tel programme existe déjà pour le monde agricole (Programme Prime-Vert). Le programme couvre jusqu’à 70% des dépenses. Les dépenses qui sont admissibles à ce programme sont celles liées à la construction de structures d’entreposage des boues, à l’amélioration des systèmes existants de traitement des eaux usées, à l’aménagement de systèmes de traitement plus performants et aux modifications des infrastructures de production, lorsque jugées essentielles et conditionnellement au fait qu’aucune autre action de moindre envergure ne peut être envisagée pour atteindre la cible environnementale de la pisciculture. Sont aussi admissibles les dépenses liées aux services professionnels nécessaires à la planification des projets, à la réalisation des plans et devis et à la formation sur l’utilisation des nouveaux systèmes de production et de traitement.

Proceedings of the Canadian Freshwater Aquaculture Symposium – Aquaculture Canada 2004
110 AAC Spec. Publ. No. 11 (2006)
Un programme de R-D soutenu conjointement par le gouvernement et l’industrie Un programme de R-D est déjà en branle grâce à la Société de recherche et de développement en aquaculture continentale inc. (SORDAC). Il vise à développer de meilleures technologies de production, des équipements de traitement des effluents et une alimentation moins riche en phosphore, limitant ainsi les effets polluants. De plus, Valorisation-Recherche Québec a accordé 1,2 M$ au Réseau aquacole Québec (RAQ) pour un programme de recherche intégrée en aquaculture en eau douce, en traitement et en gestion de l’eau. Le RAQ regroupe 39 chercheurs de six universités ou instituts différents qui ont décidé d’unir leurs efforts de recherche et développement dans le secteur aquacole. Enfin, le secteur de l’aquaculture en eau douce profite des sommes disponibles (20 M$) dans le cadre du Programme coopératif de recherche et de développement en aquaculture (PCRDA) du ministère des Pêches et des Océans; cinq projets ont été acceptés jusqu’à maintenant pour une somme d’environ 0,9 M$. Des discussions plus poussées devront avoir lieu entre la Table filière et la SORDAC, de façon à s’assurer que la programmation de recherche s’arrime de façon optimale avec la présente STRADDAQ.
La sensibilisation des pisciculteurs à l’objectif et la formation aux meilleures pratiques d’élevage À court terme, l’AAQ entend sensibiliser ses membres aux meilleures pratiques d’élevage (formation, gestion des inventaires, alimentation, adoption d’un guide de bonnes pratiques) avec le soutien technique du MAPAQ. Cette association se verra aussi confier tous les autres aspects de formation en ce qui concerne la STRADDAQ ainsi que le dossier de l’information. Conclusions Les partenaires de la STRADDAQ croient que cette entente est une solution acceptable, autant pour la préservation du milieu naturel à laquelle tous adhèrent que pour le développement de l’industrie dont l’avenir est prometteur. Cette stratégie pourrait devenir l’un des moteurs de l’industrie dans son développement et dans sa promotion auprès du grand public. Elle est basée sur une approche intégrée, autant des intervenants de l’industrie que des ministères concernés qui fournissent les appuis réglementaires, financiers et techniques. Elle démontre aussi toute la puissance du travail en concertation sur une base de « gagnant-gagnant ». À l’automne 2004, la majorité des entreprises piscicoles de plus de 5 tonnes a accepté de participer au portrait aquaenvironnemental. Aussi, trois entreprises qui avaient déjà entamé des discussions avec le ministère de l’Environnement avant la mise en place de la STRADDAQ ont reçu ou recevront sous peu l’autorisation de faire des travaux.

Proceedings of the Canadian Freshwater Aquaculture Symposium – Aquaculture Canada 2004
AAC Spec. Publ. No. 11 (2006) 111
Management Approaches for Coldwater Disease Caused by Flavobacterium psychrophilum John S. Lumsden, Karrie Young, Katie Welsh, Jan MacInnes, Spencer Russell and Shohreh Hesami Fish Pathology Laboratory, Ontario Veterinary College, University of Guelph, Guelph ON N1G 2W1 Coldwater disease is the most significant economic infectious disease for most Ontario rainbow trout (Oncorhynchus mykiss) netpen operations. Peak mortality occurs during colder temperatures when delivery of therapeutants per os is not possible. The chronic vertebral osteitis that often develops affects carcass processing and price however the economic impact has not been quantified. F. psychrophilum is also vertically transmitted although the exact impact e.g. need for year class separation, etc. has not been studied in freshwater netpens. We are presently working on several aspects of Coldwater disease in Ontario. We are characterizing the substantial number of F. psychrophilum strains from the Fish Pathology Laboratory culture collection, in order to determine the relationship of Ontario isolates to those described from Europe, Japan and the US Pacific Northwest. We have also adapted a multiplex PCR assay that recognizes the Ontario isolates of F. psychrophilum and will use this assay in experimental and on farm trials. We are primarily interested in basic pathogenesis of the disease in rainbow trout, particularly of the necrotising myositis and chronic vertebral osteitis presentations, transmission of strains within and between populations, evaluation of the significance of vertical transmission, and finally a determination of the presence of antibiotic resistance in Ontario isolates. Overview Coldwater disease (CWD) caused by Flavobacterium psychrophilum is thought to be the most commercially important infectious disease affecting rainbow trout production in Ontario. A study to quantify the specific cost to the industry however has not been performed. F. psychrophilum is also an important pathogen of coldwater fish, primarily salmonids, worldwide. This paper will attempt to outline the information that is required in order to institute management strategies to lessen the economic impact of disease caused by F. psychrophilum. Flavobacterium psychrophilum is a ubiquitous Gram-negative pathogen of fish from cold and temperate waters. While salmonids are the primary group of fish affected, ayu (Plecoglossus altivelis) in Japan and other species are also negatively impacted (1). An obstacle to progress at present is the relative lack of data and/or experimental evidence available derived from North American stains. The majority of the often excellent, work to date on the pathogenesis of disease caused by F. psychrophilum has been performed by European researchers. This distinction is critical however, since the disease presentation most commonly seen in Europe is different from those that predominate in North America (NA). In Europe, disease in rainbow trout
is primarily a bacterial septicemia in young fish and this presentation (rainbow trout fry syndrome, RTFS) has not been described in NA to date. For NA strains, further effort is required to identify strain characteristics, either biochemical, genetic or others that correlate with virulence and with disease presentation. Tools to allow identification and tracing of individual strains need to be adapted from European work for use with North American strains. These would provide a better understanding of on- and between-farm transmission and to estimate the impact of management alterations. Although most F. psychrophilum strains tested are biochemically homogeneous (2), work performed to date on 65 isolates from Ontario salmonids has demonstrated that there are two distinct API-ZYM patterns (unpublished data). Flavobacterium psychrophilum isolates can be differentiated by serotyping or ribotyping (2,3,4,5) but there appears to be geographic variability between strains. In at least one study there does seem to be some association of serotype with virulence (2) and this work needs to be pursued further. The range of variation in the ‘diseases’ caused by F. psychrophilum is notable, particularly in light of the relative biochemical homogeneity of strains. The bacterium is known to cause fin rot or peduncle disease, low temperature disease, RTFS and bacterial coldwater disease (6,7). The variants of CWD of particular importance for rainbow trout

Proceedings of the Canadian Freshwater Aquaculture Symposium – Aquaculture Canada 2004
112 AAC Spec. Publ. No. 11 (2006)
in Ontario are peduncle disease or tail-rot, necrotic myositis (8) and cephalic osteochondritis (9). These are necrotizing diseases affecting the dermal, muscle and cephalic, scleral and vertebral cartilage and bones, respectively (8,9,10). These presentations are not limited to Ontario and the isolates responsible for vertebral lesions have been identified from Europe, Chile and elsewhere in North America (10). Unless differentiation between presentations is required, for the remainder of this paper the term coldwater disease will be used. Apart from the economic impact of acute mortality, which is of variable severity between the different disease presentations, the cost of the chronic forms of the disease can be high due to reduced growth rates and decreased carcass quality. For the most part there is little understanding of the association of strain and disease presentation (11). This is one of the goals of our ongoing work. Apart from the basic recommendations of good health management, record keeping, minimizing handling particularly as the water temperature drops, optimum water quality, etc. there are several points in the production cycle that are potentially amenable to management or therapeutic intervention. These are; before and at spawning of broodstock, several weeks before and after movement to netpens and before overwintering. The Ontario rainbow trout industry is predominantly organized into fry producers who supply approximately 30g fish to netpen growers, which are often separate operations. Fry producers purchase eyed eggs or spawn their own broodstock, or less commonly use a combination of both methods. Of the methods available for control of coldwater disease, antibiotic therapy, screening of broodstock, autogenous vaccination and improved management practices will be discussed in this paper with some discussion of related topics, including disease pathogenesis and the basis of resistance to disease. Improved detection methods have been developed to reduce the labour intensive and time-consuming use of Cytophaga or other agar formulations that are not selective. There are several groups that have developed polymerase chain reaction (PCR) reactions based on 16S ribosomal RNA that detect F. psychrophilum (12,13,14,15,16) and can differentiate it to varying degrees from other Flavobacterium species. The PCR assays are very sensitive, detecting as little as several organisms per gram of tissue (12,13,16), while the sensitivity per litre of water is lower (16). We have adapted a multiplex PCR using published primers for 16S ribosomal
RNA and gyraseB (17,18). PCR used alone can produce results that lack biological significance however, since the organism is commonly found in the water and on fish that do not have clinical disease (13,16). It is best used as a tool to determine pathogen loads and for clinical disease, in conjunction with other techniques such as overall health assessment, gross pathology and histopathology. A quantitative PCR would also be much more useful for in vitro challenge studies, to determine carrier status and to evaluate relative risk (13). PCR has been used by European researchers to screen for bacterial loads and during experimental infection studies to great benefit (16,19). Other assays that have been developed but are less applicable for routine use are immunofluorescence and in situ hybridization (20) and restriction fragment length polymorphism (21). We have initiated studies in Ontario to examine screening of broodstock for F. psychrophilum to determine the effect of antibiotic therapy prior to spawning. We also propose to evaluate stocks of fish both for general health and with a F. psychrophilum PCR before transfer to netpens. Both studies would perhaps prove to be of relatively limited use without subsequent monitoring of groups of fish for morbidity, mortality and eventual harvest performance. On farm management practices influencing horizontal transmission, etc. could have a more profound effect on coldwater disease that might mask any previous treatment, etc. It is critical that all efforts to reduce the impact of coldwater disease take place within a more comprehensive system of record keeping and farm management. On many farms evidence of coldwater disease is present to varying degrees as the water temperature drops during mid- to late fall. Morbidity and mortality may or may not be abnormally high enough to justify the cost of antibiotics. Some managers may choose to treat stocks while feed consumption is still high in an attempt to reduce the impact of future mortality during the period when the fish are no longer feeding, perhaps under ice and are not accessible for treatment or selective harvesting. At present however, there is no evidence that this is a beneficial or cost effective practice, and needs to be rigorously evaluated. Antibiotics, used judiciously, can be an effective adjunct to a health management program. Their use to reduce pathogen loads as opposed to treatment of disease outbreaks can be a controversial practice. Furthermore, the lack of registered therapeutants in Canada that are bacteriocidal reduces the potential benefit of such

Proceedings of the Canadian Freshwater Aquaculture Symposium – Aquaculture Canada 2004
AAC Spec. Publ. No. 11 (2006) 113
strategies. In Finland, rainbow trout broodstock that were treated with oxytetracycline (80mg/kg) three weeks before spawning still had approximately 300 cfu/ml of F. psychrophilum in pooled ovarian fluid (22). No mention was made however of the average cfu of ovarian fluid of untreated fish. Further examination of this point in the production cycle is required. In the face of a heavily contaminated production environment it could be easily argued that an intervention of this type, even if the organism was eliminated, would be ineffective. Several studies have demonstrated that F. psychrophilum is widespread in farm environments (19,22), survives in fresh water for extended periods (23) and that shedding occurs from naturally infected fish (22), and in large numbers from fish that have died (22). The importance of a program to remove dead fish either by divers or with a pescalator cannot be over-emphasized, however removal of mortalities during the depths of winter is often impractical. The effect of antibiotics on the progression of chronic disease, such as vertebral osteomyelitis, or on rates of shedding following clinical recovery also requires examination. Treatment of groups of fish experiencing F. psychrophilum-induced morbidity and mortality with antimicrobial agents can be effective particularly with septicemic disease, and many antibiotics are effective in vitro (24). Several studies have demonstrated antibiotic resistance of F. psychrophilum to phosphomycin and penicillin (25), sulphadiazine/trimethoprim (26) and animoglycosides (27) but the majority of field and experimental work has concentrated on strains causing RTFS (24,26,27,28,29). The differences in bacterial strain properties and disease syndromes between Europe and North America make direct application of research results derived from RTFS difficult to apply here. In Ontario, antibiotics can be an important method of disease control and the most commonly used are oxytetracycline and florfenicol. In the only study conducted to date in Europe that examined florfenicol, the minimum inhibitory concentration (MIC) of the F. psychrophilum strains examined were less than that of the therapeutic doses used, however the MIC’s to florfenicol had increased over time with further isolation of strains (24). The resistance or susceptibility phenotype of Ontario strains has not been examined. At present, the bacterial culture collection in the Fish Pathology Laboratory contains approximately 80+ isolates of F. psychrophilum obtained from Ontario. The majority of these were collected from 1990-1997 and we are now once again actively collecting
isolates. Comparison of resistance profiles of the isolates obtained before 1997 to that collected more recently, may provide some insight into shifting antibiotic resistance patterns, particularly to florfenicol, which was introduced in the late 1990’s. The basis of potential resistance of F. psychrophilum to florfenicol is not known. Resistance to chloramphenicol/florfenicol is typically due to production of acetyltransferases (29). Many of the cat plasmid-encoded acetyltransferases that inactivate chloramphenicol are not active against florfenicol. Despite being a relatively new antibiotic, enzymes that inactivate florfenicol, in addition to chloramphenicol, have been recently identified (29). In addition, novel mutations not involving acetlytransferase have also recently been described (30). Identification of florfenicol resistance in F. psychrophilum isolates will necessitate an examination of the genetic basis for the resistance. Although there is presently no commercially licensed vaccine for F. psychrophilum, moderate success has been demonstrated with experimental models using killed whole bacteria (31,32) or outer membrane preparations (33). Intraperitoneal injection, in combination with different adjuvants, has been used most recently (32,33). Protection in vaccination trials has been associated with serum antibody (32,33) and passive transfer with hyperimmune rainbow trout serum provided the best protection against parenteral injection of F. psychrophilum, with limited or no protection provided by non-immune serum or with goat antiserum (34). Infection models using parenteral injection of bacteria can provide useful information as seen above (34,35) but this is an unrealistic route for the majority of North American coldwater disease presentations. Bath and cohabitation exposure methods produce lower mortality rates and are more biologically realistic (11,35) but to date these routes have not provided consistent models for vaccine evaluation or pathogenesis studies. In fact, several authors have failed to achieve clinical disease using cohabitation or immersion infection models (reviewed by Nematollah et al. (6)). Not surprisingly, there is evidence that the success of challenge models is dependent on the strain used (11). The majority of successful studies have concentrated on the septicemic disease, RTFS (reviewed by Nematollah et al. (6)). Standardized and consistent challenge models using parenteral injection are useful to evaluate the efficacy of vaccines to prevent RTFS (35) but are not as appropriate for other forms of disease.

Proceedings of the Canadian Freshwater Aquaculture Symposium – Aquaculture Canada 2004
114 AAC Spec. Publ. No. 11 (2006)
Reproduction of necrotic myositis has only been achieved by intramuscular injection (8) and there is one record of experimental reproduction of vertebral lesions (presumably similar to osteochondritis) (36). It may be that the duration of most challenge models are too limited to allow development of an apparently more chronic form of coldwater disease. We were unable to produce morbidity or mortality in rainbow trout by immersion in large numbers of washed, late culture F. psychrophilum isolated from a severe outbreak of necrotizing myositis, even after abrasion of the skin (8). Ironically, subsequent trials in the same facility with separate infectious agents were hampered by the appearance of coldwater disease (necrotizing myositis), despite rigorous disinfection between infection trials. Coldwater disease, or isolation of F. psychrophilum, had not been experienced in the facility previously. It is obvious that something critical in our knowledge of disease pathogenesis, with regard to experimental transmission, is not fully understood. A final point for challenge studies and for studies on pathogenesis deserves mention. More comprehensive descriptions of the range of clinical signs and lesions achieved by the experimental infection model(s) are required. Studies that conclude with simple statements of mortality or relative percent survival without a thorough description of the range of gross and histological lesions produced are less than ideal and and miss the opportunity to add to our collective knowledge of strain variability and pathogenesis. There is a need for effective vaccination strategies for the field. Even though experimental work to date has suggested that vaccination might be effective (31,33), at present there is no commercial vaccine for F. psychrophilum. Given the relatively small size of the potential market one is unlikely to become available in the near future. The lack of an available commercially licensed preparation is a serious limitation for the cage producers of Ontario. An autogenous bacterin for columnaris is the only preparation that is likely to be available for field use in the foreseeable future and is a formulation that is suitable for food fish. Autogenous bacterins delivered by bath exposure have been used previously in the Ontario industry to a very limited extent, however there is no data available from this work. Given the lack of realistic alternatives, evaluation of a field trial on efficacy or potential cost-effectiveness of an immersion bacterin is required. Even a moderate decrease in
winter mortality achieved by autogenous vaccination could offset the cost associated. Our laboratory is also investigating the role of innate defense in resistance to coldwater disease. Pinpointing the basis of innate resistance could be important, particularly given the lack of a commercial vaccine, coupled with the mounting evidence that low temperatures are non-permissive for generation of effective adaptive immune responses (37). In both invertebrates and vertebrates non-immunoglobulin bacterial binding can be initiated by a variety of plasma proteins, including lectins. Immune lectins occur on phagocytes, in plasma or on mucosal surfaces and have broad carbohydrate specificity, as well as the ability to bind to surfaces of various infectious agents (38). Most vertebrate lectins are constituitively produced but a few may be induced as part of the acute phase response to noxious stimuli. Mannose-binding lectin (MBL) in humans (39) activates the lectin-complement pathway (40). The gene for a MBL homologue has recently been found in carp (41). In humans, MBL gene defects are associated with severe infections (42) and decreased levels are associated with poor phagocytosis (43). The importance of plasma lectins in mammals is now well established so it is probable that some will be important both constituitively and/or adaptively in fish. Thus far the only direct evidence for this are a blue gourami lectin that contributes to increased phagocytosis and resistance to A. hydrophila infection (44) and a multimeric serum lectin from Atlantic salmon that enhances A. salmonicida phagocytosis and activation of macrophage respiratory burst (45). We are particularly interested in plasma proteins, including lectins that actively bind to F. psychrophilum, as well as other fish pathogens. Using a relatively straight-forward bacterial binding assay, plasma proteins are eluted from the bacterial surface and are examined by 1 and 2D-PAGE. To date, we have identified two plasma proteins from rainbow trout with subunit molecular weights of 16 and 37kD on 1D-PAGE, that consistently bind to a pathogenic Ontario strain of F. psychrophilum (unpublished). The 16kD protein has identical molecular weight as rainbow trout ladderlectin (46) and the multimeric Atlantic salmon C-type lectin described above (45). We have also isolated a presumably identical 16kD protein from a variety of carbohydrate matrices and from more than one bacterial fish pathogen that has identical N-terminal amino acid sequence to rainbow trout ladderlectin (unpublished). Confirmation of the identity of our F. psychrophilum-binding proteins awaits mass spectroscopy and amino acid

Proceedings of the Canadian Freshwater Aquaculture Symposium – Aquaculture Canada 2004
AAC Spec. Publ. No. 11 (2006) 115
sequence analysis. The amino acid sequence similarity of rainbow trout ladderlectin and the Atlantic salmon multimeric lectin indicate that they are orthologous molecules (46,47). Ladderlectins are potentially important molecules in innate defense to infectious agents, particularly those that are primarily extracellular pathogens that can be killed by activation of the complement pathway (lectin or otherwise) or other mechanism. To our knowledge the only known lectin of fish that activates the lectin complement pathway is the C1q-like protein of lamprey (48). The basis for the demonstrated increased effectiveness of the fish plasma lectins on bacterial phagocytosis remains to be elucidated (44,45). We are studying the effectiveness of these proteins in experimental infection studies with rainbow trout using Y. ruckeri, A. salmonicida and F. psychrophilum, representing, extracellular, facultative intracellular and mucosal bacterial pathogens, respectively. Using rabbit antiserum to a number of plasma lectins, we will examine temporal responses during infection. We will also examine the function of isolated lectins in vitro, particularly on phagocytosis and complement fixation. It is very likely that these plasma lectins form an array of binding molecules, each of which may have somewhat different functional activities, but that may also represent a redundant system of innate soluble pathogen recognition receptors. Elimination of any one binding lectin, by passive transfer of fish or rabbit antiserum for example, may have no demonstrable effect on susceptibility to experimental infection. It is interesting to note that an unknown, non-immunoglobulin factor that did not involve the alternate complement system was concluded to be responsible for serum inhibition of growth of F. psychrophilum (49). Demonstration of the potential functional significance of these plasma lectins in resistance to F. psychrophilum is an important goal of our laboratory, but is unlikely to yield results immediately applicable to this or the foreseeable futures production seasons. It is therefore critical that we pursue the other goals of our program, alongside other researchers, to examine the effectiveness of practical short-term management or therapeutic options for the control of coldwater disease. Acknowledgments The Fish Pathology Laboratory receives funding from the Ontario Ministry of Agriculture and Food, NSERC, CFI and OIT. S. Hesami is the recipient of a fellowship from the Iranian Ministry of
Technology. S. Russell is the recipient of an NSERC doctoral fellowship. Paul Huber provides technical support for all projects in the Fish Pathology Laboratory. References 1. Kondo M, Kawai K, Kurohara K, Oshima S.
2002. Adherence of Flavobacterium psychrophilum on the body surface of the ayu Plecoglossus altivelis. Microb. Infect. 4:279-283.
2. Lorensen E, Olesen NJ. 1997. Characterization of isolates for Flavobacterium psychrophilum associated with coldwater disease or rainbow trout fry syndrome II: serological studies. Dis. Aquat. Org. 31:209-220.
3. Lorenzen E, Dalsgaard I, Bernardet JF. 1997. Characterization of isolates of Flavobacterium psychrophilum associated with coldwater disease or rainbow trout fry syndrome I: phenotypic and genomic studies. Dis. Aquat. Org. 31:197-208.
4. Madsen L, Dalsgaard I. 2000. Comparative studies of Danish Flavobacterium psychrophilum isolates: ribotypes, plasmid profiles, serotypes and virulence. J. Fish Dis. 23:211-218.
5. Mata M, Skarmeta A, Santos Y. 2002. A proposed serotyping system for Flavobacterium psychrophilum. Lett. Appl. Micro. 35:166-170.
6. Nematollah A, Decostere A, Pasmans F, Haesebrouck F. 2003. Flavobacterium psychrophilum infections in salmonid fish. J. Fish Dis. 26:563-574.
7. Dalsgaard I, Madsen L. 2000. Bacterial pathogens in rainbow trout, Onchorhynchus mykiss (Walbaum), reared at Danish freshwater farms. J. Fish Dis. 23:199-209.
8. Lumsden JS, Ostland VE, Ferguson HW. 1996. Necrotic myositis in cage cultured rainbow trout, Onchorhynchus mykiss (Walbaum), caused by Flexibacter psychrophilus. J. Fish Dis. 19:113-119.
9. Ostland VE, Byrne PJ, Hoover G, Ferguson HW. 1997. Cephalic osteochondritis and necrotic scleritis in intensively reared salmonids associated with Flexibacter psychrophilus. J. Fish Dis. 20:443-451.
10. Ostland VE, McGrogan DC, Ferguson HW. 2000. Necrotic myositis of rainbow trout, Oncorhynchus mykiss (Walbaum): proteolytic characteristics of a crude extracellular preparation from Flavobacterium psychrophilum. J. Fish Dis. 23:329-336.

Proceedings of the Canadian Freshwater Aquaculture Symposium – Aquaculture Canada 2004
116 AAC Spec. Publ. No. 11 (2006)
11. Madsen L, Dalsgaard I. 1999. Reproducible methods for experimental infection with Flavobacterium psychrophilum in rainbow trout Onchorhynchus mykiss. Dis. Aquat. Org. 36:169-176.
12. Bader JA, Shotts EB. 1998. Identification of Flavobacterium and Flexibacter species by species-specific polymerase chain reaction primers to the 16S ribosomal RNA gene. J. Aquat. An. Hlth. 10:311-319.
13. Baliarda A, Faure D, Urdaci MC. 2002. Development and application of a nested PCR to monitor brood stock salmon ovarian fluid and spleen for detection of the fish pathogen Flavobacterium psychrophilum. J. Appl. Micro. 92:510-516.
14. Cepeda C, Santos Y. 2000. Rapid and low-level toxic PCR-based method for routine identification of Flavobacterium psychrophilum. Int. Micro. 3:235-238.
15. del Cerro A, Mendoza MC, Guijarro JA. 2002. Usefulness of TaqMan-based polymerase chain reaction assay for the detection of the fish pathogen Flavobacterium psychrophilum. J. Appl. Micro. 93:149-156.
16. Wiklund T, Madsen L, Bruun MS, Dalsgaard I. 2000. Detection of Flavobacterium psychrophilum from fish tissue and water samples by PCR amplification. J. Appl. Micro. 88:299-307.
17. Hong L, Izumi S, Wakabayashi H. 2000. Detection of Flavobacterium psychrophilum in various organs of ayu Plecoglossus altivelis by in situ hybridization. Fish Path. 36:7-11.
18. Urdaci MC, Chakroun C, Faure D, Bernadet JF. 1998. Development of a polymerase chain reaction assay for the identification and detection of the fish pathogen Flavoabcterium branchiophilum. Res. Micro. 149:519-530.
19. Madetoja J, Wiklund T. 2002. Detection of the fish pathogen Flavobacterium psychrophilum in water from fish farms. Sys. App. Micro. 25:259-266.
20. Vastos IN, Thompson KD, Adams A. 2002. Adhesion of the fish pathogen Flavobacterium psychrophilum to unfertilized eggs of rainbow trout (Onchorhynchus mykiss) to n-hexadecane. Lett. Appl. Micro. 33:178-182.
21. Nilsson WB, Strom MS. 2002. Detection and identification of bacterial pathogens of fish in kidney tissue using terminal fragment length polymorphism (T-RFLP) analysis of 16S rRNA genes. Dis. Aquat. Org. 48:175-185.
22. Madetoja J, Dalsgaard I, Wiklund T. 2002. Occurrence of Flavobacterium psychrophilum in fish-farming environments. Dis. Aquat. Org. 52:109-118.
23. Madetoja J, Nystedt S, Wiklund, T. 2003. Survival and virulence of Flavobacterium psychrophilum in water microcosms. FEMS Micro. Ecol. 43:217-223.
24. Rangdale RE, Richards RH, Alderman DJ. 1997. Minimum inhibitory concentration of selected antimicrobial compounds against Flavobacterium psychrophilum the causal agent of rainbow trout fry syndrome (RTFS). Aquacult. 158:193-201.
25. Lorenzen E. 1994. Study on Flexibacter psychrophilus in relation to rainbow trout fry syndrome RTFS. Ph.D. Thesis, Royal Vet. College, Copenhagen.
26. Bustos PA, Calbuyahue J, Montana J, Opazo B, Solervisenc R. 1995. First isolation of Flexibacter psychrophilus, as a causative agent of rainbow trout fry syndrome (RTFS), producing rainbow trout mortality in Chile. Bull. Eur. Assoc. Fish Path. 15:162-164.
27. Rangdale RE. 1995. Studies on rainbow trout fry syndrome (RTFS). PhD. Thesis, University of Stirling, Stirling, UK.
28. Schmidt AS, Bruun MS, Dalsgaard I, Pedersen K, Larsen JL. 2000. Occurrence of antimicrobial resistance in fish-pathogenic and environmental bacteria associated with four Danish rainbow trout farms. Appl. Env. Micro. 66:4908-4915.
29. Bruun MS, Schmidt AS, Madsen L, Dalsgaard I. 2000. Antimicrobial resistance patterns in Danish isolates of Flavobacterium psychrophilum. Aquacult. 187:201-212.
30. Kehrenberg C, Schwarz S. 2004. fexA, a novel Staphylococcus lentus gene encoding resistance to florfenicol and chloramphenicol. Antimicrob. Agents Chemother. 48:615-618.
31. Obach A, Baudin-Laurencin F. 1991. Vaccination of rainbow trout Onchorhynchus mykiss against the visceral form of coldwater disease. Dis. Aquat. Org. 12:13-15.
32. Rahman MH, Ototake M, Kuroda A, Iida Y, Yokomiso Y, Nakanishi T. 2000. Efficacy of oil-adjuvanted vaccine for coldwater disease in ayu, Plecoglossus altivelis. Fish Path. 35:199-203.
33. Rahman MH, Kuroda A, Dijkstra JM, Kiryu I, Nakanishi T, Ototake M. 2002. The outer membrane fraction of Flavobacterium psychrophilum induces protective immunity in rainbow trout and ayu. Fish Shell. Immunol. 12:169-179.
34. LaFrentz BR, LaPatra SE, Jones GR, Cain KD. 2003. Passive immunization of Onchorhynchus mykiss (Walbaum), against Flavobacterium psychrophilum, the causative agent of bacterial coldwater disease and

Proceedings of the Canadian Freshwater Aquaculture Symposium – Aquaculture Canada 2004
AAC Spec. Publ. No. 11 (2006) 117
rainbow trout fry syndrome. J. Fish Dis. 26:377-384.
35. Garcia C, Pozet F, Michel C. 2000. Standardization of experimental infection with Flavobacterium psychrophilum, the causative agent of rainbow trout Onchorhynchus mykiss fry syndrome. Dis. Aquat. Org. 42:191-197.
36. Madsen L, Arnbjerg J, Dalsgaard I. 2001. Radiological examination of the spinal column in farmed rainbow trout Oncorhynchus mykiss (Walbaum): experiments with Flavobacterium psychrophilum and oxytetracycline. Aquacult. Res. 171:41-48.
37. Rodrigues PN, Dixon B, Roelofs J, Rombout JH, Egberts E, Pohajdak B, Stet, RJ. 1998. Expression and temperature-dependent regulation of the beta2-microglobulin (Cyca-B2m) gene in a cold-blooded vertebrate, the common carp (Cyprinus carpio L.). Dev. Comp. Immunol. 5:263-275.
38. Fujita T. 2002. Evolution of the lectin-complement pathway and its role in innate immunity. Nat. Rev. 2:346-353.
39. Laursen SB, Nielsen OL. 2000. Mannan-binding lectin (MBL) in chickens: molecular and functional aspects. Dev. Comp. Immunol. 24:85-101.
40. Holmskov UL. 2000. Collectins and collectin receprtors in innate immunity. APMIS Suppl. 100:1-59.
41. Vitved L., Holmskov U, Koch C, Teisner B, Hansen S, Skjodt K. 2000. The homologue of mannose-binding lectin in the carp family Cyprinidae is expressed at high level in spleen, and the deduced primary structure predicts affinity for galactose. Immunogenet. 51:955-964.
42. Summerfield JA, Ryder S, Sumiya M, Thursz M, Gorchein A, Monteil MA, Turner MW. 1995. Mannose binding protein gene mutations
associated with unusual and severe infections in adults. Lancet 34:886-889.
43. Sumiya M, Super M, Tabona P, Levinsky RJ, Turner MW, Summerfield JA. 1991. Molecular basis of opsonic defect in immunodeficient children. Lancet 337:1569-1570.
44. Fock WL, Chen CL, Lam TJ, Sin YM. 2001. Roles of an endogenous serum lectin in the immune protection of blue gourami, Trichogaster trichopterus (Pallus) against Aeromonas hydrophila. Fish Shell. Immunol. 11:101-113.
45. Ottinger CA, Johnson SC, Ewart KV, Brown LL, Ross NW. 1999. Enhancement of anti-Aeromonas salmonicida activity in Atlantic salmon (Salmo salar) macrophages by a mannose-binding lectin. Comp. Biochem. Physiol. B. 123:53-59.
46. Hoover GJ, el-Mowafi A, Simko E, Kocal TE, Ferguson HW, Hayes MA. 1998. Plasma proteins of rainbow trout (Oncorhynchus mykiss) isolated by binding to lipopolysaccharide from Aeromonas salmonicida. Comp. Biochem. Physiol. B 120:559-569.
47. Richards RC, Hudson DM, Thibault P, Ewart KV. 2003. Cloning and characterization of the Atlantic salmon serum lectin, a long-form C-type lectin expressed in kidney. Biochem. Biophys. Acta. 1621:110-115.
48. Matsushita M, Matsushita A, Endo Y, Nakata M, Kojima N, Mizuochi T, Fujita T. 2004. Origin of the classical complement pathway: Lamprey orthologue of mammalian C1q acts as a lectin. Proc. Natl. Acad. Sci. USA. 101:10127-10131.
49. Wiklund T, Dalsgaard I. 2002. Survival of Flavobacterium psychrophilum in rainbow trout (Oncorhynchus mykiss) serum in vitro. Fish Shell. Immunol. 12:141-153.

Proceedings of the Canadian Freshwater Aquaculture Symposium – Aquaculture Canada 2004
118 AAC Spec. Publ. No. 11 (2006)
A Review of Epidemiological Investigations of Bacterial Gill Disease in Ontario Ministry of Natural Resources Fish Hatcheries Chris M. Good and Mary A. Thorburn Department of Population Medicine, Ontario Veterinary College, University of Guelph, Guelph ON N1G 2W1 Bacterial gill disease (BGD) is a major cause of mortality in young cultured freshwater fish worldwide. Given that the pathogen, Flavobacterium branchiophilum, is considered ubiquitous in the freshwater environment, outbreaks of BGD are thought to be precipitated by environmental determinants. Although putative risk factors for BGD outbreaks have been suggested, no valid epidemiological studies have been undertaken to investigate these factors. This paper describes our current research to investigate on-going occurrences of BGD in the Ontario Ministry of Natural Resources (OMNR) fish hatchery system, in an effort to identify and quantify the relative importance of risk factors for BGD. Although the analyses of the data have yet to be completed, our one-year prospective case-control study is described in detail, and preliminary descriptive statistics are presented. To provide context, an initial review of the known epidemiology, pathophysiology, diagnosis and treatment of BGD is given. The history of this disease in the OMNR fish hatchery system is also described and general results from our previous retrospective investigations of OMNR fish disease data are presented. Finally, problems associated with conducting within-hatchery epidemiological studies of fish diseases are emphasized. Introduction This paper discusses the epidemiology of bacterial gill disease (BGD), and describes our current work investigating risk factors for BGD outbreaks in Ontario Ministry of Natural Resources (OMNR) fish hatcheries. As an introduction, the epidemiological study of diseases in fish farm settings is briefly discussed. The OMNR fish hatchery system is then described, along with its current disease monitoring program based out of the Fish Health Laboratory at the University of Guelph. A short review of BGD – its known epidemiology, pathophysiology, diagnosis and treatment – is also presented to provide a background to this disease. Finally, our prospective case control investigation of BGD is summarized and although the statistical analyses of our data are currently on-going, some preliminary findings are provided. Epidemiological Study of Diseases in Fish Farms Fish farms, like all intensively reared animal production settings, must contend with the effects of compromised animal health on productivity. Losses sustained from disease outbreaks can seriously jeopardize a given operation’s ability to
survive economically. Taken as a whole, disease represents a significant constraint to aquaculture, not only in terms of production, but also in terms of trade and economic development, throughout the world (1). Understanding the dynamics of disease on fish farms is essential for effective disease prevention and control in these settings. Epidemiology has been defined as the study of the frequency, distribution, and determinants of health and disease in populations (2). Epidemiologists attempt to understand the incidence and spread of pathological agents and their diseases in populations, and to identify risk factors that influence these disease patterns. Diseases occurring in fish farms typically have a multifactorial etiology (3), and epidemiological investigation can be employed to identify, and to quantify the relative importance of, factors influencing the health status of captive fish populations. Observational epidemiological studies to determine risk factors for diseases in fish farms are relatively rare (4). These studies are often complicated by the typical mixing and sorting of within-farm fish populations, such that it is difficult to observe distinct populations of fish over time within a given facility (5). For example, if data on a specific risk factor are being collected, but it is uncertain (due to mixing of fish over time) whether

Proceedings of the Canadian Freshwater Aquaculture Symposium – Aquaculture Canada 2004
AAC Spec. Publ. No. 11 (2006) 119
all fish within a population (e.g. an individual tank) have been exposed to this risk factor in the past, then it is impossible to infer any association between the risk factor and disease, should it arise in that population. Because of the dynamic nature of within-farm fish populations, many of the published studies in this area have been carried out at the farm-level (6,7,8). An example of a farm-level risk factor is the farm’s geographic location. However, disease almost invariably manifests itself at the level of the individual holding unit within a farm (e.g. a tank or cage), and hence research with the farm as the unit of concern cannot identify the important tank-level risk factors that precipitate disease outbreaks. As well, because fish farmers usually manage their captive populations at the level of the holding unit, this is deemed the most appropriate level of concern for epidemiological studies (4). Our research described in this paper was conducted at the tank-level. This was possible because the hatcheries involved were Ontario Ministry of Natural Resources (OMNR) facilities. Hatchery managers at OMNR hatcheries do not mix and sort their fish populations to the extent practiced by their commercial counterparts, and therefore individual tank populations could be identified and followed over time with comparatively little difficulty. The diseases affecting OMNR fish populations, however, are the same as those affecting Ontario commercial fish farms, and hence diseases important as production-limiting factors in Ontario aquaculture can be examined effectively in OMNR hatcheries. The Ontario Ministry of Natural Resources Fish Hatchery System and Disease Monitoring Program The Ontario Ministry of Natural Resources currently uses ten fish culture stations located throughout the province to raise fish for stocking the four Ontario Great Lakes and over 1000 inland lakes. Indigenous species are raised primarily to rehabilitate decimated native populations, while exotic species are stocked to fill specific ecological niches, provide sport fishing opportunities for anglers, and divert fishing pressures away from areas of rehabilitation (9). Historically, the vast majority of fish raised by OMNR are of the family Salmonidae, the majority of which are lake trout (Salvelinus namaycush) or brook trout (S. fontinalis). Salmonids reared in the OMNR system
are usually stocked at around 15 months of age, although some of the Pacific salmonids (e.g. coho salmon (Oncorhynchus kisutch)) are stocked as fry (around 4 months of age). Fish reared in the OMNR hatchery system are organized into “lots”. A lot is defined as a group of fish that are the same age, have always shared the same water supply, and have originated from a discrete spawning population. Within each facility, lots are often spread out over a number of tanks. Lots are further classified within the hatchery system as being either production (fish destined for stocking) or broodstock (sexually mature fish used for annual reproduction). The Great Lakes Fishery Commission (GLFC) recommends the screening of hatchery fish for important pathogens prior to stocking, in an effort to avoid the spread of pathogens from hatcheries to wild populations (10). To support this, the GLFC published a Model Program (11) as a guide for the various agencies in the Great Lakes basin in charge of regional fish stocking programs. The current OMNR fish disease monitoring program is based on the GLFC Model Program, with (i) annual routine screening of asymptomatic hatchery stocks for listed bacterial, viral, and parasitic agents considered important threats to the health of Great Lakes fish, and (ii) investigating any cases of clinical disease that occur. Listed bacterial agents include Renibacterium salmoninarum (bacterial kidney disease), Yersinia ruckeri (enteric redmouth disease), and Aeromonas salmonicida (furunculosis), and key target viruses are those causing viral haemorrhagic septicaemia (VHS), infectious pancreatic necrosis (IPN), and infectious haematopoietic necrosis (IHN). In addition, wild fish are screened annually for the presence of the parasitic myxosporidia, Myxobolus cerebralis, which causes whirling disease, and Ceratomyxa shasta, which causes ceratomyxosis. The OMNR disease monitoring program is based out of the Fish Health Laboratory (FHL), which is located at the University of Guelph. Each year, each OMNR hatchery is required to send a sample of asymptomatic fish to the FHL for pathogen screening. Each hatchery’s required annual sample size is 252 fish, which was calculated based on a 99% confidence of detecting at least one test-positive fish from an infected hatchery, given an assumed pathogen apparent prevalence of 1.8% (Thorburn, unpublished). In other words, if a given pathogen infects (at a detectable level) at least 1.8% of a given hatchery’s fish (the 1.8%

Proceedings of the Canadian Freshwater Aquaculture Symposium – Aquaculture Canada 2004
120 AAC Spec. Publ. No. 11 (2006)
apparent prevalence was estimated from FHL data from 1987-1992), then the sample size of 252 fish provides a 99% confidence that the pathogen will be detected in at least one fish by the tests employed at the FHL. Predominant among past FHL clinical diagnoses is bacterial gill disease (BGD), caused by F. branchiophilum. This pathogen is not listed as an important disease agent in the GLFC Model Program because it is considered ubiquitous in the aquatic environment, and thus its spread from hatchery to wild stocks (which might provide justification for the screening of asymptomatic hatchery fish for the BGD organism) is not a concern. Like many commercial farms, several of the OMNR hatcheries have had a history of persistent problems with BGD. Despite a variety of preventive measures taken by hatcheries to combat outbreaks, BGD remains an important fish health issue in the OMNR hatchery system. Bacterial Gill Disease Bacterial gill disease (BGD) is a major disease problem affecting intensively reared freshwater fish in North America, as well as in most parts of the world. The impact of BGD on farmed salmonid production throughout the world, in terms of estimated annual losses, is considered enormous (12). In Ontario, BGD is an important production-limiting factor in commercial rainbow trout (Oncorhynchus mykiss) operations: over half of all submissions from Ontario fish farms to the Ontario Veterinary College for diagnosis have originated from BGD outbreaks (13,14). As well, BGD has been shown to be the most common reason for chemotherapeutic treatment on Ontario land-based farms (15). The disease has been reported in a wide range of cultured coldwater and warmwater fish species. The population at risk for BGD is usually limited to intensively reared fry and small fingerling-sized fish; however, older adolescent and market-sized fish can also be affected (14). The causative agent of BGD, Flavobacterium branchiophilum, is considered ubiquitous in the freshwater environment. When environmental conditions are favourable for the pathogen, F. branchiophilum is able to attach and proliferate on the gill tissue of susceptible fish, compromising the respiratory capacity of affected individuals and leading to characteristic signs of BGD. These signs include inappetence, lethargy, swimming at the surface, and lining up at a holding unit’s freshwater inlet. As well, affected fish often gasp at the surface, display flared operculae, and have
increased mucus production that leads to foaming of the water. In severe outbreaks, which often have a rapid onset, mortality can be very high unless treatment is administered quickly and effectively. Even when following the recommended treatment protocol, outbreaks can still be prolonged, with affected tanks requiring multiple administrations of chemotherapeutants, and mortalities remaining relatively high for up to several weeks. Environmental factors have long been recognized as being important in allowing F. branchiophilum to colonize gill tissue and cause clinical BGD (16,17). There are a variety of such stressors either considered, or suspected to be, of particular importance in instigating or exacerbating outbreaks. However, despite the impact of BGD on international aquaculture production, very little epidemiological research has been conducted to investigate the role of putative BGD risk factors. Risk factors considered important in triggering BGD include high rearing densities, inadequate water flow rates, and poor sanitary conditions (e.g. the accumulation of feed or excrement), which can directly lead to reduced dissolved oxygen and increased total ammonia levels (12,13). High suspended solids have also been suggested as a risk factor for BGD (18). However, BGD has been reproduced in water considered to be of good quality (18,19), and therefore poor water quality might only be involved in amplifying the effects of outbreaks. Prevention of BGD outbreaks is usually carried out through reducing environmental stressors. None of the putative BGD risk factors listed above, however, has been investigated at the level of the holding unit (i.e. the level at which BGD actually manifests itself) in an observational study to quantify its association with disease outbreaks. Laboratory studies have been conducted since the 1970s to investigate various aspects of BGD. One epidemiologically relevant component of BGD that has been studied is pathogen and disease transmission. Bullock (16) was unable to induce BGD horizontally in healthy fish by using live or dead BGD-infected fish as sources of disease; BGD was only successfully induced in these studies after crowding fish in very poor quality water. Ferguson et al. (19), however, were able to horizontally transmit BGD from sick to healthy fish in water that they considered to be of good quality. An interesting experimental finding was made by MacPhee et al. (20), in that feeding fish following bath challenge with F. branchiophilum was associated with higher subsequent morbidity and
Proceedings of the Canadian Freshwater Aquaculture Symposium – Aquaculture Canada 2004
AAC Spec. Publ. No. 11 (2006) 121
mortality than in fish not fed following bath challenge. The authors of this study suggest that BGD is linked to changes in the gill during the consumption of feed; however, the role of feeding and diet in the development of BGD has not been further investigated to date. A seasonal pattern to the incidence of BGD outbreaks has been suggested by Speare and Ferguson (14). Their study demonstrated a rise in BGD submissions to a diagnostic laboratory in the Spring and Summer, with a drop in submissions in the Autumn and Winter months. This finding agrees with popular notions that rising and high water temperatures that exist in the Spring and Summer months serve to stress farmed fish, and hence predispose them to diseases, including BGD. However, the authors note that in their study the population most at risk for BGD (i.e. fry and fingerlings) existed in greater numbers during the observed period of increased submissions, and hence the age and/or size of fish at a particular time might be a more important risk factor for BGD than the effect of season. Teare (21) reported a seasonal incidence of chemotherapeutant usage (the majority of which was assumed to be for BGD) similar to the seasonal BGD submission distribution reported by Speare and Ferguson (14) (i.e. relatively higher treatment rates during the warmer months of the year). Furthermore, the author demonstrated a negative association with treatments, regardless of fish age/size, during the Fall months. However, management practices (in particular stocking density) also change during the Fall months, and hence a true seasonal pattern could not be demonstrated. The most common method of clinically diagnosing BGD is by microscopic examination of gill tissue (22). When a quality phase-contrast microscope is employed, wet mounts are prepared by clipping a sample of tissue from the tips of the gills and examining the specimen directly without the use of staining. In a presumptive case of BGD, long, hair-like, filamentous rods are seen adhering to the epithelial layers of the gill lamellae, either individually, in small patches, or in heavy, widespread “blankets” covering much of the tissue. The pathogen can also be observed floating freely in the wet mount fluid, or tangled up in mucus or particulate matter clinging to the gills. In the absence of a sophisticated scope, squashes of gill tissue can be prepared by taking a sample of gill tissue and staining with either Methylene Blue or Gram stains. During suspected cases of BGD in OMNR hatcheries, the FHL requires that
six moribund fish be sent live in water for diagnosis, since sampled fish need to be alive up until gill examination to preserve the integrity of the gill structure. If it is unlikely that sampled moribund fish will remain alive in the time it takes to reach the FHL, then these fish can be fixed in formalin, stored in alcohol and sent in a preserved state to the FHL. The major chemotherapeutant used to combat BGD is Chloramine-T. However, despite its widespread usage, Chloramine-T has not been registered for aquacultural use in Canada due to debate over chemical derivatives (particularly toluene) believed to persist in fish tissues after treatment. Hydrogen peroxide is also used to treat BGD in hatchery settings; this compound is considered an environmentally friendly alternative to Chloramine-T (23). Various quaternary ammonium compounds have been used in the past to treat BGD; these include Hyamine, Roccal, and Zephiran. Although initially considered to be quite useful in treating BGD (24), Hoskins and Dilziel (25) observed harmful side effects (e.g. severe gill damage) from these compounds administered at high concentrations. Since that time, their use has been approached with caution. Successful treatment of BGD, regardless of the therapeutic agent used, depends upon intervention early on in the outbreak; treatment efforts made past a certain point, after mortalities have risen sharply, are often ineffectual (12). Multiple treatments may be required if the outbreak is in an advanced stage, or if the fish are under stress (26). Current Epidemiological Investigations of Bacterial Gill Disease in the Ontario Ministry of Natural Resources Fish Hatchery System We are currently conducting tank-level BGD risk factor studies using data collected from fish hatcheries in the OMNR system. Two retrospective studies (using central OMNR data and data collected and compiled from on-site OMNR hatchery records) and one 1-year prospective case-control study have been undertaken to identify, and quantify the effects of, risk factors associated with BGD outbreaks. Data collection for all studies has been limited to early rearing fish (i.e. fish typically less than 9 months in age in the hatchery’s early rearing unit, before being transferred to advanced rearing facilities), since these populations are considered to be at a higher risk for BGD outbreaks.

Proceedings of the Canadian Freshwater Aquaculture Symposium – Aquaculture Canada 2004
122 AAC Spec. Publ. No. 11 (2006)
The main focus of our research, the 1-year prospective case-control study, is summarized in this section. Although the statistical analyses are presently being conducted, some preliminary descriptive findings (based on confirmed BGD cases only) are mentioned. Five OMNR hatcheries (and one Ontario Ministry of Agriculture and Food fish hatchery) were selected for this study based on their recent history of BGD outbreaks, and on their willingness to participate. Each hatchery was required to send, prior to treatment, samples of moribund fish to the FHL each time BGD was suspected in a particular tank or tanks during the course of the study. Diagnosis of BGD was confirmed at the FHL using standard light microscopy. A BGD study case was therefore defined as follows: a tank of fish exhibiting signs considered by hatchery staff to be consistent with BGD, and one that would normally have been treated for BGD based on their observations. Such tanks were allowed to become a study case only if the sample (6 fish) collected prior to treatment was diagnosed at the FHL as BGD-positive. An identified case tank was then only eligible to become a case tank again if, after 3 weeks following the end of treatment, no further signs of BGD were noted, no elevated mortalities were observed, and no further treatments were given. As well, each hatchery was required to record daily tank-level risk factor data, and to submit detailed data sheets at the end of each study month. Data were collected from all early-rearing tanks in use at each hatchery, and submitted electronically as spreadsheets summarizing each month of the study. The tank-level variables included in these spreadsheets were: lot identification, species, number of fish, age of fish (with Day 1 being the first day of feeding following swim-up), feed type, pellet size and amount fed, mortalities, H2O volume, H2O flow rate, and average fish weight (when measured). As well, hatchery staff was asked to indicate when any of the following occurred with individual tanks over the course of the month: fish handling, transfers, or treatments; abnormal or elevated waste; or signs of morbidity. Once all data were collected and compiled at the end of the 1-year study period, control tanks were selected from the available pool based on strict criteria, in order to avoid misclassification of diseased tanks as controls. A study control tank was therefore defined as the following: a tank of
fish that had not been treated (for any reason) during the previous 3 weeks, with no signs of morbidity and no elevated mortalities seen. If these tanks were treated (for any reason) in the subsequent 3 weeks, then they were not eligible to be controls. Control tanks were matched to cases by hatchery, species, and time of year (i.e. week of study) in order to control for the possible confounding effects of these variables. Before analyses were initiated, certain tank-level variables needed to be derived, either to provide daily estimates or to provide standardized values that could be compared between tanks. Estimated average individual fish weight within a tank was considered the most important variable, because all other derived variables required an estimated weight value to be calculated. Because estimated fish weight was only measured intermittently (usually once or twice a month), growth curves needed to be generated for each study tank in order to estimate individual fish weight for any selected day during the study period. Table Curve 5.01 (SYSTAT Software, Inc., Richmond, California, USA) software was used for this purpose, with individual weight measurements and corresponding fish age values being compiled and imported into the software. Individual weight values at any point in time could then be selected based on the growth curves generated. Tank-level variables standardized by estimated average individual fish weight included biomass (number of fish X estimated average individual fish weight), standardized feeding rate (in grams of feed per gram of fish), standardized flow rate (in L/min/gram of fish), standardized exchange rate (in number of complete H2O volume turnovers in a tank in a given hour, per gram of fish), and density (biomass / H2O volume). Analyses of the data described above are currently being conducted. Preliminary descriptive findings are briefly mentioned here. There were 55 unique case tanks (i.e. fish of a specific lot within a specific tank) confirmed at least once with BGD during the course of the study. These case tanks originated from 4 of the 6 hatcheries recording data. Among confirmed case tanks, median fish age was 14 weeks, median estimated individual fish weight was 0.96 grams, and median fish density was 12.6 grams of fish per liter of water. Brook trout (Salvelinus fontinalis) were predominant among confirmed case tanks (37/55, or 67.3%), followed by rainbow trout (Oncorhynchus mykiss) (12.7%) and lake trout (S. namaycush) (10.9%). The majority of cases were diagnosed in the Spring (March-May) and Summer

Proceedings of the Canadian Freshwater Aquaculture Symposium – Aquaculture Canada 2004
AAC Spec. Publ. No. 11 (2006) 123
(June-August) months (40.0% and 50.1%, respectively). Acknowledgements The authors wish to thank the following: the Ontario Ministry of Natural Resources, Rod Penney, and the managers and staff of the hatcheries involved in our study; the Ontario Ministry of Agriculture and Food, Rich Moccia and Michael Burke; Dr. Roz Stevenson and Steve Lord at the OMNR Fish Health Laboratory; and the Department of Population Medicine, Ontario Veterinary College. References 1. FAO (Food and Agriculture Organization of the
United Nations), 1998, Fish Health and Quarantine. <http://www.fao.org/docrep/003/w7499e/w7499e23.htm>
2. Martin, S.W., Meek, A.H., Willeberg, P., 1987, Veterinary Epidemiology: Principles and Methods. Iowa State University Press, Ames, 343 pp.
3. Hedrick, R.P., 1998, Relationships of the host, pathogen and environment: implications for diseases of cultured and wild fish populations. J. Aquat. Anim. Health 10, 107-111.
4. Thorburn, M.A., Teare, G.F., Martin, S.W., Moccia, R.D., 2001, Group-level factors associated with chemotherapeutic treatment regimens in land-based trout farms in Ontario, Canada. Prev. Vet. Med. 50, 165-176.
5. Thorburn, M.A., 1999, Applying epidemiology to infectious diseases of fish. In: Woo, P.T.K., Bruno, D.W., (Eds.) Fish Diseases and Disorders (Volume 3) Viral, Bacterial and Fungal Infections. CABI Publishing, New York, pp. 689-722.
6. Thorburn, M.A., 1995, Variables associated with the use of chemotherapeutic agents on trout farms in Ontario, Canada. Prev. Vet. Med. 24, 1-14.
7. Bebak, J., Baumgarten, M., Smith, G., 1997, Risk factors for bacterial gill disease in young rainbow trout (Oncorhynchus mykiss) in North America. Prev. Vet. Med. 32, 23-34.
8. St-Hillaire, S., Ribble, C.S., Stephen, C., Anderson, E., Kurath, G., Kent, M.L., 2002, Epidemiological investigation of infectious hematopoietic necrosis virus in salt water net-pen reared Atlantic salmon in British Columbia, Canada. Aquaculture 212, 49-67.
9. OMNR (Ontario Ministry of Natural Resources), 1992, SPOF II: An Aquatic Ecosystem Approach to Management Fisheries. Ontario Ministry of Natural Resources, Peterborough. 22 pp.
10. GLFC (Great Lakes Fishery Commission), 1983, A Guide to Integrated Fish Health Management in the Great Lakes Basin. Great Lakes Fishery Commission, Ann Arbor, 262 pp.
11. GLFC (Great Lakes Fishery Commission), 1985, Great Lakes fish disease control policy and model program. Great Lakes Fishery Commission, Ann Arbor, 24 pp.
12. Shotts, E.B. Jr., Starliper, C.E., 1999, Flavobacterial diseases. In: Woo, P.T.K., Bruno, D.W., (Eds.) Fish Diseases and Disorders (Volume 3) Viral, Bacterial and Fungal Infections. CABI Publishing, New York, pp. 559-576.
13. Daoust, P.Y., Ferguson, H.W., 1983, Gill diseases of cultured salmonids in Ontario. Can J. Comp. Med. 47, 358-362.
14. Speare, D.J., Ferguson, H.W., 1989, Clinical and pathological features of common gill diseases of cultured salmonids in Ontario. Canadian Vet. J. 30, 882-887.
15. Thorburn, M.A., Moccia, R.D., 1993, Use of chemotherapeutants on trout farms in Ontario, J. Aquat. Anim. Health 5, 85-91.
16. Bullock, G.L., 1972, Studies on Selected Myxobacteria Pathogenic for Fishes and on Bacterial Gill Disease in Hatchery-reared Salmonids. US Fish and Wildlife Service Technical Paper #60, Washington, D.C., 30 pp.
17. Schachte, J.H., 1983, Bacterial Gill Disease. In: Meyer, F.P., Warren, J.W., Carey, T.G., (Eds.) Guide to Integrated Fish Health Management in the Great Lakes Basin. Great Lakes Fishery Commission, Ann Arbor, 262 pp.
18. Bullock, G.L., Herman, R., Heinen, J., Noble, A., Weber, A., Hankins, J., 1994, Observations on the occurrence of bacterial gill disease and amoeba gill infestation in rainbow trout cultured in a water recirculation system. J. Aquat. Animal Health 6, 310-317.
19. Ferguson, H.W., Ostland, V.E., Byrne, P., Lumsden, J.S., 1991, Experimental production of bacterial gill disease in trout by horizontal transmission and bath challenge. J. Aquat. Animal Health 3, 118-123.

Proceedings of the Canadian Freshwater Aquaculture Symposium – Aquaculture Canada 2004
124 AAC Spec. Publ. No. 11 (2006)
20. MacPhee, D.D., Ostland, V.E., Lumsden, J.S., Derksen, J., Ferguson, H.W., 1995, Influence of feeding on the development of bacterial gill disease in rainbow trout Oncorhynchus mykiss. Dis. Aquat. Org. 21, 163-170.
21. Teare, G.F., 1997. A prospective study of chemotherapeutic use on Ontario land-based trout farms over one production cycle. Ph.D. Thesis. University of Guelph, Guelph, Ontario.
22. Plumb, J.A., 1994, Health Maintenance of Cultured Salmonids - Principal Microbial Diseases. CRC Press, Inc., Boca Raton, 254 pp.
23. Lumsden, J.S., Ostland, V.E., Ferguson, H.W., 1998, Use of hydrogen peroxide to treat
experimentally induced bacterial gill disease in rainbow trout. J. Aquat. Animal Health 10, 230-240.
24. Roberts, R.J., 1978, Easy diagnosis for a dangerous gill bacteria. Fish Farmer 1, 40-41.
25. Hoskins, G.E., Dilziel, F.C., 1984, Survival of chinook fry Oncorhynchus tshawytscha following exposure to benzalkonium chloride in soft water. Prog. Fish Cult. 46, 98-101.
26. Bullock, G.L., Herman, R., Waggy, C., 1991, Hatchery efficacy trials of chloramine-T for control of bacterial gill disease. J. Aquat. Animal Health 3, 48-50.

Proceedings of the Canadian Freshwater Aquaculture Symposium – Aquaculture Canada 2004
AAC Spec. Publ. No. 11 (2006) 125
Temperature Dependent Immune System Suppression in Teleost Fish: Do Pathogens Dominate in the Cold? Brian Dixona, Julie Parksb, Suchita Natha, Steve Kalesa, Kazuhiro Fujikia and Patricia Schultec aDepartment of Biology, University of Waterloo, 200 University Ave. W., Waterloo, ON. N2L 3G1 bBiological Sciences, University of Alberta, Edmonton, AB T6G 2E9 cDepartment of Zoology, University of British Columbia, 6270 University Blvd., Vancouver, B.C. V6T 1Z4 (Corresponding author: [email protected]) Major Histocompatibility (MH) receptors present small peptide fragments of pathogens to immune system cells in both mammals and teleosts. As ectotherms however, fish are regularly subjected to low temperature extremes, while mammals maintain a constant body temperature. Common carp turn off expression of MH class I receptors, critical proteins for defence against viruses, at low temperatures - correlating with observations of increased frequency of diseases. The goal of this study is to understand the expression of MH and related genes at low temperatures in salmonid fishes and determine if a similar immunosuppression occurs. Through the development of antibodies and gene transcript assays, preliminary data suggests that salmonid class I MH gene transcript and protein expression is maintained at low temperatures. Preliminary data suggest, however, that class II MH genes, which produce key proteins needed for defence against bacterial diseases, are turned off when salmonids experience low temperatures. We are also examining several other genes involved in assisting MH genes, such as calreticulin and invariant chain, to see if they also modulate the function of these critical receptors. An understanding of the effects of temperature on immune function in salmonids will help us to develop methods to enhance immune responses. Introduction The current knowledge base on teleost fish immune systems is limited. In recent years researchers have shown that their immune systems are made up of the same basic cells and proteins as mammalian immune systems (1). For example, they have B-cells (2), immunoglobulins (3), T cell receptors (4), major histocompatibility receptors (1) and cytokines (5). A closer look, however, shows that despite these similarities fish organize and utilize their immune system genes and cells in strikingly different manner than their mammalian counterparts (1,6). Any application of immunological expertise to solve practical problems such as disease outbreaks in aquaculture facilities must take these functional differences into account and come up with solutions tailored to teleost immune systems in order to be successful. This paper discusses one key difference between mammalian and teleost immune systems in a key process responsible for initiating responses to bacterial diseases.
Major Histocompatibility Receptors Major histocompatibility complex (MHC) receptors recognize pathogens and sit on the surface of vertebrate cells presenting small fragments of them to T cells – immune system cells that turn on immune responses when they recognize those fragments (7). One important difference between teleosts and other vertebrates is that while the genes encoding major histocompatibility receptors are all linked in a single genetic complex on a single chromosome in mammals, birds, amphibians and sharks (reviewed in Shand and Dixon (6)), they are spread over at least three linkage groups in teleost fish (8). This has prompted researchers to drop the word complex and call these simply Major Histocompatibility (MH) genes when referring to the teleost genes (6). There are two types of these receptors in all vertebrates. Class I MH receptors comprise a 45kD “heavy” chain protein and a 12kD protein called beta 2-microglobulin (ß2m). The MH class I heavy chain has a transmembrane domain connecting a short cytoplasmic tail to three extracellular domains, called alpha 1, alpha 2 and alpha 3. The domain closest to the transmembrane domain is the alpha 3, an immunoglobulin domain that binds to the beta 2-

Proceedings of the Canadian Freshwater Aquaculture Symposium – Aquaculture Canada 2004
126 AAC Spec. Publ. No. 11 (2006)
microglobulin protein (essentially a single immunoglobulin domain itself) and both of these together hold the alpha 1 and alpha 2 domains up away from the cell surface. These two domains fold together to form a groove, in which the fragments of pathogens are carried (7). Both beta 2-microglobulin and a peptide fragment in the heavy chain groove are required for MH class I receptors to be transported to the cell surface and function correctly (9). Class II MH receptors are made up of two 30kD proteins called the class II alpha and beta chains. Each of these has a short cytoplasmic segment, a transmembrane domain and two extracellular domains, alpha 1 and alpha 2 for the alpha chain and beta 1 and beta 2 for the beta chain. The alpha 2 and beta 2 domains are immunoglobulin domains that sit closest to the cell surface and hold up alpha 1 and beta 1 domains. The alpha 1 and beta 1 domain fold together to form a peptide-binding groove that is similar in structure and function to the MH class I receptor groove (7). Class I MH receptors activate cellular immune responses which eliminate intracellular pathogens such as viruses, while class II receptors carry fragments of extracellular pathogens such as bacteria up to the cell surface and activate antibody responses (7). The Effect of Changing Temperatures on MH Receptor Expression Experiments with human cells lines have shown that when they are kept at 27oC expression of their MHC class I receptors is disrupted, with heavy chains coming to the cell surface with no associated beta 2-microglobulin or peptide (10). This is not really a physiological problem for exothermic organisms such as humans as they will likely never experience body temperatures of 27oC. Teleost fish however are endotherms and thus experience a wide range of body temperatures. When one of us (Dixon) first cloned beta 2-microglobulin from teleost fish he teamed up with a Dutch group that had cloned the MH class I heavy chain to see if fluctuations in temperatures affected teleost MH receptor expression. The basic expectation was that teleosts would express these receptors normally throughout their physiological temperature range. Surprisingly, carp kept at 6oC, near the low end of their physiological temperature range, for 6 days lost all MH class I receptors from the surface of their peripheral blood leukocytes (PBL) (11). Further investigation showed that these animals had specifically turned off the expression of the beta 2-microglobulin gene, removing one of the
essential components for functional expression of the MH class I receptor (11). This may be a result of the fact that these animals are not moving or eating and are trying to shut down some of the more energy demanding aspects of their metabolism. Immune responses require the rapid clonal growth of immune system cells and thus probably demand too much energy for animals in torpor to perform. In addition, many pathogens probably do not proliferate very well at temperatures of 6oC and below, so fish have probably evolved this mechanism to save energy when they are safe from pathogens or are confident that their innate immune defences can handle the few pathogens capable of infecting them at these temperatures. One would think, however, that evolution would produce pathogens that can take advantage of the fact that fish turn off their defences at low temperatures. Interestingly, many diseases tend to affect teleosts when water temperatures drop. For example winter kill of catfish is caused by the fungal pathogen Saprolegnia when water temperatures drop below 17oC, Walleye develop dermal sarcoma tumours that are caused by a retrovirus in fall and winter and recover from those tumours in spring when water temperatures rise and, finally, the bacterial mediated cold water disease, as its name suggests, causes disease in rainbow trout during the winter months. The Effect of Temperature on MH Class I Receptor Expression in Salmonids Since carp are not an economically important species in North America, we chose to look at the expression and function of MH receptors in salmonids. We cloned MH class I heavy chain, beta 2-microglobulin, MH class II alpha and MH class II beta genes from rainbow trout, then used those clones to make recombinant protein in bacteria and polyclonal antibodies in rabbits. We also cloned beta 2-microglobulin from Atlantic salmon. These reagents were then used to examine the expression of these genes and their protein products in animals and cell lines kept at normal and low temperatures. In our first experiment we observed that Atlantic salmon kept at 5oC produced similar amounts of beta 2-micorglobulin mRNA in all of their tissues as animals kept at 13oC, as assessed by northern blotting. Concerned that 5oC might not be close enough to the lower end of the salmonid physiological temperature range, we performed all subsequent experiments using 2oC as the low
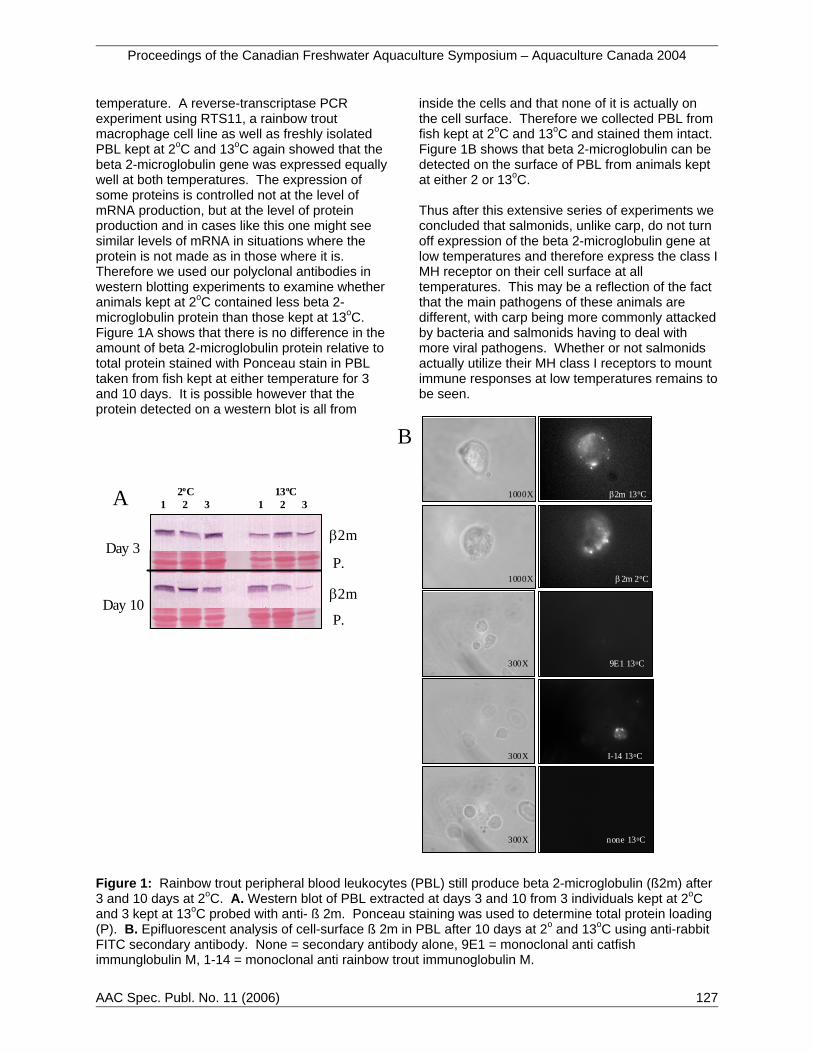
Proceedings of the Canadian Freshwater Aquaculture Symposium – Aquaculture Canada 2004
AAC Spec. Publ. No. 11 (2006) 127
1000X β2m 2oC
1000X β2m 13oC
300X 9E1 13oC
300X I-14 13oC
300X none 13oC
B
β2m
P.
A
Day 3
Day 10β2m
P.
2oC 13oC 1 2 3 1 2 3
temperature. A reverse-transcriptase PCR experiment using RTS11, a rainbow trout macrophage cell line as well as freshly isolated PBL kept at 2oC and 13oC again showed that the beta 2-microglobulin gene was expressed equally well at both temperatures. The expression of some proteins is controlled not at the level of mRNA production, but at the level of protein production and in cases like this one might see similar levels of mRNA in situations where the protein is not made as in those where it is. Therefore we used our polyclonal antibodies in western blotting experiments to examine whether animals kept at 2oC contained less beta 2-microglobulin protein than those kept at 13oC. Figure 1A shows that there is no difference in the amount of beta 2-microglobulin protein relative to total protein stained with Ponceau stain in PBL taken from fish kept at either temperature for 3 and 10 days. It is possible however that the protein detected on a western blot is all from
inside the cells and that none of it is actually on the cell surface. Therefore we collected PBL from fish kept at 2oC and 13oC and stained them intact. Figure 1B shows that beta 2-microglobulin can be detected on the surface of PBL from animals kept at either 2 or 13oC. Thus after this extensive series of experiments we concluded that salmonids, unlike carp, do not turn off expression of the beta 2-microglobulin gene at low temperatures and therefore express the class I MH receptor on their cell surface at all temperatures. This may be a reflection of the fact that the main pathogens of these animals are different, with carp being more commonly attacked by bacteria and salmonids having to deal with more viral pathogens. Whether or not salmonids actually utilize their MH class I receptors to mount immune responses at low temperatures remains to be seen.
Figure 1: Rainbow trout peripheral blood leukocytes (PBL) still produce beta 2-microglobulin (ß2m) after 3 and 10 days at 2oC. A. Western blot of PBL extracted at days 3 and 10 from 3 individuals kept at 2oC and 3 kept at 13oC probed with anti- ß 2m. Ponceau staining was used to determine total protein loading (P). B. Epifluorescent analysis of cell-surface ß 2m in PBL after 10 days at 2o and 13oC using anti-rabbit FITC secondary antibody. None = secondary antibody alone, 9E1 = monoclonal anti catfish immunglobulin M, 1-14 = monoclonal anti rainbow trout immunoglobulin M.

Proceedings of the Canadian Freshwater Aquaculture Symposium – Aquaculture Canada 2004
128 AAC Spec. Publ. No. 11 (2006)
The Effect of Temperature on MH Class II Receptor Expression in Salmonids To be thourough, we also studied the expression of class II MH genes and proteins at normal and low ambient temperatures. An initial study with a small number of animals showed that both MH class II alpha and MH class II beta mRNAs are down regulated after 5 days at 2oC, while a fish kept at 13oC maintained high levels of expression of both genes (data not shown). In support of the theory that animals at the very low end of their physiological temperature range are conserving energy, one of the 2oC fish also eliminated mRNA for ribosomal protein S11, while the other decreased the expression significantly. Ribosomes are used for protein synthesis, so this reduction must reflect a decrease in metabolism. The down regulation in both MH class II alpha and
MH class II beta mRNAs in the two 2oC fish was accompanied by a decrease in the amount protein (data not shown). In order to confirm that the down regulation we saw in the first experiment was real, we repeated the experiment with two groups of 6 fish, one kept at 2oC, while the control group was held at 13oC. After 10 days, we examined the protein levels of MH class II alpha and beta as well as beta 2-microglobulin by western blotting. As seen in Figure 2, the fish kept at 13oC generally expressed high levels of all three proteins, while 5 of the 6 fish kept at 2oC produced reduced amounts of MH class II alpha protein and eliminated production of MH class II altogether. The fact that all 6 of the 2oC produced large amounts of beta 2-microglobulin confirmed our earlier observations.
Figure 2: MH class II receptors are downregulated in response to low temperatures. Western blot analysis of cellular levels of MH class II CII , MH class II CII and beta 2-microglobulin (ß 2m) for six individuals kept for 10 days at 2o versus six control individuals kept at 13oC for 10 days. Ponceau staining was used to determine total protein loading (P).
cIIα
cIIβ
β2m
P
2oC 13oC1 2 3 4 5 6 1 2 3 4 5 6

Proceedings of the Canadian Freshwater Aquaculture Symposium – Aquaculture Canada 2004
AAC Spec. Publ. No. 11 (2006) 129
One very interesting observation we made while carrying out these experiments was that even animals kept at 13oC could shut off their MH class II genes. In one experiment we kept groups of three 454 gram trout in 2 foot by 2 foot tanks and drew blood from them 3 days before we dropped the temperature in one of the tanks as well as on days 3 and 10 for the low temperature regime. We turned the temperature back up on day 10 and bled the animals on day 16. When we examined expression of MH class II alpha and beta in these animals by western blot we saw that both groups of animals downregulated expression of both proteins and it did not reappear by day 16 (data not shown). Thus while salmonids may retain antiviral responses at low temperatures because they retain expression of their MH class I receptors, they do turn off production of MH class II receptors, disabling their antibody responses. MH class II receptor expression can also be turned off even at 13oC by stress and can remain off for up to and probably beyond 16 days. Conclusions In conclusion, while salmonids maintain the expression of MH class I receptors at low temperatures, they do turn MH class II receptor expression off, making them incapable of mounting antibody responses. This may reflect the fact that salmonids do face challenges form viral pathogens in the winter, but that bacterial pathogens are held in check by the cold temperatures. Salmonids kept at 13oC can also shut off the expression of these genes under some conditions that generate stress. We intend to examine temperature (and stress) dependent shut off of immune responses more closely. First, since 10 days is not really a long period of time and salmonids encounter months of winter we will do a long term low temperature study to see if expression of MH class II is restored at some point after the animals have been at 2oC for more than 10 days. Second, we will clone the promoters of the MH class II alpha and beta genes to see if we can pinpoint the region that controls the temperature dependent shut off. We will do this from several animals, ones that do shut the genes off and some, like 2oC fish 4 in Figure 2 that maintain some expression in order to see if there are genetic differences that might be exploited to improve broodstock selection. Hopefully understanding the mechanism of this shut off will
aid us in reversing it. We will also use immunostimulants to see if they can reverse the shut off of these genes. Finally we would like to do some disease challenges with animals kept at low temperatures as well as with animals infected in low temperatures and then brought up to 13oC to see if the shut off of these genes really does adversely affect their ability to fight off pathogens. If it does, hopefully we can find a way to reverse the shut off, either with immunostimulants or by selecting animals that do not shut these genes off like 2oC fish 4 in Figure 2 for use in broodstock development. We have also isolated two other genes encoding proteins that assist MH molecules in obtaining and presenting pathogenic peptides: calreticulin (12) and MH class II associated invariant chain (13). We are now investigating the role these molecules might play in temperature dependent regulation of MH gene expression. It is hoped that the results of this research can be used to aid the aquaculture industry in developed strategies to improve fish health and eliminate disease outbreaks. References 1. Stet, RJM. and Kruiswijk, CP. (2003). "Major
histocompatibility lineages and immune gene function in teleostean fishes: The road less taken." Critical Reviews in Immunology 23: 441-471.
2. Trowsdale, J. (1995). “"Both man and bird and beast": comparative organisation of MHC genes." Immunogenetics 41: 1-17.
3. Andersson, E. and Matsunaga, T. (1993). "Complete cDNA sequence of a rainbow trout IgM gene and evolution of vertebrate IgM constant domains." Immunogenetics 38: 243-250.
4. Partula, S. and De Guerra, A. (1995). "Structure and diversity of the t cell antigen receptor beta-chain in a teleost fish." Journal of Immunology 155(2): 699-706.
5. Secombes, CJ and Pilstrom, L. (2000). "Evolution of adaptive immunity." Biologist (London) 47(1): 44-8.
6. Shand, R. and Dixon, B. (2001). "Teleost Major Histocompatibility genes: Diverse but not complex." Modern Aspects of Immunobiology 2(2): 66-72.
7. Klein, J. (1986). Natural history of the major histocompatibility complex. New York, USA, John Wiley and Sons.
8. Bingulac-Popovic, J, and Figueroa, F. (1997). "Mapping of MHC class I and class II regions

Proceedings of the Canadian Freshwater Aquaculture Symposium – Aquaculture Canada 2004
130 AAC Spec. Publ. No. 11 (2006)
to different linkage groups in the zebrafish, Danio rerio. Immunogenetics 46: 129-134.
9. Rock, KL and Gamble, S. (1991). "Dissociation of beta 2-microglobulin leads to the accumulation of a substantial pool of inactive class I MHC heavy chains on the cell surface." Cell 65(4): 611-20.
10. Ljunggren, HG and Stam, NJ. (1990). "Empty MHC class I molecules come out in the cold." Nature 346(6283): 476-80.
11. Rodrigues, PN and Dixon, B. (1998). "Expression and temperature-dependent regulation of the beta2-microglobulin (Cyca-B2m) gene in a cold-blooded vertebrate, the
common carp (Cyprinus carpio L.)." Dev Immunol 5(4): 263-75.
12. Kales, SC, Fujiki, K, Dewitte-Orr, S, Bols, N and Dixon, B. (2004). “Molecular cloning and characterization of calreticulin from rainbow trout, (Onchorynchus mykiss)”. Immunogenetics 55(10): 717-723.
13. Fujiki, K and Smith, CM. (2003). "Alternate forms of MHC class II-associated invariant chain are not produced by alternative splicing in rainbow trout (Oncorhynchus mykiss) but are encoded by separate genes." Dev Comp Immunol 27(5): 377-91.

Proceedings of the Canadian Freshwater Aquaculture Symposium – Aquaculture Canada 2004
AAC Spec. Publ. No. 11 (2006) 131
Is Antibiotic Resistance in Freshwater Aquaculture a Problem? A Québec Perspective F. Carl Uhland Faculté Médecine Vétérinaire, Université de Montréal, 3200 rue Sicotte, St-Hyacinthe (Québec) J2S 7C6 Depuis 1997, la résistance des bactéries aux antibiotiques pour différentes épisoties bactériennes en aquaculture d’eau douce au Québec a été suivie par le laboratoire de bactériologie de la Faculté de médicine vétérinaire de l’université de Montréal. La résistance a déjà été constatée contre toutes les antibiotiques homologués au Canada incluant; oxytétracycline (Terramycin-Aqua), sulfadimethoxine-ormétoprim (Romet-30) et florfénicol (Aquaflor). La résistance varie avec la disponibilité des antibiotiques, ainsi que la manière dont ils sont utilisés. Étant donné le nombre limité de médicaments homologués pour l’aquaculture au Canada, il faut agir ensemble, les aquaculteurs, l’industrie, le gouvernement et les vétérinaires, pour assuré une utilisation appropriée des médicaments. Ce document présente un survol de l’expérience d’un vétérinaire face au développement de la résistance au Québec ainsi que les facteurs de risques qui semblent être le plus associés avec cette problématique. Resistance to antibiotics in bacteria isolated from freshwater aquaculture disease outbreaks in Québec has been followed by the Faculté de médecine vétérinaire since 1997. Resistance to all homologated antibiotics including oxytetracycline (Terramycin-Aqua), sulfadimethoxine-ormetoprim (Romet-30) and florfenicol (Aquaflor) has been discovered, either alone or in combinations. The variation in resistance patterns seems to depend on antibiotic availability and methods of utilisation of the antibiotics. Because the number of medications available to the aquaculture industry in Canada is limited, a concerted effort must be made by the industry players including fish farmers, pharmaceutical companies, governments and veterinarians, to ensure appropriate utilisation of medications. This short presentation will give a brief overview of one veterinarian’s experience, as well as discuss some of the risk factors which seem to be associated with antibiotic resistance development. Overview If it is possible to begin with the conclusion, the thrust of this article is that indeed antibiotic resistance IS a problem in freshwater aquaculture in Québec. Antibiotic resistance has become an increasing preoccupation among all animal-health care specialists, including those that work with the aquaculture industry. The challenge of maintaining healthy fish stocks and mounting economic losses associated with antimicrobial resistance are among the primary concerns of both veterinarians and producers. Only four antibiotics are homologated for usage in aquatic species in Canada, including; florfenicol (Aquaflor™), oxytetracycline (Terramycin-Aqua™), sulfadimethoxine/ormetoprim (Romet-30™), and sulfadiazine/trimethoprim (Tribrissen™). The activity of Romet-30 and Tribrissen are similar, so in actuality producers and veterinarians are left with 3 families of antibiotics to combat epidemics on fish farms. Resistance to one or two antibiotics
leads to reliance on the remaining compound, which hastens resistance development. Costs associated with medications, which at times requires prolonged administration in cases of reduced susceptibility, as well as those associated with the manpower needed for medication of the stocks, picking the mortalities etc. can strain the fish farms resources. Those producers that are faced with triple resistant strains of bacteria are condemned to watch their livelihood being shipped to the rendering plant, or to the compost pile. Antimicrobial resistance surveillance systems are already in place for bovine, porcine, and aviary productions in Canada (CIPARS, 2002; http://www.phac-aspc.gc.ca/cipars-picra/pdf/cipars-picra-2002_e.pdf). The aquaculture industry will likely eventually be put to task, including the industry in Québec. The close association of freshwater aquaculture operations with the environment and minimal waste treatment make watershed contamination a concern. Concerns of impacts on human health, from chemical or antimicrobial residues in fish and possible transmission of genetic resistance elements between fish pathogens and human

Proceedings of the Canadian Freshwater Aquaculture Symposium – Aquaculture Canada 2004
132 AAC Spec. Publ. No. 11 (2006)
pathogens or commensals, as well as the presence of these genetic resistance elements in zoonotic bacteria are receiving increasing attention. Figure 1 demonstrates the trends of resistance development from 1998 to the present among submissions to the Université de Montréal. The entry of Aquaflor onto the Canadian scene in the fall of 1997 has been indicated by an arrow on the X axis. The presence of single and multiple resistance (Romet-30 and Terramycin-Aqua) has been present at similar levels for the years covered in this graph. These products have been utilised for a number of years in the Québec aquaculture industry. Additionally, until 2003, tetracycline was available as a medicated feed without a veterinary prescription. A notable change comes in the year 2002 and 2003, where we see resistance to florfenicol for the 1st time in the province. It is generally accompanied by resistance to one or both of the other classes of antimicrobials. This stands to reason, as often the producers use florfenicol when the other antibiotics are no longer effective.
Figure 1: Trends in Resistance; 1998 - 2004 Legend: OTC, oxytetracycline; SOR, ormetoprim-sulfadimethoxine; FLOR, florfenicol; F-S-O, florfenicol, ometoprim-sulfa, and oxytetracycline Note: the numbers in parentheses indicate the number of sensitivity tests carried out for the given year. The development of resistance depends on several factors. Among the most important are: repetitive treatments with one antibiotic, no antimicrobial rotation and inadequate utilisation of antimicrobials. Repetitive treatments are common in fish farms where disease control is middling. Chronic tank surcharge, elevated temperatures because of
inadequate water flow, and inadequate housekeeping causing high dissolved solids are all aspects of production which may cause a recrudescence of disease. In these conditions, a treatment will typically control a disease outbreak for 3 – 4 weeks, with a subsequent increase in mortality. This necessitates another treatment with medicated feed. The utilisation of one drug class for several years consecutively increases the risk for the development of antimicrobial resistance. In those fish farms where the resident pathogen is sensitive to more than one antibiotic, it is advisable to utilise an antibiotic rotation to help avoid resistance problems. The recommendations which accompany a veterinary prescription include specifications on the dosage of antibiotics as well as duration of treatments. Because of the costs involved in antibiotic treatments, there is a temptation to treat at lower dosages, or to stop the treatment prematurely. Subtherapeutic treatments and incompletion of treatment regimens are both excellent ways to select resistant bacteria! The repeated occurrence of bacterial disease epidemics on a fish farm, though not directly related to antimicrobial resistance, contributes greatly to its development as it reinforces the usage of antimicrobials. Several factors characteristic to the aquaculture industry in Québec contribute to the endemic nature of the disease. The industry here centers primarily on two species, Oncorhyncus mykiss, rainbow trout, and Salvelinus fontinalis, speckled trout. Of the two, speckled trout are by far the most susceptible to bacterial infections, and as such, receive the majority of antimicrobial treatments. The detection of resistant bacteria is almost exclusively associated with this species, and the bacterium responsible for the majority of these infections is Aeromonas salmonicida, the agent responsible for the disease furunculosis. In other types of aquaculture production, such as with Atlantic salmon, the development of vaccination programs has decreased drastically the impact of furunculosis. The production cycle associated with speckled trout is a characteristic, which makes this approach difficult. The speckled trout is spawned in the months of October and November, with hatching and swim-up occurring generally in the month of January. The fish are kept in the hatchery until the months of May or June, whereupon, the stock is moved into grow-out facilities, often grow-out ponds, at a size of 5 –
0
1
2
3
4
5
6
98-99 99-00 00-01 01-02 02-03 03-04
Year ( ex. March 1998 to March 1999)
Abs
olut
e N
umbe
r of
Cas
es
OTCSORSOR-OTCFLOR-OTCFLOR-SORF-S-O
(39) (18)
(9)
(13)
(22)
(19)
FLOR

Proceedings of the Canadian Freshwater Aquaculture Symposium – Aquaculture Canada 2004
AAC Spec. Publ. No. 11 (2006) 133
10 grams. Bath vaccination is not effective in the author’s experience, and the small size creates problems with vaccination by injection. The protection or vaccination of the fish in the hatchery before they are stocked into ponds or “open” systems is, therefore, not possible. The fish stocks are generally contaminated, or infected, when moved in close proximity to infected fish from the previous year class. The recourse for disease control that remains for these producers is administration of antibiotics. In addition to the inherent problems of the speckled trout production cycle, which propagates furunculosis and necessitates the recurrent utilisation of antimicrobials, numerous other factors complicate the picture. The acquisition of medication outside of the veterinary/client relationship does occur in Québec, though it is not a widespread practice. The omnipresence of the internet, the availability of certain medications in neighbouring provinces or countries, and even the exchange of medications between growers are all possibilities for antibiotic sourcing. In Québec, antibiotics are only legally available to a producer when prescribed by a veterinarian. In addition, to prescribe an antibiotic, there must be an active client/veterinary relationship, which includes site visits, knowledge of fish stocks, farm organization, and appropriate diagnostic testing in the case of disease outbreaks. Following an evaluation of all of these elements, the veterinarian can then make appropriate recommendations for treatment and control. Although a fish producer with years of experience may indeed be capable of slowing an epidemic with a drug in hand, the training and capacity to estimate the risk/benefits of particular treatments is not necessarily present. Conversely, the producers are faced with a paucity of veterinarians with a knowledge base in aquaculture solid enough to make appropriate recommendations. Disease control measures in many fish farms are inadequate. The absence of foot-baths, net disinfection between manipulation of different groups of fish, absence of handwashing stations, inadequate predator control and poor staff training are among the important factors. In addition to these, overstocking of ponds or tanks, mixing of different groups of fish, and exchange of infected stocks between producers also make disease control challenging. It must be kept in mind however, that limitations in space for stock transfers within the farm, prevailing market conditions, and lack of financial resources are
often out of the control of the producer, and the best must be made of a difficult situation. A current practice which is perhaps responsible for the largest percentage of the recent rapid expansion of multi-resistant strains of Aeromonas salmonicida is the exchange of infected fish stocks or “healthy carriers”. When a fish farmer is unable to fill orders, and wishes to preserve his clientele, he will often procure fish from another source. There is not necessarily an exchange of vital health status information between producers, and often the lowest priced options are the most attractive. Unfortunately, a surprise may await those who function in this fashion, in the way of an importation of fish stocks that are carriers of infectious disease. How can the problem be minimized? It must begin with conscientious implication of both veterinarians and producers. The veterinarian must be available, and sufficiently knowledgeable to provide appropriate recommendations to fish farmer clients. Providing the appropriate quantities of medications along with clearly indicated dosages and withdrawal times is vital. Initiating a drug rotation where possible is also advantageous. Making concurrent recommendations concerning on farm health management is also key to successful long-term disease control. The installation of footbaths, and hand washing stations, and initiating net disinfection procedures are just a few examples. In return, producers must use medications as instructed as it pertains to dosages and duration of treatment. In the measure of possibility, serious consideration must be given to on farm health-management changes. Purchase of fish stock from certified disease free sources is an ideal which at this time is difficult to attain. A letter written by a grower’s veterinarian concerning the fish farms recent health history may be a viable alternative. The development of surveillance programs may help producers cope with developing resistance problems. Spotting problems before they become critical is always preferred to being stuck between a rock and a hard place. Quality assurance programs would help improve proper record keeping and help in the appropriate utilisation of all chemical products and not just antimicrobials. It would equally facilitate the interaction between fish health professionals and producers.

Proceedings of the Canadian Freshwater Aquaculture Symposium – Aquaculture Canada 2004
134 AAC Spec. Publ. No. 11 (2006)
Use of Hybrid Membrane Filtration Technology Combined with Chemical Precipitation to Control Phosphorus Release from Recirculation Aquaculture Systems Ling Yanga, Hongde Zhoua and Rich Mocciab
aSchool of Engineering, University of Guelph, Guelph, Ontario N1G 2W1 bDepartment of Animal and Poultry Science, University of Guelph, Guelph, Ontario N1G 2W1 The improvement of membrane filtration coupled with chemical precipitation as a pre-treatment step to treat the wastewater from recirculating aquaculture systems (RAS) was evaluated. Chemical precipitation tests were conducted by varying chemical doses and pH values for magnesium chloride and alum respectively. Crossflow, flat sheet membrane filtration modules were used to examine the effects of transmembrane pressure and crossflow velocity in terms of solid/liquid separation efficiency and permeate flux decline. Emphasis was placed on phosphorous removal in order to meet strict regulatory discharge requirements. The results showed that the membrane filtration can effectively separate the phosphorous precipitates after pre-treated with either magnesium chloride or alum for RAS wastewater. The total phosphorous in the treated effluent was reduced to less than 0.05 mg/L with a removal efficiency of more than 90%. Further, chemical precipitation can greatly enhance the permeate flux for subsequent membrane filtration. However, its improvement to remove TOC, turbidity and total nitrogen was less substantial. Introduction The development and refinement of recirculating aquaculture systems (RAS) has continued for more than thirty years in the aquaculture industry because it provides a highly efficient technology to raise fish in tanks in a well-controlled, secured environment such as an enclosed building(1). However, high fish density in limited aquatic space and repeatedly recirculating water within the system pose the challenges with the increased concentrations of various contaminants including suspended solids (SS), nitrogen, phosphorus and pathogens in the effluents. Among them, phosphorous has been often considered to be more critical to the receiving water body because it could cause excessive rapid growth of algae and other macrophytes (2,3). Algae blooms could lead to reducing water visibility, generating undesirable nuisance condition, depleting dissolved oxygen (DO) and increasing fish and other aquatic life mortalities. In Ontario, new RAS facilities must be designed with the objective to achieve total phosphorus less than 0.05mg/L in the final effluent. If the background levels in a surface water supply exceed 0.05mg/L, the design criterion is that total phosphorus cannot exceed the background concentration (4). Similar regulatory requirements have been reported by other
provinces and United States (5,6,7). Hence, effective water treatment to maintain high water quality required for fish production while meeting the requirements of environmental protection becomes critical for the future growth of aquaculture industry. In fact, various water treatment processes have been proposed to treat the water from recirculating aquaculture systems. Among them are biofilters to separate suspended solids and encourage the growth of biofilms for nitrification (8, 9, 10), gravity sedimentation (11, 12) and dissolved air flotation (13) to remove large suspended solids, and ozone and UV processes to removal pathogenic microganisms (14, 15). However, the removal of phosphorous from RAS effluents are much more challenging because it is usually present in soluble forms and stable to oxidation. Controlling phosphorus content in fish feed has been used to decrease its concentration in the effluent but not to the level that would be satisfactory to discharge regulatory requirements while guaranteeing fish growth and health. Wetlands have been reported to reduce phosphorus concentration to below 0.05mg/L but careful management must be undertaken (16). The requirement of large area and/or an expensive greenhouse in cold regions make it less effective and very costly in practice.

Proceedings of the Canadian Freshwater Aquaculture Symposium – Aquaculture Canada 2004
AAC Spec. Publ. No. 11 (2006) 135
Low pressure membrane technologies have been successfully used in municipal water treatment to remove suspended solids, colloidal matter and microorganisms within a single step because of high solid/liquid separation efficiency
(17). When coupled with chemical precipitation, they also have potential to remove various soluble contaminants. This is particularly true for phosphorous because it can react with many metal ions to form very low solubility precipitates. Among them is alum because of its great availability, low cost and proven efficiency. Recently, magnesium chloride hexahydrate has been proposed to precipitate phosphorus and ammonia simultaneously by forming extremely low soluble struvite (MgNH4PO4·6H2O) which can be used as a slow releasing agricultural fertilizer. In 2002 it was reported that up to 97% phosphorus can be precipitated as struvite from municipal wastewater (18). Thus, the objective of this study is to examine the improvement of membrane filtration coupled with chemical precipitation as a pre-treatment step to treat RAS wastewater, with emphasis on phosphorous removal. Materials and Methods Wastewater samples were obtained from Alma Aquaculture Research Station, University of Guelph. Alma Station is a cold water RAS, raising Atlantic salmon, Arctic char and new strains of spring-spawning rainbow trout. It has 3 isolation systems, each consisting of twelve 3’Φ x 2’ circular fibreglass rearing tanks with a rearing volume of 340 litres allowing for a maximum biomass of 360 kg. It produces four waste streams: overflow from the culture tanks, tank-washing wastewater, wastewater from the drum filter and wastewater from the foam fractionator. Each of these streams were sampled separately and then mixed according to their volume ratios as shown in Table 1. The mixed samples were immediately stored in a constant-temperature refrigerant at 4ºC without any chemical pre-treatment. Table 1: Volume ratio of four waste streams from Alma RAS system. WasteWater Volume Ratio Culture tank overflow 130 Tank-washing wastewater
6.5
Drum filter wastewater 5.5 Foam fractionator wastewater
1
Both MgCl2 and alum were selected because of their proven performance to remove phosphorous from municipal wastewater. The basic chemical reactions are (19, 20):
↓⋅⇔
++++ −−++
OHPOMgNH
OHOHHPONHMg
244
2244
2
6
5
12105.2 −= xK
(1)
+−+ +↓⇔+ nHAlPOPOHAl nn 4
34
3
20103.1 −= xK
(2)
However, many competing reactions would occur because of the complicated hydrolysis of multi-valence metal ions and the interference from aqueous organic materials. The stoichiometric relationships from the above reactions become unable to estimate the chemical dosage. As a result, the chemical precipitation tests were carried out using standard jar testing apparatus. It is equipped with six flat paddle stirrers to provide the mixing for six 2L square jars separately. Immediately after adding the chemical solutions at preset doses, wastewater was mixed at 250 rpm for 1 minute to rapidly disperse the chemical solution uniformly, followed by a slow mixing at 30 rpm for 30 minutes to allow the precipitation to complete. The treated wastewater sample was then settled in quiescent condition for 30 minutes. In order to determine the effects of key factors on process performance, a series of precipitation tests were conducted by varying pH value and chemical dosage ratio. During the test, pH was controlled by adding dropwise either 10N NaOH or 25% v/v HCl solution. The membrane filtration tests were conducted using three parallel flat sheet, cross-flow membrane modules equipped with a data acquisition system to obtain real-time permeate flux (see Figure 1). The test membrane was made of hydrophilic cellulose acetate with a nominal pore size of 0.22 µm (Model # A02SP00010, GE Osmonics). Each of the membrane modules consists of a flat membrane filtration cell with 120 mm x 50 mm x 1.727 mm. A variable speed gear pump was used to pump the influent from a feed tank pumped into the bottom of the module. It flowed horizontally along the cell so that potential due to gravity

Proceedings of the Canadian Freshwater Aquaculture Symposium – Aquaculture Canada 2004
136 AAC Spec. Publ. No. 11 (2006)
Table 2: Water characteristics of the mixed wastewater.
Parameter Method Mean ± standard deviation Range
pH 4500-H+ 7.57 ± 0.12 7.41 - 7.75 Total solid (TS), mg/L 2540B 372.8 ± 0.1 292.0 - 477.0 Volatile solid (VS), mg/L 2540E 166.5 ± 0.1 108.0 - 205.5 Turbidity, NTU 2130 7.8 ± 2.1 4.5 - 10.0 Total nitrogen (TN), mg/L 4500-N 8.0 ± 0.6 7.4 - 8.7 Ammonia nitrogen (NH3-N), mg/L 4500 - NH3 0.6 ± 0.2 0.4 - 0.8 Nitrite nitrogen (NO2
--N), mg/L 4500 - NO2- 0.45 ± 0.09 0.31 – 0.56
Nitrate nitrogen (NO3--N), mg/L 4500 - NO3
- 6.5 ± 0.5 5.8 - 7.2 Total phosphorus (TP), mg/L 4500 - P 1.28 ± 0.39 0.50 - 1.77 Ortho-phosphorus (Ortho-P), mg/L 4500 - P 0.55 ± 0.22 0.28 - 1.03 Total organic carbon (TOC), mg/L 5220 12.8 ± 2.41 10.2 - 15.3 Chemical oxygen demand (COD), mg/L 5210B 61 ± 32 32 - 108 Alkalinity, mg/L @ CaCO3 2320B 202 ± 2 200 - 206
sedimentation can be minimized. The permeate was collected from the top of the module into a beaker placed on the top of an electronic balance which was connected a computer to automatically record the permeate flux. The concentrate was recycled back to the feed tank. During testing, the wastewater temperature in the feed tank was controlled using an immersed stainless-steel coil connected to a refrigerated recirculating chiller. The different transmembrane pressure and influent flux were obtained by adjusting the pressure valve and flow rotameter.
Figure 1: Schematic of membrane filtration apparatus. All the water quality parameters including pH, suspended solids (SS), turbidity, total nitrogen (TN), ammonia-nitrogen (NH3-N), nitrite-nitrogen (NO2
--N), nitrate-nitrogen (NO3--N), total
phosphorus (TP), Ortho-phosphorus (Ortho-P), total organic carbon (TOC), chemical oxygen demand (COD), alkalinity and temperature were measured according to Standard Methods (21) . Briefly, TOC and TN were analyzed using a TOC analyzer (Model 5000A, Schimadzu) equipped with a total nitrogen detection module. TP was measured using ascorbic acid method
with a UV/visible spectrophotometer (Model 8453, Agilent Technologies). COD was analyzed using potassium dichromate as the oxidant in sulphuric acid with silver ions as the catalyst. All the chemicals used for analyses and phosphorous precipitation are at least of analytical grade. Table 2 summarizes the main characteristics of the mixed wastewater. Results and Discussion For comparison, three types of experiments were conducted including chemical precipitation, membrane filtration and membrane filtration with chemical precipitation as a pre-treatment. The performance was compared in terms of contaminant removal and permeate flux. Chemical Precipitation Figure 2 shows the concentrations of TP in the effluent treated with MgCl2 as a precipitant at different pH values and molar dose ratios. In consistency with the principles of chemical equilibrium, effluent TP decreased as the Mg/P molar ratio was increased. When the Mg/P molar ratio became greater than 1.3, however, little improvement in TP removal was observed. One possible explanation is that such excessive Mg2+ doses resulted in the occurrence of competitive reactions with other anions such as OH- and CO3
2-, thereby, limiting the availability of Mg2+ to form struvite precipitates with NH+ and PO4
3-. Consequently, only a slightly greater amount of magnesium than the stoichiometric molar ratio is required to precipitate phosphorous from water.
ComputerElectronic balance
Membrane modules
Pump
Feed tank
Cooling system
P
Influent F
Permeate
Recycling flow
Valve

Proceedings of the Canadian Freshwater Aquaculture Symposium – Aquaculture Canada 2004
AAC Spec. Publ. No. 11 (2006) 137
As well, the completion of struvite precipitation strongly depends on pH values. More phosphorous was precipitated out as pH increased. Effluent TP less than 0.05 mg/L was only obtained when pH was at 11.8 or higher. Again, this can be explained by the chemical equilibrium of struvite as indicated by Eq. 1. As pH increases, the precipitation reaction will be shifted toward the right side, thereby, facilitating the completion of struvite formation. It also conforms to the computed results of Doyle and Parsons (22) that struvite solubility decreases with pH increasing. When pH value was increased to 10.9 or higher, the flocculation apparently occurred. At such high pH, the precipitated struvite would become charged negatively, thereby acting as a coagulant to form larger aggregates (23). In all, chemical precipitation with MgCl2 can effectively precipitate the phosphorous from RAS wastewater even though it had little effect on TN removal (see Table 3). TOC was reduced by 40%. However, effluent TP less than 0.05 mg/L was achievable when pH was at 11.8 or higher with Mg/P molar ratio from 1.3 to 3.3. Similarly, Figure 3 shows the concentrations of TP with alum as a precipitant at different pH values and Al/P molar ratios. Like MgCl2, the higher alum doses resulted in a decrease in TP concentrations in the treated effluents. This trend was levelled off when the Al/P molar ratio became higher than 2.7. Again, this is because the excessive amount of Al3+ added reacted with other anions such as OH-, limiting its availability for the precipitation with PO4
3-.
0.00
0.10
0.20
0.30
0.40
0.50
0 1 2 3 4 5 6
Mg/P molar ratio
TP, m
g/L
pH=7.5pH=8.2pH=9.8pH=10.9pH=11.8
(a)
0.00
0.10
0.20
0.30
0.40
0.50
7 8 9 10 11 12 13 14pH
TP, m
g/L
Mg/P=1.0Mg/P=1.3Mg/P=1.6Mg/P=2.0Mg/P=2.7Mg/P=3.3
(b) Figure 2: Total phosphorous in the effluents after precipitated with MaCl2. Unlike MgCl2, alum was found to be the most effective for phosphorous precipitation at pH around 6. As low as 0.07 mg/L TP was obtained with Al/P molar ratios of 2.7:1 or higher. When pH was reduced to 4.6, however, little removal of phosphorous was observed. This is because at such low pH value, the phosphorus is mainly present in the form of HPO4
2- or H2PO4-, thus, becomes unavailable for chemical precipitation with alum. Similar results were predicted by Stumm and Morgan (24). Based on the principles of chemical equilibrium, they concluded that AIPO4 should have the lowest conditional solubility product at a pH value of about 6.

Proceedings of the Canadian Freshwater Aquaculture Symposium – Aquaculture Canada 2004
138 AAC Spec. Publ. No. 11 (2006)
0.00
0.10
0.20
0.30
0.40
0.50
0 1 2 3 4 5 6 7
Al/P molar ratio
TP, m
g/L
pH=4.6pH=6.1pH=6.7pH=7.4pH=8.5
(a)
0.00
0.10
0.20
0.30
0.40
0.50
4 5 6 7 8 9 10
pH
TP, m
g/L
Al/P=0.9Al/P=1.3Al/P=1.8Al/P=2.7Al/P=4.5
(b) Figure 3: Total phosphorous in the effluents after precipitated with alum. Membrane Filtration without Chemical Precipitation Figure 4 shows a typical plot of the relative permeate flux curves with time at different transmembrane pressures and crossflow velocities when the raw RAS wastewater was treated by membrane filtration. The relative permeate flux was calculated as the ratio of permeate flux at time to that at the beginning under the same operating conditions. As shown, the relative permeate fluxes initially decreased rapidly, and then gradually approached an asymptotical value over time. This can be attributed to the occurrence of membrane fouling due to the concentration polarization and particle deposition on the
membrane surface and inside the membrane pores. The accumulated particles and other fouling materials are transported back because of Brownian movement and surface shear caused by high flow velocity. The thicker the layer of particles accumulated is, the more particles can be sheared off from the membrane surface. As a result, a relatively stable permeate flux can be observed after a period of filtration. Both crossflow velocity and transmembrane pressure have been identified as two main factors affecting permeate flux in membrane filtration. It is commonly accepted that higher crossflow velocity increased the relative permeate flux by increasing the hydrodynamic shear force, thereby, scouring the deposited particle away from the membrane surface. In this study, the higher crossflow velocity only resulted in a slightly higher relative permeate flux, even though the absolute permeate flux under the higher cross-flow velocity is much greater than those under the lower cross-flow velocity. One possible explanation is that the particles in RAS wastewater samples are very small; and consequently, are minimally affected by the shear-induced back transport. Likewise, the relative permeate flux declined more rapidly under higher transmembrane pressure than those under lower transmembrane pressure. This is because higher transmembrane pressure would facilitate the accumulation and subsequent compaction of particles on the membrane, resulting in more rapid increase in membrane filtration resistance. Again, it should be noted that the absolute permeate flux was much higher under the higher transmembrane pressure than those under the lower transmembrane pressure. The contaminant removal efficiencies with membrane filtration are summarized in Table 4. In general, membrane filtration was only able to reduce the TP concentrations around 0.2 mg/L, whatever the different transmembrane pressure and cross-flow velocity. As expected, membrane filtration had little impact on TN, indicating that only a physical separation of solids from water occurred.

Proceedings of the Canadian Freshwater Aquaculture Symposium – Aquaculture Canada 2004
AAC Spec. Publ. No. 11 (2006) 139
0.00
0.20
0.40
0.60
0.80
1.00
0 15 30 45 60 75 90Time, minute
Rel
ativ
e P
erm
eate
Flu
x (J
/J0)
0.46m/s, 50kPa0.46m/s, 75kPa0.46m/s, 150kPa
(a)
0.00
0.20
0.40
0.60
0.80
1.00
0 15 30 45 60 75 90Time, minute
Rel
ativ
e P
erm
eate
Flu
x (J
/J0)
0.62m/s, 50kPa0.62m/s, 75kPa0.62m/s, 150KPa
(b) Figure 4: Effect of transmembrane pressure and cross-flow velocity on relative permeate flux. Membrane Filtration with Chemical Precipitation as a Pre-Treatment Step RAS wastewater was pre-treated with chemical precipitation to examine any improvement for subsequent membrane filtration. Mg/P molar ratio of 2.0 and pH 11.8 for MgCl2, while an Al/P molar ratio 2.7 and pH 6.1 for alum were selected to represent the optimal precipitation conditions. For comparison, additional experiments were conducted to settle the pre-treated wastewater for 30 minutes prior to membrane filtration. In all these tests, membrane filtration was carried out at a constant transmembrane pressure of 75 kPa and a cross-flow velocity of 0.62 m/s as they had been shown to have little effects on process performance for the raw RAS wastewater.
Table 2 summarizes the relative permeate flux with different types of pre-treatment for both MgCl2 and alum. Even though the decline in relative permeate flux over time was similar in all cases, the steady-state permeate flux varied greatly. The steady-state permeate flux was defined to be the permeate flux after 30 minutes of filtration. As shown, both MgCl2 and alum pre-treatment greatly enhanced the steady-state relative permeate flux, suggesting that they can greatly reduce membrane fouling. One reason is that newly formed particles from chemical precipitation usually could have different surface characteristics from those present in raw RAS wastewater, thereby, reducing their attachment efficiency on the membrane surface. Also, chemical precipitation can increase the size of particles in water, thereby, becoming easier to be scoured away by flow turbulence-induced shear from the membrane surface. Comparing the steady-state permeate fluxes obtained from Tests 7 to 10, pre-settling for 30 minutes prior to membrane filtration had much higher relative permeate flux for alum, but had lesser effects for MgCl2, indicating the occurrence of different fouling mechanisms. It should be pointed out that the absolute steady-sate permeate fluxes in all the cases are larger than 100 L/m2/hr, which is substantially larger than those (~20 L/m2/hr) typically suggested for municipal wastewater treatment. This is because RAS wastewater usually contains much less impurities. Thus, it can be concluded that the fouling problem would be much less serious when membrane filtration is used for RAS wastewater as compared to municipal wastewater. The contaminant removal efficiencies with membrane filtration after different types of pre-treatment are also summarized in Table 4. When the RAS wastewater was pre-treated with both MgCl2 and alum, subsequent membrane filtration consistently reduced the TP concentration in the effluent, indicating complete phosphorous precipitation and efficient solid/liquid separation by membrane filtration. As well, membrane filtration can increase the turbidity removal efficiency from 86% to more than 98%. But its effectiveness to remove TN was very limited due to the soluble nature of various nitrogen forms in water.

Proceedings of the Canadian Freshwater Aquaculture Symposium – Aquaculture Canada 2004
140 AAC Spec. Publ. No. 11 (2006)
Table 3: Steady-state permeate flux after different pre-treatment processes.
Membrane filtration Pre-treatment Tests v, m/s TMP, kPa Chemical pH Molar ratio Settling
Permeate flux J/J0
1 0.46 50 --- --- --- --- 0.11 2 0.46 75 --- --- --- --- 0.12 3 0.46 150 --- --- --- --- 0.10 4 0.62 50 --- --- --- --- 0.11 5 0.62 75 --- --- --- --- 0.08 6 0.62 150 --- --- --- --- 0.08 7 0.62 75 MgCl2 11.8 2.0 --- 0.22 8 0.62 75 MgCl2 11.8 2.0 30 min 0.27 9 0.62 75 alum 6.1 2.7 --- 0.28 10 0.62 75 alum 6.1 2.7 30 min 0.58
Table 4: Comparison of main water characteristics after different treatment processes. Parameter MgCl2
pH=11.8 Molar ratio=2.0
Alum pH=6.1 Molar ratio=2.7
MF TMP=75kPa v=0.62m/s
MF+ MgCl2 TMP=75kPa v=0.62m/s
MF+ Alum TMP=75kPa v=0.62m/s
TP, mg/L 0.01 0.07 0.20 0.05 0.05 Turbidity, NTU 24.1 4.29 0.21 0.03 0.02 TOC, mg/L 6.1 3.7 8.3 4.9 4.9 TN, mg/L 7.7 6.8 7.5 8.5 7.6
Conclusions RAS wastewater was treated by chemical precipitation, membrane filtration and their combination to examine any improvement in terms of contaminant removal and permeate flux. The following conclusions can be drawn: • Proposed membrane filtration with chemical
precipitation as pre-treatment can consistently reduce effluent TP concentration below 0.05mg/L. Its removal efficiency for turbidity and TOC were 98% and 30%, respectively.
• The optimum conditions for phosphorous precipitation were found to be pH 11.8 and molar ratio 2.0 for MgCl2 and pH 6.1 and molar ratio 2.7 for alum.
• Chemical precipitation can greatly enhance the permeate flux for subsequent membrane filtration.
• Permeate flux was only slightly affected by transmembrane pressure and cross-flow velocity under the range of operating conditions examined in this study.
• Steady-state permeate flux was greater than 100 L/m2/hr for RAS wastewater pre-treated with chemical precipitation, indicating much lower membrane fouling potential as compared to municipal wastewater.
Acknowledgements This work was supported by the NSERC PGS Master Scholarship and Ontario Ministry of Agriculture and Food-University of Guelph Research Program. The authors are grateful to the staff at Alma research station of the University of Guelph for their assistance in wastewater sampling and providing the station operating data. References 1. Timmons, M. B., Ebeling, J. M., Wheaton, F.
W., Summerfelt, S. T., and Vinci, B. J. 2002. Recirculating Aquaculture Systems. Ithaca. NY: Cayuga Aqua Ventures.
2. Sauthier, N., Grasmick, A., and Blancheton, J.P. 1998. Biological denitrification applied to a marine closed aquaculture system. Water Research. 32(6): 1932–1938.
3. Stickney, R.R. 1994. Principles of Aquaculture. Wiley, New York.
4. GO. Government of Ontario. 1990. The Environmental Protection Act. Queens Print for Ontario. pp 96.
5. Ministere de l"Environnement du Québec. 1993. Critères de qualité de l'eau. Service d'evalustion des rejets toxiques et direction

Proceedings of the Canadian Freshwater Aquaculture Symposium – Aquaculture Canada 2004
AAC Spec. Publ. No. 11 (2006) 141
de la qualite des cours d'eau. Ministere de l"Environnement du Québec. Québec.
6. National Guidelines and Standards Office. Water Policy and Coordination Directorate. 2004. Canadian guidance framework for the management of phosphorus in freshwater systems: Report No. 1-8. Environment Canada. Ottawa.
7. USEPA. The United States Environmental Protection Agency. 1986.
8. Abeysinghe,D. H., Shanableh A., and Rigden.B. 1996. Biofilters for water reuse in aquaculture. Water Science and Technology. 34(11): 253–260.
9. Greiner, A. D., and Timmons, N. B. 1998. Evaluation of the nitrification rates of microbead and trickling filters in an intensive recirculating tilapia production facility. Aquacultural Engineering. pp.189–200.
10. Malone, Ronald F., and Beecher, Lance E. 2000. Use of floating bead filters to recondition recirculating waters in warmwater aquaculture production systems. Aquacultural Engineering. 22(1-2): 57-73.
11. Lekang, O. I., Bergheim, A., and Dalen, H. 2000. An integrated wastewater treatment system for land-based fish-farming. Aquacultural Engineering. 22(3): 199-211.
12. Otte, G., and Rosenthal H. 1979. Management of closed brackish-water system for high density fish culture by biological and chemical water treatment. Aquaculture. 18: 169-181.
13. Jokela, P., Ihalainen, E., Heinanen, J., and Viitasaari, M. 2001. Dissolved air flotation treatment of concentrated fish farming wastewaters. Water Science and Technology. 43(8): 115-121.
14. Krumins, V., Ebeling, J.M. and Wheaton, F.W. 2001. Ozone's effects on power-law particle size distribution in recirculating aquaculture systems. Aquacultural Engineering. 25(1): 13-24.
15. Zhou, H., and Smith, D. W. 2001. Advanced treatment technologies in water and
wastewater treatment. Canadian Journal of Civil Engineering. 28(S1), 49-66.
16. Adler, P.R., Summerfelt, S.T., Glenn, D.M., and Takeda, F. 1996. Evaluation of a wetland system designed to meet stringent phosphorus discharge requirements. Water Environment Research. 68: 836-840.
17. Brindle, K, and Stephenson, T. 1996. The application of membrane biological reactors for the treatment of wastewaters. Biotechnology and Bioengineering. 49: 601 - 610.
18. Jaffer, Y., Clark, T.A., Pearce, P., and Parsons, S.A. 2002. Potential phosphorus recovery by struvite formation. Water Research. 36 (7): 1834-1842.
19. Metcalf and Eddy. 2003. Wastewater Engineering Treatment and Reuse. 4th edition. McGraw Hill, Inc., New York. NY.
20. Yoshino, M., Yao, M., Tsuno, H., and Somiya, I. 2003. Removal and recovery of phosphate and ammonium as struvite from supernatant in anaerobic digestion. Water Science and Technology. 48(1): 171–178.
21. American Public Health Association. American Water Works Association. Water Environment Federation. Standard Methods for the Examination of Water and Wastewater. 1995. New York: American Public Health Association.
22. Doyle, James D., and Parsons, Simon A. 2002. Struvite formation, control and recovery. Water Research, 36(16): pp 3925-3940.
23. Kofina, A., and Koutsoukos, P. 2003. Nucleation and crystal growth of struvite in aqueous media. New perspectives in phosphorus recovery. WASIC Conference (Workshop on Advance in Sensoring in Industrial Crystallization). Istanbul, Turkey.
24. Stumm, W., and Morgan, J. J. 1996. Aquatic Chemistry: Chemical Equilibria and Rates in Natural Waters. 3rd edition. pp407.

Proceedings of the Canadian Freshwater Aquaculture Symposium – Aquaculture Canada 2004
142 AAC Spec. Publ. No. 11 (2006)
Aquaculture Development in Alberta Eric Hutchings Alberta Agriculture, Food and Rural Development, Diversified Livestock Branch Economically and environmentally sustainable growth of the inland freshwater aquaculture industry in a prairie province has proven to be a rather gradual but exciting enterprise. Following is a brief overview of Alberta’s aquaculture history, markets, research, development and environmental initiatives as related to fish farming. The intent of this paper is to introduce Aquaculture Association of Canada participants to Alberta’s current aquaculture production status and provide brief insight into licencing, management and environmental issues. Effluent management and aquaponics will be discussed. History of Aquaculture Development in Alberta Aquaculture, as an industry in Alberta, is relatively new to the scene. Although documentation can be found of government involvement in fish culture starting from the early 20th century, (stocking fish in federal parks) it was not until the mid 1960's that private sector commercial aquaculture had its commencement. During those early formative years, only a small number of fish farmers produced fingerlings to stock farm dugouts and ponds. Licencing and management of aquaculture was a provincial responsibility at that time and for the next thirty years administered through the Fisheries Branch. In 1990, commercial aquaculturists determined a need for an organization to help develop and represent their industry views; incorporating the Alberta Fish Farmers Association. In the spring of 1997, Alberta Agriculture, Food and Rural Development (AAFRD) assumed full responsibility for aquaculture. Fish farmers had been pushing this change for many years. AAFRD was now accountable for administering the licences and developing the industry through marketing, research and technology transfer. To help develop the aquaculture industry in the Province, AAFRD organized the “Aquaculture Section” under its Livestock Development Division, currently employing five people in aquaculture licencing, research and extension. Of the five employees, one is a research biologist who manages risk assessments, technology transfer, disease surveillance, water quality and special projects. Another person has duties as an extension specialist, involved with training, newsletters, fact sheets, marketing,
product development, information networking, and feasibility studies. The third person is a licencing supervisor, who coordinates aquaculture licencing, legislation and inspections for the entire Province. Two additional staff are necessary to support administration, licencing and research projects. This group is also responsible for managing triploid verification of grass carp (sterility). Various training courses are held each year; some scheduled for novices interested in fish culture, while others help existing aquaculturists. Other ways that AAFRD provides information transfer is through: a resource library at Lethbridge, aquaculture fact sheets, an aquaculture bulletin, a direct call centre, and being Internet accessible. Markets There are 63 species of fresh water, wild and farmed fish in the province of Alberta. Eighteen of these species are suitable for food or angling. Wild fish species include: pike, walleye, sauger, yellow perch, whitefish, lake sturgeon, arctic grayling and a variety of trout. When dealing with wild fresh water fish, Alberta has a relatively small number of fish-bearing water bodies, compared to other parts of Canada. Only eight hundred lakes have naturally occurring fish populations and 300 more are stocked with fish by the Government of Alberta. There are an estimated 300,000 recreational anglers who actively fish in the Province each year. An additional 800 commercial fishermen are licenced to catch fish for profit on public waters. Angling on public waters for recreation contributes more than $350 million to Alberta’s economy, whereas
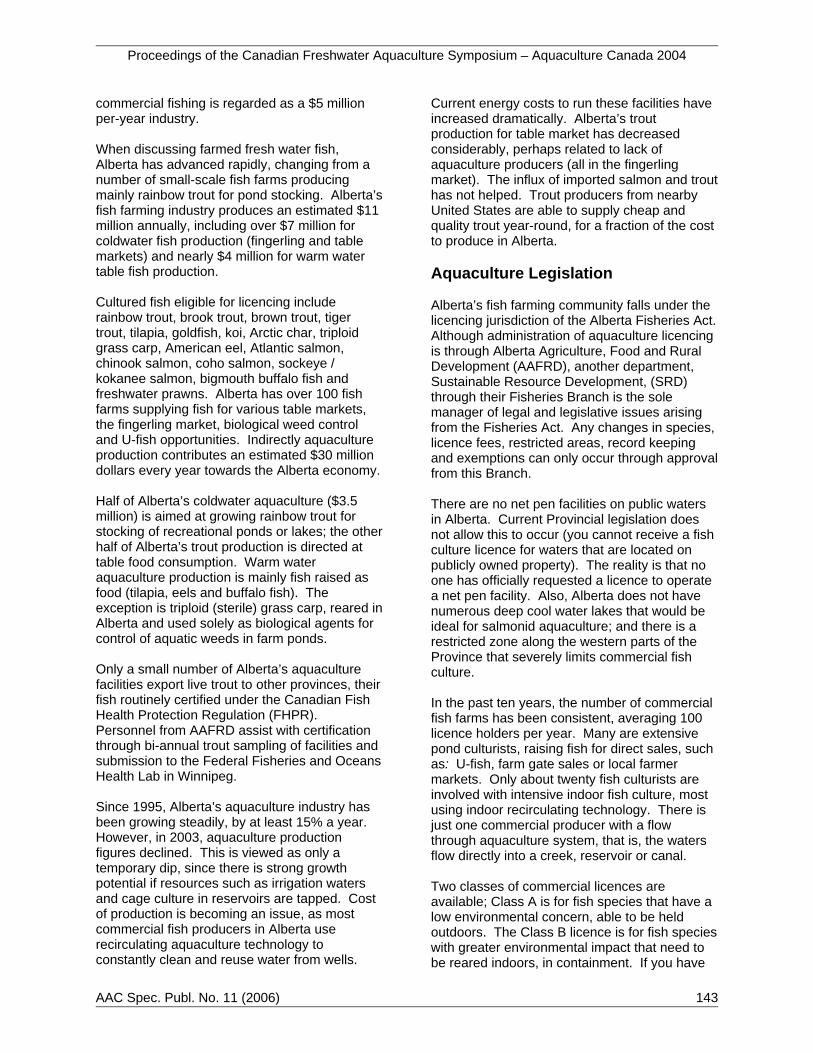
Proceedings of the Canadian Freshwater Aquaculture Symposium – Aquaculture Canada 2004
AAC Spec. Publ. No. 11 (2006) 143
commercial fishing is regarded as a $5 million per-year industry. When discussing farmed fresh water fish, Alberta has advanced rapidly, changing from a number of small-scale fish farms producing mainly rainbow trout for pond stocking. Alberta’s fish farming industry produces an estimated $11 million annually, including over $7 million for coldwater fish production (fingerling and table markets) and nearly $4 million for warm water table fish production. Cultured fish eligible for licencing include rainbow trout, brook trout, brown trout, tiger trout, tilapia, goldfish, koi, Arctic char, triploid grass carp, American eel, Atlantic salmon, chinook salmon, coho salmon, sockeye / kokanee salmon, bigmouth buffalo fish and freshwater prawns. Alberta has over 100 fish farms supplying fish for various table markets, the fingerling market, biological weed control and U-fish opportunities. Indirectly aquaculture production contributes an estimated $30 million dollars every year towards the Alberta economy. Half of Alberta’s coldwater aquaculture ($3.5 million) is aimed at growing rainbow trout for stocking of recreational ponds or lakes; the other half of Alberta’s trout production is directed at table food consumption. Warm water aquaculture production is mainly fish raised as food (tilapia, eels and buffalo fish). The exception is triploid (sterile) grass carp, reared in Alberta and used solely as biological agents for control of aquatic weeds in farm ponds. Only a small number of Alberta’s aquaculture facilities export live trout to other provinces, their fish routinely certified under the Canadian Fish Health Protection Regulation (FHPR). Personnel from AAFRD assist with certification through bi-annual trout sampling of facilities and submission to the Federal Fisheries and Oceans Health Lab in Winnipeg. Since 1995, Alberta’s aquaculture industry has been growing steadily, by at least 15% a year. However, in 2003, aquaculture production figures declined. This is viewed as only a temporary dip, since there is strong growth potential if resources such as irrigation waters and cage culture in reservoirs are tapped. Cost of production is becoming an issue, as most commercial fish producers in Alberta use recirculating aquaculture technology to constantly clean and reuse water from wells.
Current energy costs to run these facilities have increased dramatically. Alberta’s trout production for table market has decreased considerably, perhaps related to lack of aquaculture producers (all in the fingerling market). The influx of imported salmon and trout has not helped. Trout producers from nearby United States are able to supply cheap and quality trout year-round, for a fraction of the cost to produce in Alberta. Aquaculture Legislation Alberta’s fish farming community falls under the licencing jurisdiction of the Alberta Fisheries Act. Although administration of aquaculture licencing is through Alberta Agriculture, Food and Rural Development (AAFRD), another department, Sustainable Resource Development, (SRD) through their Fisheries Branch is the sole manager of legal and legislative issues arising from the Fisheries Act. Any changes in species, licence fees, restricted areas, record keeping and exemptions can only occur through approval from this Branch. There are no net pen facilities on public waters in Alberta. Current Provincial legislation does not allow this to occur (you cannot receive a fish culture licence for waters that are located on publicly owned property). The reality is that no one has officially requested a licence to operate a net pen facility. Also, Alberta does not have numerous deep cool water lakes that would be ideal for salmonid aquaculture; and there is a restricted zone along the western parts of the Province that severely limits commercial fish culture. In the past ten years, the number of commercial fish farms has been consistent, averaging 100 licence holders per year. Many are extensive pond culturists, raising fish for direct sales, such as: U-fish, farm gate sales or local farmer markets. Only about twenty fish culturists are involved with intensive indoor fish culture, most using indoor recirculating technology. There is just one commercial producer with a flow through aquaculture system, that is, the waters flow directly into a creek, reservoir or canal. Two classes of commercial licences are available; Class A is for fish species that have a low environmental concern, able to be held outdoors. The Class B licence is for fish species with greater environmental impact that need to be reared indoors, in containment. If you have

Proceedings of the Canadian Freshwater Aquaculture Symposium – Aquaculture Canada 2004
144 AAC Spec. Publ. No. 11 (2006)
fish in a pond for recreation, you also need a licence (recreational), costing $10 annually. All waterbodies require a pre-inspection prior to approval, costing an additional $40. Nearly 4,000 recreational fish culturists are licenced in Alberta. Aquaculture Effluent Guidelines Prior to 1993, Alberta’s water effluent guidelines were controlled under the Clean Water Act managed by Alberta Environment. Certain defined industries required a “permit to construct” and a “licence to operate.” Fish farming activities were not one of these defined industries. In 1996, a Code of Practice for Small Fish Farms and Fish Processing Plants was incorporated into law. Any fish farm producing over 9000 kilograms of fish per year or using more than 2250 kilograms of feed per month would require an “Approval” from the Department of Environment. Minimum charge for the lowest level of environmental “approval” is $1,000, with next “approval” levels costing $5,000. Unfortunately, the “Code of Practice” did not take modern recirculating aquaculture systems into consideration. As a result of industry concern, consultants were hired in 1998 to study and report on the Code of Practice for Small Fish Farms and Fish Processing Plants. The consultants’ report inspired the undertaking of a cooperative effluent study incorporating five Alberta fish culture facilities. This study began during the summer of 1999 and was completed in May of 2000. Data from this study provided a basis for new effluent guidelines, built-in to manage Alberta’s aquaculture industry. In 1999, after thorough discussion on aquaculture effluent parameters, the provincial government authorities and industry representatives agreed on the aquaculture effluent limits presented in Table 1. Routine monitoring of effluent parameters was an issue of debate. The Environment Department wanted industry to complete routine water sampling and analysis, including background levels, at landowner expense. Since compilation of the Aquaculture Effluent Guidelines in 1999, no monitoring has been required; neither have any public complaints been received.
Table 1: Alberta Aquaculture Effluent Guidelines Parameter Maximum
Limits Recirculating Systems
Maximum Limits Flow-Through Systems
Biological Oxygen Demand
25 mg/l 25 mg/l
Total Suspended Solids
25 mg/l or not more than 10 mg/l above background
25 mg/l or not more than 10 mg/l above background
Total Phosphorus (as P)
0.1 mg/l 0.05 mg/l
Total Ammonia – Nitrogen
5 mg/l 5mg/l
Mixing 2 parts receiving water 1 part effluent
Not applicable
pH 6.0 to 9.5 6.0 to 9.5 Alberta’s one flow though trout culture facility is small, when compared to other major aquaculture producing provinces. On average, effluent discharge from this site was below these new maximum allowable limits. The Province’s other commercial fish culture facilities are recirculation, discharging only small amounts of effluent daily (one toilet flush of effluent every three hours). This effluent goes directly to a contained area, septic field or sewage treatment facility. Thus, there are no present water quality and effluent concerns from Alberta’s aquaculture industry. What does effluent management mean to Alberta fish farmers? They raise fish. Fish require clean water to survive, grow well and produce proper taste characteristics when marketed as table fish. Alberta’s aquaculturists want to be recognized as raising fish from “unpolluted waters” an added benefit when marketing their quality product. More Alberta fish farmers are resorting to facilities that use modern recirculating technology, capable of managing water use and waste effluent. There is no reason fish farmers would willfully violate effluent management. They are required to manage their animal production far more

Proceedings of the Canadian Freshwater Aquaculture Symposium – Aquaculture Canada 2004
AAC Spec. Publ. No. 11 (2006) 145
carefully than other agricultural farm animal producers. Biological Weed Control Using Fish as an Alternative to Herbicides Two introduced fish species have been tested for their abilities to become biological weed control agents in Alberta. They include the grass carp and the silver carp. The white amur or grass carp (as a sterile triploid fish) were tested from 1994 until 1999 and have been approved for the past five years for use in ponds for weed control only. These fish are raised in Alberta, individually triploid tested with Coulter counter and regularly disease tested. Stocking rates to achieve weed control have been determined and are available in fact sheets. The Province owns all adult broodstock. Spawning and rearing of young are all done by the Aquaculture Centre of Excellence (ACE). A government inspector is required to oversee all triploid testing of young grass carp, any fish not certified triploid are culled. All fish for stocking are also individually nasal tagged. A select number of commercial fish culturists purchase fish wholesale from ACE, then act as agents in selling and delivering triploid grass carp to customer ponds. Research on silver carp first began in 1999, testing these fish for potential to remove blue green algae from ponds. Silver carp are now under their first year of full research in the field, currently being tested in fourteen select ponds throughout Alberta. All silver carp are sterile, individual fish having been triploid tested. Disease testing is a requirement. This first summer in their outdoor pond environment (2004) looks promising. Growth rates of many of the fish doubled in just two months in the pond. Present stocking rates are considered low, averaging less that 20 fish per small farm pond. No algae problems were observed this past summer, even in some of the test ponds with a history of annual algae issues. Mortality does not appear to be a problem and overwintering should not be an issue, as all research ponds have supplemental aeration.
Aquaponics – for Water Management and Conservation Aquaponics combines aquaculture (the growing of fish) with hydroponics (the growing of plants in a soil free environment). This practice remediates nutrient loading, improves water quality and increases water conservation. In a true balanced system, the fish require an adequate ratio of plants that will clean the water for reuse without the addition of fertilizers. Plants become a natural biological cleanser for the nutrient enriched water that returns for reuse by fish. These plants have become a value-added commodity, in some instances providing greater economic value than the fish being raised. Public concern over the environmental effects of agriculture wastes is a major factor impeding industry growth, requiring farmers to develop new approaches to waste management. Aquaponics is one of the few tools presently available to fish farmers that reduces aquaculture waste in an efficient and environmentally friendly manner. Ongoing research evaluates current aquaponics systems in Alberta under true commercial production capabilities, using fish and their feed to produce wastewater, which in turn flows to a greenhouse to fertilize plant production. Plants remove and clean out the nutrients, and the water is returned to the fish for reuse - a completely closed loop system. Alberta Agriculture, Food and Rural Development staff have undertaken considerable research into aquaponics and constructed a fully functional stand-alone system in Brooks. As well, an aquaponics system has been added onto an existing fish culture facility at the Lethbridge Aquaculture Centre of Excellence. Environmental balancing of fish, plants and water conservation has already been demonstrated. Current aquaponics research is now aimed at evaluating economic returns of various plant varieties while sustaining maximum fish production. Latest production figures at the Brooks Crop Development Centre are showing aquaponically grown vegetables and herbs growing as good as, or sometimes better than hydroponically grown produce. The reason is difficult to understand since traditional soil based organic systems that rely on natural fertilizers, tend to have substantially lower quality and quantity production.

Proceedings of the Canadian Freshwater Aquaculture Symposium – Aquaculture Canada 2004
146 AAC Spec. Publ. No. 11 (2006)
Conclusions and Available Information Alberta Agriculture, Food and Rural Development (AAFRD), the Alberta Aquaculture Association (AAA) and the Lethbridge Community College (LCC) recently joined together in forming an Aquaculture Centre of Excellence (ACE) partnership in the province. This Centre, located on the campus of the Lethbridge Community College, is committed to assist developing aquaculture as a viable and valuable industry. ACE houses a state-of-the-art aquaculture facility, an aquaponics greenhouse, a quarantine facility, an isolation building and a classroom-training Centre. Current research projects through ACE include: PCR genetic testing for disease diagnostics, grass carp spawning, silver carp trials for algae control, Blackwater trout for alkaline waters, applied aquaponics, biofiltration problem-solving, and efficacy of pond management products. For more information on aquaculture in Alberta, including fact sheets, bulletins, courses, the Alberta Aquaculture Association or the
Aquaculture Centre of Excellence, please refer to the following websites. 1. www.agric.gov.ab.ca
(Alberta Agriculture, Food and Rural
Development)
2. www.affa.ab.ca
(Alberta Aquaculture Association)
3. www.grasscarp.org
(Aquaculture Centre of Excellence)
References 1. Alberta Agriculture, Food and Rural
Development, 2003. Final Report: Aquaculture Effluent Impact Study (1998 – 2001 Data) Snake Lake Reservoir, Alberta. Aquaculture Section, Lethbridge, Alberta. 31 pp.
2. Alberta Agriculture, Food and Rural Development, 2003. Final Report: Aquaculture Effluent Impact Study of Five Selected Commercial Fish Culture Facilities, Alberta. Aquaculture Section, Lethbridge, Alberta. 17pp.

Proceedings of the Canadian Freshwater Aquaculture Symposium – Aquaculture Canada 2004
AAC Spec. Publ. No. 11 (2006) 147
Species Selection in Freshwater Aquaculture: A Prioritization Model for Industry Diversification Gord Durant Fish Culture Section, Great Lakes Branch, Ontario Ministry of Natural Resources, 300 Water St., Peterborough, ON K9J 8M5 The commercial freshwater aquaculture industry in Canada is dominated by the production of rainbow and brook trout, although a few other species are cultured to service niche markets. Canada’s vast freshwater biophysical resource base and its inherent regional variation present considerable potential to develop alternative species for commercial culture. Successful development of alternative species to support expansion of commercial freshwater aquaculture is obviously reliant on integrated knowledge of fish husbandry and culture technologies. Technical feasibility, however, will not readily translate into commercial viability - the economics of production and processing and market dynamics must also be favourable. The practical pursuit of alternative species for commercial aquaculture development is dependent upon a coordinated and focused research and development initiative, which, at the appropriate point, emphasizes development. A model that aids the evaluation of species for further development of the aquaculture industry is demonstrated. Introduction Freshwater aquaculture is a small component of the Canadian aquaculture industry, representing approximately 5% of total production (1,2). Although the freshwater sector is dominated by the production of rainbow trout and brook trout, a number of other species are reared, including Arctic charr, brown trout, tiger trout, lake trout, eels, perch, walleye, tilapia, lake sturgeon, sterile grass carp, goldfish, koi, Atlantic salmon, Chinook salmon, and coho salmon (3). The freshwater sector of the aquaculture industry is fragmented, rearing small quantities of a number of species in locations scattered across the country to serve niche markets. Successful development of a strong and viable freshwater aquaculture industry depends on building a production base large enough to meet market demands for regularity of supply, quality of product and price. Stechey and Gilbert (see paper in this volume) described the challenges facing individual farmers attempting to diversify and proposed clusters of farms as a solution (4). Small farms scattered over a wide geographic area have difficulty surviving due to the lack of local support services. Industry development is dependent on building clusters of farms to develop a production base that can, in addition to serving local niche markets, penetrate larger market outlets through the large-scale distribution chains of the food industry. Regional
industry development must be large enough to encourage the growth of a support base of businesses for feed, seed stock, equipment, veterinary services, processing and distribution that is essential to stability and vitality. The rainbow trout industry in Ontario is the closest that the freshwater aquaculture industry has come to establishing a strong, focused industry supplying product to large markets through industry-scale distribution chains, i.e. through brokers, wholesalers and retailers, and to developing a support base of service businesses. The industry is based on the “competitive advantages” of the ground-water resources of southern Ontario and the assimilative capacity of Georgian Bay and the North Channel of Lake Huron, along with ready access to the markets of southern Ontario and the United States. The industry has evolved on the strengths of the hatcheries in southern Ontario supplying fingerlings for cage operations in the North Channel.

Proceedings of the Canadian Freshwater Aquaculture Symposium – Aquaculture Canada 2004
148 AAC Spec. Publ. No. 11 (2006)
Species Diversification Interest in species diversification in the aquaculture industry is driven by: 1. Opportunities created when demand for a
species is not being met through traditional capture fisheries resulting in a high price for that species (5, 6). This was the incentive for development of the Atlantic salmon and Mediterranean sea bass industries. High price also encourages pioneering entrepreneurs to invest in culture of alternate species such as sturgeon, walleye and perch.
2. Strengthening and stabilizing an existing
regional aquaculture industry. Regional aquaculture industries are often based on the production of a single species. Species diversification can stabilize an industry impacted by disease epizootics or by falling prices due to production-driven development out-pacing market development. Diversification can help to stabilize production by expanding market breadth, increasing efficiency, spreading risk over a wider production base, and reducing the risk of disease outbreaks if species with differing susceptibilities to pathogens are cultured (7,
8, 9).
3. Development of a regional aquaculture industry to meet socio-economic needs for regional economic development. Aquaculture is often promoted as a suitable industry for regional development where employment opportunities have been lost due to a changing economic base brought about by the decline of other industries, e.g. forestry, mining or capture fisheries (10).
4. Strengthening and stabilizing the terrestrial
agriculture industry where falling farm-gate prices have destabilized the “family-farm” and rural communities (4).
5. Development of new technology that opens
up the geographic range in which fish can be raised. The development of new production technologies such as recirculating aquaculture systems (RAS) increases the potential for growing species of fish (e.g. tilapia) outside of their native range and within close proximity to markets.
Freshwater Competitive Advantage Besides the competitive advantages of an educated, skilled workforce, stable economy, stable political scene, competitive currency exchange rate, and proximity to the US market that give Canada a competitive edge in many industries, Canada has a vast resource of clean freshwater on which to build product reputation for the aquaculture industry. However, freshwater alone will not permit the Canadian freshwater aquaculture industry to compete effectively in global markets. The freshwater must be used wisely, and the cold climate limits the species that can be cultured and the growth rates achieved (11). Diversity may provide a greater “competitive-advantage”. Canada has the opportunity to build a diverse freshwater aquaculture industry based on: • A variety of species that potentially can be
raised including non-native species (with low potential for environmental damage if escapes occur or reared in highly-secure RAS).
• Diversity of production technologies that can be employed including ponds, cage culture, ground-water based flow-through systems and RAS.
• Diversity of domestic and export markets to be served from small niche-markets to main-stream markets.
Development of a freshwater aquaculture industry based on a number of species and production technologies that can take advantage of common needs for support services may be the base of a strong, viable industry with the flexibility to manage changing market and economic conditions. Diversity becomes an industry strength. The Canadian freshwater aquaculture sector may have difficulty competing with low-cost producers in other countries for commodity products, but should be able to carve out a respectable market share by promoting high-quality, safe food products. Species Choice Successful culturing of any species is obviously reliant on fish husbandry and culture technology. However, biological and technical feasibility alone does not result in commercial viability; economics of production and processing and market dynamics are equally important. Development of alternate species in the

Proceedings of the Canadian Freshwater Aquaculture Symposium – Aquaculture Canada 2004
AAC Spec. Publ. No. 11 (2006) 149
freshwater aquaculture sector is largely driven by pioneering entrepreneurs, who often choose a species based on speculation and high market prices ( 6, 9,12). These entrepreneurs are willing to assume the risks associated with commercial farming before sufficient knowledge of the production characteristics of the species and production economics is available to adequately assess business risk. These efforts are often under-capitalized, are handicapped by unresolved production and marketing issues and ultimately fail. Clearly, a need exists to rationalize the selection process to identify potential candidate species for aquaculture development and to define when commercial production becomes feasible. Model for Freshwater Species Diversification Species selection for the aquaculture industry must involve a multi-disciplinary approach involving balanced assessments of market conditions, biological requirements and production technology for the various species of interest (7, 9). Early decision-making in choosing species for aquaculture focused on production characteristics, while later models began to pay attention to markets and the economics of production (5, 7, 9, 10, 12,13, 14, 15). The model (Figure 1) discussed in this paper highlights the importance of market conditions and emphasizes assessment of production and processing economics in addition to analysis of the status of culture techniques and technology. The model also includes assessment of the socio-political environment and business risk to a greater degree than in previous models.
Figure 1: Multi-disciplinary approach to species selection for aquaculture diversification. The market analysis evaluates the market outlook, identifies consumer usage and perceptions, and identifies marketing opportunities for the candidate species. It answers the question – ‘Is someone likely to buy the fish?’ The assessment of biological requirements and production technology (culture) answers the question – ‘Can the fish be grown?’ The market, including an analysis of processing, and culture analyses supply input for analysis of projected capital and production costs (economics) and answers the question – ‘Can the fish be produced and marketed profitably?’ The economic analysis and a review of the socio-political environment provide input to evaluate the business risk associated with the species. Once a species has been identified as suitable for further development, pilot-scale production should be initiated. The process of information compilation and comparison for species of interest for aquaculture outlined in this and other models (8,9) helps the user to prepare an analysis to support the choice of a species as having the best potential, identifies research and development (R&D) needs, clearly assesses the risk potential associated with a given species, helps to identify when a pilot commercial culture project becomes appropriate to implement, and provides a base for action by industry and government to expand the aquaculture industry (9,10). The depth of analysis can be easily modified as appropriate for the scenario being investigated, (i.e. analysis of a large number of species, versus comparison of a few potential species) and the depth of analysis desired.

Proceedings of the Canadian Freshwater Aquaculture Symposium – Aquaculture Canada 2004
150 AAC Spec. Publ. No. 11 (2006)
The assessment of species suitable for aquaculture development involves compiling market and culture information on a number of species and comparing the attributes of each of the species to determine which hold the greatest promise for profitable development. In many cases, the list of species to be considered is determined a priori based on the assessors existing knowledge of market conditions and state of development of culture technology and only a few species are compared (16). In other cases, the assessors begin with a large list of species and reduce the number through a staged elimination process (9,10,13) in an effort to avoid preconceptions about which species are suitable. The assessment process often involves quantifying each characteristic assessed and calculating an overall “score” for each species to establish a priority list for development. Or a simple list comparing advantages and disadvantages for each species can be compiled. Most species of interest for diversification of the freshwater aquaculture sector in Canada have been the subject of research to develop culture techniques and in some cases commercial culture has been attempted (e.g. walleye, perch and sturgeon). In other cases, culture techniques are very well developed and interest in culturing the fish in Canada has arisen due to advances in production technology (e.g. tilapia in RAS). Because of the diversity of environmental conditions, species and production technologies possible in Canada, the following discussion of the details of the factors that need to be considered is general. The level of detail involved in the actual process of species prioritization must be adapted to the situation for which the species are being selected. The process of selecting species suitable for cage culture in a remote area will be different from the process used to select a species for culture in RAS adjacent to a major city. Species evaluated as unsuitable for aquaculture development should not be completely rejected as never having potential. Changing market conditions, advancements in science and improved culture technology may lead to such species becoming suitable for culture in the future (13). Two models have been published recently that provide excellent examples of detailed analysis for choosing aquatic species suitable for the
development of culture techniques. These models were intended to identify all species with potential for aquaculture for particular geographic regions; Québec (10,13) and France (9) and were based on large initial species lists; 47 indigenous freshwater and marine fish species and 20,000 species from the FISHBASE database respectively. These models compiled a large amount of information on each subject species and went through a staged selection process of eliminating species deemed unsuitable for culture due to either market or culture constraints. Secondary selection processes identified those species most suitable for aquaculture development. These models quantified a large number of attributes of each species as a means of deriving a score to place each species within a hierarchy of aquaculture suitability. Market Proponents of new species for aquaculture development must be aware that the aquaculture industry ultimately sells protein in competition with beef, pork, poultry, and other seafood products (17,18). Protein sources are generally commodities sold within a highly competitive and diversified global industry offering the consumer many low-cost choices (17) and the aquaculture producer is in a fight to win “stomach-space” for his/her product. Aquaculture development has tended to be production-driven with little effort devoted to co-ordinated market development (17,18,19). This production-driven approach disrupts the supply/demand equilibrium leading to rapidly falling prices with high-priced luxury seafood products becoming low-priced commodities (6, 7,
18, 19), as has occurred in the Atlantic salmon (5) , sea bass and sea bream (7) industries. Instead a market-oriented approach (17) to development should be implemented with the focus on producing fish products that fulfill consumer desires in quantities that sustain a price structure profitable for the aquaculture producers and players in the food distribution chain. Market conditions, not only for the seafood industry, but for the food industry in general, need to be well understood in order to provide the product the consumer desires and to be able to predict, plan for and adjust to changing market conditions. Market research should include the following major areas.
Proceedings of the Canadian Freshwater Aquaculture Symposium – Aquaculture Canada 2004
AAC Spec. Publ. No. 11 (2006) 151
Market Demand Market research should investigate the existing market demand for a species in terms of quantity, seasonality, the ability of the aquaculture industry to penetrate the supply chain (5,15,20) and the potential for stimulating increased demand as the aquaculture industry grows (18). The method by which the market is currently being served should also be investigated (20). The quantity demanded by the market will determine whether an aquaculture industry large enough to create the necessary support infrastructure for feed, equipment, processing, etc. required for long-term viability can be developed, or if a relatively small industry serving niche markets is the limit of development. The size of the demand will also be a determining factor in the ability of the aquaculture industry to penetrate the supply chain. If high demand is supported by a large capture fishery, it may be difficult for a fledgling aquaculture industry to establish itself as a serious supplier to the distribution chain by not being able to supply product in sufficient quantities. If the market is supplied by traditional capture fisheries, then the status of that industry should be researched in terms of size of catch, seasonality of catch, quality and form of product presented to the market place (10,13,18). The suitability of the species for stimulation of market demand, through further development of local markets, expansion of the geographical area marketed to, or differentiation of product form should be considered (7,18) . Early in the development of an aquaculture industry, a single product (e.g. head-on gutted) may be marketed, within a relatively local geographic area. However, as production increases with growth of the industry, and local market demand for that product becomes saturated, the industry needs to have a strategy to stimulate market demand. It is best to consider the potential for market expansion early in species selection. Diversification of product form can be as simple as varying the degree of basic processing to provide filleted, skinless or boneless products (18). This level of differentiation often occurs early in industry development. Further efforts to stimulate market demand may include providing increased choices in portion sizes, presentation (fresh, frozen, smoked, canned), quality
(sashimi) (7,9) and complete meals (18) . Extending the marketing potential may include production of leather and bio-molecules (10). Product image may also be enhanced through quality-brand labelling, eco-labelling and health promotion (7). Species for which there is an existing, unfulfilled demand provide the best opportunities for development of alternative species for aquaculture. In previous species diversification assessments, species for which there was not an existing market for human consumption and therefore, an established commercial value, were quickly rejected due to the absence of market information and the requirement to build markets from a zero base (9,10). Consumer Preferences and Knowledge When considering a new species for aquaculture development, it is necessary to understand what the consumer is looking for in a seafood product. Consumer preference and acceptance of a seafood product is a combination of organoleptic properties (taste and odour), appearance and texture and are strongly influenced by traditional foods and culture (15). Taste and odour are the primary means by which people judge acceptability of a food (15) and the potential for a species to acquire off-flavour during culture must be considered. Appearance of the product in terms of colour and form is important. Where fish are marketed in whole form, species with barbells, spines or unusual colours will not be favoured in some cultures (15). If pigment must be added to the diet to mimic what the consumer perceives to be a natural flesh colour, then the costs of doing so must be considered. Flaky and firm-textured fish are preferred, although species with soft texture are also widely utilized (15). Quéméner et al. (9) included a measure of “global spontaneous notoriety” in their analysis of species suitable for aquaculture diversification by including the spontaneous ability of consumers to name fish species and their ability to identify a name on a list of fish species. Price Analysis of the potential price of an alternative species should consider historical and current prices and the effect of the entry of the aquaculture product on future prices. Analysis of the historical and current prices combined with the quantity of fish entering the market place can provide a strong indication of the price

Proceedings of the Canadian Freshwater Aquaculture Symposium – Aquaculture Canada 2004
152 AAC Spec. Publ. No. 11 (2006)
to be initially obtained when the aquaculture product is first introduced to the market (7). Historical prices provide a sense of the stability of price over time, and any effect of season or fish size on the price structure. Where price fluctuations based on season or fish size occur, it may be possible to develop a production plan to take advantage of these higher prices (15). The price elasticity of demand, defined as the percentage change in quantity demanded resulting from a 1 percent change in price (21), and the effect of the entry of product into the market on the price structure needs to be carefully assessed to avoid rapidly dropping prices as occurred with Atlantic salmon, sea bass and sea bream due to a production-driven industry strategy (7,22, 6,19). High prices for fish species are usually the result of restricted supply and cannot be expected to continue following substantial increases in supply from aquaculture (15). High price-demand elasticity is desirable for a species under consideration for aquaculture development (22). A high initial price during the early stages of development will help to offset high initial production costs and provide early profits. As production increases, and the industry becomes more competitive, moderate declines in price should generate large increases in demand, an indication that the consumer considers the product to be a good substitute for other fish or livestock meat products, to permit profitable expansion of the industry. However, producers should be aware that the magnitude of elasticity becomes smaller as supply increases and a production level will be reached at which demand may become inelastic, i.e. further reduction in price will not generate increased demand. Substitutability The degree to which a new fish product will be considered as a substitute for other protein (seafood and meat) by consumers should be considered. Ideally a new aquaculture product should aim at filling an unsatisfied consumer need, increasing the number of consumers of aquaculture products, and avoid cannibalizing market share of existing aquaculture products (18,19) . For example, will the introduction of Arctic charr into a market place displace sales of Atlantic salmon or rainbow trout with no follow-on growth in the seafood market? Unfortunately, many alternative fish species have similar market characteristics as
established species creating a distinct marketing handicap in differentiating new species from others already present in the market place (7,18). This situation often arises because the alternative species that are most attractive for commercialization are those with culture requirements similar to those of currently cultured species, making the task of developing culture technologies and commercialization less costly. Species that provide a high degree of product differentiation often require more development of culture technology and therefore have a higher cost of commercialization (18). Distribution Chain The aquaculture industry has an advantage over capture fisheries in being able to meet the needs of the seafood distribution chain by providing a regular supply of consistent, high quality product which is a better fit in regard to weight, appearance and product form to meet consumer preferences (17,18). However, when considering a new cultured product to introduce to the market place, the existing structure of the distribution chain needs to be considered. Does the species or product under consideration fit with an established processing/distribution network, or will the fledgling aquaculture industry have to build a separate distribution network? What volume of production will be required early in industry development to interest the distribution chain and can this volume of product be supplied when the distributor needs it (5)? Processing Processing represents a major cost component in transforming a live fish into a marketable product. While in the initial stages of commercialization, basic processing (e.g. head-on gutted or fillets) may be sufficient to gain entry into the market place, for most species further processing will be required to increase market penetration as production increases. Early consideration of the processing characteristics of a fish species should be included in the analysis of the viability of the species for commercialization. Factors that significantly affect processing costs include: Processing Technology: Is existing mechanical processing technology suitable for the proposed species or is hand processing required? The fish should have characteristics that permit mechanized processing into various product

Proceedings of the Canadian Freshwater Aquaculture Symposium – Aquaculture Canada 2004
AAC Spec. Publ. No. 11 (2006) 153
forms with uniform portion size and shape, with limited modifications to existing equipment (15). Processing Yield: The yield of edible flesh in the main marketable form (usually a fillet) has a prime effect on the economics of production and the marketability of the product (15). Secondary market products, such as mince formed into fish cakes, skin for leather products, and bio-molecules for the pharmaceutical or cosmetics industry will increase the financial viability of the species if they can be extracted and processed economically. Bone Structure: The bone structure of the species will influence dress-out yield and costs of producing fillets if bone removal is required (9,15). Size: The size of fish that represents the optimal weight for processing into marketable products should also be a size that fits well within the culture production cycle. The length of the culture period is a key factor in farm profitability and risk level (9). If a large fish is required to meet market needs, then the culture period may be extended, limiting turnover of fish (and cash) on the farm and increasing risk of loss due to system failure, disease or uncontrollable environmental conditions. Flesh quality is often reduced once sexual maturity occurs and fish may need to be harvested prior to sexual maturity. Shelf Life: The shelf-life of the product and its ability to retain wholesomeness, flavour and texture over a reasonable period of storage and display in food outlets is a strong processing and marketing consideration (15). Body Composition: The protein and lipid content of the fish may have an impact on the desirability of the fish for processing and marketing (9). Fat and oily fish are more likely to develop rancid flavours during processing and storage (15). Culture Development of a viable aquaculture industry is dependent on a high degree of control over the full life-cycle of the species being cultured (15,22). The environmental conditions, behavioural limitations and culture equipment required need to be defined for each life stage (e.g. brood stock, eggs, larvae or fry, and grow-out). Application of available knowledge in the fields
of genetics, nutrition and fish health is also essential. Environmental factors that apply to all life stages include water temperature, key water quality factors (e.g. dissolved oxygen, pH, alkalinity, hardness, ammonia), and light (photoperiod, intensity and wavelength). The optimal environmental conditions, i.e. those that promote health and growth, should be identified as well as the tolerance range (5, 12). Optimal temperature for growth is a key factor for farm profitability (9) and the choice of species for culture should reflect the ambient water temperature and water quality conditions for the region (7,10) unless technology to modify these factors is technically and economically feasible. Production factors for all life stages that influence economic viability include tolerance for high rearing densities, growth rates, feed conversion efficiency, and survival rates. Most fish species have to be reared at high densities to achieve profitability and low tolerance for crowding increases the risk of disease outbreaks. Growth rate and feed conversion efficiency are critical to success. Ideally, a species should grow rapidly and convert feed efficiently to reach market size quickly at low cost. Otherwise the cost of maintaining fish over a long grow-out period may become prohibitive and increase risk of loss (15). Short grow-out times lead to greater flexibility in the production plan to respond to market variability (15). Market size should be reached prior to sexual maturity so that feed is used to produce high quality flesh rather than for the production of gametes (12). The feed conversion efficiency that can be achieved with an efficient feeding strategy should be known for each life stage. Ease of inventory is another critical production factor (23). If the fish are too sensitive to handling, determining an accurate inventory becomes difficult with the risk of subsequent shortfalls in later stages of the production cycle, or over-production. Behavioural traits that require special culture equipment are important to identify. Species for which specialized culture equipment and techniques are required are generally less attractive than species which can be successfully reared using simple, standard equipment and techniques. The goal for culture of any species should be to complete the entire life cycle within captivity

Proceedings of the Canadian Freshwater Aquaculture Symposium – Aquaculture Canada 2004
154 AAC Spec. Publ. No. 11 (2006)
through the development of domesticated brood stocks. This does not necessarily exclude species for which capture of brood stocks or juveniles from the wild is currently necessary. However, the business risk increases without full control over the reproductive cycle and other factors must be favourable for this to be considered (15,23). Where the level of biological knowledge is not yet sufficient to permit captive holding and development of brood stocks, the accessibility, reliability and disease control implications of wild seed stock collection needs to be assessed. When a brood stock program is being developed, it is important that various wild strains be assessed for performance under culture conditions to identify those strains with the best prospects for further development (20), that a large number of founding parents are used to provide a large degree of genetic variability and that a genetic improvement program be established immediately (7,16). A realistic assessment of the time-frame required to establish full control over reproduction and establish a genetic-improvement program to achieve gains in productivity is required. Can production gains be achieved that offset any expected decline in market price as production volume increases? The factors that are important to consider in species choice with respect to brood stock development include age and size at maturity, fecundity, frequency and seasonality of gamete production, egg size, spawning method in captivity, and potential for controlling these factors. Age and size at maturity and fecundity affect the cost of maintaining brood stocks through the rearing volume required for holding breeders and the length of time that is required. These factors also affect the time required and cost for genetic improvement. Egg size is related to larvae and fry size, with larger larvae and fry being generally easier to culture. Species that will produce quality gametes under normal culture conditions and that can be hand-spawned without the necessity of inducing spawning have advantages over species that require special conditions or induced spawning. Hand spawning is advantageous because it allows the aquaculturist to control matings. The timing of gamete production has a large influence on the production cycle and the market strategy. If seed is only available at one time each year, can production be managed through manipulation of water temperature and feed
ration to equalize harvest throughout the year? The potential for reproductive control through photoperiod or hormone manipulation to control timing of seed production should be considered. Where a species is already under cultivation and subject to industry expansion, potential fish farmers should consider whether or not there are sufficient companies holding brood stocks to provide competition for supplying seed stock. Egg incubation usually requires little space and relatively low volumes of water and flow rates increasing the feasibility of using specialized equipment and modifying environmental conditions, especially water temperature, to match the requirements of the species and to accelerate or delay the timing of hatch to manage the production cycle. The state of development and size at hatch is a critical factor in the development of culture technology for many species. For species that hatch in a larval development stage, metamorphosis is a critical event in the life-cycle that the aquaculturist must be able to predict, control and manipulate (15). Size at hatch is usually reflected in culture success with larger larvae being easier to culture. Larvae may exhibit behaviours, such as phototaxis, that require special equipment. Species that will accept manufactured feed immediately have a distinct advantage over species that require live feed with subsequent weaning onto manufactured feed. The length and difficulty of the weaning period must be considered as well as the prevalence and ease of control of cannibalism. The critical question is whether larvae/fry rearing is successful or if more R&D is required? The nutritional requirements throughout the life cycle must be known well enough to meet the nutrient and energy needs of the fish. Suitable feeds, either live or manufactured, must be available that are suitable to each life stage. Manufactured feeds should be formulated specifically for the species in question, or for a closely related species, at a reasonable cost. Protein is an expensive feed ingredient and the protein:energy content of the feed must be considered when choosing a suitable feed (5). Sufficient knowledge of the growth and feeding behaviour of the species should be known so that feeding strategies for larvae/fry rearing and grow-out can be devised to optimize production. In the grow-out phase, acceptance of

Proceedings of the Canadian Freshwater Aquaculture Symposium – Aquaculture Canada 2004
AAC Spec. Publ. No. 11 (2006) 155
manufactured feed is critical to profitability because of availability, ease of storage, reduced labour for handling, delivery to the fish and tank cleaning and reduced degradation of water quality in the rearing environment. Health related factors to consider in selecting a species to culture include the current knowledge of pathogens (bacterial, viral and parasitic), the availability of diagnostic tests, biosecurity or control methodologies, the hardiness of the species to environmental and handling stressors, and the resistance of the species to disease. Knowledge of pathogens is often limited for species that have not been cultured previously, and this represents a major biological risk (23). Choosing species that have demonstrated a wide tolerance to critical environmental variables, such as temperature, dissolved oxygen, ammonia concentrations, crowding and handling, reduces husbandry problems and risk (15). Socio-Political Environment The social and political environment must be taken into account when considering the costs and risks associated with development of alternate species for aquaculture. Societal perceptions of aquaculture as a safe source of food, as a threat to the environment and to “traditional fishers” way of life, and in terms of user conflict have a large impact on public policy. Whether based on valid concerns or misconceptions, these societal perceptions must be taken into account in determining the costs and risks of culturing any species. Time spent by the proponents of aquaculture in dealing with these issues is time away from managing the business of producing fish. Legislative or regulatory limitations on culturing species of interest should be considered early in the analysis. Proposals to culture non-native species may be subject to introductions and transfers restrictions ranging from complete bans to restrictions on culture methods aimed at preventing escapes. While RAS alleviate many concerns with culture of species outside of their native range, gaining permission to culture a controversial species can be a time-consuming task.
Economics The information gathered in the marketing, processing and culture analyses should be summarized in a production function. A production function estimates the maximum product output that can be achieved from a specified set of input rates, summarizes the state of existing technology, and identifies technological constraints (21). For assessment of a potential species for aquaculture, a production function evaluates economic parameters such as the maximum price that can be paid for eggs or juveniles, maximum mortality rates, and maximum feed, labour and management costs (7), and identifies the financial consequences of biological characteristics such as low fecundity (9). An answer is being sought to the question of whether or not the species can be grown at a low enough cost to be profitable now and into the future. The market and processing analyses provide information on the present and future size of the market, the preferred size range for harvested fish, the range of products possible, the impact of aquaculture product entering the market, and the farm-gate price that can be expected under various market conditions. The culture analysis provides information on the expected range of key production parameters such as growth and survival rates, feed conversion efficiency, and rearing density and identifies key biological constraints. From these production costs can be estimated. A cost-volume-profit analysis will determine the most profitable harvest size (15) most appropriate size for seed stock, the most appropriate production technology (10), and the quantity of product required for financial viability. Production modeling illustrates how fish flow through the culture system spatially and temporally, and aids in conceptualizing an efficient production facility and estimating capital costs. Fish farm design has an impact on farm profitability through effects on culture success (i.e. provision of optimal environmental conditions leading to improved growth and reduced mortality), and labour efficiency in terms of staff movement, feed and fish handling. Return on invested capital is a key decision criterion for proceeding with culture of the species in question. Business risk analysis is an additional step, often omitted, to determine if developing an aquaculture industry based on an alternate species is sensible. Does the scenario being

Proceedings of the Canadian Freshwater Aquaculture Symposium – Aquaculture Canada 2004
156 AAC Spec. Publ. No. 11 (2006)
developed, whether for regional economic development or agriculture/aquaculture diversification have a competitive advantage for the species and products being considered? The risks associated with culture of an alternative species should be assessed in terms of the following key components of business risk (20): 1. Demand variability: The more stable the
demand for a firm’s products, other things held constant, the lower its business risk.
2. Sales price variability: Firms whose
products are sold in higher volatile markets are exposed to more business risk than similar firms whose output prices are more stable.
3. Input price variability: Firms whose input
prices are highly uncertain are exposed to a high degree of business risk.
4. Ability to adjust output prices for changes in
input prices: Some firms are better able to raise their own output prices when input costs rise than others. The greater the ability to adjust output prices, the lower the degree of business risk, other things held constant.
5. The extent to which costs are fixed: If a high
percentage of a firm’s costs are fixed, hence do not decline when demand falls off, then it is exposed to a relatively high degree of business risk.
The status of culture technology development is a key risk factor affecting control over costs and the ability to meet market commitments. The degree of dependence on R&D (10), and lack of control over the production process (22) may create unacceptably high levels of risk in terms of control over input prices (for seed stock), costs of production, and the ability to deliver product. The reliability of culture technology, assumptions for key production factors (growth and survival rates, rearing density and feed conversion) for each life stage, the production model and estimated production costs should be confirmed in a pilot-scale facility, overseen by an experienced aquaculturist with fish reared under production conditions in industry-practical facilities. Sensitivity analysis to predict the effects of changing market conditions, especially reduced farm-gate price, or increased production costs is essential to anticipate changes in the business environment and
reduce uncertainty by defining options for response to change (20). Future expectations for reducing production costs through increased production efficiency resulting from improved facility design, fish husbandry, genetic gains, improved feeds and economies of scale need to be realistically considered (7). The ultimate purpose is to be able to provide potential fish farmers with the necessary information on culture technology, production standards and risks involved in rearing the alternative species required for business planning and financing, and to reduce business risk to attract investment. Potential farmers also need to be provided with training opportunities and ongoing extension support in husbandry knowledge and skills, baseline production standards, facility design, operation and maintenance, and management skills (20) to ensure successful development of an aquaculture industry based on a well-chosen alternative species. Acknowledgements I thank Dan Stechey for critically reviewing the manuscript. References and Endnotes 1. Statistics for freshwater production are not
clearly separated from marine aquaculture production. The proportion of the total aquaculture production produced in freshwater was estimated using the figures for trout.
2. Statistics Canada. 2003. Aquaculture Statistics 2002. Statistics Canada, Agriculture Division Cataloque No. 23-222-XIE.
3. CAIA. Canadian Aquaculture Industry Alliance. Industry Profile. www.aquaculture.ca/English/IndustryProfile/CAIA.html.
4. Stechey, D. and E. Gilbert. 2004. The scope and potential of aquaculture as a diversification strategy for traditional agriculture operations. Final Report. Prepared for Agriculture and Agri-Food Canada, Food Bureau and Office of the Commissioner for Aquaculture Development. 65 p.
5. Avault, J.W. Jr. 1993. Ten requirements for culturing a “new” species: a checklist. Aquaculture Magazine 19:68-73.

Proceedings of the Canadian Freshwater Aquaculture Symposium – Aquaculture Canada 2004
AAC Spec. Publ. No. 11 (2006) 157
6. Harache, Y. 2002. Development and diversification issues in aquaculture. A historical and dynamic view of fish culture diversification. In P. Paquotte, C. Mariojouls and J. Young (Eds.). Seafood market studies for the introduction of new aquaculture products. Zaragoza: CIHEAM-IAMZ, 2002. (Cahiers Options Méditerranéennes; v. 59. pp. 15-23 Seminar of the CIHEAM Network on Socio-Economic and Legal Aspects of Aquaculture in the Mediterranean, 2001/06/21-22, Zaragoza, Spain.
7. Basurco, B. and E. Abellán. 1999. Finfish species diversification in the context of Mediterranean marine fish farming development. In E. Abellán and B. Basurco (eds.) Marine Finfish Diversification: Current Situation and Prospects in Mediterranean Aquaculture. Zaragoza: CIHEAM-IAMZ. Options Méditerranéennes: Série B: Etudes et Recherches: no. 24 pp. 9-25.
8. Liao, I.C. and Y.S. Huang. 2000. Methodological approach used for the domestication of potential candidates for aquaculture. In Recent advances in Mediterranean aquaculture finfish species diversification. Zaragoza, CIHEAM-IAMZ. Cahiers Options Méditerranéennes v. 47 pp. 97-107. Seminar of the CIHEAM Network on Technology of Aquaculture in the Mediterranean on “Recent advances in Mediterranean aquaculture finfish species diversification”, 1999/05/24-28, Zaragoza, Spain.
9. Quéméner, L., M. Suquet, D. Mero and J-L. Gaignon. 2002. Selection method of new candidates for finfish aquaculture: the case of the French Atlantic, the Channel and the North Sea coasts. Aquat. Living Resour. 15:293-302.
10. Le François, N.R., H. Lemieux and P.U. Blier. 2002. Biological and technical evaluation of the potential of marine and anadromous fish species for cold-water mariculture. Aquaculture Research 33:95-108.
11. Gauthier, M., H. Mercille, M. Parent, J.-F. Thifault and A. Dumas. 2002. Canadian freshwater aquaculture: a development perspective. Bull. Aquacult. Assoc. Canada 102(2):42-45.
12. Avault, J.W. Jr. 2001. Selecting new species for commercial aquaculture. Aquaculture Magazine 27(3):55-57.
13. Le François, N.R., H. Lemieux, P. Blier and M. Lévesque. 2000. Technical and financial
pre-feasibility study for the selection of marine and anadromous fish species for cold-water aquaculture. Aquacult. Assoc. Canada Spec. Publ. No. 4 pp. 31-33.
14. Suquet, M., P. Divanach, L. Quéméner and J.L. Gaignon. 2002. Criteria for cost-effective diversification for European finfish mariculture. In P. Paquotte, C. Mariojouls and J. Young (Eds.). Seafood market studies for the introduction of new aquaculture products. Zaragoza: CIHEAM-IAMZ, 2002. Cahiers Options Méditerranéennes; v. 59. pp. 119-128. Seminar of the CIHEAM Network on Socio-Economic and Legal Aspects of Aquaculture in the Mediterranean, 2001/06/21-22, Zaragoza, Spain.
15. Webber, H.H. and P.F. Riordan. 1976. Criteria for candidate species for aquaculture. Aquaculture 7:107-123.
16. Stechey, D. 1990. Opportunities for enhanced development of commercial aquaculture in Ontario: A technological and economic analysis of alternative fish species. Ontario Ministry of Agriculture and Food. 134 pp.
17. Brown, W. and D. Stechey. 1997. Coldwater Aquaculture in the 21st Century - A Canadian Perspective. Proceedings, Coldwater Aquaculture Beyond the Year 2000, p. 14-21, Aquaculture Association of Canada Special Publication No. 2, St. Andrews, NB.
18. Papageorgiou, P.A. 2000. Marketing development for new Mediterranean aquaculture species: Enterprise strategies. In Recent advances in Mediterranean aquaculture finfish species diversification. Zaragoza, CIHEAM-IAMZ. Cahiers Options Méditerranéennes v. 47 pp. 11-24. Seminar of the CIHEAM Network on Technology of Aquaculture in the Mediterranean on “Recent advances in Mediterranean aquaculture finfish species diversification”, 1999/05/24-28, Zaragoza, Spain.
19. Pedini, M. 2000. Summary report of the TECAM seminar on Mediterranean marine aquaculture finfish species diversification. In Recent advances in Mediterranean aquaculture finfish species diversification. Zaragoza, CIHEAM-IAMZ. Cahiers Options Méditerranéennes v. 47 pp. 381-385. Seminar of the CIHEAM Network on Technology of Aquaculture in the Mediterranean on “Recent advances in Mediterranean aquaculture finfish species

Proceedings of the Canadian Freshwater Aquaculture Symposium – Aquaculture Canada 2004
158 AAC Spec. Publ. No. 11 (2006)
diversification”, 1999/05/24-28, Zaragoza, Spain.
20. Stechey, D. and S. Connors. 1993. New Species Development: Speculation vs. Strategic Opportunism. Keynote Presentation -- Special Session on Contemporary Issues in Aquaculture, Aquaculture Engineering Conference, American Society of Agriculture Engineers, Spokane WA, June 21-23, 1993.
21. Mansfield, E. 1990. Managerial Economics. W.W. Norton and Company, New York.
22. Bjorndal, T., R. Tveteras and F. Asche. 2002. The development of salmon and trout
aquaculture. In P. Paquotte, C. Mariojouls and J. Young (Eds.). Seafood market studies for the introduction of new aquaculture products. Zaragoza: CIHEAM-IAMZ, 2002. Cahiers Options Méditerranéennes; v. 59. pp. 101-115. Seminar of the CIHEAM Network on Socio-Economic and Legal Aspects of Aquaculture in the Mediterranean, 2001/06/21-22, Zaragoza, Spain.
23. Webber, H.H. 1973. Risks to the aquaculture enterprise. Aquaculture 2:157-172.

Proceedings of the Canadian Freshwater Aquaculture Symposium – Aquaculture Canada 2004
AAC Spec. Publ. No. 11 (2006) 159
Aquaculture as an Agricultural Diversification Strategy Daniel Stecheya and Éric Gilbertb
aCanadian Aquaculture Systems, Inc., 1076 Tillison Avenue, Cobourg, ON K9A 5N4 bAquaculture Management Directorate, Department of Fisheries and Oceans, 200 Kent Street, Ottawa, ON K1A 0E6 Current trends in the agriculture sector are pressuring farmers to enhance productivity and produce more affordable, higher quality and safer foods. Such pressures are eroding the sustainability of family farms and the survival of rural communities and traditional ways of life. The scope and potential of aquaculture as a diversification strategy for traditional agriculture operations has been examined. Canada has considerable potential for rural development - experienced farmers, a rural infrastructure and labour pool and biophysical, economic and market assets to exploit. The expertise and knowledge exist to enable the successful development of aquaculture as a farm diversification tool. Moreover, with the greatest freshwater reserve in the world, relatively inexpensive energy costs and ready access to strong domestic and American markets, the opportunity exists to enhance freshwater aquaculture production within the Canadian agricultural sector. Preliminary analyses suggest that, over an initial 5- to 7-year development period, agricultural diversification through aquaculture could generate more than $60 million in farm-gate revenue and provide 330 sustainable jobs. To benefit from this opportunity, Canada requires a tangible plan developed jointly by all stakeholders, including industry, academe and federal and provincial government agencies. Note that this paper is an except from Stechey and Gilbert(1)
Introduction Agriculture is a major thrust in the Canadian economy, accounting for 8.4% of GDP, one out of every eight jobs and contributing to a positive trade balance. Current trends in the agri-food sector, driven largely by the consolidation of processors and retailers, are forcing farmers to enhance productivity and produce more affordable, higher quality and safer foods. Such pressures are themselves forcing consolidation in the farming sector. Today, we have fewer and larger farms that we did in years past. Such consolidation is having a negative impact on the sustainability of family farms and the survival of rural communities and traditional ways of life. In recognition of these trends, Agriculture and Agri-Food Canada released its Agriculture Policy Framework (APF), a multi-faceted initiative intended to enhance the productivity and sustainability of Canadian farms. Within the APF, the Renewal Initiative is specifically targeted toward helping farmers gain access to the capital, information and knowledge required to make the best management decisions regarding their operations. Agriculture and Agri-Food Canada is prepared to assist farmers to
improve profitability, explore income diversification strategies, facilitate the development and implementation of more environmentally sustainable practices and help to transfer scientific and technological innovations into every day practice. Integrated agriculture and aquaculture systems (IAAS) can present an opportunity for farmers to diversify their income, creating a broader economic base that can enhance farm profits, improve water use efficiencies and reduce economic risk. Successful Farming Magazine (2000) conducted a national survey in the US to gather perspectives on the best alternative agriculture ideas. Aquaculture was cited for its ability to more fully utilize available resources. Although the integration of aquaculture and agriculture operations is common throughout Asia, Africa, the Middle East and Eastern Europe, it is atypical in most other parts of the world. In North America, aquaculture is largely regarded as a specialized livestock enterprise requiring specialized skills and such ventures tend to be solely concerned with the production of fish or shellfish. In such systems, however, nutrient and waste management is almost always an issue – and herein lays the initial

Proceedings of the Canadian Freshwater Aquaculture Symposium – Aquaculture Canada 2004
160 AAC Spec. Publ. No. 11 (2006)
driving force for the integration of aquaculture and agriculture operations. In Australia’s Goulburn-Murray Irrigation District (GMID), some 490,000 hectares of farmland are irrigated using water supplied largely from a series of man-made reservoirs and connecting irrigation channels. This provided the Australian authorities with an ideal opportunity to investigate the potential for integrated aquaculture-agriculture systems, which includes cultivation of aquatic organisms in the reservoirs as well as in tanks or ponds on farms prior to the water being applied for irrigation. The initiative indicated that the concept of integrated aquaculture-agriculture systems can improve productivity, water use efficiency and overall environmental sustainability in both agriculture and aquaculture (2). Consequently, the Australian Rural Industries Research and Development Corporation (3), in partnership with the Victorian Department of Natural Resources and Environment and other relevant state agencies, commissioned the preparation of an IAAS Resource Handbook for Australian farmers and resource managers as one mechanism to further develop the sector. The handbook includes key information regarding the principles and practices of integrated agri-aquaculture including detailed description of successful case studies from around Australia and overseas, legislative and business networking requirements, and best practice economic and environmental management guidelines (4). Bacon (5) evaluated the economics of integrating trout production into a traditional grain and broiler farming operation in the eastern US as a risk diversification strategy. Under all of the scenarios examined, a 100% probability of economic survival was projected, implying that the farmer would remain in business over a ten-year horizon. Economic success, however, as governed by a required rate of return in excess of 8% per annum, was less certain. The greatest returns were attained through diversified farming operations and a modest use of debt financing (Table 1).
Table 1: Simulation results for trout diversification in a broiler and grain farming enterprise.
100% Equity 50% Debt 100% Equity 50% Debt
Internal Rate of Return (%) 7.01 7.41 7.72 8.76Probability of Economic Survival (%) 100 100 100 100Probability of Economic Success (%) 49.3 80.7 92.0 99.0
Base Farm Base Farm with Trout
Bacon (5) concluded that economic performance in farming could be enhanced by diversifying into trout production. Utilizing a continuous stocking strategy for year round trout production introduced a stabilizing affect on the economic variability within the venture. Agricultural diversification into aquaculture is, however, not without risk. Moreover, diversification strategies constitute one of the most critical risk management decisions that farmers must make. Farmers must have knowledge of the risks and returns (costs and benefits) of various alternatives to make informed decisions regarding diversified production. Diversification often involves a significant financial outlay, the development of new skills, access to new resources and an ability to create or respond to new market opportunities (6). Successful integration of aquaculture into traditional agricultural operations necessitates that economic considerations are the principal driving force. A farmer must be convinced that the long-term benefits of diversification warrant the investment. The potential farmer-aquaculturist requires comprehensive information outlining production options and alternatives, costs and benefits, training and skills development and socio-economic factors. That is, the farmer needs more than just technology to be successful. Defining Integrated Agriculture – Aquaculture Systems There is no precise definition of integrated agriculture – aquaculture systems. Rather, IAAS have been defined in various manners to suit varying needs and circumstances, the general principles of which have been defined by several authors. For instance: • Gooley (4) defines IAAS as aquaculture
undertaken as part of an integrated agricultural production system; more specifically incorporating aquaculture

Proceedings of the Canadian Freshwater Aquaculture Symposium – Aquaculture Canada 2004
AAC Spec. Publ. No. 11 (2006) 161
practices and operations with other commercial farm enterprises, infrastructure usage and management objectives as an integral, but not necessarily primary, component of an agricultural (typically irrigated) production system.
• Cohen (7) outlines an integrated system comprised of agricultural water storage, aquaculture and irrigation farming based on the multiple and more effective and efficient use of water; typically first for fish production and then for irrigation.
• Edwards (8) defines it as the integration of aquaculture with terrestrial farming systems to achieve sustainable management and utilization of natural and “waste” resources. He further extends his definition to include the linking of aquaculture with other human activities in concurrent or sequential linkages to capitalize on the availability of by-products either directly on-site (farm), or indirectly through off-site needs and opportunities or both.
Gooley (4) correctly states that by its very nature IAAS is and always will be a practical and relatively simple and broadly defined concept which embraces a diversity of practices, systems and operations. As such, the fundamental objective of integrated agriculture – aquaculture systems is to facilitate innovation and diversification in both agriculture and aquaculture by capitalizing on the inherent synergies between the two sectors, leading to enhanced profitability and environmental sustainability. Opportunities for Agricultural Diversification via Aquaculture In many parts of Canada, it is unlikely that an individual farmer who chooses to diversify into aquaculture production will be successful. Constraints imposed by geography, economies of scale, infrastructure support and access to skills and knowledge would likely drive up costs to the point that profits would be marginal. Successful diversification can be greatly enhanced, however, by incorporating a cluster approach to aquaculture development. Porter (9) defines clusters as a geographic concentration of competitive and mutually reinforcing businesses linked though vertical (buyer/supplier) and/or horizontal (common customers, technologies, channels, etc.)
relationships. Clusters are fundamental to productivity and competitiveness. A cluster approach would entail the development of multiple farms within a geographic region. The cluster would be supported by a centralized infrastructure providing essential products and services including a processing plant, marketing, supplies (e.g. feed, specialized equipment, consumables, etc.) and other specialized services (e.g. fish health, laboratory, training and skills development, transportation, etc.). Such a model would enable producers to benefit collectively from economies of scale - particularly for consolidated feed purchases and coordinated product processing and marketing. Throughout Canada, several clusters could be developed. • Pregnant Mare Urine Farms - In the three
prairie provinces, approximately 390 farms were engaged in the production of pregnant mare urine as a source of hormones for medicinal purposes. With the recent decline in hormone replacement therapy, only about 120 farms remain in production. These farms generally have large, modern insulated barns that could be utilized for aquaculture production. Moreover, the operations are located in natural clusters. The principal cluster, which accounts for more than two-thirds of the operations, is located in southwest Manitoba and southeast Saskatchewan. Smaller clusters exist in south-central Alberta.
• Irrigated Farming – Irrigation is fundamental
to the agricultural economy of western Canada. Since the turn of the last century, the federal and provincial governments have invested in the development of dams, diversion structures, reservoirs, canals and irrigation technologies and systems to support agriculture in this semi-arid region (Figure 1). Today, more than 755,000 hectares of western Canadian farmland is irrigated, of which 65% is in AB, 16% in SK, 16% in BC and 3% in MB. Enhanced water utility can be attained by using these reservoir and canal systems to provide water for aquaculture prior to irrigation.

Proceedings of the Canadian Freshwater Aquaculture Symposium – Aquaculture Canada 2004
162 AAC Spec. Publ. No. 11 (2006)
Figure 1: Major Reservoirs in Canada. Triangles show reservoirs having more than one billion cubic meters capacity. • Aquifers – Groundwater resources are
plentiful in many regions of Canada (Figure 2). Historically, aquifers have supplied a significant volume of the water used in the aquaculture sector, from major hatcheries and intensive food fish operations to smaller hobby farms. In south-western Ontario, for example, tobacco farmers diversified their production to include trout, since tobacco land generally overlays plentiful aquifers. Aquifers capable of supporting intensive aquaculture exist throughout the prairie river basins, south western-Ontario, southern Québec, New Brunswick, Nova Scotia and Prince Edward Island.
Figure 2: Major ground water reserves in Canada (shaded areas). Source: http://atlas.gc.ca/site/english/maps/freshwater/distribution/groundwater The aquaculture sector presents an alternative opportunity for Canadian residents to examine when looking for diversification or economic development opportunities. But as with any
opportunity, success will depend on thorough analysis and proper management. Developing a Model Demonstration Farm Facility Producing more than 31,000 tonnes of trout annually from freshwater land-based operations, Denmark is a leading aquaculture producer. However, the vast majority of this production still relies on earthen pond systems. In recent years, a combination of economic and environmental pressures has forced the Danes to re-examine their operations in an effort to reduce water consumption, decrease the total cost of production and improve the quality of discharged effluent. Pursuit of these objectives has led to the development of new technologies that satisfy both producers and government regulatory officials. These developments relate to feed manufacturing and feeding practices, enhanced farm management strategies, the introduction of recirculation systems to conserve water and energy with standardized and recognized technological, economical and environmental performances. The Danes developed a simple raceway design employing a series of air lifts that serve to simultaneously oxygenate water, strip carbon dioxide and induce a circulating current (Figure 3). The raceways contain discrete settling zones that remove and drain a large percentage of faeces, which are stored for intermittent land application. Fine particulate matter is removed via mechanical filtration and deep-welled, moving-bed biofilters convert ammonia to nitrate. Discharged effluent is drained through a constructed wetland to remove remaining organic matter, dissolved phosphorus and nitrate, prior to its release. The system permits the efficient production of trout for the table market with minimal environmental impact in terms of nutrient loading and water requirements (10). An industry-government group known as the Inter-Provincial Initiative for the Sustainable Development of Freshwater Aquaculture in Canada is presently evaluating the success of the Danish model farm program with the intent of adopting a similar approach in Canada, in part to demonstrate the technologies to prospective aquaculturists.

Proceedings of the Canadian Freshwater Aquaculture Symposium – Aquaculture Canada 2004
AAC Spec. Publ. No. 11 (2006) 163
Figure 3: The Danish Model Farm Preliminary Economics of the Model Farm System The Danish Model Farm initiative is based largely on a single design, as outlined in the previous section of this report. This design constitutes a base case for the economic evaluation of a Canadian model farm and assumes that the entire facility is constructed on an undeveloped site (Scenario 1) with the raceways and all fish culture operations enclosed within a new 18.3m wide by 122m long (60’ x 400’) CoverAll structure. Within the context of agricultural diversification, however, there will be applications where some existing farm infrastructure may be utilized for aquaculture development - barns, for example. Consequently, three additional economic scenarios have been compiled for comparative purposes. All four scenarios utilize recirculating aquaculture technologies and allow for the
production of 110 tonnes of rainbow trout annually. Scenario 2 represents an intensive facility using circular tanks, which is more in keeping with the North American culture of recirculation systems. Oxygen injection and active carbon dioxide stripping are applied to enable stocking densities to reach 75 kg/m3. This design scenario requires eight tanks for early rearing (to about 450 grams) and nine grow-out tanks where fish are finished to market size. The early rearing tanks are arranged in four 2-tank modules while the grow-out tanks are arranged in three 3-tank modules. The entire facility is to be constructed within a new CoverAll structure measuring 18.3m wide by 103.6m long (60’ x 340’). Scenario 3 is also an intensive production scenario and utilizes the same technologies as Scenario 2; however, the nine grow-out tanks have been replaced with two parallel raceways. This scenario assumes that the early rearing operations are to be housed within an existing agricultural building (barn) while the grow-out facilities are located in a new CoverAll structure measuring 15.2m wide by 60.9m long (50’ x 200’). Scenario 4 is similar to Scenario 3 except semi-intensive technologies are used in the raceway grow-out facility. Consequently, the raceway must be larger to accommodate the lower stocking densities and airlift stations. In this scenario, the raceways require a CoverAll structure measuring 15.2m wide by 85.3m long (50’ x 280’).

Proceedings of the Canadian Freshwater Aquaculture Symposium – Aquaculture Canada 2004
164 AAC Spec. Publ. No. 11 (2006)
Scenario 1 Concept: Danish Model Farm approach Configuration: Parallel raceway system
2 raceways at 100m L x 6m W x 1.35m D each Intensity: Semi-intensive – utilization of aeration technologies for oxygenation,
carbon dioxide stripping and water circulation Density: 50 kg/m3 maximum System Volume: 1,620 m3 Water Use: 1,127 Lpm (298 gpm) Flushing Rate: 100% system volume per day Energy Use: 41 kW (55 HP) Building: Cover-All (18.3m wide by 122m long)
Scenario 2
Concept: North American intensive tank facility Configuration: Circular tanks with Cornell-style double drain systems
8 early rearing tanks at 5.9m dia x 1.5m D each 9 grow-out tanks at 8.5m dia x 1.5m D each
Intensity: Intensive – utilization of oxygen injection technologies and active carbon dioxide stripping
Density: 75 kg/m3 maximum System Volume: 1,257 m3 Water Use: 878 Lpm (232 gpm) Flushing Rate: 100% system volume per day Energy Use: 42 kW (56 HP) Building: Cover-All (18.3m wide by 103.6m long)
Scenario 3
Concept: North American combination Tank / Raceway Facility - Intensive Configuration: 8 early rearing tanks at 5.9m dia x 1.5m D each
2 grow-out raceways at 61m L x 4.9m W x 1.5m D each Intensity: Intensive – utilization of oxygen injection technologies and active carbon
dioxide stripping in tanks and raceways Density: 75 kg/m3 maximum in tanks and raceways System Volume: 1,274 m3 Water Use: 886 Lpm (234 gpm) Flushing Rate: 100% system volume per day Energy Use: 42 kW (56 HP) Building: Cover-All (15.2m wide by 60.9m long)
Scenario 4 Concept: Combined North American and Danish Intensive Tank / Semi-Intensive
Raceway Combination Configuration: 8 early rearing tanks at 5.9m dia x 1.5m D each
2 grow-out raceways at 91m L x 4.9m W x 1.5m D each Intensity: Intensive Tanks – oxygen injection technologies and active carbon
dioxide stripping Semi-intensive Raceways – aeration technologies for oxygenation, carbon dioxide stripping and water circulation
Density: 75 kg/m3 maximum in tanks; 50 kg/m3 maximum in raceways System Volume: 1,496 m3 Water Use: 1,041 Lpm (275 gpm) Flushing Rate: 100% system volume per day Energy Use: 51 kW (68 HP) Building: Cover-All (15.2m wide by 85.3m long)

Proceedings of the Canadian Freshwater Aquaculture Symposium – Aquaculture Canada 2004
AAC Spec. Publ. No. 11 (2006) 165
The fundamental biological and economic assumptions applied in economic modeling are presented in Table 2. Table 2: Assumptions applied in financial forecasting. PRODUCTION Cost of Feed $1.30 / kg Feed Conversion Ratio 1.1 kg feed per 1
kg gain Cost of Fingerlings 15 g @ $0.25 each
(delivered) Average Mortality Rate 1% per month Labour Requirement 1½ Employees @
$24,960 per person-year; Wage increases at 2.5% per year
FINANCING Selling Price of Fish $3.75 / kg ($1.70 /
lb) farm gate, round Equity Financing 40% Debt Financing 60% at 6.5%
interest amortized over 120 months
Economic Analysis Projections indicate that the Danish Model Farm approach (Scenario 1) is the most practical among the four scenarios. An investment of $770,000 is required to launch the venture. Of this, $513,412 will finance capital equipment (i.e. raceway systems, CoverAll structure, fish culture equipment, etc.), including 10% contingency (Table 3). An additional $256,588 in working capital (i.e. fingerlings, feed, labour, etc.) is also required. At $4.66 per kilogram of production capacity ($2.11/lb production capacity), the venture is within expectation for a land-based, recirculating aquaculture venture. The pro forma financial statements reflect an equity investment of $308,000 for Scenario 1. These funds are leveraged by a $462,000 debenture, financed at 6.5% per annum. The loan is paid down in equal monthly blended payments (interest + principal) over 120 months. After five years of operation, a cumulative cash position exceeding $135,000 is forecast. During the first year of operations, effort is largely directed toward establishing trout
inventory. Initial sales of trout from the operation commence in the 12th month after start-up (assuming a January launch). By the end of the first year of operations, approximately 47 tonnes of trout are produced and held in inventory. By the second year, the venture will have attained a relatively steady state of production, yielding 110 tonnes of whole trout annually. The gross margin on production is projected to become positive in the 20th month of production when, for the first time, the farm-gate selling price of trout ($3.75 / kg) exceeds the cost of growing the fish. By Year 5, the venture is projected to generate $0.46 of pre-tax profit on every kilogram of fish produced. Further analysis of the data through the first five years of operation suggests that cash earnings on sales are projected to exceed 18% by year five. Due in part to the cost of feed, however, the return on capital employed is modest at only 9.7% in year five. The debt ratio (total debt / total assets) for the venture is projected to decline from 60% at start-up to only 42% after five years. Concomitantly, the times-interest-earned ratio increases to 3.69-times in year five. The high proportion of costs associated with feed, fingerlings and labour impart operating leverage on the venture and, consequently, modest changes in revenue and/or operating expenditures can become magnified in the bottom line. For example, sensitivity analysis indicates the following: • 10% increase in feed cost to $1.43/kg =
32% decline in profit • 15% increase in fingerlings cost = 9%
decline in profit • 6% increase in revenue to $3.97/kg = 48%
increase in profit (11) • 2 full-time employees in Years 3+ = 27%
decline in profit The economic performance of Scenario 3 is comparable to Scenario 1 but slightly less attractive. Scenarios 2 and 4, however, produced relatively poor results. A comparative analysis of the four scenarios is outlined in Table 3. Aquaculture, therefore, is not only operationally similar to livestock agriculture, it appears to be economically similar as well. Both feed cost and the farm-gate price for a commodity product can substantially influence the farmer’s / fish farmer’s bottom line.

Proceedings of the Canadian Freshwater Aquaculture Symposium – Aquaculture Canada 2004
166 AAC Spec. Publ. No. 11 (2006)
Table 3: Comparative Analysis of Four Model Farm Scenarios. PARAMETER
Description
ProductionHarvest (kg / yr)
InvestmentFixed CapitalWorking CapitalTotal Investment
FinancingEquity ($ / %) $308,000 40% $366,000 40% $314,000 40% $316,000 40%Debt ($ / %) $462,000 60% $549,000 60% $472,000 60% $473,000 60%Interest (%) 6.5 6.5 6.5 6.5Term (months) 120 120 120 120
Cost of Production - Year 5 $ $/kg $ $/kg $ $/kg $ $/kgRevenues $412,880 $3.75 $412,880 $3.75 $412,880 $3.75 $412,880 $3.75Cost of Sales $329,259 $2.99 $341,970 $3.10 $338,568 $3.07 $344,378 $3.13Gross Margin $83,621 $0.76 $70,909 $0.64 $74,312 $0.67 $68,502 $0.62Indirect Costs $32,850 $0.30 $36,426 $0.33 $33,261 $0.30 $33,303 $0.30Earnings Before Tax $50,770 $0.46 $34,483 $0.31 $41,050 $0.37 $35,199 $0.32
Financial Performance - Year 5Return on Capital Employed (%)Times Interest Earned (times)Gross Profit on Sales (%)Net Profit on Sales (%)Return on Total Assets (%)Cash Earnings on Sales (%)Cumulative Cash (end of year 5)Est'd Equity Pay-Back (years)
$94,539$135,026 $84,083 $125,903
Scenario 1
Danish air-driven raceway design; semi-intensive production
Scenario 2
Intensive prod'n in circular tanks; pump-driven with oxygen injection
Scenario 3
Intensive prod'n in circular tanks (fingerlings) and raceways (grow-out)
Scenario 4
Intensive fingerling prod'n in circ. tanks with semi-intensive on-growing in air-driven raceways
110,160
$513,412$256,588$770,000
110,160 110,160 110,160
$645,689 $527,424 $522,760$266,240$789,000
$269,311$915,000
$258,576$786,000
12.38.018.5
8.45.317.5
9.73.720.3
5.92.517.2
8.43.118.0
10.5 20.4 11.4 15.4
9.96.918.3
7.02.816.68.56.116.4
Developing an Agriculture Diversification Strategy for Aquaculture Development To fully realize the agricultural diversification opportunities that aquaculture presents, federal and provincial agencies must craft an Agriculture Diversification Strategy for Aquaculture Development to lead the process. Among other things, this strategy would need to identify how various federal and provincial agencies would work together given their respective mandated responsibilities and capabilities to achieve the key industry developmental requirements. It would also need to delineate respective roles, activities and cooperative mechanisms. Furthermore, since close cooperation between industry and government will be required, the
respective roles of government and industry need to be clearly identified and understood. An overall goal or objective for the strategy could be: “To facilitate the diversification, efficiency and growth of Canadian farms through the implementation of sustainable aquaculture.” Specific elements of the strategy could include, but are not limited to: • Aquaculture Demonstration and
Development Programming o Construction and management of
demonstration and development farms in select regions for integrated agriculture/aquaculture operations

Proceedings of the Canadian Freshwater Aquaculture Symposium – Aquaculture Canada 2004
AAC Spec. Publ. No. 11 (2006) 167
o Effective federal – provincial – industry – academic partnering in the operation of the facilities as training and awareness centres
• Appropriate Policy Framework o Recognition of aquaculture as an
agriculture diversification tool o Equitable footing with other agri-
food sectors • Development of an Attractive Investment
Climate o Infrastructure support o Industry development programs
and/or incentives o Enabling regulatory and economic
climate o Industry financial assistance
programs • Training and Skills Development
o Regional / community skills profiling o Training and mentoring programs o Distance education and internships o Training for government employees
dealing with aquaculture • Technology Development and Transfer
o Extension services and workshops o Coordinated R&D strategy o Cooperative approach between
industry, governments, academe • Aboriginal Programming
o Opportunities awareness program targeted toward Aboriginal communities
o Federal / provincial cooperation on Aboriginal developmental programs and initiatives
o Community-based training • Identification of regional processing
opportunities and capacities o Value-Added Processing and
Product Development o Product quality assurance;
Conclusions Political leaders, at all levels, are increasingly challenged to resolve the developmental and economic problems within Canada’s agricultural sector. Diversification of agricultural enterprises has been identified as a means to stabilize agricultural income, bringing increased prosperity to family farms. Canada has considerable under-developed potential for rural economic development in the form of experienced farmers with a desire and willingness to engage in new ventures, a rural
infrastructure and labour pool, as well as biophysical, economic and market assets to exploit. Aquaculture is one potential means to fulfil this potential. With the greatest freshwater reserve in the world and relatively inexpensive energy costs, the opportunity exists to enhance freshwater aquaculture production within the Canadian agricultural sector. Moreover, proximity to the large, affluent and growing US market for fish and seafood is an added bonus. The expertise and knowledge exist to enable the successful development of aquaculture as an agricultural diversification tool. Moreover, this analysis demonstrates that aquaculture is operationally similar to livestock agriculture – all of the principles and practices of animal husbandry apply. Fish farmers stock juvenile fish (fingerlings) then feed and care for them until they reach market size, at which time they are harvested for processing into food. The analysis demonstrates that aquaculture is also economically similar to agriculture – the same factors that influence economics in animal husbandry also influence the financial performance of fish farms. Canada requires a tangible plan to bring this concept to fruition. To be successful, such a plan should be developed jointly and cooperatively by all stakeholders, including federal and provincial government agencies. Moreover, success will undoubtedly also be contingent upon the substantive engagement of Agriculture and Agri-Food Canada as the lead federal agency for Canada’s farmers. References and Endnotes 1. Stechey, D. and E. Gilbert. 2004. The scope
and potential of aquaculture as a diversification strategy for traditional agriculture operations. Final Report. Prepared for Agriculture and Agri-Food Canada, Food Bureau and Office of the Commissioner for Aquaculture Development. 65 p.
2. Ingram, B.A., G.J. Gooley, L.J. McKinnon and S.S. deSilva (2000). Aquaculture-agriculture systems integration: an Australian perspective. Fisheries Management and Ecology, 7:33-43.
3. Australian Rural Industries Research and Development Corporation (2000). Aquaculture offers new scales of farm production. (Press Release)

Proceedings of the Canadian Freshwater Aquaculture Symposium – Aquaculture Canada 2004
168 AAC Spec. Publ. No. 11 (2006)
4. Gooley, G. (2002). R&D Plan for Integrated Agri-Aquaculture Systems 1999-2004. Australian Rural Industries Research and Development Corporation, Publ. No. 99/153. 29p.
5. Bacon, J.R., C.M. Gempesaw, I. Supitaningsih and J. Hankins (1994). The economics of broiler, grain, and trout production as a risk diversification strategy. Aquaculture 127:91-102.
6. Campbell White and Associates Pty Ltd. and Alan Black (2002). Costs and Benefits of Diversification – Whole Farm Case Studies. Australian Rural Industries Research and Development Corporation. RIRDC Publ. NO. 02/029. RIRDC Project No. ECU-7A.
7. Cohen, D. (1997). Integration of aquaculture and irrigation: rationale, principles and its practice in Israel. International Water and Irrigation Review, 17(1):8-12, 14, 16.
8. Edwards, P. (1998). A systems approach for the promotion of integrated aquaculture. Aquaculture Economics and Management, 2(1):1-12.
9. Porter, M. (1991). The competitive advantage of nations. In: Montgomery, C.A. and M.E. Porter, Strategy: Seeking and Securing Competitive Advantage, Harvard Business Review. p. 135-169.
10. Vandenberg, G., E. Gilbert, S. Lareau and P. Dubé (2003). An industry action plan for sustainable freshwater aquaculture development in Canada. The Inter-Provincial Collaborative R&D Initiative for Sustainable Freshwater Aquaculture. Université Laval, Montréal, QC. 31 p.
11. A farm-gate price of $3.97 / kg ($1.80 / lb) for whole trout is common in the industry. Web Sites Cited • FarmCA.com. Fish farming as a form of
diversification. • http://collections.ic.cg.ca/soilandwater/ • http://atlas.gc.ca/site/english/maps/fresh
water/consumption/hydroelectric • http://atlas.gc.ca/site/english/maps/fresh
water/distribution/groundwater

Proceedings of the Canadian Freshwater Aquaculture Symposium – Aquaculture Canada 2004
AAC Spec. Publ. No. 11 (2006) 169
Techniques used for the intensive culture of Lake Whitefish (Coregonus clupeaformis) in Ontario, Canada Glenn W. Hooper White Lake Fish Culture Station, Ontario Ministry of Natural Resources, Fish Culture Section, 25900 Highway 7, RR#2 Sharbot Lake, ON K0H 2P0 The Ontario Ministry of Natural Resources has been producing large numbers of Lake Whitefish (Coregonus clupeaformis) for stocking since the early 1980’s as part of the ongoing rehabilitation programme in Lake Simcoe. The programme has developed from dependence on live feeds in the development phase of early rearing, into a large scale fully intensive (dry diet based) feeding regime. A recent change in the availability of high quality, larval feed has required continual experimentation to revise established techniques to maintain adequate growth and survival. Whitefish larvae routinely attain body weights of 800 to 1000 mg in 10 weeks of early rearing and have survival rates of up to 90%. Advanced rearing usually occurs for an additional 6 months at which time production typically yields 140,000 fish at 20 to 25 grams in size. This paper will present the methodology of culturing Coregonid species and will discuss feeding regimes, diet trials, husbandry techniques, tank designs, incubation and early rearing, feed distribution, lighting and behaviour. Methodology for the Culture of Lake Whitefish Techniques for the intensive, production of Lake Whitefish (Coregonus clupeaformis) have been under development by the Ontario Ministry of Natural Resources for the past twenty years. This research program, based at the White Lake Fish Culture Station (FCS) in eastern Ontario, has been aimed at providing consistent, intensive production of 140,000 20g lake whitefish annually for the rehabilitative stocking of Lake Simcoe, Ontario. This paper will describe the techniques and technology which has evolved from the successful research and development programme. The description presented will be primarily technical, outlining current procedures in a production environment. For an historical and comprehensive report on the scientific research conducted during the experimental phase, the following articles and books are recommended: Drouin, Kidd and Hynes (1); Harris and Hulsman (2). Lake Whitefish eggs are collected annually from several shoal spawning wild populations in Lake Simcoe. Spawning activity generally peaks in late November as water temperatures fall to 7oC. Adult fish are taken live in trap nets. The eggs are extruded, dry fertilized, and allowed to water-harden for approximately two hours before being transported 300 kilometres to the White Lake FCS. Egg incubation takes place in 6.0
litre glass (Bell or MacDonald) jars supplied with 4.0 litres per minute of ambient temperature water from nearby White Lake. Lake Whitefish eggs from Lake Simcoe range between 30,000 and 35,000 eggs per litre when fully water hardened. Approximately 2 litres of eggs (70,000) are incubated per jar, supplied with sufficient water to induce a gentle rolling action. Except for routine removal of clumped or dead eggs incubation takes place in near darkness to simulate natural environmental conditions. Lake Whitefish eggs require approximately 120 to 140 days to hatch at an average daily temperature of 2.5oC. In a production system, it is necessary to have all fish hatching at approximately the same time. To accomplish this, eyed eggs incubated at 0.5-2.5oC, are volumetrically inventoried to determine a mean number of eggs per ml. This figure is then used to measure out the appropriate numbers of eggs into slotted baskets suspended in each rearing unit. Water temperatures are then elevated by 2oC within 24 hours. This precipitates a mass-hatching effect within 12 hours, and when all healthy eggs have hatched, the larvae “swim-up", and are actively seeking food. Dead or un-hatched eggs, including malformed larvae remaining in the baskets, are enumerated and healthy larvae are added to replace that number. Initially, each 500 L unit is loaded with 6000 larvae. Lake Whitefish larvae at swim-up average 11-12 mg in weight and 12-13 mm in total length. Lighting is provided by incandescent and fluorescent

Proceedings of the Canadian Freshwater Aquaculture Symposium – Aquaculture Canada 2004
170 AAC Spec. Publ. No. 11 (2006)
lights on 14 hour day settings with a darkened period lasting for 10 hours to simulate spring light levels in the Lake. Early rearing of larval lake whitefish is conducted in 500 liter, conical-bottomed, circular white fibreglass tanks, approximately 1.0 metre in diameter (Figure 1). Initially, tank volume was reduced to accelerate water velocities in the conical portion of the unit (necessary to facilitate self-cleaning). Larvae were initially confined to the upper cylinder portion of each tank by means of a snug-fitting, screen-bottomed insert, or "basket". The fish remained confined in the baskets until they weighed approximately 100 mg each. The basket was then removed and the fry used the entire tank volume (3). Since 1997, this practice was determined to be unnecessary for larval whitefish during initial stages as they are surface feeding and orient strongly to the upper portion of the tank. As Harris (3) described above, poorly swimming larvae (muskellunge and walleye) may benefit from the use of internal baskets as they reduce exposure to cyclonic action in the lower portion of the unit.
Figure 1: Whitefish larval rearing units. Each unit is supplied with a single submerged water supply providing a circular flow pattern and low velocity until the fish are 4 weeks of age. A second supply line is added for the balance of the early rearing period to provide a more thorough cleaning action in the conical portion of the unit. Water temperatures for larval culture are initially set at ambient temperatures simulating those occurring in Lake Simcoe at this time. Results of temperature studies conducted over a number of years, up to a maximum temperature of 15°C, promotes optimal growth and survival of
intensively cultured lake whitefish. Growth is significantly reduced at temperatures less than 6°C, but increases rapidly in the 11-15°C range. Prolonged exposure at temperatures greater than 16 ºC has resulted in reduced growth, fish health issues and poor feed conversion. The larvae tend to swarm at the surface for the first 2 weeks, exhibiting strong schooling behaviour while constantly moving and foraging for food items. Initially photopositive, the fish congregate near the surface and exhibit little fright response, but by week 4 all activity around the rearing units should be reduced as outside stimuli negatively affect the fishes feeding behaviour. Outflow dissolved oxygen levels should be greater than 5mg/litre for rearing whitefish as lower values have been implicated in bacterial gill infection. Water exchange rate is initially set at 1.0 exchange per hour, with a gradual increase in flow to 2.0 exchanges as the fish grow. A variety of commercial dry diets were tested over the years and the larvae readily accepted the feed exhibiting adequate growth rates, but incidences of spinal deformation, incomplete opercular development, and lower jaw deformities were encountered when Artemia sp. products were not included in the diet (1,2,3,4). In 1986 experimentation began with a commercial feed developed in Japan and sold in North America as Fry Feed Kyowa-BTM, manufactured by Kyowa Hakko Kogyo, Tokyo, Japan. This diet became the “standard” by which all other diets have been compared as the fish displayed exceptional growth, excellent conversion rates and exhibited few developmental issues or skeletal deformities. In 2000, the Canadian Food Inspection Agency (CFIA) expressed some concerns due to inadequate ingredient labelling and restricted the importation of these feeds into Canada. Later, Bovine spongiform encephalopathy (BSE) concerns worldwide (2001 and 2002) severely restricted the free flow of diets from Europe and Asia into North America. As a result, the larval whitefish were exposed to a wide range of diets that did not incorporate blood meal or animal products in their formulation. Although whitefish continued to grow they again developed some deficiencies in skeletal formation along with poor growth and conversion noted through 2000 to 2002.

Proceedings of the Canadian Freshwater Aquaculture Symposium – Aquaculture Canada 2004
AAC Spec. Publ. No. 11 (2006) 171
Importation of InveTM diets from Belgium in 2002 and 2003 seemed to offer an acceptable and economically viable alternative to the Japanese diets but formulation changes from Alfa Epac and NRD diets to Lansy CW formulations in 2004 reduced growth rates and conversions once again. Table 1 illustrates the new slower expected growth rates achieved when not using the high performance diets. This reduced growth rate will result in increased experimentation to optimize feeding and efficiency using new diet formulations over the next several years. Table 1: 2004 Early rearing feeding regime used for larval lake whitefish culture at White Lake Fish Culture Station, Ontario. End Week
Weight (grams /fish)
Diet (Size and type)
% Body weight fed
TempºC
1 .018 Lansy CW 2/4
5 4.5
2 .024 Lansy CW 2/4
5 5.0
3 .032 Lansy CW 2/4
5 6.5
4 .045 Lansy CW 2/4
6 8.0
5 .063 Lansy CW 2/4
6 12.0
6 .088 Lansy CW 2/4
6 13.5
7 .129 OMNR #1 crumble
7 14.5
8 .189 OMNR #1 crumble
7 14.5
9 .276 OMNR #1 crumble
7 14.5
10 .403 OMNR #1 crumble
7 14.5
11 .590 OMNR #1 crumble
7 14.5
12 .862 OMNR #1 crumble
7 14.5
Fish transfers should be minimized when the fish are less than 100 mg in weight as the fish may lose scales and reduce overall fitness if
excessively handled. Feeding should be reduced or eliminated 24 hours prior to handling. Due to the rapid growth of juvenile lake whitefish, inventories are conducted every 14 days to accurately establish feeding rates and select appropriate feed sizes. Inventories of larvae smaller than 100 mg are by lethal sample, fish are blotted dry, and weighed individually. For larger fish, live sampling is done with 250-300 fish per sample (wet weights). Several random samples per unit are averaged to determine unit biomass figures. As with all aquaculture activities maintenance of appropriate water quality, tank hygiene and minimal handling are the best method of reducing incidents of disease. Bacterial gill infection is the most prevalent disease problem encountered, and is generally the result of handling, activity around the tanks, overfeeding, poor tank hygiene, or elevated water temperatures. The early signs of bacterial gill disease are recognizable by lethargy and random spacing by individuals as schooling behaviour is reduced or abandoned. Management of bacterial gill disease is by chemical treatment utilizing a 20 minute, 2% salt bath on the first day only, followed by a 20 minute, 10 mg/l Chloramine-T bath. The Chloramine-T treatment is repeated for 2 more days without the salt bath pre-treatment. Both circular (4 m3) and rectangular (raceway) (6 and 15 m3) units have been used to grow whitefish fingerlings from 1 gram to 25 grams in body weight, at final rearing densities of up to 60 grams per litre. Whitefish are generally adaptable to units with a large surface to depth ratio as they do not like to position themselves very deeply in a unit. In addition, as they are aggressive feeders and exhibit a high degree of schooling behaviour, shallower (less than 1 metre in depth) units are the most desirable in an intensive programme. Whitefish are transported to Lake Simcoe in large, insulated fibreglass transport units, using compressed oxygen delivery systems, at loading densities typical for lake trout (100 grams/ litre).The fish have been held in these units for up to 8 hours without ill effects. Final transportation to the release sites is by boat equipped with similar transport units. Juvenile whitefish are released into the lake near the end of October coinciding with thermal de-stratification of the water column and prior to active spawning by adult whitefish.

Proceedings of the Canadian Freshwater Aquaculture Symposium – Aquaculture Canada 2004
172 AAC Spec. Publ. No. 11 (2006)
References 1. Drouin, M.A., Kidd, R.B., Hynes, J.D. 1986
Intensive culture of lake whitefish Coregonus clupeaformis using Artemia sp. and artificial feed. Aquaculture 59: 107-118.
2. Harris, K.C., Hulsman, P.F. 1990. Intensive culture of Lake Whitefish (Coregonus clupeaformis) from larvae to yearling size using artificial dry feeds. Aquaculture 96: 255-268.
3. Harris, K.1992. Techniques used for the fully intensive culture of Lake Whitefish Coregonus clupeaformis larvae and yearlings in Ontario, Canada. Pol. Arch. Hydrobiol. 39: 93-100.
4. Zitzow, R.E., Millard, J.L. 1987. Survival and growth of Lake Whitefish initially fed formulated diets. USF.W.S Info. Leaflet No. 86-105.

Proceedings of the Canadian Freshwater Aquaculture Symposium – Aquaculture Canada 2004
AAC Spec. Publ. No. 11 (2006) 173
Intensive Culture of Walleye in the United States Robert C. Summerfelt Department of Natural Resources, Ecology and Management, Iowa State University, Ames, IA 50011-3221 USA Walleye, doré jaune (Sander vitreus), is a popular sport fish in Canada and the United States where fry and fingerlings are produced by governmental agencies and commercial aquaculturists for enhancement stocking. Walleye is also an esteemed food fish, often a fundamental entrée of upscale (“white tablecloth”) restaurants. In the US, except for a very small tribal harvest, there is no commercial harvest of walleye in the Great Lakes or elsewhere, but in Canada, walleye are harvested by commercial fishers from the northern shore of Lake Erie and by First Nations fishers from lakes of western Ontario, Manitoba, Saskatchewan and NW Territories. The major portion of the annual harvest of 7,585 metric tons (16.7 million pounds) of Canadian wild-caught walleye from these two sources is exported to the US, a point that demonstrates the potential of walleye to be a trademark species for Canada and a major contributor to Canadian aquacultural development in freshwater. Although market research in the US demonstrates widespread acceptance of walleye as a food fish, yet, commercial culture of walleye for the food-fish market is rare because of its specialized requirements to produce a food-size fingerling. The objective of this paper is to provide a brief summary of the state of the art of cultural technology for intensive culture of walleye, specifically tank culture of first feeding walleye with manufactured feed, and the tandem pond-to-tank culture practice that requires habituating of pond-reared fish to formulated feed. Introduction Walleye, doré jaune (Sander vitreus), is an esteemed food and among the most favored game fish among anglers in the United States and Canada. Walleye are said to be “the most economically valuable species in Canada’s inland waters” (1). Market research in the US also demonstrates widespread awareness by the public of the desirable palatable qualities of walleye as a food fish. Walleye is often a feature item in upscale (“white tablecloth”) restaurants, and in retail markets it invariably is higher priced than cultured salmon. Walleye has the potential to be a trademark product of Canadian aquaculture. I think Americans would consider cultured Canadian walleye as the best of its kind. Canadian walleye generate a sublime, albeit imaginative view of a product coming from an unsullied environment of clear water lakes surrounded by spruce and cedar, which is actually, an accurate view of some of the current sources of wild-caught Canadian walleye from Manitoba. There is a market for all life stages from egg to adult. But, presently, the objective of most walleye aquaculture, both public and private, is to produce fry and fingerlings for sport fish enhancement. At this time, there are few growers of food-size walleye. Encouraging market factors that may
lead to development of walleye food-fish culture include: excellent reputation for the food-quality of walleye, name recognition by consumers, a high price and a small and shrinking supply of competitive sources of wild-caught walleye for the food-fish market. The traditional source of walleye for the food fish market has been commercial harvest of wild stocks. In the US, there was once a substantial commercial fishery for walleye in the Great Lakes, especially from Lake Erie, but also the Mississippi River, and from many glacial lakes of Wisconsin and Minnesota. Currently, in the US, only a small harvest is made on the Great Lakes by tribal fishers for subsistence purposes, and a few tribes support a small commercial market. The overwhelming majority food-size walleye in North America comes from two sources of Canadian wild-caught stocks — the Canadian realm of the Great Lakes and from many isolated lakes of western Ontario and the prairie provinces of Manitoba, Saskatchewan and NW Territories. The second source are fish purchased from mainly aboriginal fishers by the Freshwater Fish Marketing Corporation of Canada (FFMC) (2). The harvest of walleye from the North American Great Lakes averaged 9.3 million pounds (4,233 metric tons) per annum from 1991-2000 (Table 1).

Proceedings of the Canadian Freshwater Aquaculture Symposium – Aquaculture Canada 2004
174 AAC Spec. Publ. No. 11 (2006)
Table 1: Comparison of walleye landings, live weight (1,000 of pounds), by commercial fishers from the United States and Canada areas of the Great Lakes 1991 through 2000 (exclusive of 587 lbs/year harvest from L. Superior). Source: 1991-1999 (17); US data for 2000 (18).
* Mean of 10 year interval, 1991-2000; **Percent of total for US or Canada The overwhelming portion (99.5 %) of the total landings was from the Canadian side; 97% of that was from Lake Erie. The US has greatly restricted commercial harvest from the Great Lakes in favor of the stronger political clout of angler groups, although there is a small license harvest by tribes in Wisconsin and Michigan (0.48 metric ton in 2002). The second source of Canadian wild-captured walleye is marketed by the Freshwater Fish Marketing Corporation of Canada (FFMC), a federal crown corporation (2). The purpose of the FFMC is to promote international markets, increase fish trade, and increase returns to fishers. The FFMC has exclusive right to inter-provincial and export trade in products of the freshwater fisheries from the three prairie provinces (Manitoba, Saskatchewan and Alberta), the Northwest Territories, and part of northern Ontario. They purchase fish from 2,600 fishers who harvest from more than 400 lakes in the five provinces. The fish are processed at a plant in Winnipeg. The average annual purchase (they report purchases not sales), 1996-2000, by the FFMC was 3,352 metric tons or 7.4 million pounds (Table 2). FFMC purchases the equivalent of 44.2% of the sum of the average annual purchases and landings of the two Canadian sources (7,585 metric tons or 16.7 million pounds). Street talk suggests that most Canadian walleye are exported to the US.
The exceptional retail price in the US for walleye and yellow perch (Perca flavescens), which is US$2.00 to 4.00 more than that of salmon, has driven the importation and sale of wild-caught pikeperch (Sander lucioperca) from Eastern Europe, which is sold as either walleye or yellow perch. Although mislabeling of a food product is a violation of US federal law, the matter has had no enforcement. Clearly, however, there is an established market for food-size walleye, suggesting an opportunity for a cultured product that can provide year-around supply with consistent quality, and lower levels of contaminants than found in wild-captured fish. And that brings me to the nub of the question about the potential for aquacultural production of walleye. There is a market for all life stages from eggs to food fish. The US commercial culture of walleye is well established for production of fry and fingerlings for enhancement stocking. Fish are sold to lake associations, county and municipal lakes, and even state fishery agencies to supplement their output. Food-size walleye have an established market based on a widely accepted reputation but dependent for supply from wild-caught fish, both domestic and imported. Walleye is a desirable species and future supply is limited by declining stocks of wild populations. Clearly, there is an obvious potential for walleye to be a trademark species that will facilitate freshwater aquacultural development in Canada. Yet, very few commercial farms produce walleye
Erie Huron Michigan Ontario Totals Year US CN US CN US CN US CN US CN Both 1991 10.5 6,147 10 311 2 0 1 25 32 6,483 6,515 1992 9.8 6,804 5 285 3 0 0 2 22 7,091 7,113 1993 29.6 10,171 176 331 4 0 1 35 214 10,537 10,751 1994 28.2 9,300 54 319 3 0 1 35 89 9,654 9,743 1995 41.1 9,930 5 238 0 0 0 34 48 10,202 10,250 1996 0.8 10,937 5 183 3 0 2 35 11 11,155 11,166 1997 0.2 10,700 4 232 9 0 0 41 16 10,973 10,989 1998 0.4 10,333 3 225 2 0 0 37 6 10,596 10,602 1999 0.2 9,148 7 199 1 0 0 19 10 9,366 9,376 2000 22.0 7,058 1 199 0 0 0 12 23 7,269 7,292 Sum 142.8 90,528 270 2,522 27 0 5 275 445 93,326 93,771 Mean* 14.3 9,053 27.0 252.2 2.7 0 0.5 27.5 44.5 9,333 9,377 %** 32.1 97.0 60.7 2.7 6.1 0 1.1 0.3 0.5 99.5 100.0

Proceedings of the Canadian Freshwater Aquaculture Symposium – Aquaculture Canada 2004
AAC Spec. Publ. No. 11 (2006) 175
Table 2: Walleye purchase by the Freshwater Fish Marketing Board of Canada, 1996-20003. The five year average 7.39 million pounds/year = 3,352 mt.
Source – Province (1,000 of pounds) Year AB MB NT ON SK Total 2000 94 8,903 76 41 1,094 10,208 1999 172 6,798 100 0 1,062 8,132 1998 189 4,701 119 86 1,016 6,111 1997 141 4,410 124 120 929 5,724 1996 179 5,266 104 86 1,142 6,777 Mean 155 6,016 105 67 1,049 7,390 % 2.10 81.40 1.41 0.90 14.19 100.00
*Percent of five-year average of the total column.
for the food-fish market. Why not? The answer has not been systematically examined, but my speculation is that prospective producers are not aware of the available technology to culture the fish. Some failed attempts at their culture were the result of producers not giving close attention to the unique culture environment, feed, and feeding practices needed to successfully habituate (i.e., train) pond-reared fingerlings to formulated feed, which is one of two options for obtaining fingerlings needed for on-growing to food-size. I surmise that even fewer efforts have been made to intensively culture first-feeding fry to manufactured diets. Is there sufficient information on walleye culture to establish commercial enterprises for production of food size walleye? The 1900 Manual of Fish-Culture of the US Commission of Fish and Fisheries contained a chapter on culture of “The Pike Perch or Wall-eyed Pike” for enhancement stocking (3). That manual described spawning and spawn-taking, use of “swamp muck” to prevent adhesion of eggs, egg-incubation, transportation of eggs, description of cannibalism, and prey selectivity by first feeding fry when lake water containing zooplankton was used as the water supply. By 1948, public hatcheries of 44 States and the US Fish and Wildlife Service distributed 596.4 million “wall-eyed” pike, 79.6 million “yellow pike-perch”, and 485.4 million “unclassified” pike-perch (4). Assuming that they were all walleye, the total was 1.16 billion fry. That level of production persisted through production years 1983-84 which indicated a similar number of fry were stocked annually by state, federal and provincial agencies in the US and Canada (5).
Thus, there exists 100 years of practical experience by fish culturists in the US and Canada, and an expansive body of scientific literature on the biology and culture of walleye. There is a culture manual for pond-culture of walleye based on practices of the White Lake Fish Culture Station in eastern Ontario (6) and a comprehensive Walleye Culture Manual (7) with 84 authors, including three case studies from Canada (8,9,10). In the US commercial culture of walleye is well established for production of fry and fingerlings for enhancement stocking but not for the food-fish market. In spite of the potential, there has been limited commercialization of food-fish culture. The objective of this paper is to provide a brief summary of the state of the art of cultural technology for intensive culture of first feeding walleye with manufactured feed, and the habituating of pond-reared fingerlings to formulated feed. Once habituated to formulated feed, walleye can be raised to food size in a controlled environment (i.e., recycle systems) at a temperature ≥ 20°C to permit year-around growth. High density fin-fish culture in flowing water systems, using single-pass (once use), serial reuse (stair-step raceway system), or recycle systems are collectively referred to as intensive culture. High density is achieved by using a high exchange rate of freshwater or recycled water to supply oxygen and remove metabolic wastes. For walleye, intensive culture is used in standard rectangular raceways to habituate pond-reared, phase I fingerlings to fall fingerling, and circular tanks for intensive fry culture. Traditional single-pass and serial reuse systems that are standard fare for salmonid culture will not be appropriate for

Proceedings of the Canadian Freshwater Aquaculture Symposium – Aquaculture Canada 2004
176 AAC Spec. Publ. No. 11 (2006)
walleye because water temperature of most groundwater sources is too cold. Recycle systems generally provide temperature to enhance growth rates to meet production schedules for fish of different size, and extend the growing season. Certainly, advancing the spawning season from April to late January requires an indoor environment for fry culture; fry cannot be stocked in ice-covered ponds. Intensive culture is the only technology that can be used to raise fry produced by out-of-season (early) spawning. In nature, the growing season for pond culture of walleye ends when pond water temperatures are less than 15°C. The short growing season throughout most of the northern tier states of the US, from New York to the upper Midwest, including Iowa, and most of Canada makes it impractical to produce a food fish by pond culture because they will not reach market size until sometime in the third summer (11). Moode and Mathias (12) described a recycle system for intensive culture of larval walleye on formulated feed at a site near Winnipeg, Manitoba, and Summerfelt (13) detailed engineering design of a recycle system used for raising food size walleye in 14 to 16 months (14). The advantages of intensive culture of fry to fingerling size is that it “closes” the production cycle, in that all aspects of culture can be done indoor. Intensive Culture of Fry (Larviculture) Intensive fry culture is a viable production technology to produce walleye fingerlings, using either a phased feeding strategy starting with brine shrimp nauplii and then weaning to manufactured feed with a single-pass flow-though system (14) or exclusively with formulated feed in a recycle system (9,12). To prevent developing a long list of references, I acknowledge that many persons have contributed to the development of this cultural technology. The scholar will find an abundance of citations to original sources in the Walleye Culture Manual (15) and two previous reviews (16,17). Intensive larval culture of walleye to a 30- or 60-day posthatch fingerling requires careful attention to details of culture system, light, turbidity, temperature, feed and feeding, and tank hygiene:
o Culture tanks: size, shape, and colour. o Screens o Surface sprays o Aeration and pumping o Light and temperature
o Turbid water culture o Stocking o Feeds, feeders and feeding o Tank hygiene o Water quantity and quality
Culture Tanks Many tank shapes have been investigated for fry culture. At first, the emphasis was on designs to produce an upflow pattern to keep fry in suspension with the use of a tank-within-a-tank design, a basket within a tank design, a cubical shaped tank designed to keep the feed in suspension and maintain a high density of feed particles, and a trough-shaped tank with an upwelling current. However, the conventional rectangular fiberglass raceway or cylindrical (circular) fiberglass tanks are preferred because they are already on hand in most hatcheries and they work as well or better than other types. Clinging of fry to the sidewalls of the tank is a problem affecting success of the culture system. This problem is influence by tank size, colour of the tank walls, overhead light intensity, and turbidity. Until they are 30-40 days posthatch, fry are strongly attracted to light, direct or reflected light, and because of this behavior, they will cling to the tank sidewalls and light-coloured screens. They are even attracted to the bottom of the tank in a tank with black sides but light bottom. Some studies report improved larval dispersal in tanks with gray walls compared with tank with white, yellow or green walls. A diffuse light source and a flat black or gray tank colour are helpful to reduce reflection of the light from the tank walls. Colesante (18) reports that darkened sides of the rearing tanks minimizes clinging behavior and use of high-intensity lights help achieve uniform distribution of fry, and attract the fry to the surface to aid in the process of gas bladder inflation. Tank size also influences clinging behavior. A greater percentage of the stock clings to the sides of smaller than larger tanks because the lateral area (m2) per unit of tank volume (m3) of tanks walls of smaller tanks is larger than that of larger tanks. Also, in culture water with low turbidity (<10 NTU), the distance from tank sidewalls to locations in the tank away from the sides will increase beyond the reaction distance of the fish and a smaller percentage of the population will be attracted to the tank surfaces. A 680-L tank (123 cm across the top, and 109 cm across the bottom, and 76 cm deep), is a desirable size for production scale facilities, although smaller (280-L) tanks work well for experimental purposes.

Proceedings of the Canadian Freshwater Aquaculture Symposium – Aquaculture Canada 2004
AAC Spec. Publ. No. 11 (2006) 177
Screens The drain must be equipped with a screen with mesh small enough to retain the fry. In the first 21-d posthatch, a mesh with 0.704 mm (0.7 mm) width of opening and 44.2% open area is small enough to retain most fry, but fry produced by out-of-season spawning and the fry of hybrid walleye are small enough to pass through a 0.704 mm mesh. After 21 days posthatch, however, the mesh size should be increased to 1 mm with 58% open area to improve effluent flow. Feed for first feeding larval walleye will be small enough to pass through mesh. A 400-µm feed (particle range 240-675 µm) and brine shrimp nauplii (200 to 250 µm) will pass through the smallest mesh needed to retain fry. If brine shrimp nauplii are used, screen openings may need to be 200 µm to reduce losses. Surface Sprays Gas bladder inflation (GBI) was typically poor (<25%) until it was discovered that a spray of water to the surface would enhance gas bladder inflation. Generally, 100% of fish reared in tanks with suitable sprays will have an inflated gas bladder. The spray removes the oil film and cleans the surface of feed and debris. In circular tanks with a circular flow pattern, the water passes under the spray head with each revolution of the water mass. The critical volume of flow needed for an effective spray has not been determined, but a flow rate of 0.5 to 1.0 L/min through the spray head is suggested. It is important that the spray impacts the water surface with enough force to produce a slight depression in the water under the spray. One spray per 5,000-cm2 of tank surface is adequate. Also, spray-paint light-coloured spray nozzles black to reduce the fry attraction. Aeration and Pumping Degassing and aeration of the water supply should be done before the water is delivered to the culture tanks. The water supply should never have more than 105% total gas pressure or a delta P of more than 10. Compressors should not be used to aerate water destined for use in intensive culture of fry because they will contaminate the air with oil. Oil-contaminated air bubbled through water will transfer the oil to the water, which will rise to the surface and interfere with gas bladder inflation. In some hatcheries, an air line is placed around the center standpipe to keep fry from being impinged on the screen but a column of rising air
bubbles in fry culture tanks may cause undesirable turbulence, and fast rising air bubbles will even throw fry out of the water where they will stick to the side walls above the water line. Light and Temperature Fluorescent lights, flood lamps, and natural light at intensities of 100 to 700 lx (lux) are acceptable. Colesante (18) used 680 lux at the water surface; and Moore recommended 500 lux. Diffuse lighting is recommended to distribute fry and to deter fry from clinging to the sides of the tank. The minimum water temperature should be 12.8°C (18). Generalizing, an ideal temperature range may be 15.6-18.4°C, with 18.4°C optimum, but. Moodie and Mathias (12) maintained a temperature of 20°C throughout the 30-d fry rearing interval. A sudden increase of 5°C for 24-h when fry were 5 d posthatch may stimulate fry to accept the manufactured feed (19). Turbid Water Culture Tank colour is less important when using turbid water, the optical property of water that causes light to be scattered and absorbed rather than transmitted in straight lines. In nature, turbidity is caused by suspended inorganic matter (clay, silt, finely divided organic matter), soluble organic compounds, and phytoplankton. Some hatcheries have naturally turbid water (≥ 15-25 NTS) from colloidal clay (particle sizes ≤2 mm) that was not removed by rapid sand filtration. If finely filtered lake water, ground water, or tap water is used as a water supply, clear water may be a problem. Artificial turbidity is achieved by addition of a small volume of a clay slurry every 20 minutes. In turbid water, clinging behavior is avoided, and survival and growth are substantially improved. In turbid water, larvae start feeding sooner, and their weight at 21 to 30 d posthatch is 200 to 300% larger than weight of fry raised in clear tanks. In several comparisons of larval performance in clear and turbid culture, the clinging behavior of walleye to the sidewalls of the culture tanks was greatly reduced or eliminated in turbid water and the fish in turbid water grew substantial faster than fish in clear water. Stocking Density Fry for stocking should be from those collected in the fry catch-tank that hatched within a short time interval, preferably within 12 hours, but not more than 24 hours because age differences result in size differences that increase cannibalism. Fry

Proceedings of the Canadian Freshwater Aquaculture Symposium – Aquaculture Canada 2004
178 AAC Spec. Publ. No. 11 (2006)
that hatched within a 24-hour interval should be placed in the culture tank with low water flows (0.5 exchange rate). Feeding is not required and it is undesirable until fry are at least 3-4 d posthatch. Stocking density (number of fry/L) for large-scale production of walleye fry in intensive culture varies from 20/L for fry started on brine shrimp (20) to 40 (16) to 56 (18) for fry fed manufactured feed. Stocking densities of 80 to 100/L are possible but at high density, problems with cannibalism, poor water quality, and disease (bacterial gill disease and columnaris disease) are greater. Total yield per tank may be greater but percent survival is lower at higher densities. Feeds, Feeders, and Feeding Feed size, shape, colour, texture, density and ingredient composition are all important factors affecting acceptability. Starter diets for walleye have been the open formulations of WS-9501(19), and a year-to-year update (WS-9701, WS-9702, WS-9801, WS-9802, WS-9901, WS-2000, WS-0101, WS-0102, WS 0201)(19), and several commercial feeds (Biokyowa, Lansy, and Gemma). The Biokyowa (Kyowa Hakko Co., Ltd., Japan) Fry Feed Kyowa (FFK) B-series (B-400 and B-700) feeds (previously available from Biokyowa Inc., Chesterfield, Missouri) was used by more investigators than any other formulated feed for first-feeding fry until the US FDA prohibited importing animal feeds from Japan following a few cases of BSE (bovine spongiform encephalopathy) in Japanese dairy cattle. It was also expensive therefore a “phase” feeding strategy was often followed. Fry were started on FFK-B series (B-400), followed by either the B-700 or C-700 but eventually weaned to the W-16 (17). In the absence of FFK, the WS 0201 (a modification of the WS 9801 described by Barrows and Lellis (19) and manufactured by “marumerization”) has yielded 40% survival compared with 51% with FFK-B in a 26-d feeding trial (21). However, Barrows, located at the Bozeman Fish Technology Center, Bozemena, Montana, is no longer making the feed. In the absence of Barrows’ diets and FFK, the best commercial starter diet tried so far is the Gemma feed from Skretting (22) but further evaluation of that and other commercial diets is still underway. Starter diets for walleye have been judged by performance tests using survival, growth, and occurrence of deformities at 26-30 days posthatch. Performance tests compared WS series with the Biokyowa feed for fry produced from regular season spawns and early spawns (19). Setting
aside the data derived from early spawned fish, I used their data for a six-year interval to calculate the mean survival and fish length for the WS and Biokyowa fed fish. The mean survival was 61.1% for Biokyowa and 50.2% for WS, and mean length (mm) was 24.7 and 17.4 for Biokyowa and WS groups respectively. Statistically, the difference in survival was not significant, but length differences were. The survival demonstrates that the formulations and manufacturing process for the WS diets provide an effective diet, hoever lacking in energy or other growth factors. The fact that they survived on the starter diet means that they are still in the tank and they may be weaned to a better grow-out diet. Fish feeders found at most hatcheries are not sufficiently precise for feeding small quantities of fry feed accurately and consistently to prevent food deprivation or excessive feeding and tank fouling. Scraper, vibrator and belt feeders have been used but the amount of feed the feeders dispense at each feeding is not regulated with accuracy or consistency. Custom made, precision feeders that deliver feed accurately and consistently are needed as well as an electronic timer that can be set to turn on every 5-minutes for a few seconds. Feeding rates and feeding frequency are important for successful fry culture. Feed should be offered at 3-5 min intervals at least 22-h/day. Feeding should only be stopped to clean the tanks, which must be done daily. Survival has been poor when feeding was stopped for more than 6-h per day. Tables have been prepared on feeding rates (g/1,000 fry) and feed sizeaccording to fish age or size (16,18,19). With FFK as the starter feed, walleye grew from about 0.7 mm per day from 7.5 mm at hatch to about 27 mm at 28 days posthatch. Initial feeding rates varied from 3 to 5 g/1,000 fry to 13.6-15 g/1,000 fry when they were ≥23 mm (16,18). Moodie and Mathias (9), however, based their feeding rate on maintaining in suspension about 100 feed particles/L. Tank Hygiene Careful attention to tank hygiene is an essential component to successful fry culture. Feeding is done to excess to stimulate feeding and prevent onset of cannibalism, therefore, the tanks require daily cleaning. The daily routine includes removing the screen washing it down with a high-pressure hose, siphoning feed from the bottom of the tank, and with the water level lowered, wiping the sidewalls to remove biofilm. Development of

Proceedings of the Canadian Freshwater Aquaculture Symposium – Aquaculture Canada 2004
AAC Spec. Publ. No. 11 (2006) 179
water fungus was a serious problem with use of the FFK feed when tank cleaning was not consistent. Water Flow Before walleye fry begin feeding, that is when they still have a yolk sac, a low exchange rate (0.5 per hour) or less is needed to maintain oxygen, but high exchange rates will exhaust the larvae as they are weak swimmers at this stage. Once feeding begins, 4-5 days posthatch, the exchange rate must be increased to maintain water quality. It must be increased to 0.75 exchanges per hour by 7 days and to 1.0 by 21-days and higher flow rates may be necessary to maintain water quality, but current velocities should not overtax the swimming ability of the larvae and deplete their energy resources. Habituating of Pond-Reared Fish to Formulated Feed Fry stocked in ponds are typically harvested in June to early July, thus, they are called summer fingerlings or phase I fingerlings. Harvest or thinning of the population is required because the supply of natural invertebrate food items runs out and because foraging on small food items is energetically inefficient. Eventually, the fingerlings (32-64 mm in length) starve or become cannibalistic. If fingerlings are to be raised in ponds to a fall fingerling, fish densities are usually reduced by a partial harvest and minnows, generally the fathead minnow (Pimephales promelas), are added weekly at 20 to 28 kg/ha (18 to 25 lb/acre) to provide forage (22). If sufficient fish forage is available, the fingerlings may grow to 200-250 mm by fall, however, it is generally uneconomical to produce phase II fingerlings in this manner. It is a challenge to a fish culturist or researcher to say that walleye cannot be habituated to manufactured feed in ponds, but in practice, it is not done. In fact I do not know of a single reference to substantiate this practice. Thus, typically, fall fingerlings are produced in intensive culture by harvesting the phase I fingerlings from ponds, transferring them to indoor facilities then habituating the fingerling to formulated feed. The cultural technology for this practice has evolved over 30-years. Poor survival results from a combination of handling stress, disease, lack of feed acceptance, and cannibalism (23). Under
optimum circumstances, when environmental conditions are right, meaning low light intensity or in tank lighting and a good training feed, then small (35-70 mm, 1.4-2.7 inch) pond-reared fingerlings can be habituated to manufactured feed. Thereafter they can be raised to about 150-200 mm (6-8 in) in 120-130 days at ambient water temperature in raceways of single-pass flowing water systems The cultural technology for habituating walleye to formulated feed requires good water quality, temperature suitable for growth, low light, modest stocking density, appropriate feed, feeding rates and frequency and disease control (24). Temperature Many public agencies use raceways and single-pass water flow systems to habituate then grow out walleye to phase II fingerling (fall fingerling) for enhancement stocking. The major constraint to flow-through culture of walleye is the requirement for an abundant supply of water to provide a suitable exchange rate to maintain water quality. Water with a temperature range of 22-25°C is desired for optimal growth (25). Unfortunately, most culture systems have limited control of water temperature. The growth rate of walleye at temperatures less than 15°C is nil and there is a significant reduction in growth between mean culture temperatures 20.8°C and 17.1°C (26). Thus, the major constraint to general use of flow-through culture is availability of sufficient water sources with desirable water temperatures. Ground water sources with temperatures of ≤15°C are too cold for growth, but may be used to cold-bank fingerling stock for future use, a practice that commercial walleye producers can use in lieu of having multiple spawns. Light Walleyes raised in hatchery raceways and tanks are skittish and easily disturbed by overhead movement and hatchery activities such as tank cleaning. In part, the problem is related to the fact that they are progeny of wild stock, but the more important factor seems related to their exceeding sensitivity to light. They have a unique retina with a reflective layer called the tapetum lucidum that makes them preadapted to nocturnal feeding at low light intensity (23). Their sensitivity to light must be blinding and cause severe stress when they are held in hatchery tanks at typical light intensity of hatchery tank rooms. However, when low (<20 lux) overhead or in tank lighting is provided,

Proceedings of the Canadian Freshwater Aquaculture Symposium – Aquaculture Canada 2004
180 AAC Spec. Publ. No. 11 (2006)
walleye of all ages are more tolerant of hatchery tanks. Nagel (27) covered rectangular troughs to eliminate stress from overhead light but with an opening in the cover to accommodate a feeder mounted over a submersed light. Density In laboratory experiments, initial stocking densities of 0.9 to 3.2 g/L of fish 2.2 to 2.6 g each had no affect on growth or survival at temperatures from 20 to 25°C for a 28-d culture interval (24). Survival during the 28-d habituation interval ranged from 65% to 85% among the treatments. In a production scale environment, Bristow (28) used an initial density of 3.2 g/L to habituate 2.0 g, 50-day posthatch, pond-reared walleye to formulated feed in 4 m3 raceways. Fish survival during the 30-day training interval varied with diet, ranging from 59.1% for fish fed FFK C-series diet to 27.9% to 30.2% for fish fed two kinds of commercial trout feeds. At the Ontario Ministry of Natural Resources White Lake Fish Culture Station, Flowers (29) reported an initial stocking density of 3.0 g/L of 0.5 to 1.0 g pond-reared fingerlings and recommended keeping fish densities below 15 g/L. Johson and Rudacille (30) described an experiment using an initial stocking density of 3.7 g/L (6,533, 0.57 g fish per m3) in 3.1m3 raceways. Survival ranged from 22.5% to 37.3% depending on diet. In 2004, with a different diet, Johnson reported (31) that with an initial stocking density of 1.83 g/L in 4.58 m3 tanks, survival was 75% and final density 11 g/L (11.1 kg/m3) through the feed-training interval. Grow out to fall fingerlings was accomplished in 106 m3 tanks stocked with 25,000, 4.54 g fish (i.e., 1.2 kg/m3). Final weight was 111 g each and final density 16.8 kg/m3. Feed The walleye conversion diet WC-9504 (17), the Kyowa C-series, and many other commercial diets (24) have been used for habituating pond-reared walleye. In some studies, standard pellets seem to be as acceptable as soft, moist pellets (24). Best results (highest survival and growth) have been obtained with the Kyowa C-series diet (27,28,29). Differences in growth with different commercial feeds during the grow-out interval after feed training are not as important as major differences in survival during the training interval.
Disease Walleye are susceptible to commonplace external protozoan parasites such as Ichthyopthirius multifilis and Trichodina spp. Formulations of formalin are approved by the FDA for treatment of external protozoans. Environmental stress is certainly a significant factor contributing to epizootic bacterial infections. Walleye are affected by common septicemia causing bacteria (Aeromonas and Pseudomonas), but they are often ignored considering the major impact of columnaris disease (Flexibacter columnaris). Columnaris infections are generally the major cause of mortality in the first week after transfer to the culture building because it often follows stress and mechanical injuries during harvest and transport of fingerling fish. Columnaris begins as an external infection when it is controlled by treatment with Diquat dibromide at 10 µL/L in a 1 hour static bath (28) or 12-18 µL/L for 2 hours in flowing water (30). Although Diquat is not an approved drug by the US FDA, it can be used as INAD (Investigational New Animal Drug). Diquat, however, is not effective after the infection becomes systemic. Oxytetracycline (Terramycin®) is an approved drug for treating systemic bacterial infections in some species but it is not registered for walleye; anyway, survival is usually poor once columnaris infection is systemic. To date, no viral infections have been found to cause epizootic mortality in walleye during culture, although infectious pancreatic necrosis and infectious haematopoietic necrosis virus have been isolated from walleye (30). Conclusions Walleye is a potential species for Canadian freshwater culture for enhancement stocking and on-growing to food size. There is a substantial body of knowledge of its biology, life history, ecology, and exploitation (31). The present, albeit brief, review of methods for larviculture and habituation of pond-reared walleye to manufactured feed is intended to be a sample of the expansive literature on aquacultural technology for walleye. For both novice and expert the Walleye Culture Manual is the standard reference, but current publications and the annual meetings of the Coolwater Fish Culture Workshop are essential for keeping current on the state-of-the-art from both practicing fish culturists and researchers. Critical research needs are for genetically improved broodstock, development of open formula diets, and an approved

Proceedings of the Canadian Freshwater Aquaculture Symposium – Aquaculture Canada 2004
AAC Spec. Publ. No. 11 (2006) 181
chemotherapeutant or a vaccine for treatment of columnaris disease. Long-term, the viability of commercial walleye culture requires development of genetically selected broodstock. Typically, captive broodstock on farms have already been subjected to accidental genetic selection, thus, a captive stock does not imply that it has the most desirable traits for domestication, only that it is captive. Given that the generation time is at a minimum of three years for females, conventional genetic improvement will require maintaining many families of selected stocks for two to three generations, a situation rarely possible at the early stage in development of a new aquaculture species. There really is no “industry”, to call upon to do the job; there is only a handful of small producers and often they are too competitive to collaborate on a six to ten year project. Thus, real progress in genetic selection will require long-term governmental support for a facility, staff and trained geneticists. Second in importance is the development of open formula diets for all life stages; namely, starter diets, diets for habituating pond-reared fingerlings to formulated feed, fingerling diets, grow out diets, and diets for captive broodstock. Yes, there are commercial diets that can grow walleye, but feed manufacturers merge, drop products, and change formulations. The withdrawal of the Biokyowa B- and C- series diets has caused a major setback for intensive larviculture of walleye. Although some alternative commercial diets have promise, it is a search for a moving target. There is a better way. Canadian universities have an excellent history of diet research and development for salmonids and other species. Efficient, economical diets would be quickly forthcoming if they build upon the existing open formulations in the US by F. T. Barrows (17). Vaccines and chemotherapeutants are needed to prevent and treat columnaris disease. The registration process for chemotherapeutants is expensive and protracted, therefore, with common needs across our borders, there should be coordinated effort. Recently, Le François et al. (32) carried out a survey to determine the biological, technical and economic feasibility of different candidate marine fish species (it did not include walleye) that could have aquaculture potential under Québec environmental conditions. Their list of six selection criteria for assessing aquaculture
potential of a species seems relevant to freshwater of walleye culture. Briefly annotated, their list includes: 1) marketability (no doubt, walleye already has a large market in the Canada, the US and Europe), 2) food requirement (use of manufactured food), 3) reproduction (walleye are fecund fish, easily stripped of gametes), 4) optimal growth temperatures (walleye requirements fall in the lower score, higher scores go to fish requiring lower temperatures), 5) maximum size reached (walleye fit desired size maximum size ≥ 25 cm), and 6) economic feasibility (walleye are in the category of market value greater than CDN$2/kg. References 1. Scott WB, Crossman EJ. 1973. Freshwater
Fishes of Canada. Bulletin 184, Fisheries Research Board of Canada, Ottawa.
2. http://www.freshwaterfish.com/english.htm 3. US Commission of Fish and Fisheries. 1900.
A Manual of Fish-Culture, rev. ed., p. 165-179, Washington, D.C.
4. Tunison AV, Mullin SM, Meehean OL. 1949. Prog. Fish-Cult. 11: 253-262.
5. Conover M. C. 1986. In, Fish Culture in Fisheries Management (RH Stroud, ed), p. 31-39, American Fisheries Society, Bethesda, Maryland.
6. Richard PD, Hynes J. 1986. Walleye Culture Manual, Ontario Ministry of Natural Resources, Fish Culture Section, Toronto, ON.
7. Summerfelt RC, ed. 1996. Walleye Culture Manual, North Central Regional Aquaculture Center, Iowa State University, Ames, IA, USA. 415 pp.
8. Flowers DD. 1996. In, Walleye Culture Manual (RC Summerfelt, ed), p. 123-128, North Central Regional Aquaculture Center, Iowa State University, Ames, IA, USA.
9. Moddie GEE, Mathias JA. 1996. In, Walleye Culture Manual (RC Summerfelt, ed), p. 187-190, North Central Regional Aquaculture Center, Iowa State University, Ames, IA, USA.
10. Flowers DD. 1996. In, Walleye Culture Manual (RC Summerfelt, ed), p. 213-214, North Central Regional Aquaculture Center, Iowa State University, Ames, IA, USA.
11. Bushman RP. 1996. In, Walleye Culture Manual (RC Summerfelt, ed), p. 261-266, North Central Regional Aquaculture Center, Iowa State University, Ames, IA, USA.
12. Moodie GE, Mathias J.A., Loadman NL. 1992. Aquacul. Eng. 11: 171-182.
13. Summerfelt ST. 1996. In, Walleye Culture Manual (RC Summerfelt, ed), p. 277-310,

Proceedings of the Canadian Freshwater Aquaculture Symposium – Aquaculture Canada 2004
182 AAC Spec. Publ. No. 11 (2006)
North Central Regional Aquaculture Center, Iowa State University, Ames, IA, USA.
14. Summerfelt ST, Summerfelt RC. 1996. In, Walleye Culture Manual (RC Summerfelt, ed), p. 215-230, North Central Regional Aquaculture Center, Iowa State University, Ames, IA, USA.
15. Summerfelt RC. 2000. In, Encyclopedia of Aquaculture (RR Stickney, ed), p. 970-985, John Wiley, New York.
16. Summerfelt RC. 2004. In, Aquaculture in the 21st Century (AM Kelly and J Silverstein). American Fisheries Society, Bethesda, MD.
17. Moore A. 1996. In, Walleye Culture Manual (RC Summerfelt, ed), p. 195-197, North Central Regional Aquaculture Center, Iowa State University, Ames, IA, USA.
18. Colesante RT. 1996. In, Walleye Culture Manual (RC Summerfelt, ed), p. 191-194, North Central Regional Aquaculture Center, Iowa State University, Ames, IA, USA.
19. Barrows FT, Lellis WA. 1996. In, Walleye Culture Manual (RC Summerfelt, ed), p. 315-321, North Central Regional Aquaculture Center, Iowa State University, Ames, IA, USA.
20. Summerfelt RC. 1996. In, Walleye Culture Manual (RC Summerfelt, ed), p. 161-186, North Central Regional Aquaculture Center, Iowa State University, Ames, IA, USA.
21. Johnson A, Rudacille J, Moore A. 2003. Coolwater Fish Culture Workshop, Des Moines, Iowa, p. 104-105, Iowa Dept. Nat. Res., Des Moines, IA
22. Skretting Canada, http://www.skretting.ca. East Coast Office, 46 Moore-Clark Drive, Bayside NB E5B 3T5, Canada
23. Jorgensen WD. 1996. In, Walleye Culture Manual (RC Summerfelt, ed), p. 151-152, North Central Regional Aquaculture Center, Iowa State University, Ames, IA, USA.
24. Moore GA. 1944. J. of Comparative Neurology 80:369-379.
25. Kuipers KL, Summerfelt RC. 1994. J. Appl. Aquacul, 42(2): 31-57.
26. Hokanson KEF, Koenst WM. 1986. Progr. Fish-Cult. 48:90-94.
27. Nagel T. 1996. In, Walleye Culture Manual (RC Summerfelt, ed), p. 205-207, North Central Regional Aquaculture Center, Iowa State University, Ames, IA, USA.
28. Bristow BT. 1996. In, Walleye Culture Manual (RC Summerfelt, ed), p. 209-212, North Central Regional Aquaculture Center, Iowa State University, Ames, IA, USA.
29. Flowers DD. I996. In, Walleye Culture Manual (RC Summerfelt, ed), p. 213-214, North Central Regional Aquaculture Center, Iowa State University, Ames, IA, USA.
30. Johnson A, Rudacille J. 2003. Coolwater Fish Culture Workshop, Des Moines, Iowa, p. 106-110, Iowa Dept. Nat. Res., Des Moines, IA
31. Johnson A. 2004. Personal communication. Iowa Department of Natural Resources, Rathbun Research Facility, Moravia, Iowa.
32. Le François NR, Lemieux H, Blier P, Levesque M. 2001. Aquacul. Assoc. Canada Spec. Publ. No. 4: 31-33.

Proceedings of the Canadian Freshwater Aquaculture Symposium – Aquaculture Canada 2004
AAC Spec. Publ. No. 11 (2006) 183
Pathways to Privatization of Fish Stocking Duane S. Radford 940 Wallbridge Place, Edmonton, Alberta, Canada T6M 2L7 This paper explores pathways to privatization of fish stocking in Canada relative to trends in recreational fishing, perceived demands and (potential) opportunities. Also, addressed are political constraints and financial implications, as well as regulatory issues. On a jurisdictional basis, only Alberta and Québec have some degree of privatization of fish stocking. Greater opportunities will hinge on political support and additional financial resources, both of which will present challenges in the face of government cutbacks in agencies responsible for fisheries management across Canada. There are other potential issues, such as the recent formation of the Freshwater Fisheries Society of BC and whether their mandate will mesh with privatization pathways. It is possible that the aquaculture industry could resolve at least some of these issues by forming partnerships with government and organizations such as the Freshwater Fisheries Society of BC, after exploring how it might best position itself to address unsatisfied public sector recreational fishing demands. Because this is a potentially politically sensitive issue, it is recommended that the privatization issue be addressed cautiously, in stages. There has to be meetings between government and industry at the onset to clearly establish privatization goals to test political support. However, the process should be transparent to gauge how industry can best service fish stocking requirements. The bottom line may well rest with the economic acid test – can industry provide privatized fish stocking on a sustained basis cheaper than government? This is a very real issue in light of the start-up cost(s) of government hatcheries in Canada and staffing issues. Introduction The Canadian aquaculture industry has expressed an interest in diversifying its market into private fish stocking. Only Alberta and Québec have some degree of privatization of fish stocking at the present time. Greater opportunities will hinge on political support and additional financial resources, both of which will present challenges in the face of government cutbacks in agencies responsible for fisheries management across Canada. There are other potential issues, such as the recent formation of the Freshwater Fisheries Society of BC which is independent of government and currently responsible for fish stocking in BC, and whether their mandate will mesh with privatization pathways. Traditionally, private fish hatcheries in Canada have primarily supplied private fish farmers only and have also been involved with somewhat limited commercial sales of rainbow trout. Stocking of public water bodies is seen as a
potential growth area by the aquaculture industry; however, there are few examples in Canada where this has been done on a large scale as the various levels of government have taken on this role due to their legislative mandate to manage fisheries. Survey of Recreational Fishing in Canada The 2000 Survey of Recreational Fishing in Canada collected information about recreational fishing in Canada for the year 2000 to assess the economic and social importance of recreational fishing to the provinces, the territories and the country as a whole (1). The 2000 survey was the sixth in a series of surveys undertaken at 5-year intervals since 1975. Results from this and previous surveys can be found on the Department of Fisheries and Oceans (DFO) national website. In 2000, 3.6 million licenced anglers participated in recreational fishing in Canada. This represents a

Proceedings of the Canadian Freshwater Aquaculture Symposium – Aquaculture Canada 2004
184 AAC Spec. Publ. No. 11 (2006)
steady decline from 4.2 million in 1995. Despite this decline, the number of non-Canadian anglers visiting Canada in 2000 actually increased by 25,000 compared with 1995. The 3.6 million anglers caught 233 million fish of all species, of which only 84.6 million (or 36.4%) were kept. Recreational fishing is an important economic activity. In total, anglers spent $6.7 billion in Canada in 2000. Of this amount, $4.3 billion was directly associated with recreational fishing. Anglers also spent over $2.4 billion on trip expenses such as package deals, accommodations, food, transportation, fishing supplies and other services directly related to their angling activities (Figure 1).
Direct Expenditures of $2.4 billion attributable to fishing in 2000.
Food and lodging
33%
Package value21%
Services8%
Other expenses0%Fishing supplies
7%
Transportation31%
Figure 1: Direct expenditures of $2.4 billion attributable to fishing in 2000 (courtesy of Evan Thomas Consulting Services). Investments in 2000 totaled close to $4.3 billion for durable goods such as fishing equipment, boats, motors, camping equipment, special vehicles and real estate. Anglers estimated that almost $2.3 billion of these investment expenditures were wholly attributable to recreational fishing (Figure 2).
Major fishing investments of $4.3 billion in 2000.
Special vehicles40%
Fishing equipment5%
Camping equipment
11%
Boating equipment23%
Other purchases2%
Land/buildings19%
Figure 2: Major fishing investments of $4.3 billion in 2000 (courtesy of Evan Thomas Consulting Services). Compared with 1995, there was a 13.9% decrease in the number of active adult anglers. The major drop resulted in the number of resident anglers falling by 18.2%. The number of days that anglers fished dropped by 13.2% for all anglers, however, the average number of days fished remained fairly steady at 13.2 days for all anglers and at 15.3 days for resident anglers. Another important result shows the number of fish caught fell by 25.4%, indicating a continuing trend among anglers to practice catch and release fishing. The largest number of resident anglers was concentrated in Ontario and Québec, but the participation rate was highest in Newfoundland and Labrador, followed by the Yukon. The 2000 survey report addresses a number of other key indicators: angler profile; fishing effort; harvest data; nonresident trip characteristics; direct expenditures; investments; and volunteer work in support of recreational fishing. Other key 2000 findings are as follows: • Participation in recreational fishing has
declined since 1985 from 4.9 to 3.6 million (26%).
• Resident anglers are down from 4.0 to 2.7
million (30%). • Non-resident anglers remain stable at
800,000. • Adult participation has fallen by 14% over the
past five years (which represents 600,000 anglers).

Proceedings of the Canadian Freshwater Aquaculture Symposium – Aquaculture Canada 2004
AAC Spec. Publ. No. 11 (2006) 185
• Average expenditures by adult anglers are up by 31% to $660.
• Total expenditures are unchanged at $2.4
billion. • Average value of investments by adult anglers
increased 63% from $724 to $1181. • Total investments by adult anglers increased
20% from $3.6 to $4.3 billion. • Total expenditures in 2000:
o Goods and services = $2.4 billion o Investments = $4.3 billion o Total = $6.7 billion o Average per adult angler = $1,840
• The percentage of Canadians that fish has
fallen as the population has grown. Manitoba is the only jurisdiction where angler numbers have increased, by 14%, angling days by 23% and expenditures by 45% since 1995. Manitoba has promoted urban fishing programs, family fishing events and tourism. Recreational Fishing: Unsatisfied Demands In 2000, a Federal-Provincial-Territorial Task Force released a survey on the importance of nature to Canadians, based largely on data collected in 1996 (2). Breakdowns were given on a provincial and territorial basis for residents of Canada, and US visitors in Canada. In all provinces, participation in fishing is only half as much as interest in the activity; 18% of Canadians 15 years of age or older fish and some 40% of Canadians have an interest in fishing based on information in the foregoing report. Because most Canadians live in urban areas, the potential for growth in recreational fishing is seen to be greatest in urban Canada. Marketing initiatives should be targeted accordingly. Secondly, because there is a huge latent demand to go fishing in Canada, marketing strategies should try to address this unsatisfied demand; in this regard the Canadian aquaculture industry might want to consider joint ventures with The Canadian Sportfishing Industry Association (CSIA) who are soon embarking on a new initiative – the Catch Fishing program.
Catch Fishing Program Catch Fishing is a national angling marketing tool which is an offshoot of National Fishing Week held annually during the first week of July, and endorsed by the provincial, territorial and governments. The Catch Fishing program arose from a Recreational Fishing Marketing Symposium – Vision 2002 – in November, 2002. CSIA has worked with Sun Media to produce a special National Fishing Week insert for a second year, in 2004. It includes regional information on where to go fishing, instructions on how to get started, and even information on how to cook your catch. There is a tribute to the late Rick Amsbury, who was the former Executive Director of the CSIA, for his vision in creating the first National Fishing Week in 2000. The CSIA are excited about this exposure as they are reaching a national audience of people who don’t already fish. This will go a long way toward increasing the profile of recreational fishing and highlighting its many benefits. Mike Melnik of Impact Communications has solicited support for National Fishing Week Public Service Announcements (PSAs) across the country. You may have heard one of these ads on the radio or seen the new PSA on your local TV station wherever you reside in Canada. Check out the new CSIA updated www.catchfishing.com website for local fishing events across the country. The Catch Fishing program is intended to promote recreational fishing all year long. A National Direction Group is in the process of reviewing submissions from various marketing firms across the country in response to a request for proposal that was put out in May, 2004. The successful firm will produce a national marketing strategy that was to be presented to the First Ministers responsible for fisheries at their conference in September, 2004. Subsequent to acceptance of the proposal by the National Recreational Fishing Task Group, each sector will be approached to determine its level of interest in participating in implementation of the strategy. It is the intention of the CSIA to have the Catch Fishing program up and running in early 2005.

Proceedings of the Canadian Freshwater Aquaculture Symposium – Aquaculture Canada 2004
186 AAC Spec. Publ. No. 11 (2006)
2004 Overview of Alberta’s Enhanced Fish Stocking Program (EFSP) The following background information was provided by Trevor Council (personal communication) on behalf of the Alberta Conservation Association (ACA) which administers Alberta’s enhanced fish stocking program. Alberta Environmental Protection initiated the EFSP in 1994 to supplement the existing Alberta government stocking program and provide private industry with market opportunities. At that time, one dollar from every licence was used for privatization initiatives in the aquaculture industry – a new $1 fee was added as a surcharge to angling licences to pay for the privatized fish stocking program. The program was started in 1995 after lobbying by the Alberta Fish Farmers Association (AFFA) and Alberta Agriculture (Aquaculture Section). The program was initiated to provide larger trout for put-and-take ponds, and thereby produce a better return for the angler. The AFFA predicted that they could produce these fish cheaper than the provincial fish culture system. The ACA assumed responsibility of the EFSP in 1998 when it was established as a Delegated Administrative Organization by the Alberta government. A total of 81 ponds were stocked with 144,000 rainbow trout (20 cm) through 10 contracts. The majority of the stockings occurred in the Southern and Northeast regions (primarily east of Hwy #2). All water bodies were put-and-take ponds that frequently winter killed and required less than 6,000 rainbow trout. In addition, all water bodies were outside the Green Zone in the western and northern area of Alberta (home to native trout) to prevent interaction with native stocks. The stocked water bodies provided an enhanced opportunity to catch rainbow trout (Onchorhyncus mykiss) throughout the province. In 2000, the number of rainbow trout stocked was reduced to 131,300 due primarily to an increase in price per rainbow trout by private industry. The number of stocked rainbow trout from the program has been maintained at this level through 2004. Contracts are awarded annually through a bid process, 1.5 years prior to stocking so that the private growers have sufficient time to plan, obtain stock and grow fish. The required minimum size of the rainbow trout at stocking is 20 cm and a penalty system is in place to deter growers from
stocking small rainbow trout. Generally, 5 to 7 growers are awarded contracts annually. No growers are allowed more than 3 contracts in a particular year. 2004 Summary A total of 131,300 rainbow trout (20 cm) were contracted to 5 private growers for delivery to 67 water bodies in 2004. Some water bodies received 2 stockings. Cost per rainbow trout ranged from $1.61 to $1.74 in 2004/2005 (average $1.66). Total annual cost has ranged from $210,000 to $250,000 from 1998 to 2004. Québec’s Privatized Fish Stocking Program A summary of private fish stocking highlights in Québec has been provided in a personal communication from Stephane Blanchet, based on a partial translation of a document (Ensemencement Marche Oxygene 1998.doc) at the following web site: http://www.agr.gouv.qc.ca/pac/publications/documents/stped_doc_info/doc_02/index.html Key points are as follows: • Value of the industry (overall): over $10
million annually. • Production tonnage for stocking: 1136 tons. • Species: brook trout (Salvelinus fontinalis),
represents 89% of market share; buyers prefer fish for put-and-take fishing at least 8” long (except in Controlled Zones – Zecs – 5-7” fish).
• For rainbow trout, 29% of the total production
in 1996 was sold for stocking. • The proportion of fish sales by types of
buyers: o Outfitters – 43% o Fishing ponds – 23.4% o Associations and clubs – 13.4% o Private lakes – 8.4% o Zecs – 7.2%

Proceedings of the Canadian Freshwater Aquaculture Symposium – Aquaculture Canada 2004
AAC Spec. Publ. No. 11 (2006) 187
• Approximately 140 private hatcheries provide fish for private sales, based on a free market pricing system.
Political Challenges It is necessary for the aquaculture industry to take a united stand in approaching government with respect to any private fish stocking initiatives, at either the provincial, territorial or federal levels (working either independently or collectively). While inland provinces are responsible for fisheries management (and aquaculture) within their borders, the department of Fisheries and Oceans has authority over Canada’s oceans and their fisheries. Members of the provincial aquaculture executive should consider approaching their local MLA or MPP and request a meeting to discuss their concerns, and then ask their local MLA or MPP to solicit a meeting between members of their executives and the Minister(s) responsible for fisheries either provincially, at the territorial level, or federally. This may require meeting with more than one Minister in some jurisdictions where the agriculture departments may be involved with administering local aquaculture programs, while the department responsible for fisheries has overall legislative authority over local fisheries. There will be concerns related to existing infrastructure and operating costs for government fish hatcheries, and the fact that many of these (often separate) facilities are integrated and what happens at one may affect another, if industry is to assume a proportion of existing, ongoing provincial fish stockings. These concerns may spill over from the agency responsible for fish stocking to the department of public works (or infrastructure) largely responsible (in many cases) for actually running the hatchery (or hatcheries). This concern is largely related to the economies of scale and the need to maintain a minimum brood stock size to be economically viable. For this reason, downsizing issues weigh heavily on provincial fisheries managers because there is a need for critical staffing levels to make them functional. Union contracts and budgets to staff and operate the hatcheries must be taken into account, and make part time (or contractual) operations problematic due to the amount of red tape involved. Probably the most saleable approach is adopting the “User Pay Philosophy” for specialty situations – which will require a new levy on angling
licences unless there is unequivocal evidence that industry can do this cheaper than government, and should assume the role of government as a savings to taxpayers. This approach is seen as a win-win situation for politicians and less threatening to government employees who are concerned about their jobs, as well as their unions who are concerned about their membership. There are also public (government) concerns about fish diseases; consequently private hatcheries must be certified as being disease free in order to allay these concerns. Long-standing government fisheries staff cutbacks have created impediments to disease testing which should be addressed with the federal and provincial governments due to downsizing of laboratory staff. At the national level, DFO has the legislative mandate over fish diseases in Canada. Opportunities Probably the greatest opportunity for private sector fish stocking lies in urban areas – public or private lakes and ponds – where the demand for recreational fishing is greatest and the financial capacity is also best to support private stockings. Private Reserves – on private property – are seen as the next best private sector opportunity across Canada. The angling public in Canada will pay a fair dollar for exclusive fishing rights on lakes and ponds that provide high quality angling opportunities. The third best opportunity is seen as government-supported private stockings – of large trout, in particular – which they may or may not have the capacity to produce on a sustained basis. There is likely little to be gained by trying to compete with government for stocking of small trout, due to the economies of scale (in most cases) unless the local aquaculture industries have a very sound business plan that is financially better than the governments.

Proceedings of the Canadian Freshwater Aquaculture Symposium – Aquaculture Canada 2004
188 AAC Spec. Publ. No. 11 (2006)
Discussion There is a large unsatisfied demand for quality fishing in Canada. The Canadian aquaculture industry should not overlook opportunities for partnering with the Canadian Sportfishing Industry Association to provide trout fishing opportunities in or near urban Canada. There are other groups that aquaculture operators should approach to build alliances, not to denigrate what the government is doing, but to provide viable, cost-effective alternatives. Before additional private fish stockings are to be realized, however, it is fundamental that industry approach government for their commitment and support. References 1. 2000 Survey of Recreational Fishing in
Canada. Economic and Policy Analysis Directorate, 2003. Economic and Commercial Analysis Report No. 165: 189 pages. Published by Statistical Services. Department of Fisheries and Oceans. Ottawa, Ontario. ISSN 0843-5626.
2. 2000 Environment Canada. The Importance of Nature to Canadian: The Economic Significance of Nature-Related Activities. Federal-Provincial-Territorial Task Force on the Importance of Nature to Canadians. Environment Canada. Ottawa, Ontario. ISBN 0-662-28400-3.
