shrimp production review - global aquaculture … data include both marine and freshwater production...
TRANSCRIPT

Shrimp Production Review Diego Valderrama
Food and Resource Economics Department, University of Florida, USA
James L. Anderson The World Bank, Washington, DC
GOAL 2011
Santiago, Chile, November 6-9, 2011
GOAL 2011 Shrimp Produc4on Survey
Issues & Challenges
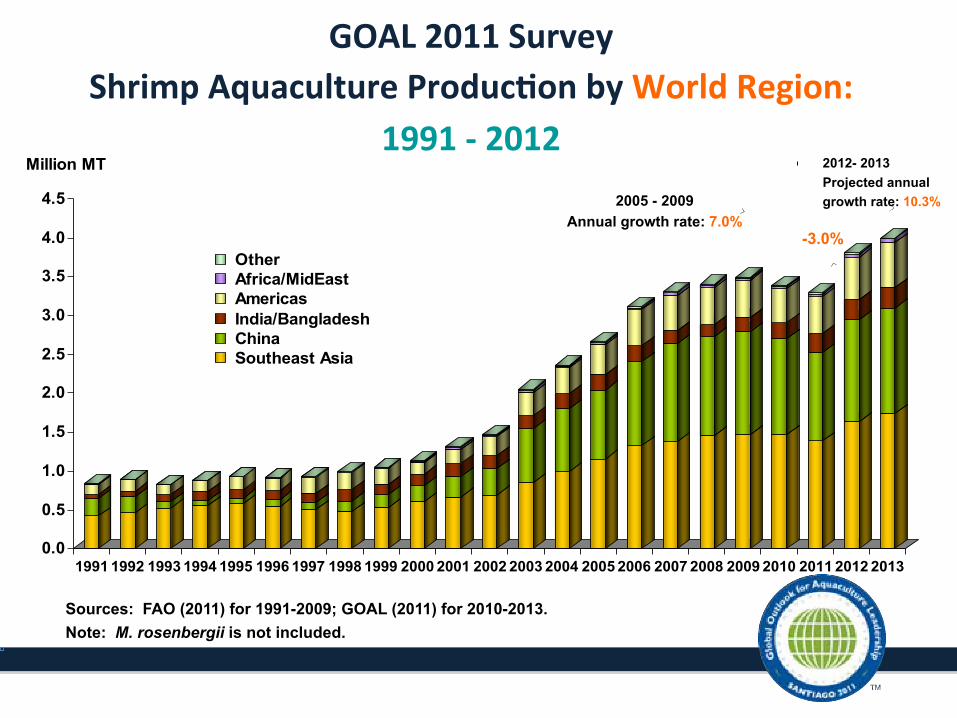
GOAL 2011 Survey Shrimp Aquaculture Produc4on by World Region:
1991 -‐ 2012
0.0
0.5
1.0
1.5
2.0
2.5
3.0
3.5
4.0
4.5
Million MT
1991 1992 1993 1994 1995 1996 1997 1998 1999 2000 2001 2002 2003 2004 2005 2006 2007 2008 2009 2010 2011 2012 2013
Other Africa/MidEast Americas India/Bangladesh China Southeast Asia
Sources: FAO (2011) for 1991-2009; GOAL (2011) for 2010-2013. Note: M. rosenbergii is not included.
2005 - 2009 Annual growth rate: 7.0%
2012- 2013 Projected annual growth rate: 10.3%
-3.0%
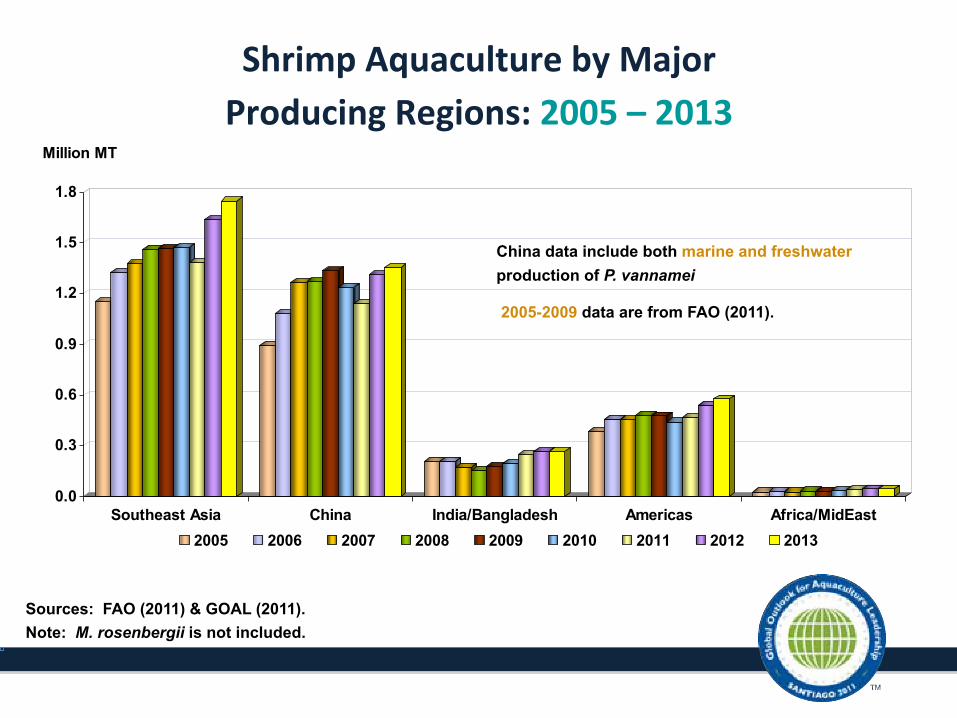
Shrimp Aquaculture by Major Producing Regions: 2005 – 2013
Sources: FAO (2011) & GOAL (2011). Note: M. rosenbergii is not included.
0.0
0.3
0.6
0.9
1.2
1.5
1.8
Million MT
Southeast Asia China India/Bangladesh Americas Africa/MidEast 2005 2006 2007 2008 2009 2010 2011 2012 2013
2005-2009 data are from FAO (2011).
China data include both marine and freshwater production of P. vannamei
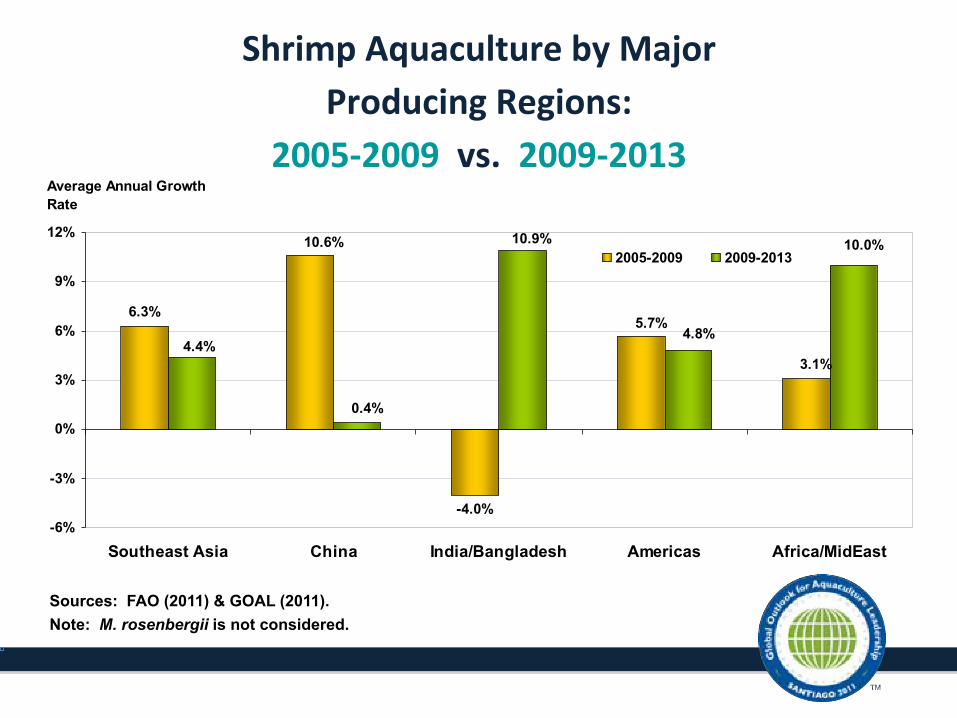
Shrimp Aquaculture by Major Producing Regions:
2005-‐2009 vs. 2009-‐2013
Sources: FAO (2011) & GOAL (2011). Note: M. rosenbergii is not considered.
6.3%
-4.0%
5.7%
3.1%
10.6% 10.9% 10.0%
4.8%4.4%
0.4%
-6%
-3%
0%
3%
6%
9%
12%
Southeast Asia China India/Bangladesh Americas Africa/MidEast
Average Annual Growth Rate
2005-2009 2009-2013
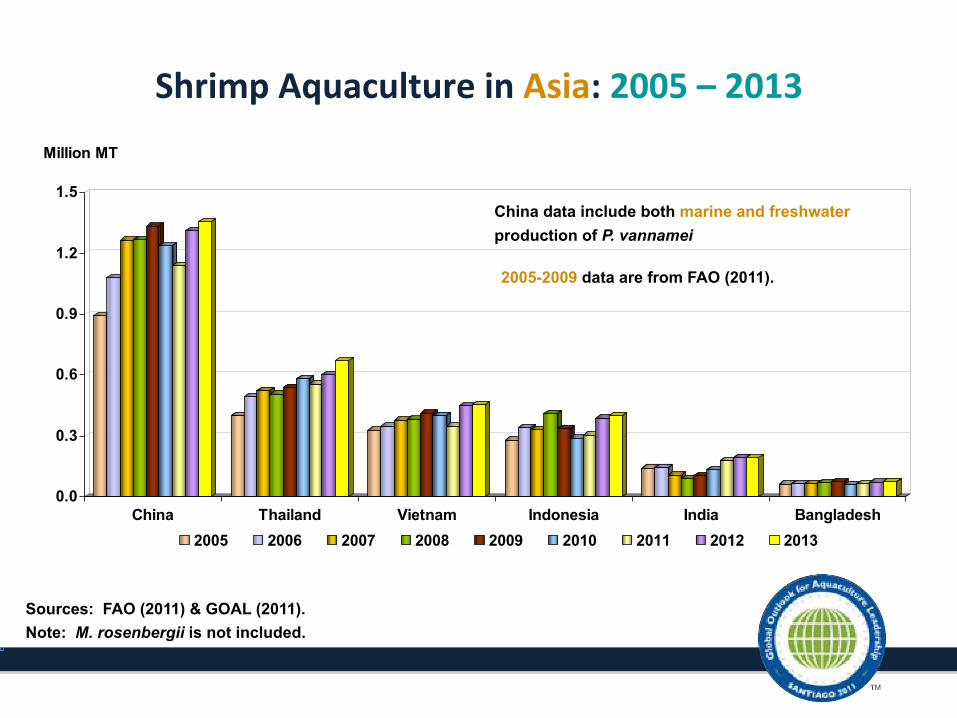
Shrimp Aquaculture in Asia: 2005 – 2013
Sources: FAO (2011) & GOAL (2011). Note: M. rosenbergii is not included.
2005-2009 data are from FAO (2011).
China data include both marine and freshwater production of P. vannamei
0.0
0.3
0.6
0.9
1.2
1.5
Million MT
China Thailand Vietnam Indonesia India Bangladesh2005 2006 2007 2008 2009 2010 2011 2012 2013
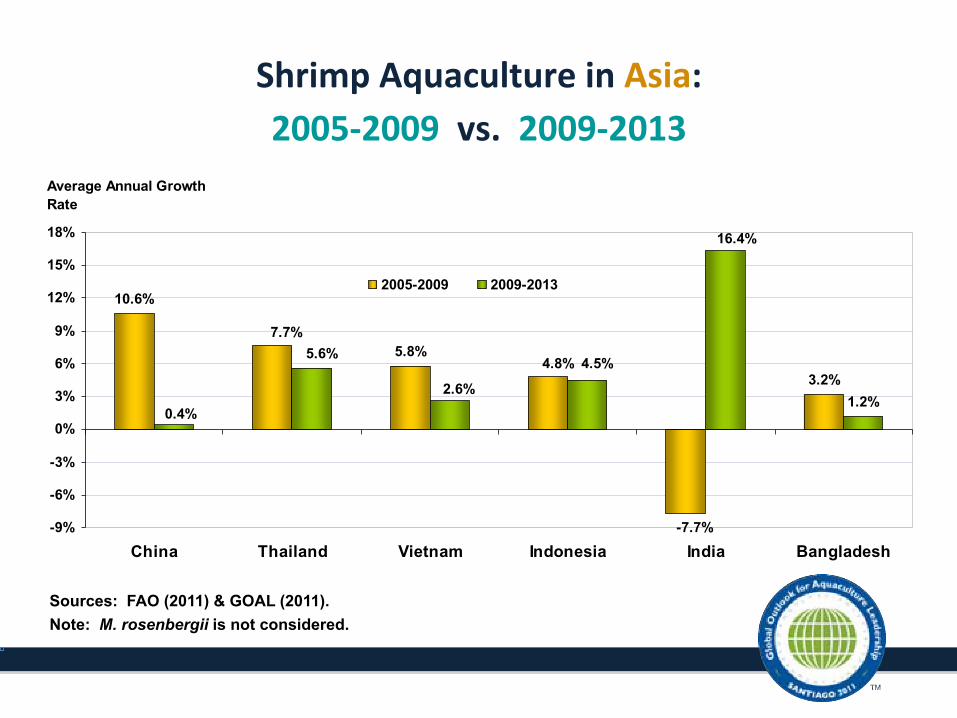
Shrimp Aquaculture in Asia: 2005-‐2009 vs. 2009-‐2013
Sources: FAO (2011) & GOAL (2011). Note: M. rosenbergii is not considered.
10.6%
5.8%
3.2%1.2%
4.8%
-7.7%
7.7%
2.6%
16.4%
4.5%
0.4%
5.6%
-9%
-6%
-3%
0%
3%
6%
9%
12%
15%
18%
China Thailand Vietnam Indonesia India Bangladesh
Average Annual Growth Rate
2005-2009 2009-2013
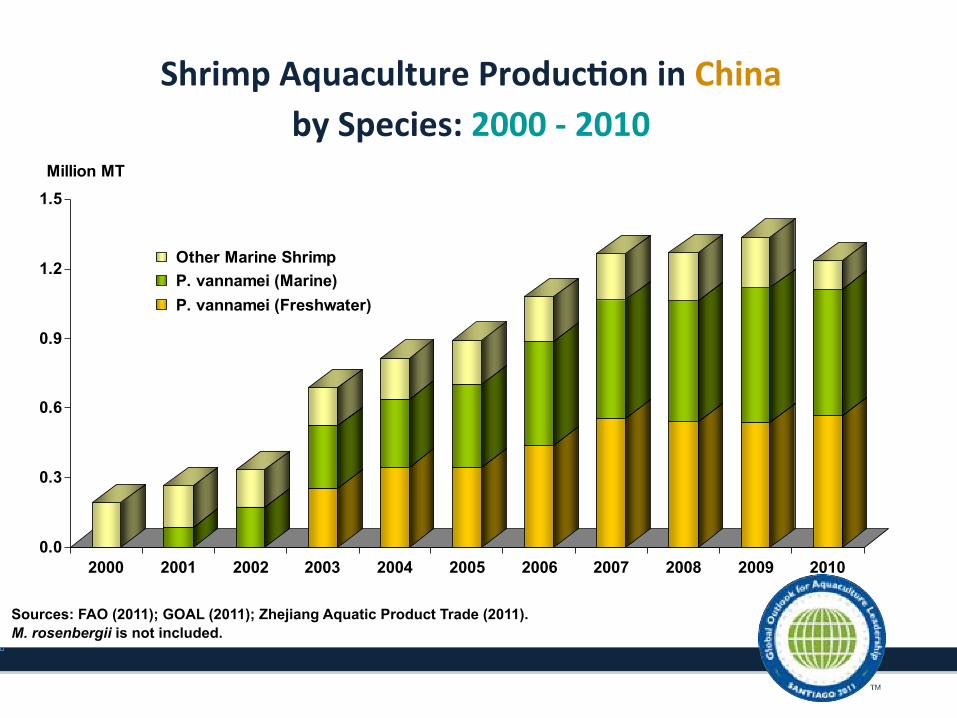
Shrimp Aquaculture Produc4on in China by Species: 2000 -‐ 2010
Sources: FAO (2011); GOAL (2011); Zhejiang Aquatic Product Trade (2011). M. rosenbergii is not included.
0.0
0.3
0.6
0.9
1.2
1.5Million MT
2000 2001 2002 2003 2004 2005 2006 2007 2008 2009 2010
Other Marine Shrimp P. vannamei (Marine) P. vannamei (Freshwater)
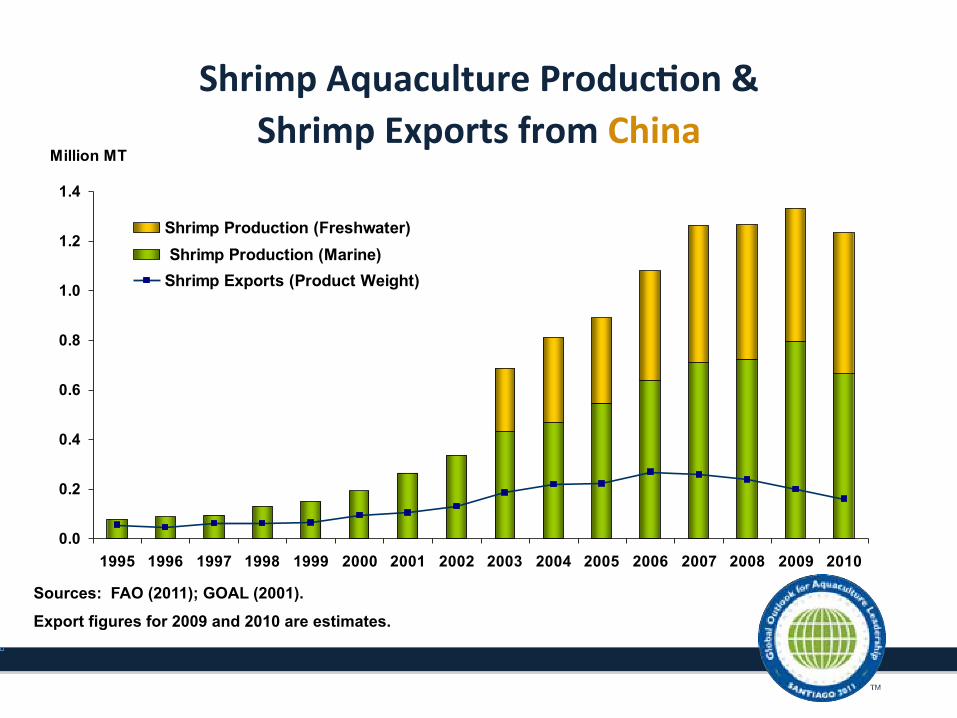
Shrimp Aquaculture Produc4on & Shrimp Exports from China
0.0
0.2
0.4
0.6
0.8
1.0
1.2
1.4
1995 1996 1997 1998 1999 2000 2001 2002 2003 2004 2005 2006 2007 2008 2009 2010
Million MT
Shrimp Production (Freshwater) Shrimp Production (Marine) Shrimp Exports (Product Weight)
Sources: FAO (2011); GOAL (2001).
Export figures for 2009 and 2010 are estimates.

Shrimp Aquaculture in La4n America: 2005 – 2013
Sources: FAO (2011) & GOAL (2011). Note: M. rosenbergii is not included.
0
40
80
120
160
200
Thousand MT
Ecuador Mexico Brazil Colombia Honduras Nicaragua
2005 2006 2007 2008 2009 2010 2011 2012 2013
2005-2009 data are from FAO (2011).
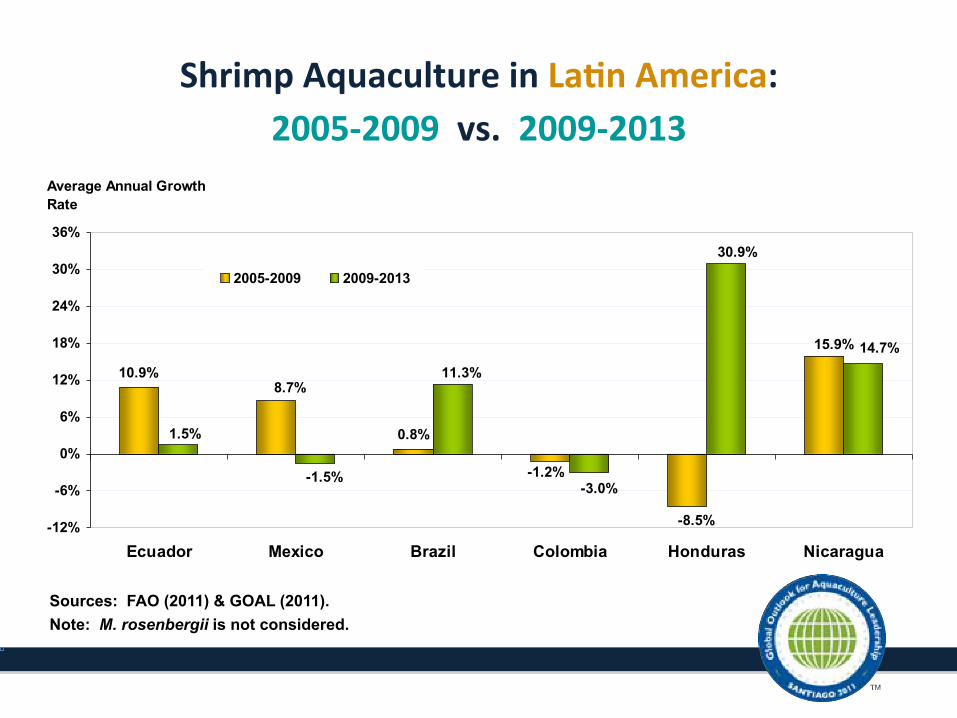
Shrimp Aquaculture in La4n America: 2005-‐2009 vs. 2009-‐2013
Sources: FAO (2011) & GOAL (2011). Note: M. rosenbergii is not considered.
10.9%
0.8%
15.9%
-1.2%
-8.5%
8.7%
14.7%
11.3%
30.9%
-3.0%
1.5%
-1.5%
-12%
-6%
0%
6%
12%
18%
24%
30%
36%
Ecuador Mexico Brazil Colombia Honduras Nicaragua
Average Annual Growth Rate
2005-2009 2009-2013
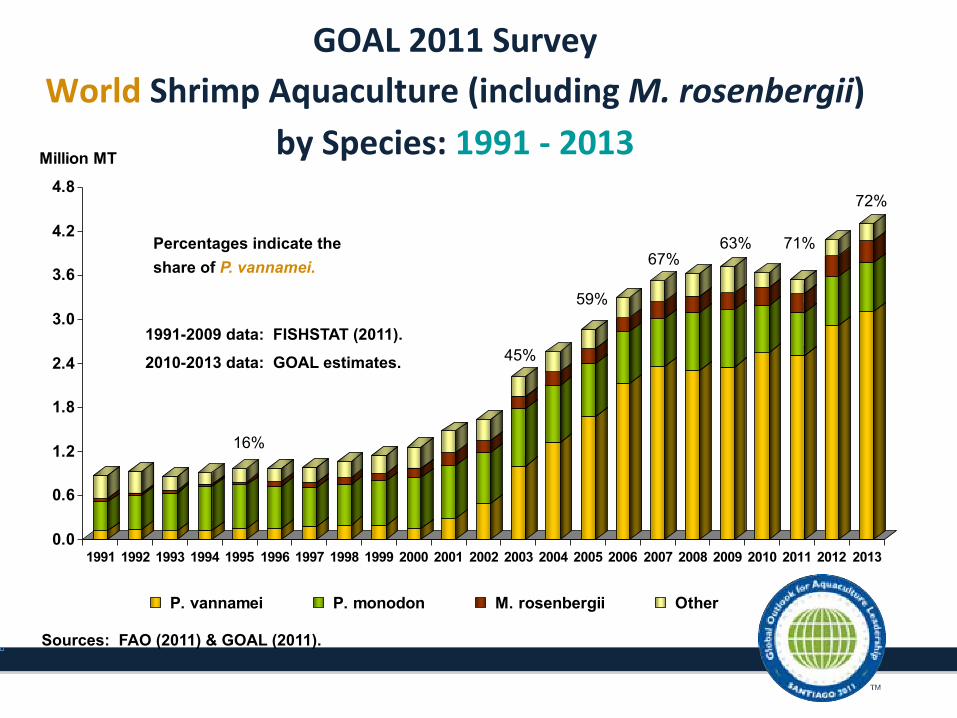
GOAL 2011 Survey World Shrimp Aquaculture (including M. rosenbergii)
by Species: 1991 -‐ 2013
0.0
0.6
1.2
1.8
2.4
3.0
3.6
4.2
4.8
Million MT
1991 1992 1993 1994 1995 1996 1997 1998 1999 2000 2001 2002 2003 2004 2005 2006 2007 2008 2009 2010 2011 2012 2013
P. vannamei P. monodon M. rosenbergii Other
Sources: FAO (2011) & GOAL (2011).
45%
59%
67% 63% 71% Percentages indicate the
share of P. vannamei.
1991-2009 data: FISHSTAT (2011).
2010-2013 data: GOAL estimates.
16%
72%
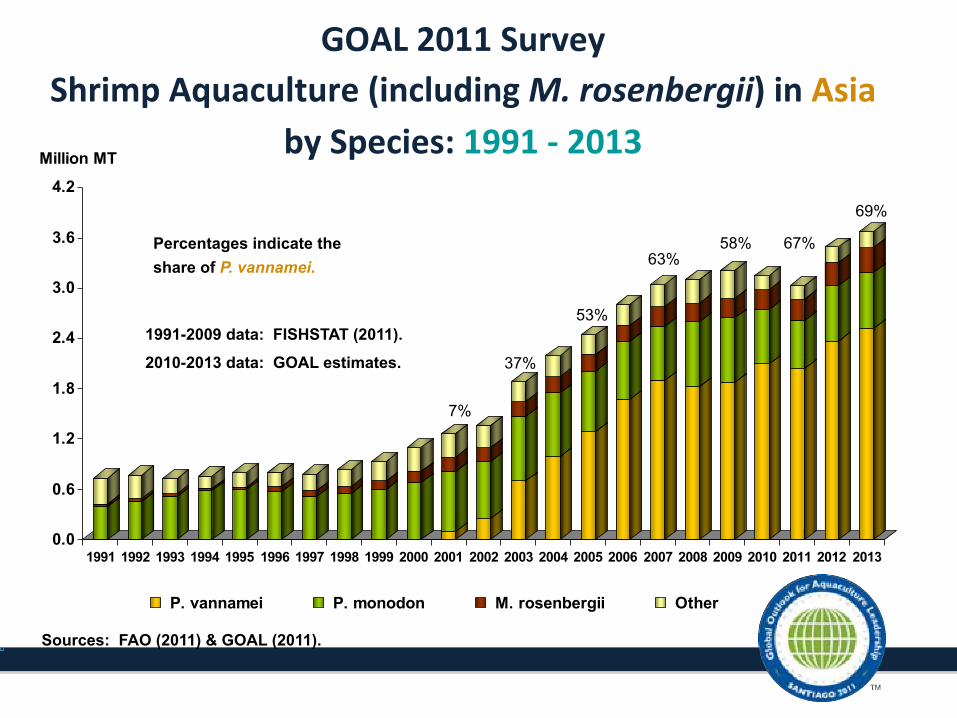
GOAL 2011 Survey Shrimp Aquaculture (including M. rosenbergii) in Asia
by Species: 1991 -‐ 2013
0.0
0.6
1.2
1.8
2.4
3.0
3.6
4.2
Million MT
1991 1992 1993 1994 1995 1996 1997 1998 1999 2000 2001 2002 2003 2004 2005 2006 2007 2008 2009 2010 2011 2012 2013
P. vannamei P. monodon M. rosenbergii Other
Sources: FAO (2011) & GOAL (2011).
37%
53%
63% 58% 67% Percentages indicate the
share of P. vannamei.
1991-2009 data: FISHSTAT (2011).
2010-2013 data: GOAL estimates.
7%
69%
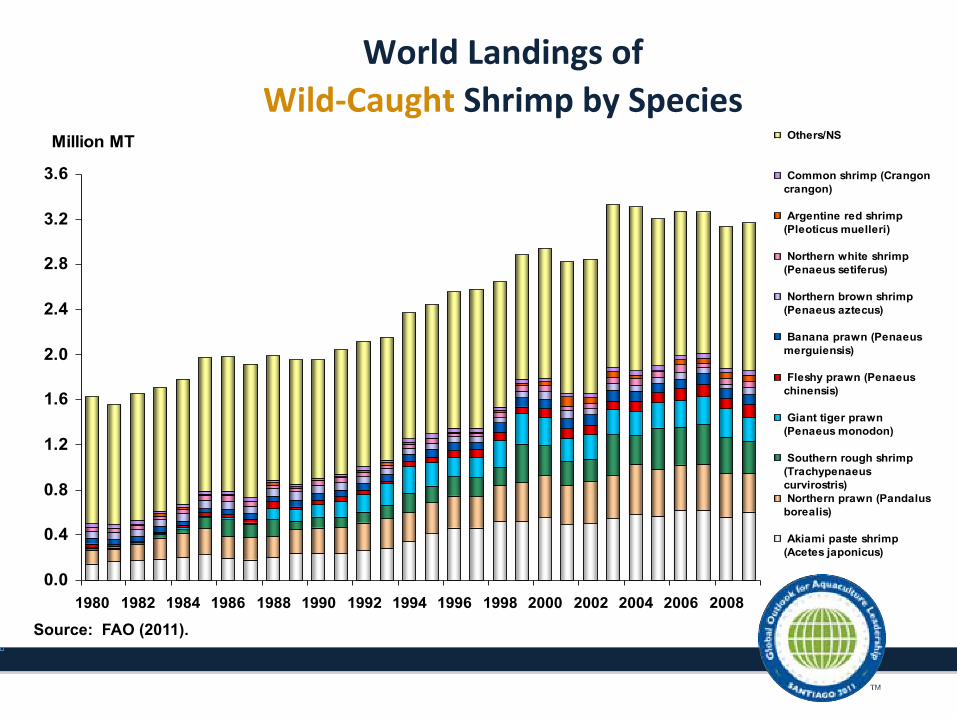
World Landings of Wild-‐Caught Shrimp by Species
0.0
0.4
0.8
1.2
1.6
2.0
2.4
2.8
3.2
3.6
1980 1982 1984 1986 1988 1990 1992 1994 1996 1998 2000 2002 2004 2006 2008
Million MT Others/NS
Common shrimp (Crangoncrangon)
Argentine red shrimp(Pleoticus muelleri)
Northern white shrimp(Penaeus setiferus)
Northern brown shrimp(Penaeus aztecus)
Banana prawn (Penaeusmerguiensis)
Fleshy prawn (Penaeuschinensis)
Giant tiger prawn(Penaeus monodon)
Southern rough shrimp(Trachypenaeuscurvirostris) Northern prawn (Pandalusborealis)
Akiami paste shrimp(Acetes japonicus)
Source: FAO (2011).
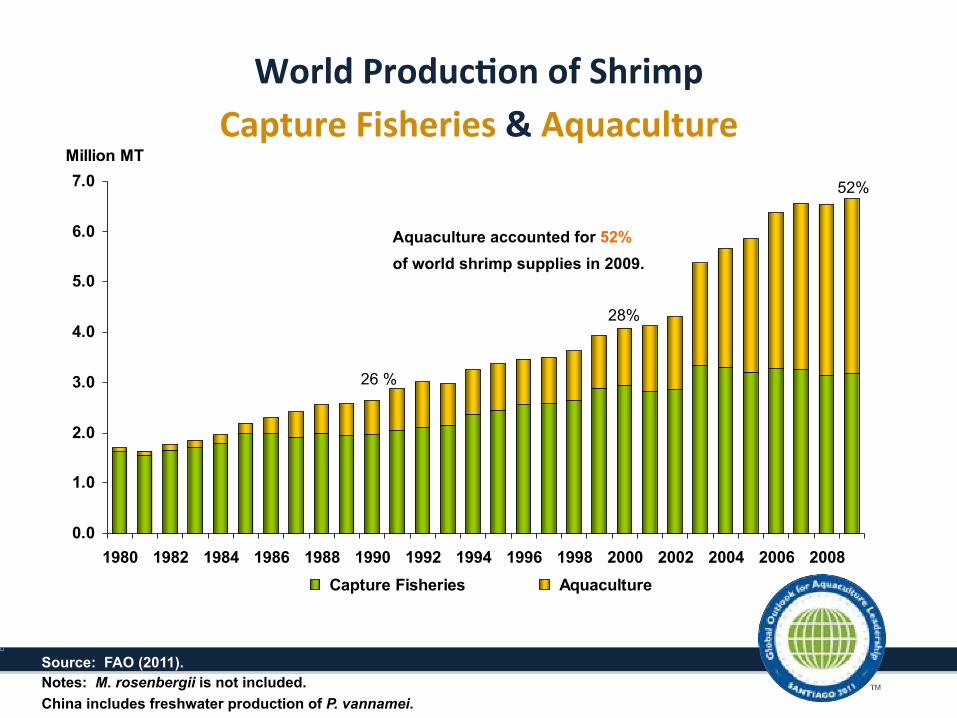
World Produc4on of Shrimp Capture Fisheries & Aquaculture
0.0
1.0
2.0
3.0
4.0
5.0
6.0
7.0
1980 1982 1984 1986 1988 1990 1992 1994 1996 1998 2000 2002 2004 2006 2008
Million MT
Capture Fisheries Aquaculture
Source: FAO (2011). Notes: M. rosenbergii is not included. China includes freshwater production of P. vannamei.
Aquaculture accounted for 52% of world shrimp supplies in 2009.
26 %
28%
52%
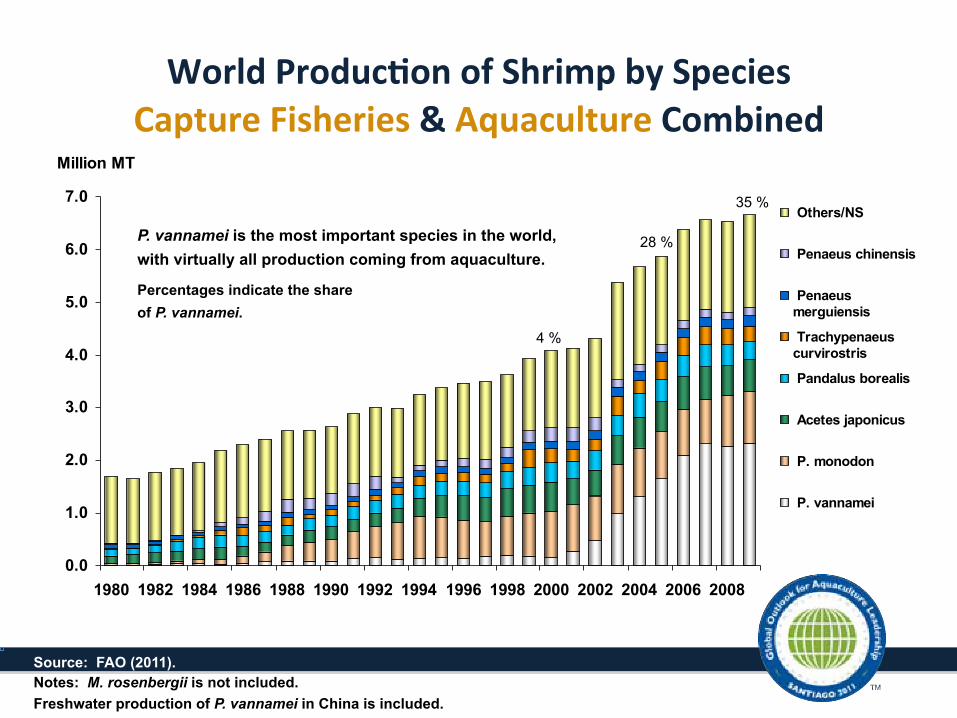
World Produc4on of Shrimp by Species Capture Fisheries & Aquaculture Combined
0.0
1.0
2.0
3.0
4.0
5.0
6.0
7.0
1980 1982 1984 1986 1988 1990 1992 1994 1996 1998 2000 2002 2004 2006 2008
Million MT
Others/NS
Penaeus chinensis
Penaeusmerguiensis
Trachypenaeuscurvirostris
Pandalus borealis
Acetes japonicus
P. monodon
P. vannamei
Source: FAO (2011). Notes: M. rosenbergii is not included. Freshwater production of P. vannamei in China is included.
P. vannamei is the most important species in the world, with virtually all production coming from aquaculture.
Percentages indicate the share of P. vannamei.
4 %
28 %
35 %
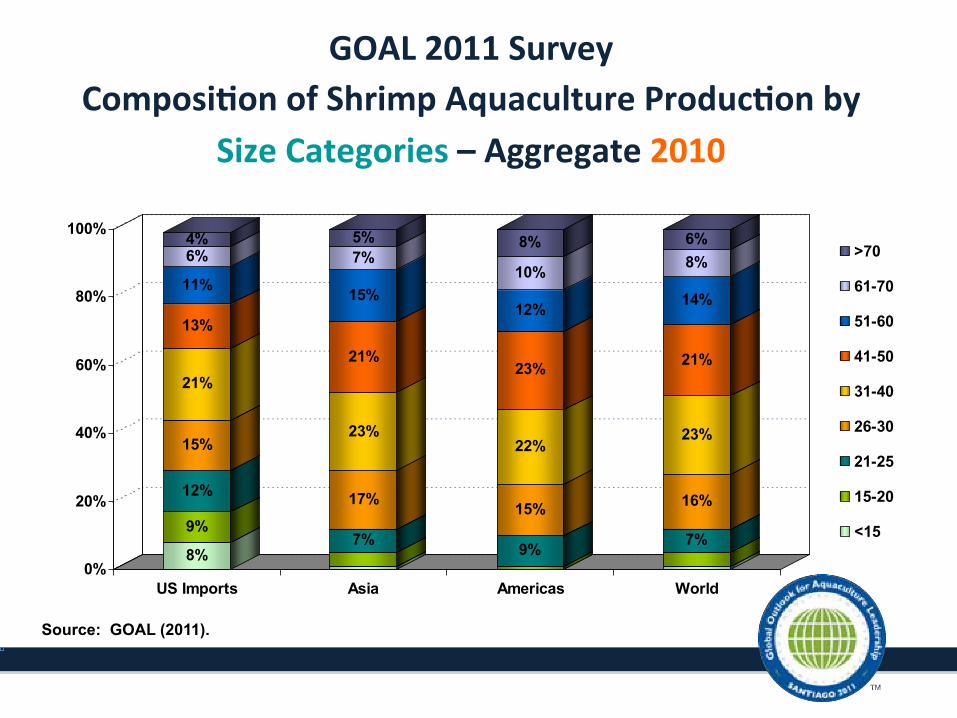
GOAL 2011 Survey Composi4on of Shrimp Aquaculture Produc4on by
Size Categories – Aggregate 2010
8%
9%
12%
15%
21%
13%
11%
6%4%
7%
17%
23%
21%
15%
7%5%
9%
15%
22%
23%
12%
10%
8%
7%
16%
23%
21%
14%
8%6%
0%
20%
40%
60%
80%
100%
US Imports Asia Americas World
>70
61-70
51-60
41-50
31-40
26-30
21-25
15-20
<15
Source: GOAL (2011).
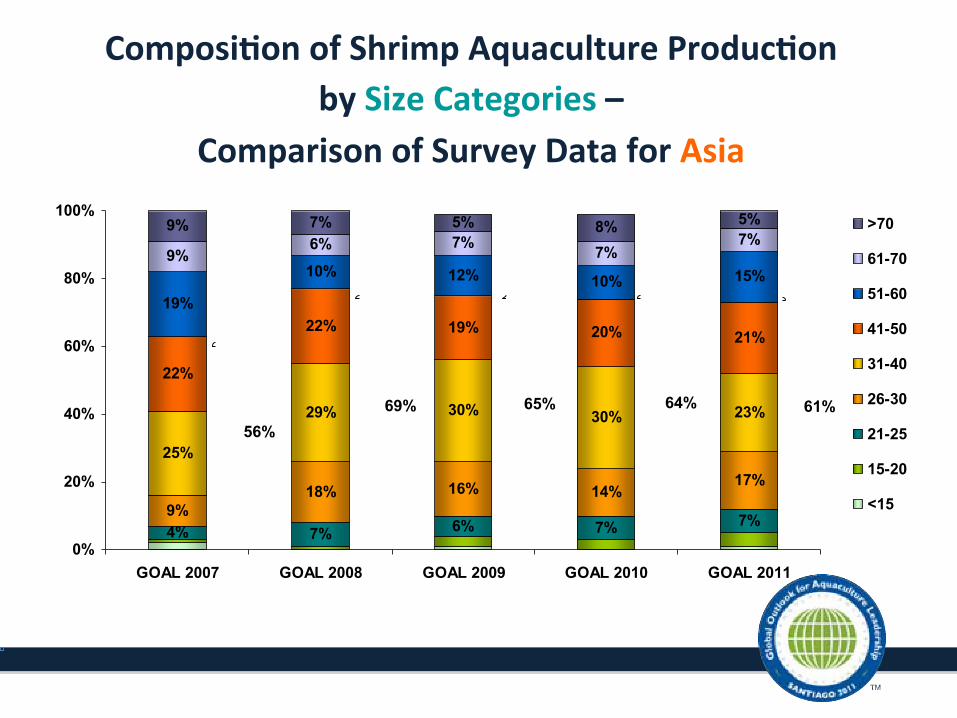
Composi4on of Shrimp Aquaculture Produc4on by Size Categories –
Comparison of Survey Data for Asia
4% 7% 6% 7% 7%9%18% 16% 14%
17%
25%
29% 30% 30% 23%
22%
22% 19% 20% 21%
19%
10% 12% 10% 15%9%
6% 7% 7%7%
9% 7% 5% 8% 5%
0%
20%
40%
60%
80%
100%
GOAL 2007 GOAL 2008 GOAL 2009 GOAL 2010 GOAL 2011
>70
61-70
51-60
41-50
31-40
26-30
21-25
15-20
<15
56% 69% 65% 64% 61%
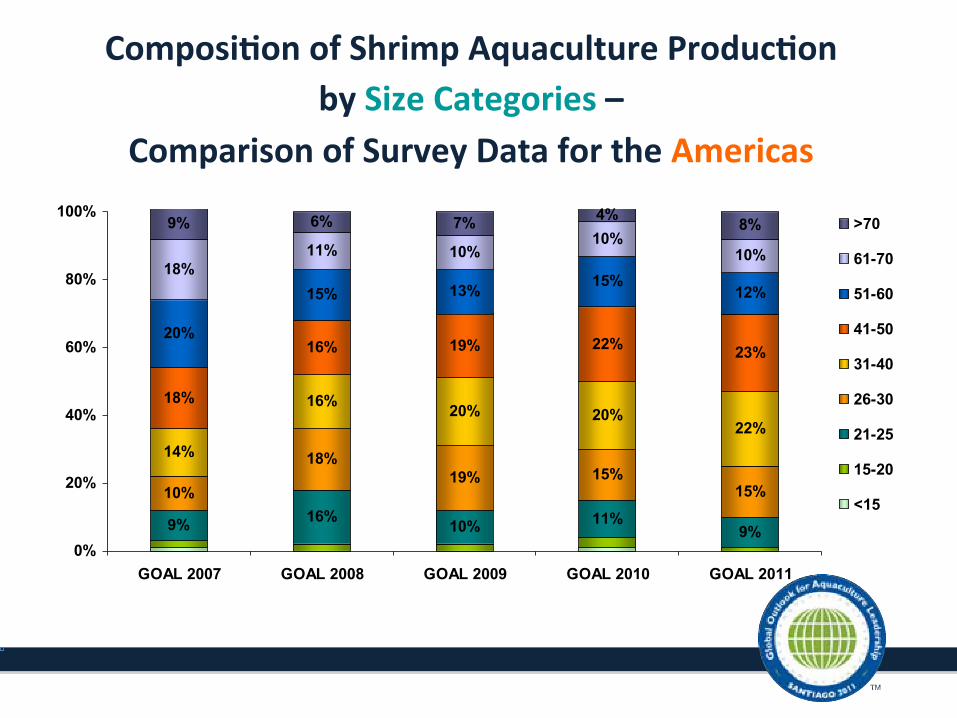
Composi4on of Shrimp Aquaculture Produc4on by Size Categories –
Comparison of Survey Data for the Americas
9% 16% 10% 11%9%
10%
18%19% 15%
15%
14%
16% 20% 20%22%
18%
16% 19% 22% 23%20%
15% 13% 15%12%
18%11% 10%
10%10%
9% 6% 7% 4% 8%
0%
20%
40%
60%
80%
100%
GOAL 2007 GOAL 2008 GOAL 2009 GOAL 2010 GOAL 2011
>70
61-70
51-60
41-50
31-40
26-30
21-25
15-20
<15
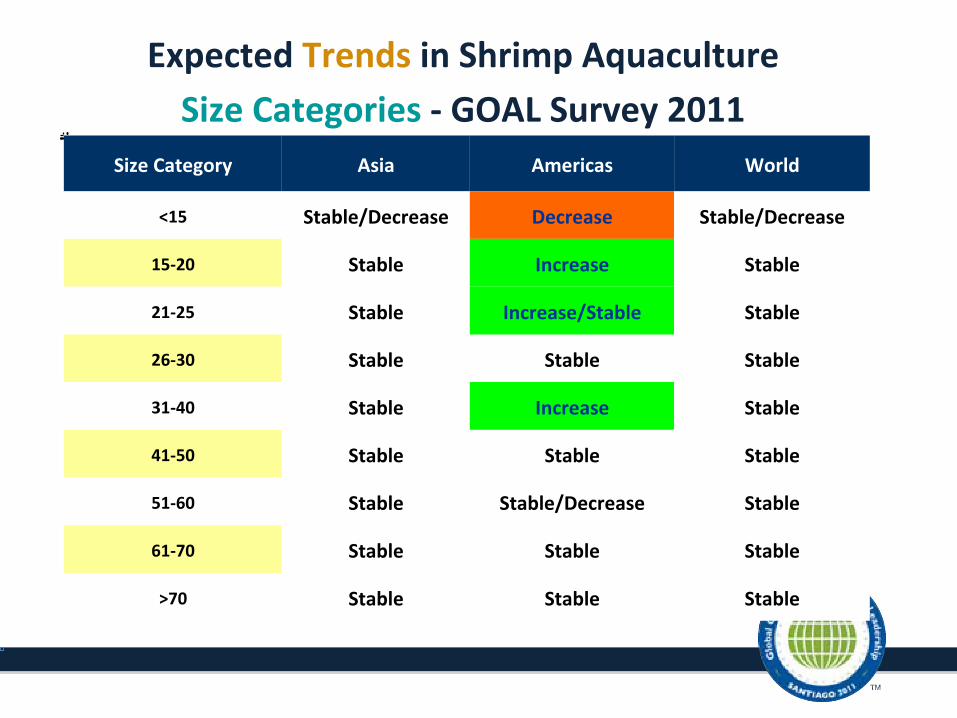
Expected Trends in Shrimp Aquaculture Size Categories -‐ GOAL Survey 2011
Size Category Asia Americas World
<15 Stable/Decrease Decrease Stable/Decrease
15-‐20 Stable Increase Stable
21-‐25 Stable Increase/Stable Stable
26-‐30 Stable Stable Stable
31-‐40 Stable Increase Stable
41-‐50 Stable Stable Stable
51-‐60 Stable Stable/Decrease Stable
61-‐70 Stable Stable Stable
>70 Stable Stable Stable
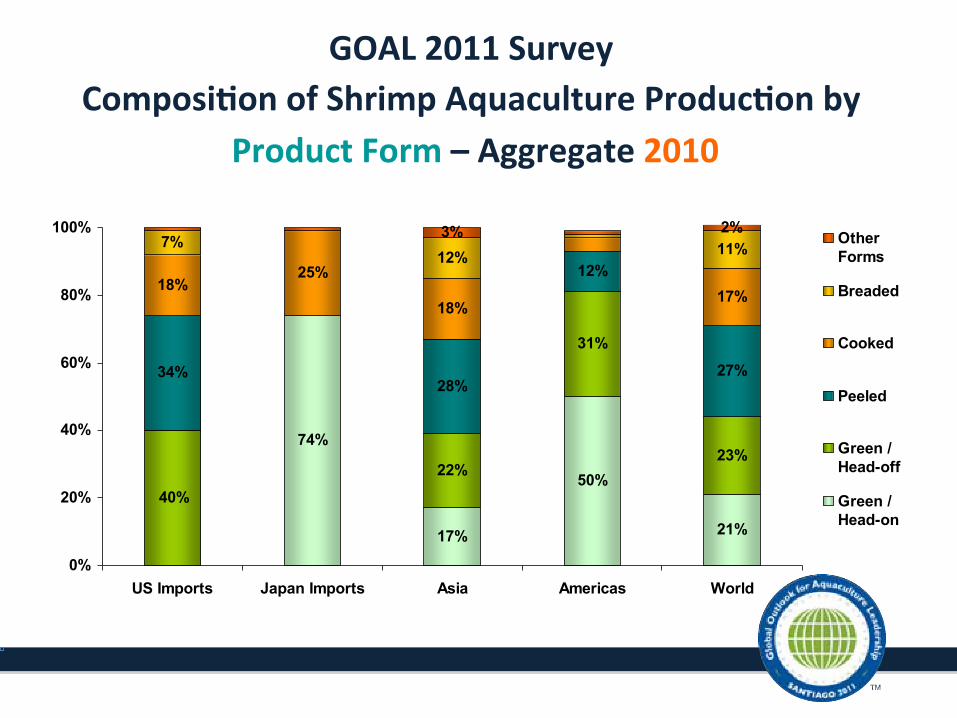
GOAL 2011 Survey Composi4on of Shrimp Aquaculture Produc4on by
Product Form – Aggregate 2010
21%
23%
34%28%
12%
27%
18%25%
18%17%
7%12% 11%3% 2%
50%
17%
74%
40%
31%
22%
0%
20%
40%
60%
80%
100%
US Imports Japan Imports Asia Americas World
OtherForms
Breaded
Cooked
Peeled
Green /Head-off
Green /Head-on
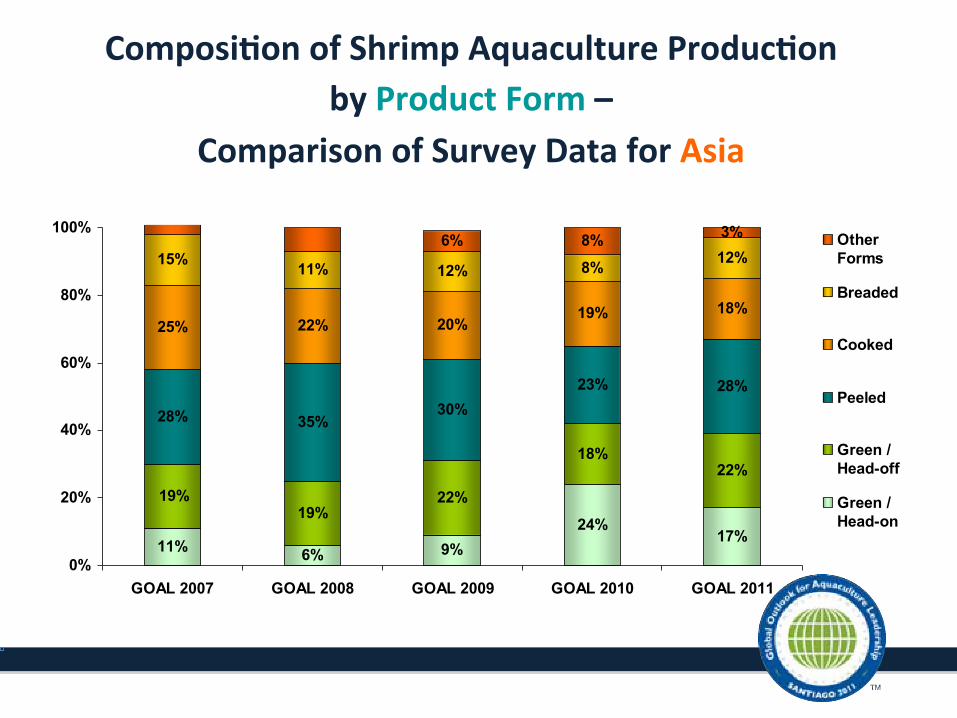
Composi4on of Shrimp Aquaculture Produc4on by Product Form –
Comparison of Survey Data for Asia
17%
22%
28% 35%30%
23% 28%
25% 22% 20%19% 18%
15% 11% 12% 8% 12%6% 8% 3%
11%24%
9%6%
19%
18%
22%19%
0%
20%
40%
60%
80%
100%
GOAL 2007 GOAL 2008 GOAL 2009 GOAL 2010 GOAL 2011
OtherForms
Breaded
Cooked
Peeled
Green /Head-off
Green /Head-on
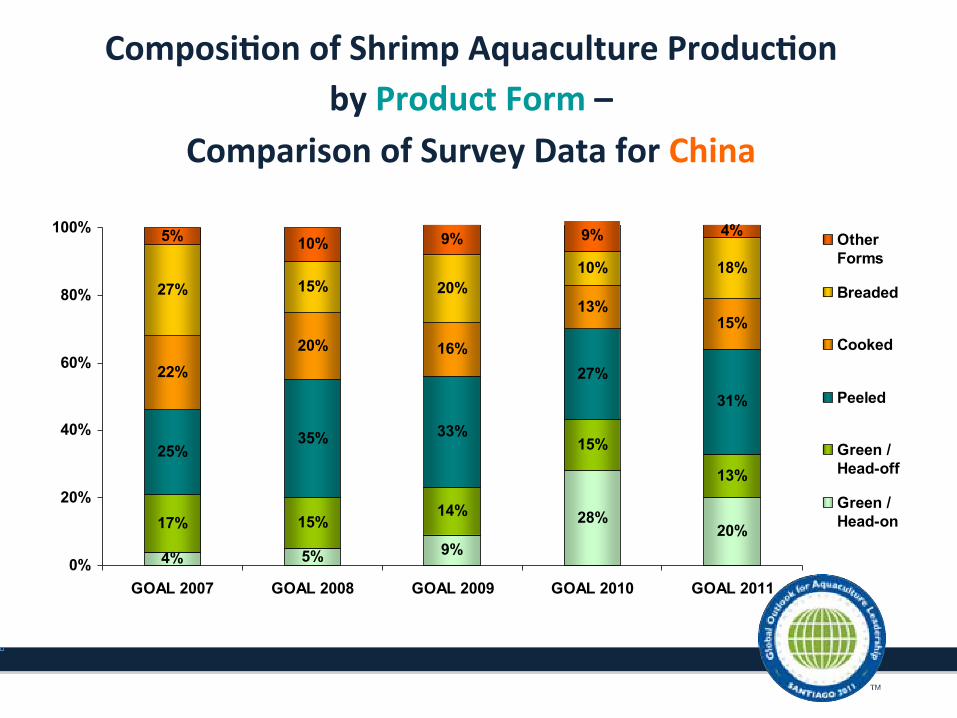
Composi4on of Shrimp Aquaculture Produc4on by Product Form –
Comparison of Survey Data for China
4% 5% 9%
28%20%17% 15%
14%
15%
13%25%
35% 33%
27%
31%
22%20% 16%
13%15%
27% 15% 20%10% 18%
5% 10% 9% 9% 4%
0%
20%
40%
60%
80%
100%
GOAL 2007 GOAL 2008 GOAL 2009 GOAL 2010 GOAL 2011
OtherForms
Breaded
Cooked
Peeled
Green /Head-off
Green /Head-on
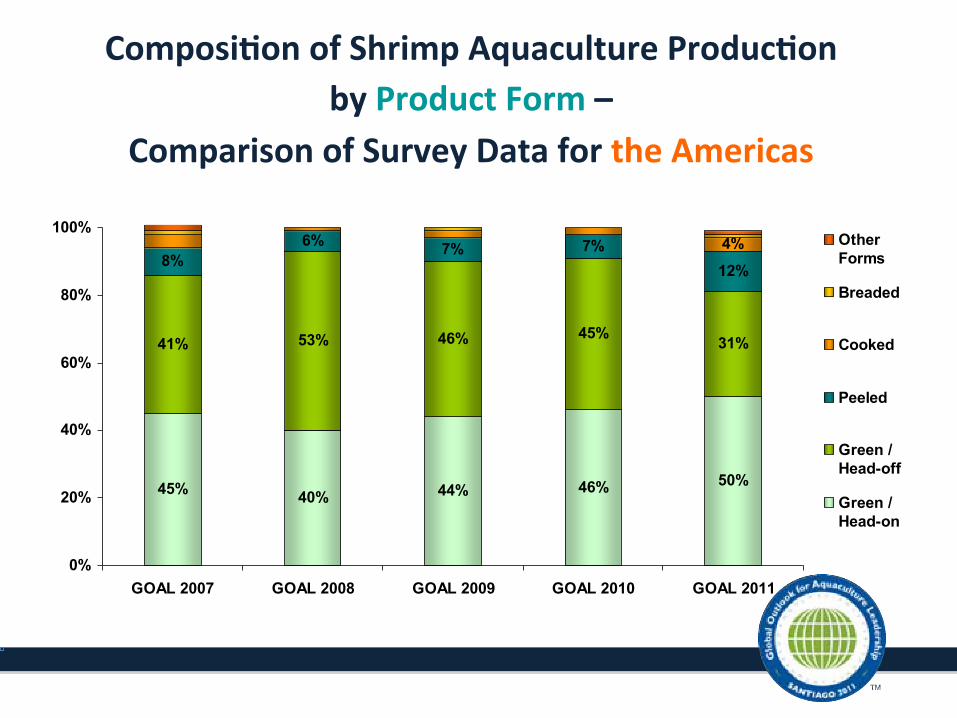
Composi4on of Shrimp Aquaculture Produc4on by Product Form –
Comparison of Survey Data for the Americas
45% 40% 44% 46% 50%
41% 53% 46% 45% 31%
8%6% 7% 7%
12%
4%
0%
20%
40%
60%
80%
100%
GOAL 2007 GOAL 2008 GOAL 2009 GOAL 2010 GOAL 2011
OtherForms
Breaded
Cooked
Peeled
Green /Head-off
Green /Head-on
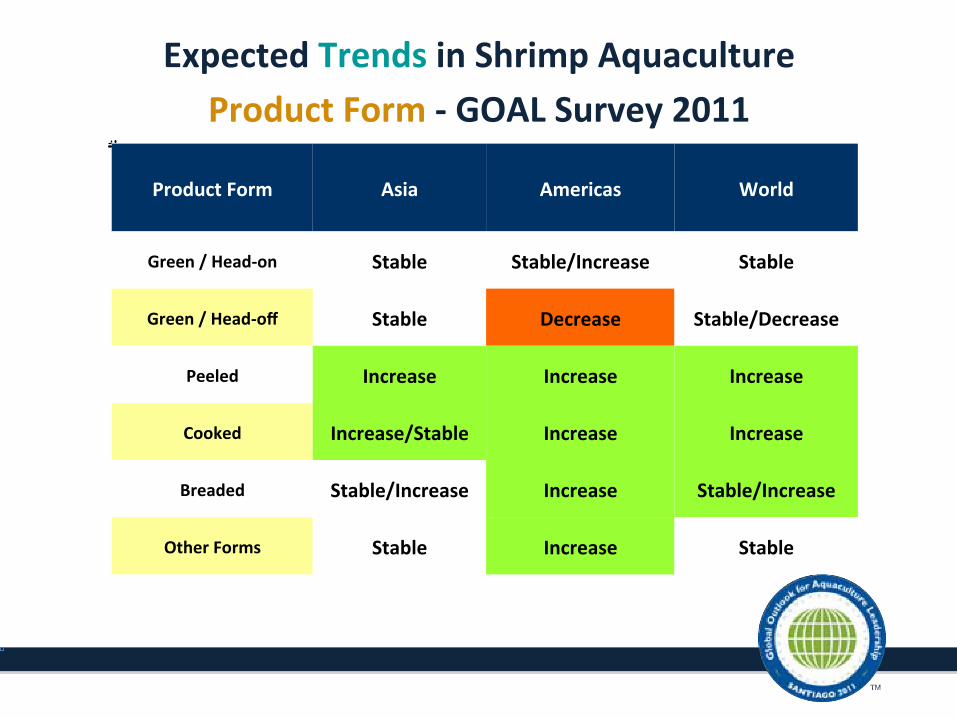
Expected Trends in Shrimp Aquaculture Product Form -‐ GOAL Survey 2011
Product Form Asia Americas World
Green / Head-‐on Stable Stable/Increase Stable
Green / Head-‐off Stable Decrease Stable/Decrease
Peeled Increase Increase Increase
Cooked Increase/Stable Increase Increase
Breaded Stable/Increase Increase Stable/Increase
Other Forms Stable Increase Stable
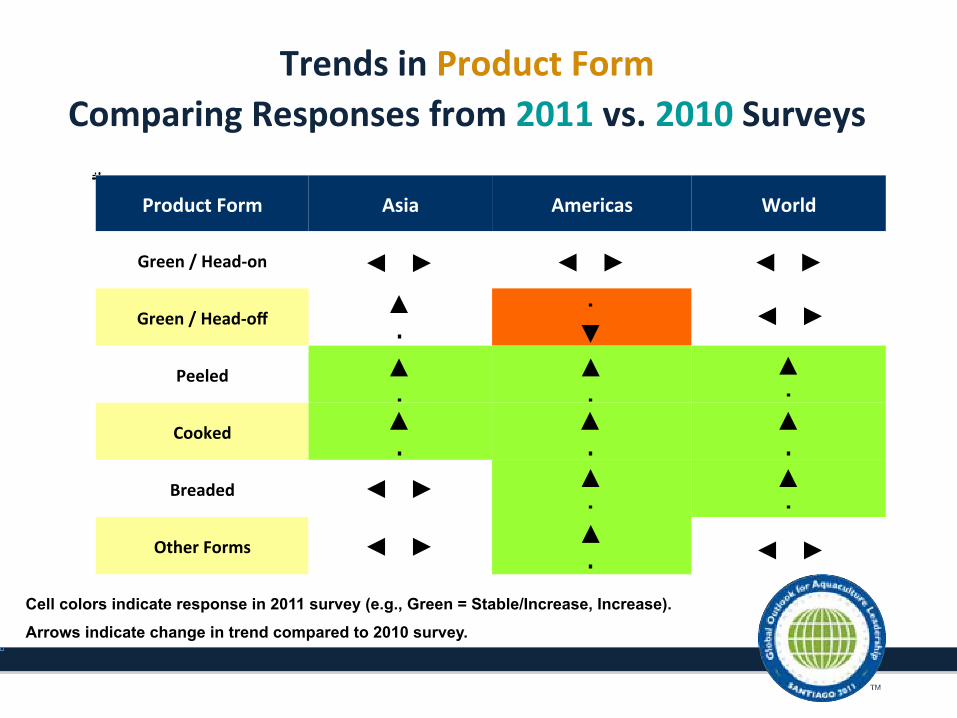
Trends in Product Form Comparing Responses from 2011 vs. 2010 Surveys
Cell colors indicate response in 2011 survey (e.g., Green = Stable/Increase, Increase).
Arrows indicate change in trend compared to 2010 survey.
Product Form Asia Americas World
Green / Head-‐on
Green / Head-‐off
Peeled
Cooked
Breaded
Other Forms
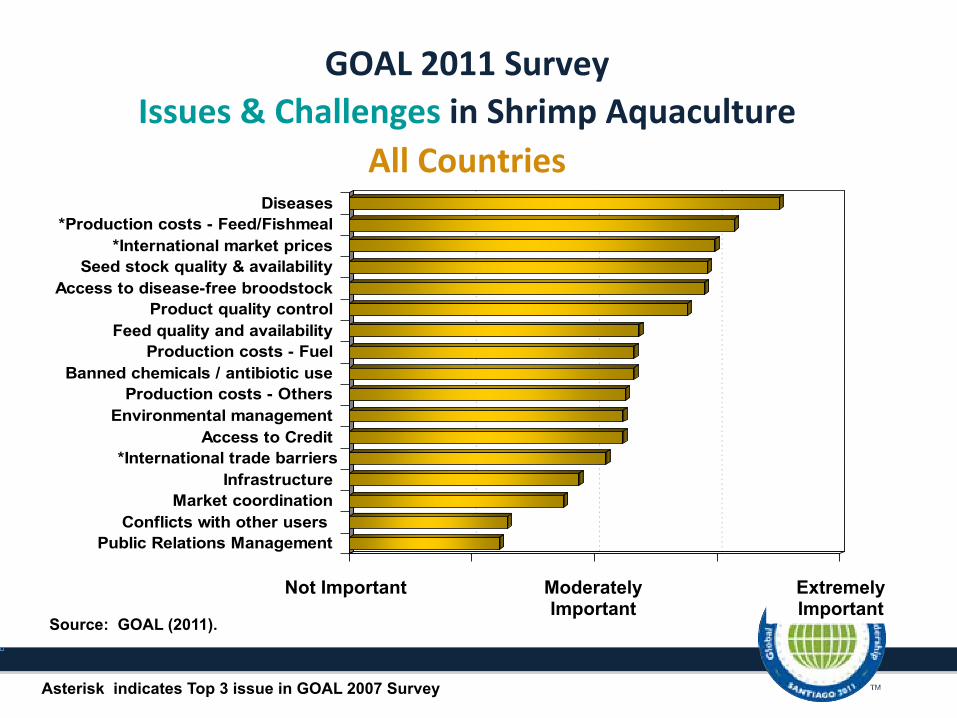
Diseases *Production costs - Feed/Fishmeal
*International market prices Seed stock quality & availability
Access to disease-free broodstock Product quality control
Feed quality and availability Production costs - Fuel
Banned chemicals / antibiotic use Production costs - Others
Environmental management Access to Credit
*International trade barriers Infrastructure
Market coordination Conflicts with other users
Public Relations Management
Not Important Extremely Important
Moderately Important
GOAL 2011 Survey Issues & Challenges in Shrimp Aquaculture
All Countries
Source: GOAL (2011).
Asterisk indicates Top 3 issue in GOAL 2007 Survey
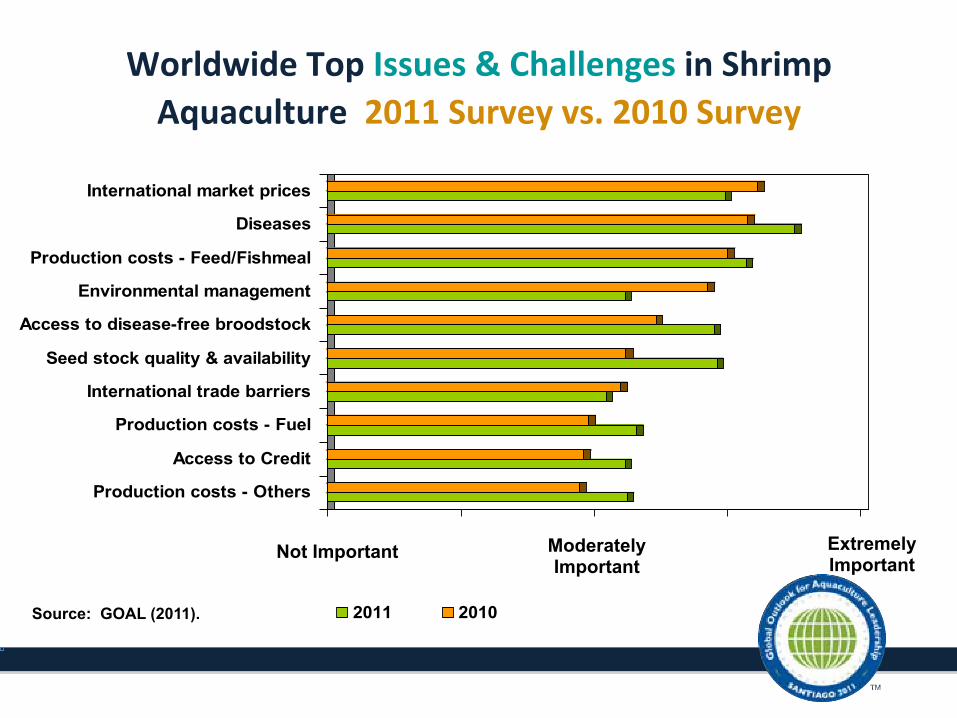
Worldwide Top Issues & Challenges in Shrimp Aquaculture 2011 Survey vs. 2010 Survey
Source: GOAL (2011).
International market prices
Diseases
Production costs - Feed/Fishmeal
Environmental management
Access to disease-free broodstock
Seed stock quality & availability
International trade barriers
Production costs - Fuel
Access to Credit
Production costs - Others
2011 2010
Not Important Extremely Important
Moderately Important
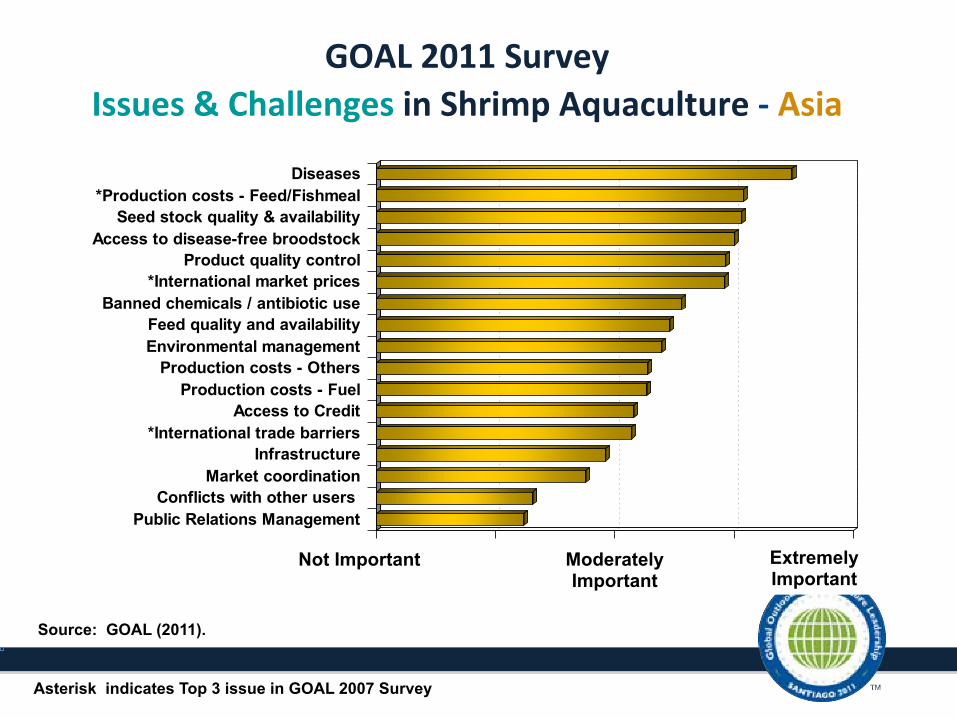
Diseases *Production costs - Feed/Fishmeal
Seed stock quality & availability Access to disease-free broodstock
Product quality control *International market prices
Banned chemicals / antibiotic use Feed quality and availability Environmental management
Production costs - Others Production costs - Fuel
Access to Credit *International trade barriers
Infrastructure Market coordination
Conflicts with other users Public Relations Management
Not Important Extremely Important
Moderately Important
GOAL 2011 Survey Issues & Challenges in Shrimp Aquaculture -‐ Asia
Source: GOAL (2011).
Asterisk indicates Top 3 issue in GOAL 2007 Survey
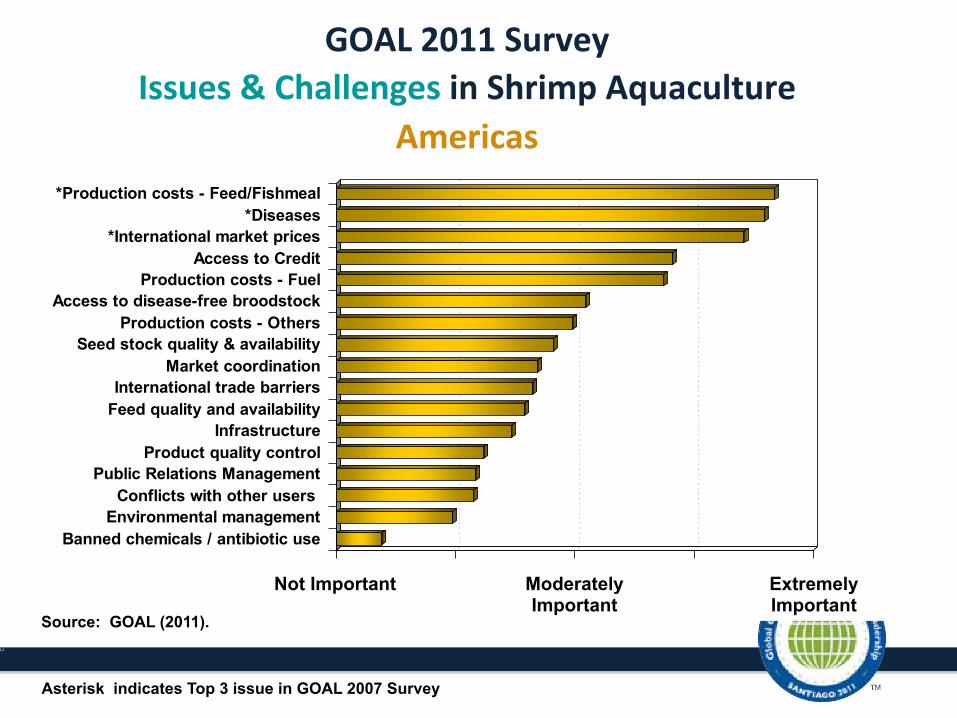
*Production costs - Feed/Fishmeal *Diseases
*International market prices Access to Credit
Production costs - Fuel Access to disease-free broodstock
Production costs - Others Seed stock quality & availability
Market coordination International trade barriers
Feed quality and availability Infrastructure
Product quality control Public Relations Management
Conflicts with other users Environmental management
Banned chemicals / antibiotic use
Not Important Extremely Important
Moderately Important
GOAL 2011 Survey Issues & Challenges in Shrimp Aquaculture
Americas
Source: GOAL (2011).
Asterisk indicates Top 3 issue in GOAL 2007 Survey
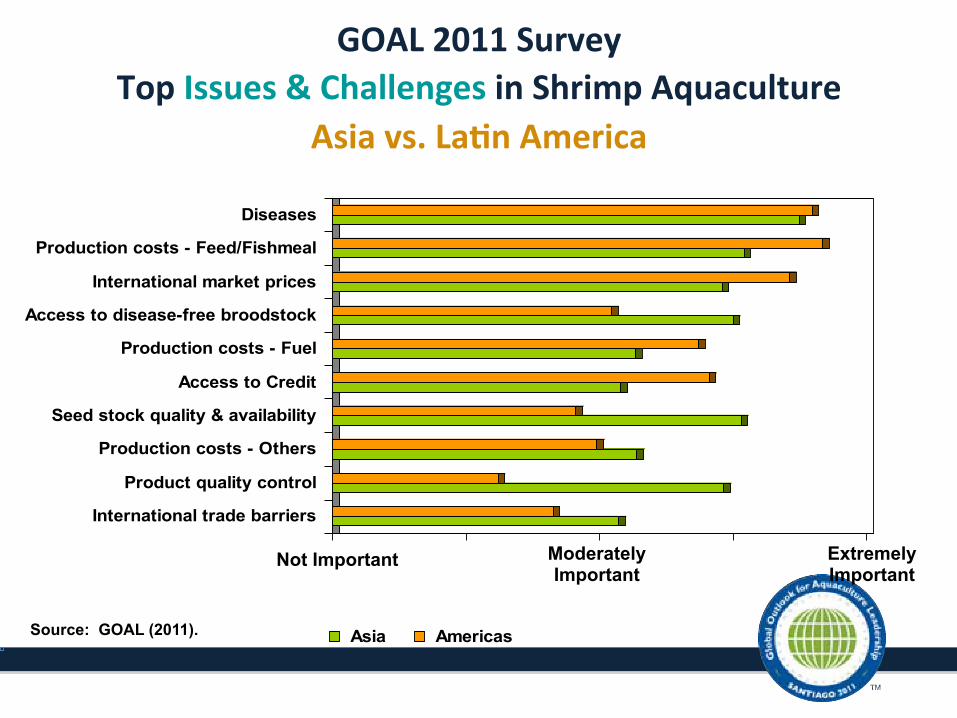
GOAL 2011 Survey Top Issues & Challenges in Shrimp Aquaculture
Asia vs. La4n America
Source: GOAL (2011).
Diseases
Production costs - Feed/Fishmeal
International market prices
Access to disease-free broodstock
Production costs - Fuel
Access to Credit
Seed stock quality & availability
Production costs - Others
Product quality control
International trade barriers
Asia Americas
Not Important Extremely Important
Moderately Important
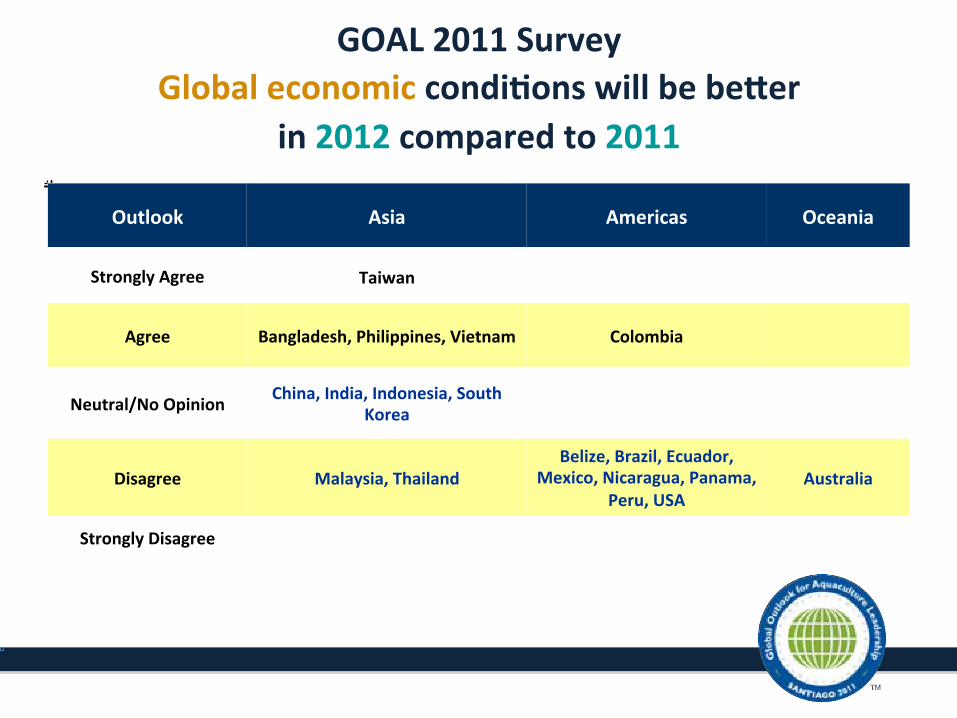
GOAL 2011 Survey Global economic condi4ons will be beber
in 2012 compared to 2011
Outlook Asia Americas Oceania
Strongly Agree Taiwan
Agree Bangladesh, Philippines, Vietnam Colombia
Neutral/No Opinion China, India, Indonesia, South Korea
Disagree Malaysia, Thailand Belize, Brazil, Ecuador,
Mexico, Nicaragua, Panama, Peru, USA
Australia
Strongly Disagree
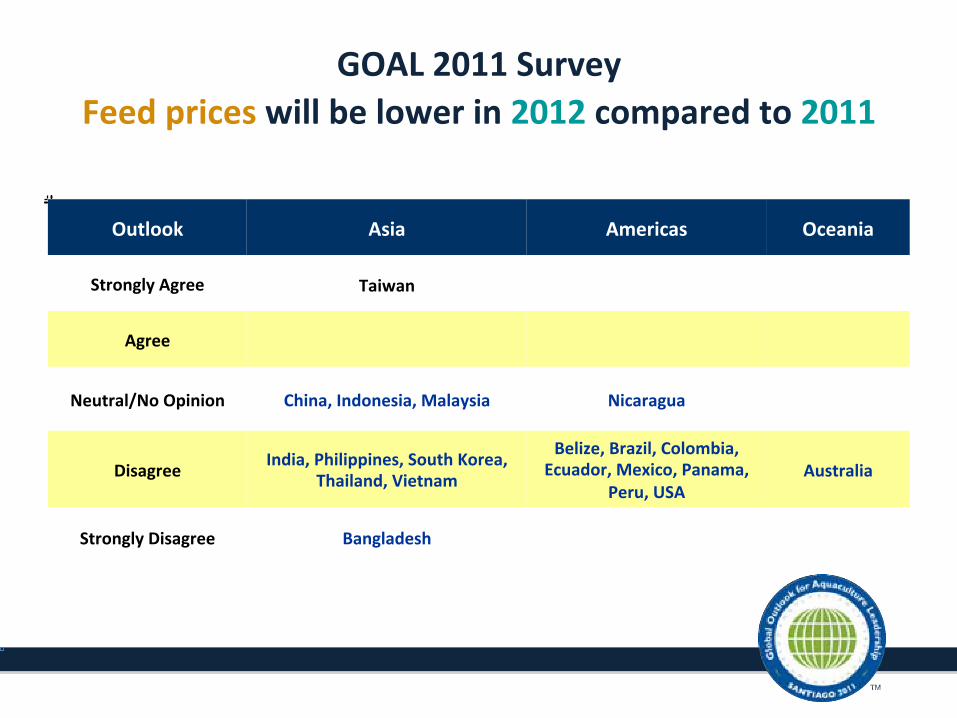
GOAL 2011 Survey Feed prices will be lower in 2012 compared to 2011
Outlook Asia Americas Oceania
Strongly Agree Taiwan
Agree
Neutral/No Opinion China, Indonesia, Malaysia Nicaragua
Disagree India, Philippines, South Korea, Thailand, Vietnam
Belize, Brazil, Colombia, Ecuador, Mexico, Panama,
Peru, USA Australia
Strongly Disagree Bangladesh
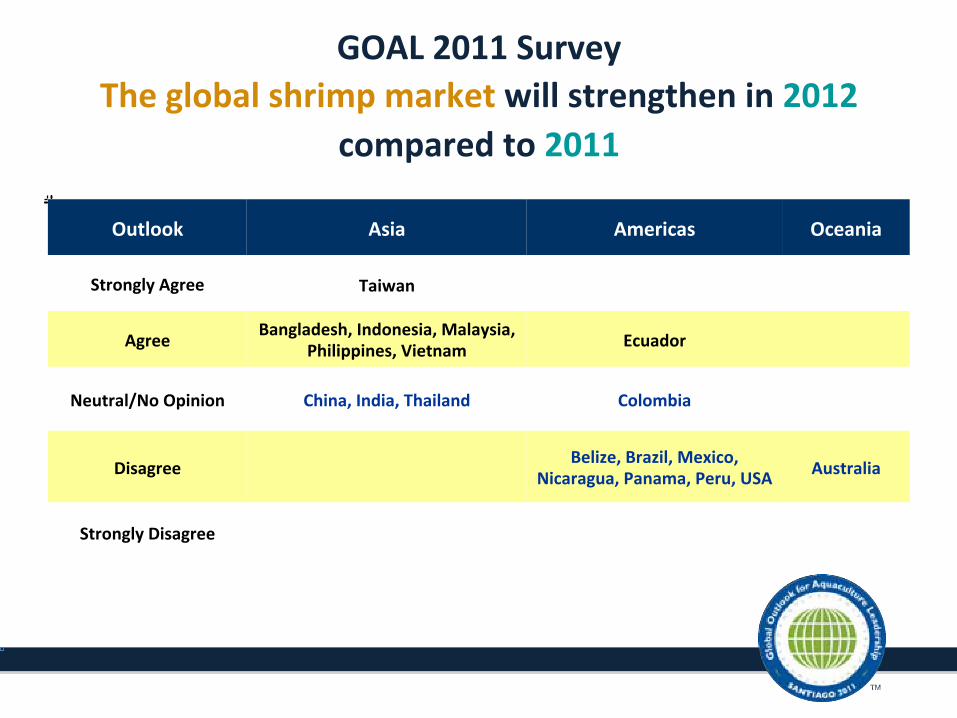
GOAL 2011 Survey The global shrimp market will strengthen in 2012
compared to 2011
Outlook Asia Americas Oceania
Strongly Agree Taiwan
Agree Bangladesh, Indonesia, Malaysia, Philippines, Vietnam Ecuador
Neutral/No Opinion China, India, Thailand Colombia
Disagree Belize, Brazil, Mexico, Nicaragua, Panama, Peru, USA Australia
Strongly Disagree
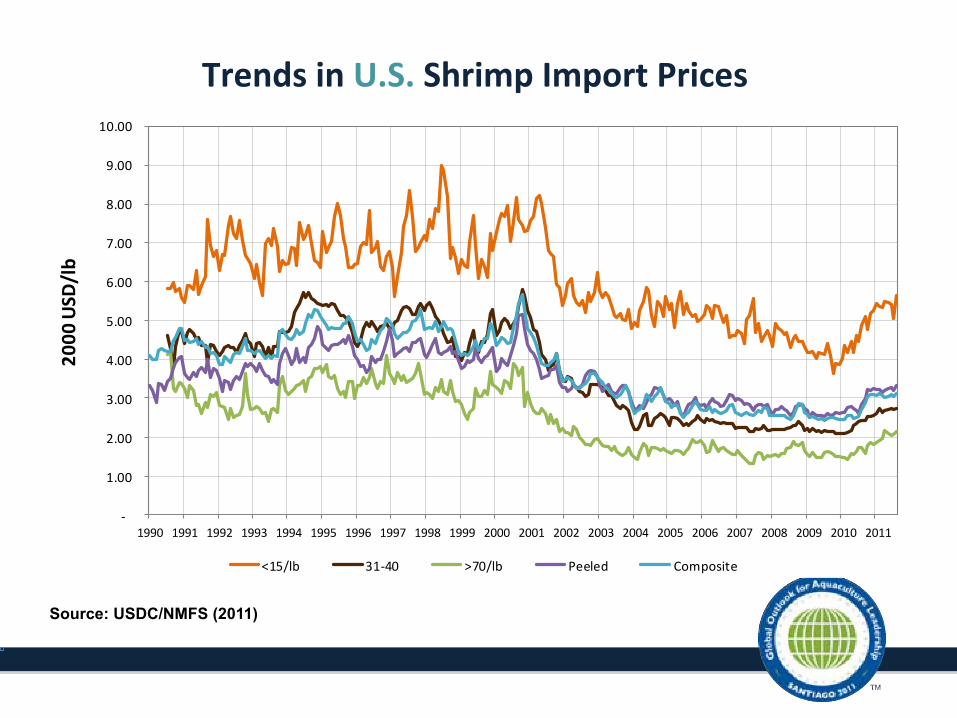
Trends in U.S. Shrimp Import Prices
Source: USDC/NMFS (2011)
-‐
1.00
2.00
3.00
4.00
5.00
6.00
7.00
8.00
9.00
10.00
1990 1991 1992 1993 1994 1995 1996 1997 1998 1999 2000 2001 2002 2003 2004 2005 2006 2007 2008 2009 2010 2011
2000
USD
/lb
<15/lb 31-‐40 >70/lb Peeled Composite
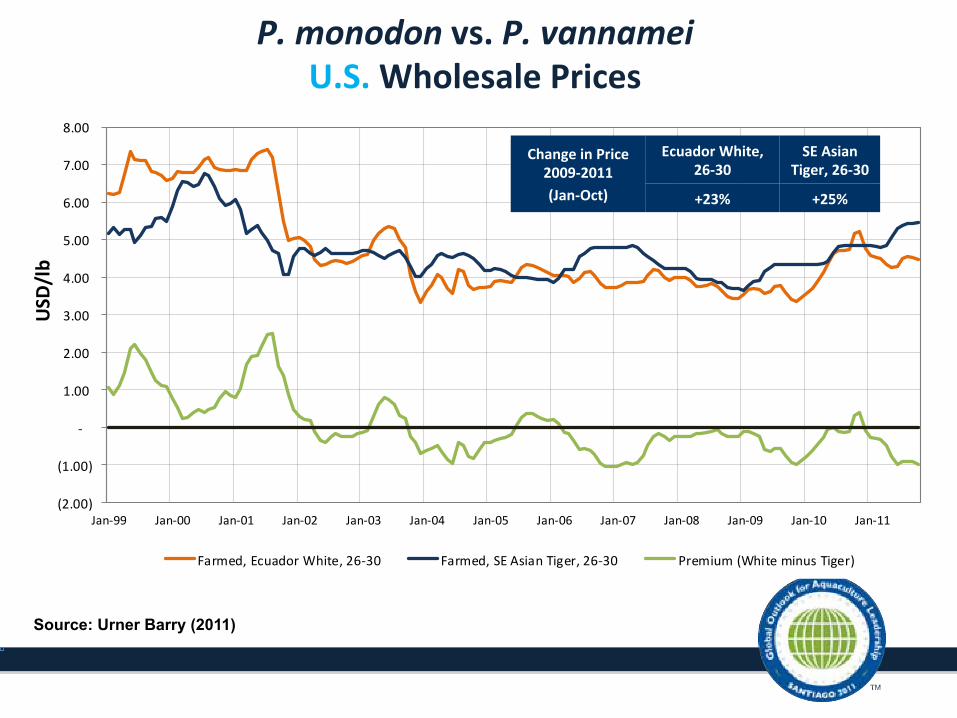
P. monodon vs. P. vannamei U.S. Wholesale Prices
Source: Urner Barry (2011)
(2.00)
(1.00)
-‐
1.00
2.00
3.00
4.00
5.00
6.00
7.00
8.00
Jan-‐99 Jan-‐00 Jan-‐01 Jan-‐02 Jan-‐03 Jan-‐04 Jan-‐05 Jan-‐06 Jan-‐07 Jan-‐08 Jan-‐09 Jan-‐10 Jan-‐11
USD/
lb
Farmed, Ecuador White, 26-‐30 Farmed, SE Asian Tiger, 26-‐30 Premium (White minus Tiger)
Change in Price 2009-‐2011 (Jan-‐Oct)
Ecuador White, 26-‐30
SE Asian Tiger, 26-‐30
+23% +25%
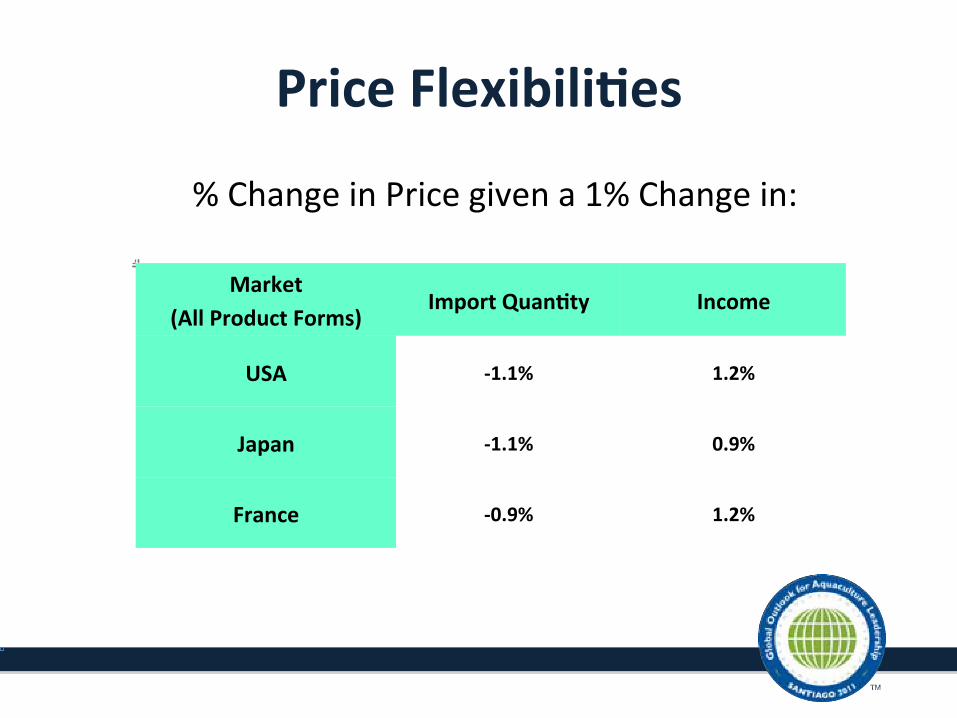
Market (All Product Forms)
Import Quan4ty Income
USA -‐1.1% 1.2%
Japan -‐1.1% 0.9%
France -‐0.9% 1.2%
Price Flexibili4es
% Change in Price given a 1% Change in:

Thank You!