private irrigation infrastructure operators · pdf fileas acting chairman throughout the nibm...
TRANSCRIPT

Private Irrigation Infrastructure Operators Program
Modernisation Project
Final Report
October 2017

NIBM PIIOP Final Project Report October 2017 ii
PIIOP Modernisation Project—Final Report Prepared for: Narromine Irrigation Board of Management Prepared by: M.K. McBurnie ‘Amara Farm’ PO Box 621 Deniliquin NSW 2710 ABN: 77 015 943 276 Ph: 0427 813710 E: [email protected] Acknowledgements
The author wishes to acknowledge the contributions and support of the following people and organisations in the development of this report:
• Narromine Irrigation Board of Management sub-committee and Board • Narromine Irrigation Board of Management members • Farrell Coyne Projects • Mr Mark Dugan, former chair of the NIBM • Ms Kim Fernance, Administration Manager, NIBM • Department of Agriculture and Water Resources • and all other people who have been generous with their time and information.
This document has been prepared for Narromine Irrigation Board of Management, supported by the Australian Government’s Sustainable Rural Water Use and Infrastructure Program. Disclaimer
While every effort has been made to ensure the accuracy of material which appears in this document, Michael McBurnie Irrigation Designs makes no representation in any form as to the completeness or correctness of the information contained herein and cannot accept any legal responsibility for errors, omissions or consequences of any action taken by users of this information. This document is intended to be used as a guide only. M.K. McBurnie accepts no responsibility or liability whatsoever for any decision, action, loss, damage or otherwise arising from the supply of this information or for the use of or reliance on this information. All information contained herein, including costs and infrastructure size estimates should not be relied upon for construction or any other purpose other than intended. The Narromine Irrigation Board of Management has relied on independent consultants to provide information and findings in this report. Copyright
All rights reserved. No content may be removed, reproduced, electronically stored or transmitted in any form without the express written consent of the Narromine Irrigation Board of Management and M.K. McBurnie.

NIBM PIIOP Final Project Report October 2017 iii
Chairman’s Forward
‘There was much deliberation amongst the NIBM committee as to whether we applied for the PIIOP funding. It was a significant process to go through to be ultimately granted funding. The Board’s decision to apply for the funding and succeed meant many years of hard work and endless meetings. The low use, high loss areas of the scheme were identified and rationalised along with other water saving measures such as, installation of a separate stock and domestic pipeline, lining porous sections of the channel system with EPDM liner or clay, replacing the old dethridge wheels with modern outlets using accurate metering and telemetry automated flow control. The project structure was very unique as the Narromine scheme partnered directly with the Commonwealth Government to achieve a very successful outcome. Proof is in the modernised, water efficient system we are now using. A system that will ultimately benefit the environment, the landholders using the system and the wider community. The project did not run over budget, there were nil on site injuries and all the objectives the project set out to achieve were completed. As acting chairman throughout the NIBM PIIOP project, I feel incredibly proud of what we have achieved. Everyone involved contributed to the great success of this project.’ Mr Mark Dugan, Chair NIBM 2010-2017

NIBM PIIOP Final Project Report October 2017 iv
Contents
Chairman’s Forward .................................................................................................................................. iii
Executive Summary .................................................................................................................................... 1
1. Introduction ............................................................................................................................................ 4
1.1 Background ........................................................................................................................................ 4
1.2 Strategic Planning and Scheme Modernisation ............................................................................... 7
1.3 PIIOP Application ............................................................................................................................... 8
2. Administration ...................................................................................................................................... 10
2.1 Governance ...................................................................................................................................... 10
2.2 Project Management ....................................................................................................................... 10
2.3 Project Communication ................................................................................................................... 11
3. Construction and Works ....................................................................................................................... 12
3.1 Overarching Practices ...................................................................................................................... 12
3.2 Work, Health and Safety ................................................................................................................. 12
3.3 Environment .................................................................................................................................... 12
3.4 Quality Assurance ............................................................................................................................ 13
3.4.1 General ............................................................................................................................................. 13
3.4.2 Regular Inspections ......................................................................................................................... 13
3.4.3 Photographic Evidence .................................................................................................................... 13
3.4.4 Inspections and Test Plans .............................................................................................................. 13
3.4.5 Compliance Inspections and Testing ............................................................................................... 14
3.4.6 Work as Executed Drawings ............................................................................................................ 14
3.5 Board Involvement .......................................................................................................................... 14
4. Key Performance Indicators and Objectives ........................................................................................ 15
4.1 Project Outcomes ............................................................................................................................ 16
4.2 Water Entitlements ......................................................................................................................... 17
4.3 Long-Term Benefits ......................................................................................................................... 18
5. Proponent Case Studies ........................................................................................................................ 20
Red Zone (rationalisation area)—Dave and Jacinta Kinsey—“Carrigan” ............................................ 20
Red Zone (rationalisation area)—James and Amanda Hamilton—“Gundooi” ................................... 23
Green Zone (modernisation area)—Martin and Maryanne McKinney—‘Myall Plain’ ....................... 26
Green Zone (modernisation area)—Mark and Sarah Dugan—‘Maroondah’ and ‘Onoville’ .............. 29
6. Construction Methodology and Process .............................................................................................. 32
Stage 1—1 September 2012 to 31 October 2013 (14 Months) ............................................................ 32
Stage 2—1 November 2013 to 30 November 2014 (13 Months) ......................................................... 32

NIBM PIIOP Final Project Report October 2017 v
Stage 3—1 December 2014 to September 2015 (9 Months) ............................................................... 33
7. Lessons Learned .................................................................................................................................... 36
7.1 Importance of Good Governance ................................................................................................... 36
7.2 Communication ............................................................................................................................... 37
7.3 Linking the Farm to the Scheme ..................................................................................................... 37
7.4 Adoption of Technology and Change .............................................................................................. 37
7.5 Project Management ....................................................................................................................... 38
8. References ............................................................................................................................................ 39
Appendix 1 Breakdown of organisation structures for the NIBM PIIOP ................................................ 40
Appendix 2 Work zone breakdown of the NIS ........................................................................................ 41
Appendix 3 Key Performance Indicators and Outcomes......................................................................... 42
3.1 Background ...................................................................................................................................... 42
3.1.1 Estimating the Impact of PIIOP ....................................................................................................... 42
3.1.2 Water Efficiency Measures and Productivity ................................................................................. 42
3.1.3 Links to Irrigation Communities ...................................................................................................... 43
3.1.4 Key Assumptions ............................................................................................................................. 44
3.1.5 Model Farms .................................................................................................................................... 45
3.2 The Impact of the Stock and Domestic System .............................................................................. 47
3.3 Water Efficiency Outcomes ............................................................................................................. 47
3.4 Crop Production Outcomes ............................................................................................................. 51
3.5 Large Farms without Groundwater................................................................................................. 52
3.6 Large Farms with Groundwater ...................................................................................................... 55
3.7 Small Farms without Groundwater ................................................................................................ 57
3.8 Small Farms with Groundwater ...................................................................................................... 60
3.9 Overall Outcomes ............................................................................................................................ 62
3.10 Overall NIBM Scheme Level Outcome .......................................................................................... 63
3. 11 Conclusion ..................................................................................................................................... 64
3.12 Disclaimer ...................................................................................................................................... 65
Photos
Photo 1 Dave Kinsey in front of one of the new water troughs on ‘Carrigan’ .............................................. 21 Photo 2 New fencing and laneways systems have been incorporated with the location of water troughs 22 Photo 3 Dave Kinsey in front of a 250,000 litre water tank installed on ‘Carrigan’ ...................................... 22 Photo 4 Typical 120,000 litre main header tank installed on ‘Gundooi’ ....................................................... 24 Photo 5 Troughs installed on ‘Gundooi’ ........................................................................................................ 25 Photo 6 Martin McKinney at one of his new farm outlets—capable of delivering over 30 megalitres per day ................................................................................................................................................................. 27

NIBM PIIOP Final Project Report October 2017 vi
Photo 7 Martin McKinney with some recently installed infrastructure used in the production of irrigated cotton ............................................................................................................................................................ 28 Photo 8 Mark Dugan beside a new high flow outlet ..................................................................................... 30 Photo 9 Improved water security has allowed Mark to invest in on-farm irrigation infrastructure—such as this bankless channel layout ......................................................................................................................... 31 Photo 10 New channel crossing and liner installation upstream of ‘Myall Plain’ ......................................... 34 Photo 11 Completed liner installation at ‘Myall Plain’ .................................................................................. 34 Photo 12 Construction of the stock and domestic pipeline by Mitchell Water ............................................ 35 Photo 13 Newly installed flume gate regulating structure, with farm outlet in the background ................. 35 Photo 14 Part of the project team which oversaw implementation of the Modernisation Plan ................. 36
Figures
Figure 1 Location of NIBM ............................................................................................................................... 5 Figure 2 Flowchart of water trading from NIS to the CEWH as part of the Modernisation Project ............. 17 Figure 3 Pre-project pumping with trades .................................................................................................... 48 Figure 4 Delivery efficiency and transmission losses .................................................................................... 49 Figure 5 Modelled farm gate delivery pre and post project ......................................................................... 50 Figure 6 Water delivery efficiency ................................................................................................................. 50 Figure 7 Scheme level water entitlements .................................................................................................... 51 Figure 8 Modelled total area of cotton planted ............................................................................................ 52 Figure 9 Modelled hectares of cotton for large cotton farms without groundwater ................................... 52 Figure 10 Modelled financial outcomes for large cotton farms without groundwater ................................ 53 Figure 11 Modelled changes in equity for large cotton farms without groundwater .................................. 54 Figure 12 Modelled hectares of cotton for large cotton farms with groundwater ...................................... 55 Figure 13 Modelled financial outcomes for large cotton farms with groundwater ..................................... 56 Figure 14 Modelled changes in equity for large cotton farms with groundwater ........................................ 56 Figure 15 Modelled hectares of cotton for small cotton farms without groundwater ................................ 57 Figure 16 Modelled financial outcomes for small cotton farms without groundwater ................................ 58 Figure 17 Modelled changes in equity for small cotton farms without groundwater .................................. 59 Figure 18 Modelled hectares of cotton for small cotton farms with groundwater ...................................... 60 Figure 19 Modelled financial outcomes for small cotton farms with groundwater ..................................... 61 Figure 20 Modelled changes in equity for large cotton farms with groundwater ........................................ 61 Figure 21 Cumulative cash flow balance for the NIBM Scheme ................................................................... 64
Tables
Table 1 Summary of the key outcomes of the Narromine-Nevertire Irrigation Scheme Modernisation Project ........................................................................................................................................................... 15 Table 2 Summary of the key works of the Narromine-Nevertire Irrigation Scheme Modernisation Project16 Table 3 Predicted financial performance of all farms during the 14-year modelling period ........................ 63

NIBM PIIOP Final Project Report October 2017 1
Executive Summary
The Narromine Irrigation Scheme (NIS) has been operating in the Macquarie Valley of NSW since 1971.
The Scheme is approximately 120,000 hectares in size, operating some 350 kilometres of earthen channels and with its members holds approximately 60,000 megalitres of water entitlements.
Water allocations are based on the quantity of water stored in Burrendong Dam and has predominately been used for the production of irrigated cotton in recent times. General Security water allocations vary quite significantly, anywhere between 0 per cent and 100 per cent.
Water losses were quite high, particularly in years when water allocations were low, with seepage losses accounting for a significant proportion of these losses. Prior to modernisation, delivery efficiency of the Scheme averaged around 62 per cent.
In February 2011 the Australian Government invited applications for funding under Round 2 of the Private Irrigation Infrastructure Operators Program (PIIOP) in New South Wales.
The program aims to improve the efficiency and productivity of water use and management of private irrigation networks to deliver water savings for the environment. Water entitlements resulting from water savings generated from eligible projects, would be used to help secure a sustainable future for irrigation communities.
PIIOP projects would allow private irrigation infrastructure operators and their customers to reduce water losses and manage their water allocations more efficiently. Projects would assist irrigation communities to adapt to a future scenario of reduced water availability due to climate change. PIIOP was one of the major elements of the Inter-Governmental Agreement on Murray-Darling Basin Reform.
Subsequently, the Narromine Irrigation Board of Management (NIBM) made an application under Round 2 of PIIOP. The key objectives of the NIBM Modernisation Project were to:
• build an efficient irrigation supply system that reliably supplies water to its members • deliver substantial and lasting returns of water for the environment • implement channel lining options that minimise seepage • install accurate and reliable flow control • install accurate and reliable water measurement systems that comply with Australian
standards • install an accurate and reliable monitoring system to provide operational data to support
management decisions • improve the pump control system to optimise energy use efficiency • develop an appropriate maintenance program to manage the scheme’s assets.

NIBM PIIOP Final Project Report October 2017 2
To complement the objectives, a series of key outcomes for the NIBM Modernisation Project were developed to:
• enhance the viability of irrigated agriculture in the Lower Macquarie Valley by contributing to more sustainable and efficient diversions from the Macquarie River and enable users to grow more with less water
• optimise the sustainability of the NIS by generating alternative renewable energy and managing pump power consumption efficiently
• set the benchmark for the delivery of a successful (on time and on budget) modernisation project conforming to the National Code of Practice for the Construction Industry (and its successor codes).
NIBM received funding of $60,237,244 and transferred water entitlements that will return 8,411 megalitres every year on average over the long-term to the Commonwealth to help bridge the gap in the Macquarie catchment.
Project construction was completed in December 2015. Works undertaken were:
• decommissioning 80 kilometres of the scheme’s channels, including the removal and recycling of approximately 100 redundant structures
• retiring 19 properties from irrigation • modernising 161 kilometres of water delivery channels (including EPDM lining, clay
lining and refurbishment) • constructing 13 kilometres of channel realignment • upgrading the pump site’s electrical controls and software to integrate it into the new
automated water management system • modernising the water supply control system and its telemetry, including installing up to
44 flume gates and secondary regulating structures • replacing all dethridge wheels with approved meters to national standards • construction of a secure stock and domestic water supply pipeline over 190 kilometres to
supply water to up to 60 outlets.
Analysis and modelling shows the PIIOP project was an outstanding success in terms of improving delivery efficiency and reducing transmission losses.
Delivery efficiency improved from 69 to 92 per cent on average which is an average improvement of 23 per cent per year. This improved delivery efficiency is the key reason for the modelling, demonstrating improved crop production for individual irrigators despite the reduction in water entitlements held by irrigators. The modelling also shows that water availability and delivery risk has been greatly reduced as Narromine members can now order water delivery in years of low allocations.
The improved efficiency of the NIS will have a significant positive impact on the long-term profitability and sustainability of the Scheme itself and its members, and will provide ongoing benefits to the broader community of Narromine and its surrounds.
The project has demonstrated that by undertaking a co-operative and collaborative approach, governments and landholders can achieve significant positive outcomes which generate ‘triple

NIBM PIIOP Final Project Report October 2017 3
bottom line’ benefits. Undertaking appropriate levels of due diligence, informing and effectively communicating with the local community and engaging skilled industry personnel, has resulted in this extremely positive outcome.

NIBM PIIOP Final Project Report October 2017 4
1. Introduction
The Narromine Irrigation Board of Management (NIBM) committee held its Inaugural Meeting in 1965 with 150 prospective members in attendance. This scheme was the brainchild of B.F Crawford, H.V Drew, A.J Heywood, H.R Shepherd and J Piggott.
The organisers of this meeting felt it was time to get the landholders together and make an application to the NSW Government to be considered as recipients of water from Burrendong Dam (Burrendong Dam commenced storing water in April 1965 and was officially opened in 1967). Construction of channels commenced in February 1970 and pumps were installed in July. Irrigators began receiving water in February 1971.
The NIBM operates as a Statutory Authority under the Water Act 1912 (NSW) and has a Board of Management with 10 members. The members are elected by the Property Owners and meet monthly.
1.1 Background
The Narromine Irrigation Scheme (NIS) is located on the outskirts of Narromine, a vibrant regional town with a population of 3,800. Narromine is located 447 kilometres west of Sydney (by road) in the Central West region of New South Wales, 40 kilometres north-west of the regional centre of Dubbo.
The NIS covers an area of approximately 120,000 hectares with 350 kilometres of earthen, clay lined and compacted channels. Water is pumped from the Macquarie River by eight electric pumps providing a combined pumping capacity of 1,000 megalitres per day. This irrigation water is used to grow a variety of crops and pastures including cotton, wheat and canola.

NIBM PIIOP Final Project Report October 2017 5
Figure 1 Location of NIBM
Source: Western Land Planning (2010)

NIBM PIIOP Final Project Report October 2017 6
The Scheme lies within the Macquarie River catchment which covers an area over 70,000 kilometres squared and represents approximately 7 per cent of the Murray-Darling Basin. The catchment area extends from the Macquarie/Coxs River catchment division east of Oberon and converges with the Barwon/Darling River catchment near Brewarrina. The Macquarie River Catchment can be subdivided into three distinct geographical zones:
• Tablelands Zone between Oberon and Mudgee typical consists of plateau formations with hilly to steep local relief
• Riverine Slopes Zone between Mudgee and Dubbo consists of generally hilly relief where the Macquarie River gradient is greatest. From Wellington this landform tends to broaden into alluvial plains with a decrease in local relief
• Riverine Plains Zone west of Dubbo with broad alluvial plains and local relief generally less than 1 per cent. There are slightly elevated ridges associated with isolated areas of Aeolian sand deposits. This area is defined as the Lower Macquarie River Catchment and includes the Narromine Irrigation District.
The relatively flat topography of the Narromine Irrigation District generally consists of floodplains, backplains and meander plains of intermittent and perennial water courses. Local topographic features ensure that surface drainage and infiltration assists in the replenishment of ground and surface water resources in the catchment area.
On-farm water storages in the district have had a significant role in securing water for farm activities. Water is essential to farm operations and farm lifestyle is secured by locating a reliable source, transporting and effectively storing an accessible water supply. Prolonged drought conditions and the impact on farming families are aligned to water supply and availability.
Groundwater supply is a significant factor in enhancing the security of farm water supply in the Lower Macquarie Valley. There are a number of known groundwater recharge and discharge areas within the Narromine Irrigation District. Groundwater movement has a strong correlation with surface water movement. Groundwater recharge occurs from surface water seepage through porous layers of sand or fractured rock and will be influenced by topography and soils composition.
Groundwater is an important resource to irrigation, stock, domestic, town water and industry in the Macquarie River catchment and also makes a substantial contribution to maintaining aquatic environments. There are a number of groundwater systems in the Macquarie River catchment that feed many surface water ecosystems and often provide the base flows in streams and rivers.

NIBM PIIOP Final Project Report October 2017 7
1.2 Strategic Planning and Scheme Modernisation
The NIBM long-recognised the challenges faced by it and its members in a highly variable water availability context which typifies surface irrigation allocations in the Macquarie Valley. These challenges threatened the continuing viability of the Scheme and its members. Access to reliable, cost competitive irrigation water is one of the key drivers of economic and social viability to the NIS, its members and the broader Macquarie Valley.
This realisation by the Board and its members lead to the development of a modernisation plan. Funding assistance was secured in 2010 via the Australian Government’s Irrigation Modernisation Assistance Program Round 3 to assist the NIBM further develop its Modernisation Plan.
The Modernisation Plan considered the issues affecting NIS in a strategic, integrated manner and included consideration of:
• structure and governance arrangements of NIBM • planned investment in existing irrigation assets, including supply infrastructure through
upgrading, replacement or reconfiguration of assets • customer base and relationships with other water users from the same water supply • opportunities to improve knowledge of water use in the system through improvements to
metering • existing irrigation infrastructure, efficiency of the water delivery system and opportunities
for efficiency improvements, including a quantification of estimated water savings from the options explored
• future strategy for the irrigation district in the short-term (to 2012) and long-term (to 2030).
The Modernisation Plan, identified a range of options focussing on the need to improve the delivery efficiency of the NIS. As part of the implementation process, red and green zones were identified. Red zones being areas to be rationalised and green zones being areas to modernise.
With a clear direction set, the NIBM went about securing the approval and support of its members to submit an application to secure funding to upgrade, modernise and rationalise its scheme, whilst returning permanent water entitlements to the Commonwealth for environmental projects within the Macquarie Valley.

NIBM PIIOP Final Project Report October 2017 8
1.3 PIIOP Application
An application under the Australian Governments Sustainable Rural Water Use and Infrastructure Program through its Private Irrigation Infrastructure Operators Program (PIIOP) in NSW was submitted in 2011.
The application addressed a number of specific components, including:
• improving the irrigation efficiency of the entire scheme, from the river to the plant, including the delivery infrastructure and the operations of the NIBM members
• providing water to the Commonwealth for environmental flows, while maintaining the high level of agricultural production within the region
• providing water entitlements for much needed environmental flows to the Macquarie Marshes to return water sources to environmentally sustainable levels of extraction
• maintaining and enhancing the opportunity for irrigated agriculture to operate within a management structure that is efficient and sustainable
• modernising the scheme using robust materials, design, technology and construction practices to ensure long-term benefits of the project
• supporting the local community as a result of both the construction period of the project and by underpinning the agricultural based economy of the region
• facilitating the opportunity for farmers in rationalisation zones to transition out of intensive irrigation and support alternative enterprises
• providing access for all existing members to high security stock and domestic water through a pressurised pipeline separate to the irrigation water delivery system.
As a result of its application, NIBM received project approval in 2012 for its program of works under Round 2 of the PIIOP. The NIBM received funding of $60,237,244 and transferred water entitlements that would return 8,411 megalitres every year on average over the long-term to the Commonwealth to help bridge the gap in the Macquarie catchment.
The key objectives of the NIBM Modernisation Project were to:
• build an efficient irrigation supply system that reliably supplies water to its members • deliver substantial and lasting returns of water for the environment • implement channel lining options that minimise seepage • install accurate and reliable flow control • install accurate and reliable water measurement systems that comply with Australian
standards • install an accurate and reliable monitoring system to provide operational data to support
management decisions • improve the pump control system to optimise energy use efficiency • develop an appropriate maintenance program to manage the scheme’s assets.

NIBM PIIOP Final Project Report October 2017 9
To complement the objectives of the NIBM Modernisation Project, a series of key outcomes were developed to:
• enhance the viability of irrigated agriculture in the Lower Macquarie Valley by contributing to more sustainable and efficient diversions from the Macquarie River and enable users to grow more with less water
• optimise the sustainability of the NIS by generating alternative renewable energy and managing pump power consumption efficiently
• set the benchmark for the delivery of a successful (on time and on budget) modernisation project conforming to the National Code of Practice for the Construction Industry (and its successor codes).
Construction on this project was completed in December 2015 and involved:
• decommissioning 80 kilometres of the scheme’s channels, including the removal and recycling of approximately 100 redundant structures
• retiring 19 properties from irrigation • modernising 161 kilometres of water delivery channels, including EPDM lining, clay
lining and refurbishment • constructing 13 kilometres of channel realignment • upgrading the pump site’s electrical controls and software to integrate it into the new
automated water management system • modernising the water supply control system and its telemetry, including installing up to
44 flume gates and secondary regulating structures • replacing all dethridge wheels with approved meters to national standards • construction of a secure stock and domestic water supply pipeline over 190 kilometres to
supply water to up to 60 outlets.

NIBM PIIOP Final Project Report October 2017 10
2. Administration
2.1 Governance
The NIBM had structured their management systems and allocated responsibilities to various parties as per the project Organisation Chart (Appendix 1) to manage risks and responsibilities defined in the Funding Agreement between the Commonwealth of Australia and NIBM.
NIBM had ensured compliance and managed risks associated with:
• work, health and safety (WH&S) • inclement weather • contractors performance • contract and subcontract disputes • exchange rate fluctuations • international freight • material storage and distribution • land owners requirements • lawful tree removal • fauna damage to works.
The NIBM Modernisation Project had been delivered within the performance obligations set out in the PIIOP application and scope of works managed within available funding limits.
2.2 Project Management
The Project Manager and Design Manager co-ordinated and developed the full design documentation for:
• channel earthworks and liner • structures and civil works • fencing • metering gates and telemetry • new pump and pump station automation • stock and domestic pipeline.
The Project Manager prepared tenders and engaged contractors on behalf of NIBM for the works as staged and prioritised by the Board and scoped in accordance with available funds. The Project Manager administered and acted as Superintendent on each contract which included:
• tender preparation and tender review • assessing and processing all progress claims • contract communications for requests for information, site instructions, variation orders etc. • co-ordinating quality assurance • co-ordinating handover and commissioning including issuing practical completion
certificate • compiled work as executed drawings, operation and maintenance manuals and organised
operator training for the scheme staff.

NIBM PIIOP Final Project Report October 2017 11
2.3 Project Communication
An effective communication plan was required to create a bridge between the diverse stakeholders involved in the project. The plan was required to account for the differing levels of expertise, the various perspectives and interests during the project’s execution with the end result being to ensure that all stakeholders were effectively involved in the project.
The Project Organisation Chart (Appendix 1) identifies all the contractual links and lines of communication between all of the stakeholders on the project.
The main methods of communication between the Parties to the Funding Agreement were:
• weekly teleconferencing with NIBM Executive, Project and Design Managers, noting actions on all areas of the project that needed addressing and reporting on construction and design progress
• fortnightly teleconferencing between the department, NIBM Executive and the Project Manager, whereby the department issued minutes/notes of these conference calls
• monthly NIBM Board meetings with the Project Control Group, where the Project Manager presented a report on all aspects of the project
• milestone reporting as scheduled in the Funding Agreement. At the monthly NIBM Board meetings with the Project Control Group, the Board members were required to consider design presentations and make decisions on the various options offered to them by the Design Consultants and the Project Manager.
Accurate financial cost reporting and scope of work assessment were fundamental activities of the Project Control Group.

NIBM PIIOP Final Project Report October 2017 12
3. Construction and Works
3.1 Overarching Practices
Farrell Coyne Projects Pty Ltd (FCP) developed a project delivery strategy which was approved by the Department of Employment in October 2013.The project was delivered via a number of minor works contracts, contractors were not required to be accredited under Federal Work, Health and Safety (WH&S) regulations.
This enabled cost savings to be achieved and delivered the remaining project within funding levels without compromise to WH&S, which was managed under the NIBM WH&S policy.
3.2 Work, Health and Safety
The project was entirely delivered through direct contracts with the various subcontractors. NIBM developed a WH&S policy that acted as an “umbrella” policy for all subcontractors with each subcontractor submitting their own WH&S policy which had to meet the requirements outlined in the NIBM WH&S policy. The Project Manager through the appointed Site Supervisors (Safety Officer) ensured compliance with this policy by all contractors, consultants and suppliers.
Minor Works contracts did not exceed $2.73 million in contract value and no contractor was engaged on cumulative contracts in excess of $2.73 million at any stage of the works in order to comply with the Government’s policy for Federally Accredited Contractors.
The construction of the stock and domestic system was a major contract – with a value over $2.73 million. As such, the successful tenderer, Mitchell Water, was required to obtain Federal accreditation for this component of the modernisation project.
Over the 36-month construction duration on the Project, there were no Lost Time Injuries or Medical Treatment Injuries recorded on the project.
3.3 Environment
Each Contractor was required to submit a Construction Environmental Management Plan (CEMP) for approval by the Superintendent before any works could commence. Each CEMP submitted for works on the project was assessed by the Superintendent to ensure that it provided systems and procedures in a suitable framework that ensured the establishment and maintenance of best practice controls to manage potential environmental impacts associated with project activities in accordance with contract requirements, relevant legislation and project objectives. The Scheme was exempt from the requirement to obtain approvals for works that occurred within the 40m irrigation easement under the Water Management Act 2000 (NSW). Where works were performed outside this easement, approval was received from the relevant Authority.

NIBM PIIOP Final Project Report October 2017 13
This included:
• replacing existing Narromine Shire Road Crossings • building new pump station sheds and tanks for the Stock and Domestic system at the
Macquarie River yard • constructing pipelines under the Rail Corridor.
3.4 Quality Assurance
3.4.1 General
To ensure that all aspects of the project were constructed to a high standard, a Quality Assurance Process was required. The backbone of the process was through Inspection and Test Plans (ITPs) that were developed in accordance with the requirements of the Geolyse Specifications and Drawings for each work package. The Superintendent reviewed the ITPs before they were implemented onsite to ensure conformance with the Specifications and Drawings.
The main quality control measures are described below.
3.4.2 Regular Inspections
During the construction process, NIBM and FCP representatives regularly visited the site to ensure construction was proceeding according to the relevant designs, standards and program. The contractor requested inspections at various “hold points” as defined in the contracts.
3.4.3 Photographic Evidence
During the regular inspections, photographs were taken of key areas of the sites and kept as evidence. Examples of stages at which photographs were taken included;
• documenting sub-grade conditions • arrangement of reinforcing steel • concrete placement • pre-construction conditions.
3.4.4 Inspections and Test Plans
All Contractors were required to develop and implement ITPs for each work process as detailed in the Specifications and Drawings. The ITPs required the inclusion of a number of “hold points” for sign off by the Superintendent. These “hold points” were a critical item to ensure all works were being undertaken in accordance with the stated processes.
The Concrete and Bulk Earthworks Specifications clearly state the inspection and testing requirements.

NIBM PIIOP Final Project Report October 2017 14
3.4.5 Compliance Inspections and Testing
Inspections and tests were carried out by the various Contractors to ensure compliance with the Contract requirements and included as a minimum all inspections and tests which were specified in the Specifications and Drawings as part of the Contract.
All compliance testing was carried out by laboratories registered with NATA who were certified for the appropriate tests. If the results indicated non‐conformance, further work was permitted until a non‐conformance notification was submitted and corrective action was approved by FCP.
Each such notification by the Contractor included details of the action proposed for correction of the non‐conformance or the arrangements made for its disposition and the amendments to its quality system to mitigate recurrence of the non‐conformance.
3.4.6 Work as Executed Drawings
The levels of all structures and earthworks profiles are a critical element of a gravity feed irrigation scheme. Work as Executed (WAE) Drawings were a critical item to verify that the design requirements were met.
All Contractors were required to provide detailed WAE Drawings for all works completed. This verified that all levels had been constructed in accordance with the design.
3.5 Board Involvement
NIBM actively managed their obligations under the Funding Agreement, engaging expertise in all relevant disciplines to ensure compliance. They committed substantial time to the project and where necessary established sub-committees to deal with specific issues, with the project benefitting by effective NIBM involvement. The Board maintained an active involvement in the project throughout its duration – from planning and inception to practical completion. Along with the Project Manager and Design Management Team, monthly meetings were conducted and physical site inspections undertaken. This allowed a ‘first hand’ appreciation and recognition of any issues, and allowed swift resolution of matters. This process enabled the Board to gauge progress of works against milestones and compliance.

NIBM PIIOP Final Project Report October 2017 15
4. Key Performance Indicators and Objectives
The modelling results in Appendix 3 have been used to assess the performance of the project against the PIIOP’s key performance indicators. The NIBM Modernisation Project has been an outstanding success against these indicators.
One of the key outcomes was the improvement in delivery efficiency from 69 per cent to a predicted 92 per cent - in the main generated by seepage losses and improvements in water management and control. Table 1 provides a summary of the key outcomes of the NIBM Modernisation Project.
Table 1 Summary of the key outcomes of the Narromine-Nevertire Irrigation Scheme Modernisation Project
Key performance indicator Outcome
Program delivers the contracted share of the water savings in the form of water entitlements transferred to the Australian Government
The Narromine Irrigation Scheme Modernisation Project has delivered 25,778 megalitres of water savings in the form of water entitlements to the Australian Government.
Reductions in water losses to farm gate and improvements in network water use efficiency, water management and monitoring
The Narromine Irrigation Scheme Modernisation Project has significantly improved water delivery efficiency from a long-term average of 69 to 92 per cent.
Reductions in on-farm water losses and improvement in on-farm water efficiency and water management
None from PIIOP off-farm modernisation works. However, 42 on-farm efficiency projects were undertaken as part of Narromine’s involvement in the Irrigated Farm Modernisation program administered by the NSW Department of Primary Industries. This achieved on-farm water savings, with 6,919 megalitres of these savings returned to the Australian Government as water entitlements.
Increases in the volume of available water from water savings and improved flexibility and control of water for irrigated crop production, livestock consumption and domestic consumption for customers/members of private irrigator infrastructure operators
The Narromine Irrigation Scheme Modernisation Project has increased the volume of available water for its remaining members via improved water delivery efficiency, on-farm efficiency projects, improved network management and rationalisation.
Reduction in the risks of water availability that result in water being available more frequently or in larger volumes for irrigation production that leads to additional opportunities for economic revenue for customers/members of private irrigation infrastructure operators, which assists in securing a sustainable future for associated irrigation communities.
The Narromine Irrigation Scheme Modernisation Project has reduced the risks associated with water availability, created opportunities for additional crop production and economic revenue, thereby improving the profitability and sustainability of its members and assisting with securing a sustainable future for associated irrigation communities.

NIBM PIIOP Final Project Report October 2017 16
4.1 Project Outcomes
Whilst the outcomes of the project are yet to be fully realised and quantified, the NIBM Modernisation Project has delivered significant results in terms of water management both for the Scheme operators and those members using water—both for irrigation, and stock and domestic purposes.
Section 5 (Proponent Case Studies) outlines some of those benefits indicated by members of the Scheme, whilst Appendix 3 provides some level of quantification as to the overall benefits of the Modernised Scheme.
Table 2 provides an overview of the key construction outcomes of the project—noting that the overall construction budget for this project was $38,500,000.
Table 2 Summary of the key works of the Narromine-Nevertire Irrigation Scheme Modernisation Project
Construction Parameter Outcome
Length of refurbished channel 89 km
Area of lined channel (EPDM) 650,000m2 Length of lined channel (EPDM) 32 km Number of farm outlets 60 Number of channel regulators 42 Number of channel structures 159 Length of stock and domestic pipeline 190 km Number of stock and domestic outlets 60 Length of channel fencing 65 km Pumping station upgrade Automation and telemetry network Across the supply network

NIBM PIIOP Final Project Report October 2017 17
4.2 Water Entitlements
As a component of the PIIOP process, in order to secure funding to modernise the Scheme, a number of water entitlements needed to be traded to the Commonwealth.
Figure 2 provides an overview of how and how many water entitlements were transferred from the Narromine Irrigation Scheme license to the Commonwealth. As a result of the Project, 25,778 megalitres of water entitlements were transferred to enable the construction of the modernised Scheme.
Source: NIBM, pers. comm.
Figure 2 Flowchart of water trading from NIS to the CEWH as part of the Modernisation Project

NIBM PIIOP Final Project Report October 2017 18
4.3 Long-Term Benefits
The primary reason in undertaking any modernisation project is to secure a positive economic impact of the works. One of the primary determinants of PIIOP-funded infrastructure projects revolve around changed opportunities for crop production, and revenue for ongoing members and reduction of debt by the sale of rationalised water.
The basic rationale of PIIOP is that the infrastructure works lead to improvements in water availability for irrigators (in terms of capacity to manage water and/or increased volume available). The main outcome of the water efficiency measures funded by PIIOP is to generate water savings by reducing the loss of water from irrigation networks and farms through seepage, evaporation and escapes. Estimates of the potential results of water savings rely on the extent to which:
• water that was previously lost is subsequently available for productive use by the irrigation network and its farmers
• changes in control over water and flexibility of delivery affect crop production.
Improved water delivery efficiencies in the network mean that systems can operate effectively with lower allocations. This can result in additional years of irrigated crop production to what was possible prior to the network upgrades. Additionally, such efficiencies can result in more effective delivery of water; that is the capacity to deliver a higher proportion of water to the crop root zone measured against the volume of water extracted from the river offtake.
Furthermore, on-farm investment alongside the off-farm network upgrades can result in a reduction in water losses from seepage through applying the right volume of water at the right time.
Improvements to water availability can enable increased crop production (in terms of more area under crop due to higher water volumes and/or improved yields through better water management). Increased production or better quality crops can lead to improved financial outcomes for irrigators. A reduction in the number of water entitlements in the system is not the key measure of a change in crop production. What matters is the volume reaching the crop root zone and the timing and control with which this water is delivered. The improved ability to plan and manage production under variable water allocations through improved water efficiency can also reduce business risk levels for farmers.
It is also likely that the modernisation of NIS will encourage some adjustment in existing agricultural practices. Anticipated changes will result from adjustments to water management and may promote:
• increased diversity in cropping assisted by an upgraded scheme delivery system reducing the need to irrigate in block waterings
• reconfiguring on-farm irrigation infrastructure based on likely future allocation predictions • a focus on crops that can be effectively grown in conjunction with seasonal rainfall events,
coupled with technology that will enable the farmer to produce in very low allocation years

NIBM PIIOP Final Project Report October 2017 19
• secure water delivery will facilitate new enterprise and employment opportunities within the irrigation district. The development of alternative industries supporting high value water efficient crops and their markets are essential for the future sustainability of the rural community
• drought proofing by securing water supplies for domestic and livestock production. (Western Land Planning Pty Ltd, 2010).
In addition, it is highly likely that a modernised irrigation system will further encourage upgrading and adoption of new technologies at the farm level, which will likely develop over-time to fully realise the benefits that the modernised supply system can deliver to members. These are likely to include:
• improving the precision of irrigation applications • increasing the matching of irrigation technology to soil type • improving the identification of appropriate irrigation water scheduling • increasing the use of tailwater capture and recycling systems • evaporation and seepage loss management from water storages and distribution systems
both at the scheme and on-farm level • increasing the use of routine monitoring and reporting systems • flexibility in changing the irrigation season focus from summer to a winter irrigation cycle • increasing the use of automation and control systems.
Such adoption of new technologies is likely to enable the farming systems of the NIS to be more profitable, more resilient and more likely to cope and respond to issues of reduced water availability and climate change.

NIBM PIIOP Final Project Report October 2017 20
5. Proponent Case Studies Red Zone (rationalisation area)—Dave and Jacinta Kinsey—“Carrigan” Property size: 3,200 hectares Irrigation area prior to rationalisation: 220 hectares Production pre-rationalisation: • irrigated crops included corn silage, winter cereals and winter forage crops. • significant dryland pastures and lucerne based improved pastures. • livestock—sheep. Property ownership: Held in the family since 1928 What were some of the issues you faced pre-rationalisation?
• being on the end of the scheme—always some uncertainty of water supply, particularly in low allocation years
• reliance on groundwater which had limited capacity to supply sufficient stock and domestic needs, often resulted in the temporary transfer of allocations to upstream irrigators.
Post rationalisation, what are the benefits?
• having the ability to come home to a green ‘oasis’ around the homestead. The mental benefit of being able to maintain a garden is something that is hard to put a value on—but is undeniably a huge benefit
• security of water supply for stock and domestic purposes • fresh water ‘on tap’, rather than livestock bogging up dams—improved water quality
improves livestock health • improved ability to manage livestock production and stocking rates • able to have stock confinement paddocks and rotational grazing • ability to better manage groundcover in dry times • ‘piece of mind’ knowing that water supply is one less issue to have to worry about. It gives
us confidence to build up fodder reserves on farm, which provides us with greater confidence (and flexibility) in our livestock enterprise
• not having to ‘chase’ irrigation water frees up a lot more time.
‘The overall benefit of what we have ended up with is fantastic—the security the scheme provides to us now in terms of stock and domestic supply allows us to confidently undertake (and invest in) our livestock program. Whereas, before
rationalisation, we were on the end of the system, and we never quite new what, when and how much water we were going to get’ —Dave Kinsey

NIBM PIIOP Final Project Report October 2017 21
Other benefits? • with the security of water supply for our livestock enterprises, we have the confidence and
ability to invest in other infrastructure on the farm—particularly fencing, laneways and fodder conservation. These investments will help us maximise our productivity, but also help us to better manage our land over the long term
• will probably encourage us to invest in other technologies—such as solar pumping etc, over time to reduce our costs
• we have had the confidence to employ another staff member (taking us from two to three full time staff).
Photo 1 Dave Kinsey in front of one of the new water troughs on ‘Carrigan’

NIBM PIIOP Final Project Report October 2017 22
Photo 2 New fencing and laneways systems have been incorporated with the location of water troughs
Photo 3 Dave Kinsey in front of a 250,000 litre water tank installed on ‘Carrigan’

NIBM PIIOP Final Project Report October 2017 23
Red Zone (rationalisation area)—James and Amanda Hamilton—“Gundooi” Property size: 1,636 hectares (plus some additional leased country) Irrigation area prior to rationalisation: 92 hectares Production pre-rationalisation:
• irrigated crops (mainly opportunistic cotton) • significant dryland pastures and around 1,200 hectares dryland cropping (wheat,
chickpeas, canola, lupins and barley) • livestock—sheep—450 self replacing ewes.
Property ownership: Held in the family since the mid 1990’s What were some of the issues you faced pre-rationalisation?
• our irrigation areas were on red soils—and had higher water use than some of the other soils of the District
• being on the end of the scheme - always some uncertainty of water supply and flow rates, particularly in low allocation years. To irrigate the 92 hectares often took 7–10 days —which was quite inefficient
• reliance on groundwater in low allocation years for stock and domestic water.
Post rationalisation, what are the benefits? • overall, we feel we have a much more ‘efficient’ and aesthetically pleasing property now,
especially since we have decommissioned the old irrigation infrastructure • having filtered, pressurised water to the house and gardens is an immeasurable positive • since having improved water supply, our garden and surrounds have ‘thrived’ not just
‘survived’! • psychological benefit of coming home to a thriving garden is hard to put a value on—but I
think we will really only gain a full appreciation of this when we go through the next prolonged dry spell
• security of water supply for stock and domestic purposes • fresh water piped to paddocks troughs will have a real benefit to the health of our
livestock—boggy, stagnant groundtanks can’t be overly good for the sheep • improved ability to manage livestock production and stocking rates.
‘Overall, we were very happy with how the process was managed by Narromine Irrigation and the Board. There was open communication throughout the process, and everyone was well informed. Apart from the obvious benefits the piped stock
and domestic scheme provides to us, just as importantly the project has resulted in a cohesive community, with the benefits of modernisation shared by all. It has been
a great outcome for all involved.’ —James Hamilton

NIBM PIIOP Final Project Report October 2017 24
Other benefits? • with the security of water supply for our livestock enterprises, we have invested in other
infrastructure, including fencing to allow us to better manage our pastures and soils over the long term
• the improved water quality has really benefited our gardens and we suspect also the health and production of our sheep.
Photo 4 Typical 120,000 litre main header tank installed on ‘Gundooi’

NIBM PIIOP Final Project Report October 2017 25
Photo 5 Troughs installed on ‘Gundooi’

NIBM PIIOP Final Project Report October 2017 26
Green Zone (modernisation area)—Martin and Maryanne McKinney—‘Myall Plain’ Property size: 1,860 hectares Irrigation area: 400 hectares Production:
• irrigated crops—50 per cent cotton and 50 per cent wheat • significant dryland pastures for livestock (cattle) production—approximately 800 hectares
dryland cropping (wheat, chickpeas, lupins and canola). Post modernisation, what are the benefits?
• stock and domestic system is one of the huge benefits of modernisation—the full benefits probably won’t be completely understood until we have a run of very low general security allocations
• expected very low levels of system water losses—which will allow the scheme to operate efficiently in low water availability years
• higher flows on-farm—allowing us to irrigate more efficiently • having better control of the system and water deliveries.
What have been some of the issues or concerns?
• we may see an increase in the operation and maintenance costs of the scheme • longevity of the liner is a bit of an unknown • we are likely to see a reduction in the level of staff in operating the scheme—at the
expense of increasing reliance on technology and external (and perhaps more expensive) expertise.
‘One of the things I’m looking to get out the modernised scheme is the greater flexibility it will provide. It allows us to make investment decisions at the farm-level with confidence—knowing that in the main, we will have access to some irrigation water in all but the lowest of allocation years. Because of the efficiency with which we can now deliver water, it should see the NIS being able to attract more water
into the area, and attract greater external investment. I think it is a win: win for us all —Martin McKinney

NIBM PIIOP Final Project Report October 2017 27
Other benefits? • working on a complex issue such as this has been challenging. Bringing our members
‘along for the ride’ and dealing with good and skilled people, has seen us end up with a result we should be proud of. Shows what can be achieved with good planning and good people!
• quality of the work—the products and earthworks—has seen us end up with high quality infrastructure, which stands us in good stead and will stand the test of time.
Photo 6 Martin McKinney at one of his new farm outlets—capable of delivering over 30 megalitres per day

NIBM PIIOP Final Project Report October 2017 28
Photo 7 Martin McKinney with some recently installed infrastructure used in the production of irrigated cotton

NIBM PIIOP Final Project Report October 2017 29
Green Zone (modernisation area)—Mark and Sarah Dugan—‘Maroondah’ and ‘Onoville’ Property size: 1,500 hectares Irrigation area: 730 hectares Production:
• irrigated crops—cotton, sunflowers, corn and sorghum • dryland cropping includes canola, wheat, lupins, chickpeas and barley.
Post modernisation, what are the benefits?
• having access to high quality river water for our stock and domestic needs • having a green garden and grounds has huge psychological benefits if you are going
through a drought • going from (water) losses of over 30 per cent to something like 10 per cent or less will be a
huge benefit and ‘selling point’ for the scheme • new outlets are providing real time data to both members and the scheme operators—
which should see improved delivery efficiency and the ability to better manage flows • having better control of the system and water deliveries • increasing the security of our farm and water assets • gives us greater confidence to invest in and upgrade our own irrigation infrastructure.
What have been some of the issues or concerns?
• service agreements and the potential increase in costs to individual members • unsure about the long term maintenance and longevity of the liner (and some other bits of
infrastructure) • greater reliance on external, technical expertise to operate the system • what happens if the technology fails? • government needs to continue to invest in our region to see our businesses and
communities prosper.
‘Securing long term irrigation efficiencies—both at the Scheme and farm levels — are critical to the success of our business and the region and the community it supports.
The investment we have made goes a long way to fulfilling this aim — but we can’t rest on our laurels — we need to keep moving forward’ — Mark Dugan

NIBM PIIOP Final Project Report October 2017 30
Other benefits? • easier to manage the system—particularly when ‘new’ people come in • provides real opportunities to take advantage of supplementary flow events • prior to modernisation—flow rates on farm were less than 20 megalitres per day—can now
obtain over 50 megalitres per day • ability to deliver water in low allocation years—it was not really viable before
modernisation because our delivery losses were so high • NIS now has the ability to identify more accurately those areas of the scheme where losses
are high and target these areas to remediate or manage to improve delivery efficiencies even more.
Photo 8 Mark Dugan beside a new high flow outlet
NIBM PIIOP Final Project Report October 2017 31
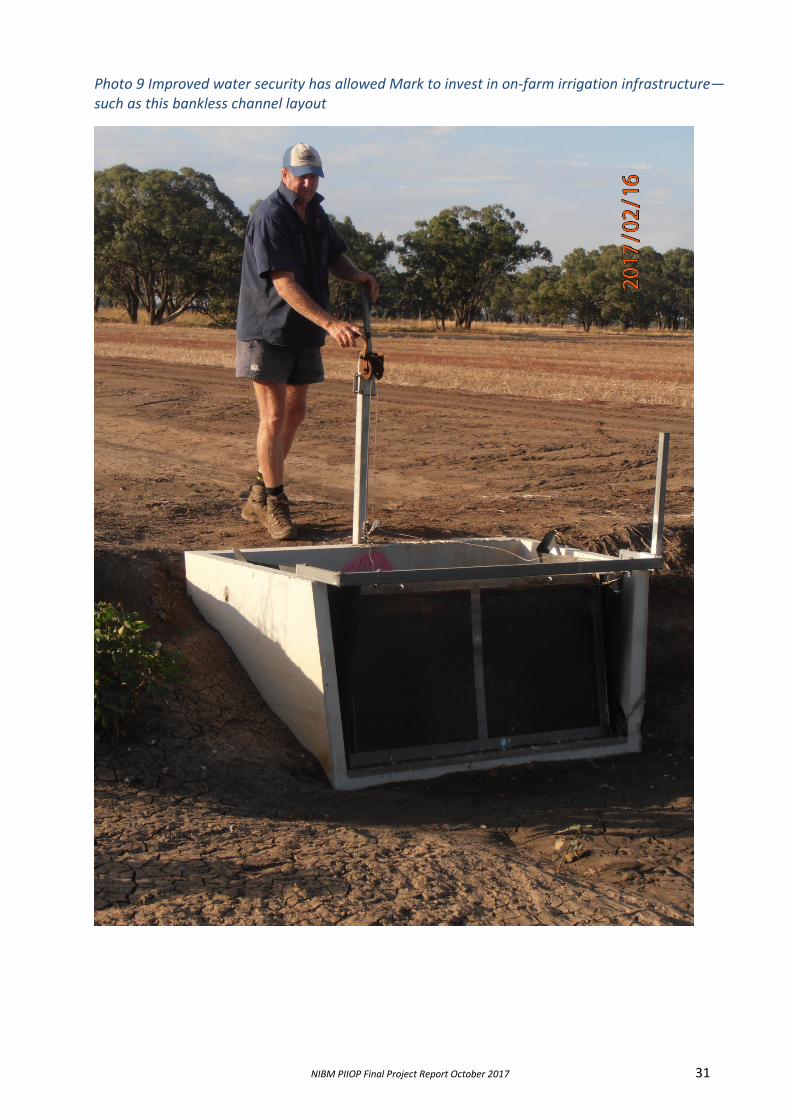
Photo 9 Improved water security has allowed Mark to invest in on-farm irrigation infrastructure—such as this bankless channel layout

NIBM PIIOP Final Project Report October 2017 32
6. Construction Methodology and Process
The Project Managers and FCP proposed a project delivery methodology whereby NIBM retained possession of the site and held “Contract Works” insurance for the project.
In case of the stock and domestic system contract, given the scope and size of the contract and works, the contractor was required to be Federally Accredited and the ‘site’ was ‘handed over’ to the contractor to undertake the works and was then ‘handed back’ to NIBM at the completion of the contracted works.
“Minor Works Contracts” were progressively let directly with NIBM as the Principal and FCP Projects as the Superintendent for the works, as design was completed for each work phase. The Organisation Chart for carrying out the Works is shown in Appendix 1.
Survey and early design work was carried out from August 2012 to August 2013 in order to commence construction.
The construction of the project was “staged” over three years from September 2012 to September 2015 and consisted of five Work Zones as shown in Appendix 2.
Stage 1—1 September 2012 to 31 October 2013 (14 Months)
In this period, works carried out included:
• survey of the whole project • design and construction of part of Work Zone 1 • design and tendering of the stock and domestic system.
Stage 2—1 November 2013 to 30 November 2014 (13 Months)
In this stage, the balance of the design was completed for:
• channel earthworks and lining • structure and civil works • fencing • meters, gates and telemetry • new pump and pump station automation.
Tenders were also completed and Contractors engaged to complete the various work zones undertaken as prioritised by the NIBM Executive and Board.
Work continued through the traditional irrigation season as no “water allocation” was received by NIS in 2013/2014.

NIBM PIIOP Final Project Report October 2017 33
The following Sub-projects were completed in this stage as follows:
• Sub-project 1—Scheme Modernisation o Modernisation work on the Channels was undertaken and completed in Work
Zones 2 and 5.
• Sub-project 2—Stock & Domestic System o These works were completed on 9 October 2014.
• Sub-project 3—New Pump & Pump Station Automation
o These works were completed on 16 September 2014. Stage 3—1 December 2014 to September 2015 (9 Months)
During this stage, other sub-projects were completed and work continued on completion of the scheme modernisation in general:
• Sub-project 2—Decommissioning Scheme Channels o These works were completed on 19 December 2014. o 35.7 kilometres were completed in 2013 and 45 kilometres were completed in
2014, giving a total of 80.7 kilometres of decommissioned channel on the scheme.
• Sub-project 1—Scheme Modernisation o These works were completed on 30 June 2015. o This included the remaining Work Zones 3 and 4.
• Sub-project 4—Channel Control System and Telemetry
o These works were completed on 28 August 2015. o There were 42 Rubicon FlumeGates installed on the total Scheme.
• Sub-project 5—Metering of Farm Outlets
o These works were completed on 28 August 2015. o There were 44 SlipMeters (ranging from 600mm to 900mm) and 15 Pipe End
Meters installed, giving a total of 59 Farm Outlet Meters on the Scheme.

NIBM PIIOP Final Project Report October 2017 34
The following photos highlight some of the construction phase of the project.
Photo 10 New channel crossing and liner installation upstream of ‘Myall Plain’
Photo 11 Completed liner installation at ‘Myall Plain’

NIBM PIIOP Final Project Report October 2017 35
Photo 12 Construction of the stock and domestic pipeline by Mitchell Water
Photo 13 Newly installed flume gate regulating structure, with farm outlet in the background

NIBM PIIOP Final Project Report October 2017 36
7. Lessons Learned
Some of the key learnings from implementation of the NIBM Modernisation Project are outlined below.
7.1 Importance of Good Governance
The NIBM and Project Managers adopted an approach which saw high levels of due diligence implemented and clear reporting lines adopted throughout the implementation of the project.
An important finding was that the NIBM and in particular a number of key Board members, took ownership of the project. They were confident in their due diligence processes in terms of the ‘team’ they had established and maintained a high level of ownership of the project from initiation to project completion.
There were high levels of understanding from both the NIBM and the Project Managers on the tendering process, costings and impacts of making certain decisions on the overall progress of the project.
The NIBM took the time to understand and be aware of some of the failings of other similar projects this approach saw the project implemented without major issues.
Photo 14 Part of the project team which oversaw implementation of the Modernisation Plan
Left to right: Hugh Greville (Farrell Coyne Projects), Martin McKinney (NIBM) Robert Sharp (NIS), Michael McBurnie (Consultant), John Gransbury (HydroPlan), Robert Farrell (Farrell Coyne Projects), Mark Dugan (NIBM), Col Hamilton (NIBM).
NIBM PIIOP Final Project Report October 2017 37
7.2 Communication
NIS members were kept informed of the progress—from the initial planning by the NIBM, the application and subsequent funding approval, right through to project completion.
Throughout the project, lines of communication remained open between the NIBM, the Project Managers and the Australian Government through its representatives and contractors.
Monthly meetings were held to ensure that the NIBM was kept abreast of progress and issues.
NIS members were also kept informed of progress and whilst there were a small minority of individual members who expressed some reservations about the project, there were high levels of satisfaction amongst NIS members on the outcomes of the project.
7.3 Linking the Farm to the Scheme
This was an important component of the design process.
The NIBM took the approach to understand the requirements of individual members (in terms of system requirements) prior to completing designs and any rationalisations.This was an effective way of ensuring the modernised scheme was able to deliver what its members required and to ensure the demands of members were adequately fulfilled into the future.
This was an important outcome of the project.
7.4 Adoption of Technology and Change
The project looked to replace and update technology and practices that had been implemented for over 50 years. This ‘change management’ process was no doubt challenging for individual members, the NIBM and the NIS staff.
This challenge was overcome in many respects by the NIBM engaging experienced industry leaders to assist them plan and implement their project through the completion of the necessary due diligence to ensure the right approaches and practices were being adopted.
It also highlighted the need for the NIBM to maintain a high level of involvement with the process and having the confidence of the individuals they engaged to deliver the project.

NIBM PIIOP Final Project Report October 2017 38
7.5 Project Management
Engaging highly capable Project Managers and individuals with the necessary skills was essential in the delivery of the project.
Having an independent peer review confirming works were delivered within specification was an important component in delivering the project, and ensured the project was completed to acceptable and appropriate standards.
Part of this was maintaining effective site supervision. There was a clear framework implemented to ensure high levels of on-site supervision and external review of contractors and their practices and/or products. This process ensured all involved had a clear understanding of the expectations required for delivery of the project.

NIBM PIIOP Final Project Report October 2017 39
8. References
Farrell Coyne Projects Pty Ltd (2015). Narromine Irrigation Scheme—Final Project Report. Farrell Coyne Projects Pty Ltd, Walsh Bay, NSW.
Narromine Irrigation Board of Management (2010). Irrigation Modernisation Plan. Western Land Planning, Dubbo, NSW.
Narromine Irrigation Board of Management (2011). Private Irrigation Infrastructure Operators Program NSW—Application. Narromine Irrigation Board of Management, Narromine, NSW.
Trangie Nevertire Co-operative Ltd (2016). Final Project Report under Round One of the Private Irrigation Infrastructure Operators Program in NSW. Trangie Nevertire Co-operative Limited, Trangie, NSW.

NIBM PIIOP Final Project Report October 2017 40
Appendix 1 Breakdown of organisation structures for the NIBM PIIOP

NIBM PIIOP Final Project Report October 2017 41
Appendix 2 Work zone breakdown of the NIS

NIBM PIIOP Final Project Report October 2017 42
Appendix 3 Key Performance Indicators and Outcomes
3.1 Background
3.1.1 Estimating the Impact of PIIOP
The long-term outcomes from the modernisation of the NIBM Scheme are not yet known as the construction work to modernise the Scheme has been recently completed. The real outcomes of modernisation will occur as the revised scheme operates over the next several years.
The information presented in this report has been estimated or modelled. The post-project outcomes are based on estimates of what the project could have achieved if the project was finished at the start of a 14 year sequence starting in 1999. These estimates do not predict the future but rather present an understanding of the impact of the modernisation works on crops and revenue.
The modelling has been informed by local external expertise and has been based wherever possible on actual results from the Scheme’s operation over the life of the modernisation project. The model was developed over a number of workshops with NIBM Board Members and the Department of Agriculture and Water Resources.
3.1.2 Water Efficiency Measures and Productivity
The primary economic impact of PIIOP-funded infrastructure projects revolves around changed opportunities for crop production and revenue for ongoing members and reduction of debt by the sale of rationalised water.
The basic rationale of PIIOP is that the infrastructure works lead to improvements in water availability for irrigators (in terms of capacity to manage water and/or increased volume available). The main outcome of the water efficiency measures funded by PIIOP is to generate water savings by reducing the loss of water from irrigation networks and farms through seepage, evaporation and escapes. Estimates of the potential results of water savings rely on the extent to which:
1. water that was previously lost is subsequently available for productive use by the irrigation network and its farmers
2. the extent to which changes in control over water and flexibility of delivery affect crop production.
Improved water delivery efficiencies in the network mean that systems can operate effectively with lower allocations. This can result in additional years of irrigated crop production to what was possible prior to the network upgrades. Additionally, such efficiencies can result in more effective delivery of water; that is the capacity to deliver a higher proportion of water to the crop root zone measured against the volume of water extracted from the river offtake.

NIBM PIIOP Final Project Report October 2017 43
Furthermore, on-farm investment alongside the off-farm network upgrades can result in a reduction in water losses from seepage through applying the right volume of water at the right times.
Improvements to water availability can enable increased crop production (in terms of more area under crop due to higher water volumes and/or improved yields through better water management). Increased production or better quality crops can lead to improved financial outcomes for irrigators. A reduction in the number of water entitlements in the system is not the key measure of a change in crop production, what matters is the volume reaching the crop root zone and the timing and control with which this water is delivered. The improved ability to plan and manage production under variable water allocations through improved water efficiency can also reduce business risk levels for farmers.
3.1.3 Links to Irrigation Communities
This final report does not describe other factors or predict what the outcomes will be in the future. What it does present is the outcomes of modelling of the changed opportunity for customers of private irrigation infrastructure operators for increased productivity and revenue created through the PIIOP program. It presents the difference created by PIIOP by comparing pre-project and post-project crop and revenue outcomes.
Increased crop production post project, generates revenue and greater water efficiency which can enable irrigators to better withstand the impacts of reduced water availability in the future compared to pre-project conditions. This could in turn lead to improved financial outcomes for irrigators.
Improved financial outcomes may result in increased disposable income which in turn increases expenditure in local communities helping to sustain irrigation communities. This can help support secondary employment (retail etc.) with more people being able to reside long term in townships because of a more secure economic base. More secure or increased population bases may lead to more services being available (teachers etc.).
Financial outcomes for irrigators, including disposable income in the future will depend on a variety of factors including available water, seasonal conditions, market conditions, and business decisions. In turn, actual outcomes for irrigator communities in the future will depend on a large number of factors for regional trends and influences.

NIBM PIIOP Final Project Report October 2017 44
3.1.4 Key Assumptions
To estimate the impact of PIIOP on the NIBM Scheme, a ‘whole-of-scheme’ model was created by the Department of Agriculture and Water Resources to describe the changes in water availability and the cumulative financial performance of remaining and exiting Scheme members pre and post-project.
The two key assumptions in the model are:
• a lengthy period would better understand water availability and efficiency than a single year
• understanding the cumulative interaction of cost, revenue and debt over a lengthy period would better understand the difference created by the opportunity for increased crop production than a single year’s profit/loss statement.
The post-project modelling is based on estimates of the impact PIIOP would have had on the NIBM Scheme if the construction work was finished 14 years ago. A 14-year period was chosen for the model because water efficiencies and crop production scenarios vary in dry, medium and wet years. Good quality data existed for that period from the Bureau of Meteorology and other publically available sources. The 14-year period reflects a diversity of climatic conditions and allocation decisions, with periods of relatively high water availability through to four years of no irrigated crop production. This provided a solid basis to test the future performance of the Scheme in a range of climatic conditions. The modelling was undertaken in a three stage process.
The first step to understanding the NIBM project outcomes was to model the pre-project relationship between crop production and the quantity of water available over the 14-year period 1999–2013.
The second step was to assume that the modernisation works were completed at the start of the 14 year period, changed volume of water entitlements to account for transfers to the Commonwealth and apply post-project water delivery efficiency outcomes. Consideration was also given to changed business practices by irrigators to take advantage of the modernisation outcomes. Restricting the changes to these limited variables allows for no change to market prices, weather patterns, or allocation announcements in the pre and post-project modelling.
The third step was to compare pre-and post-project outcomes to estimate the difference that can be attributed to the modernisation works funded by PIIOP.
The advantages of using a static past and changing only the water availability and efficiency variables is that it is possible to isolate the impact of PIIOP without estimating further variables such as rainfall patterns, crop prices and input costs. Commodity prices, for instance, are kept constant as these do not influence modelled outcomes, and changes in production in the scheme footprint is insufficient to affect commodity prices.

NIBM PIIOP Final Project Report October 2017 45
A decision-making matrix was used to generate crop outcomes for each model farm based on:
• crop production decision-making at planting times • a multi-year farm level water balance • sensible business strategies.
The estimates generated by the model of project outcomes in this final report have been informed by verified and publically available data sources. Collaboration between members of the NIBM Board and departmental officials was used to provide conservative estimates where data gaps existed and ensured that decision-making perspectives that inform crop production align with the experience of scheme members.
The post-project water delivery efficiency numbers have been derived from pondage testing and operation of the Scheme in 2012-13 to inform post-project efficiency, noting this is not the same as longer term actual outcomes. The model does not forecast post-project performance, however does estimate potential opportunities created through the infrastructure upgrades funded by PIIOP. Potential opportunities are measured in terms of crop production translated to pre-tax revenue outcomes for both farmers and for the Scheme as a whole.
Financial outcomes have been estimated for both pre and post project scenarios by tracking the cumulative cash flow of farm businesses (taking into account whole of farm costs and revenues in the context of debt). Cumulative cash flow outcomes across several years were used as it provides a clearer picture of possible financial outcomes for farmers.
3.1.5 Model Farms
The model is based on a ‘model farm’—a hypothetical picture of a representative farm’s water use, costs and revenues based on benchmarking data and the experience of people involved in the Scheme. Financial information was provided by a range of external sources - accountants, consultants, industry benchmarking information and also scheme members’ individual farm financial information.
The model farms do not present the costs and revenues or crop production of any actual farms, but have been road tested with farmers in the Scheme to ensure the model aligns with experience of farms of similar scale. Using a model farm also avoided any potential privacy issues.
There were four broad types of farms in the pre-project NIBM Scheme that were selected for modelling.
• pre-project—large farms (2,000 hectares with 1,595 megalitres of general security water entitlements)
• pre-project—large farms with groundwater (as above with an additional 1,600 megalitres of groundwater entitlements)
• pre-project—small farms (1,000 hectares with 587 megalitres of general security water entitlements)
• pre-project—small farms with groundwater (as above with an additional 100 megalitres of groundwater entitlements).

NIBM PIIOP Final Project Report October 2017 46
Post project, the large and small farms were modelled with Irrigation Farm Modernisation (IFM) funding for on-farm works. There was one small farm that did not receive IFM funding. The IFM program was a separate program to PIIOP and was implemented by the NSW Department of Primary Industries.
Both large and small farms were modelled without IFM funding as this is the model farm that represents the changes that PIIOP’s only modernisation would have achieved. A separate model farm was developed for rationalisation customers post-project to understand the financial impact of ceasing irrigation and converting to dryland farming.
Post-project, each of the pre-project model farms were split into those that had on-farm efficiency (IFM) projects and those that did not. There were several rationalised farms that were also treated separately as dryland farming and grazing properties.
• post-project—large farms without on-farm efficiency projects (PIIOP only) • post-project—large farms that undertook on-farm efficiency projects • post-project—small farms without on-farm efficiency projects (PIIOP only) • post-project—small farms that undertook on-farm efficiency projects • post-project—rationalised farms that no longer have access to irrigation.
Each model farm included a range of irrigation, dryland cropping and grazing enterprises typical of the landholders on the Scheme. All of the model farms pre-project had a primary irrigated crop of cotton. Wheat was chosen as a crop representative of the costs and revenues typical of dryland cropping across several crop types.
To reduce the complexity of the economic model, several farms that did not fit the primary farming model of cotton / wheat / dryland were excluded. The excluded farms tended to have very small amounts of water entitlements used for stock and domestic purposes and were not major crop producers.
Whole of scheme outcomes were developed by scaling the dimensions of the model farms to the dimensions of the scheme. For instance, as the large model farm dimensions were set by dividing the total dimensions of all the large farms in the scheme; whole of scheme outcomes could then be generated by multiplying the results of the large model farm back up to the dimensions of the large farms.

NIBM PIIOP Final Project Report October 2017 47
3.2 The Impact of the Stock and Domestic System
The modelling concentrates on irrigated agriculture outcomes and does not include the impact of the existing NIBM stock and domestic system. The permanent availability of water for stock and domestic requirements, by way of an underground pipeline to every property formerly and currently within the Scheme, has had significant improvements for some members.
Destocking is no longer required when available water from runoff into dams diminishes. Quality domestic water that is available at the turn of a tap has improved the way of life for farm families through having swimming pools, lawns and gardens. Proponent case studies in this report confirm that the program participants firmly believe their overall life has changed for the better with the modernisation of the delivery of all classes of water in the Scheme.
3.3 Water Efficiency Outcomes
The modelling seeks to understand the extent of impacts on irrigators and former irrigators as a result of the project. Privately owned Water Access Entitlements (WAEs) totalling 25,778 megalitres were acquired by the Commonwealth for environmental use. This represented a reduction of 41 per cent of the Scheme’s total water holdings.
Of the WAEs transferred to the Commonwealth:
• 2,000 megalitres were supplementary water entitlements • 7,332 megalitres were general security entitlements from scheme members returned for
the network upgrades • 16,446 megalitres of WAEs were general security entitlements from scheme members
who have now permanently retired their rights to irrigate, rationalising or transforming their landholdings into dryland and grazing only properties with no access to NIBM’s water delivery network.
A further 6,919 megalitres of WAEs were transferred to the Commonwealth from scheme members as part of the IFM program in return for on-farm infrastructure upgrades.
In response to changing rainfall patterns and water availability, the modelling shows that pre-project, there was a changing pattern of buying and selling allocations, leaving water for subsequent years as carryover, and bringing in allocations from entitlements irrigators held outside of the Scheme. Pre-project, over the 14 year period, Narromine farmers as a group sold around the same volume of allocations on the temporary water market as they bought.

NIBM PIIOP Final Project Report October 2017 48
Figure 3 Pre-project pumping with trades

NIBM PIIOP Final Project Report October 2017 49
Major channel upgrades were carried out to reduce seepage and evaporation losses. The graph below illustrates the impact of the improved delivery efficiency and reduced transmission losses within the scheme pre-project and post-project - an estimated average improvement of 23 per cent per year. This graph is based on annual allocations only pre and post-project to ensure consistency. Actual pumping volumes would reflect carryover and trading outcomes.
In addition to the physical, improved delivery efficiencies, all structures, meters and telemetry have been modernised within the Scheme, greatly improving the ability to manage water delivery and monitoring, virtually eliminating any uncertainty surrounding pumping volumes and the measurability of water losses.
The modelling shows there would be a reduction in the water available at the farm gate post project. However, the outcome is not equivalent to the 41 per cent reduction in water entitlements due to the improved water delivery efficiency in the Scheme post project and the fact that the number of irrigators reduced from 73 to 51.
Figure 4 Delivery efficiency and transmission losses
Available water for remaining Narromine members has remained the same due to the modernised delivery network and improved delivery efficiencies.
The figure below illustrates that modernisation (through the implementation of a sophisticated network of lined and reshaped irrigation channels, and new efficient gates and meters) has meant that water can be delivered in a timely manner to all members, even in years of low allocation. Improved delivery efficiency would also greatly reduce the impact of the volume of WAEs being transferred to the Commonwealth.
Despite the reduction in overall delivery to the farm gate, the remaining farmers would have similar volumes of water available for crop production compared to pre-project.

NIBM PIIOP Final Project Report October 2017 50
Figure 5 Modelled farm gate delivery pre and post project
The PIIOP project was an outstanding success in terms of improving delivery efficiency and reducing transmission losses. Delivery efficiency improved from 69 to 92 per cent on average which is an average improvement of 23 per cent per year. This improved delivery efficiency is the key reason for the modelling demonstrating improved crop production for individual irrigators despite the reduction in water entitlements held by irrigators. The modelling also shows that water availability and delivery risk has been greatly reduced as Narromine members can now order water delivery in years of low allocations.
Figure 6 Water delivery efficiency

NIBM PIIOP Final Project Report October 2017 51
3.4 Crop Production Outcomes
The modelling shows that improved flexibility, timing and delivery of irrigation water, even in small amounts, has significant yield advantages through the ability to accurately schedule water application and volume. Irrigators who have installed large and efficient linear move or centre pivot irrigators through the IFM project could potentially expand their businesses to grow a new range of irrigated high value crops, rather than growing traditional flood irrigated crops.
The modelling shows that despite the 41 per cent reduction in water entitlements and 30 per cent less farms producing cotton, there would be very little change in the area of cotton planted and irrigated by the Narromine scheme. In other words, the area planted by the 51 remaining members of the scheme post-project would produce nearly all of the area planted by the 73 members of the scheme pre-project. Post project, there is a modelled increase in the average hectares of cotton planted from 884 hectares each to 1,056 hectares each.
There were 50 farm businesses that traded WAEs with the Commonwealth in return for significant on-farm infrastructure funding. Such improvements included the construction and/or modernisation of water storages and irrigation structures, the improvement of water delivery channels and overall farm design to capture irrigation run off, storm water run-off and improve water delivery on-farm. Significant telemetry upgrades were also undertaken, allowing for the remote operation of systems.
With the reduction in risk for Narromine members comes increased stability and sustainability for the entire community.
Figure 7 Scheme level water entitlements

NIBM PIIOP Final Project Report October 2017 52
Figure 8 Modelled total area of cotton planted
3.5 Large Farms without Groundwater
The modelling shows that large farms without groundwater can plant more cotton more often, with two additional seasons of cropping realised due to the PIIOP network modernisation and a further two additional seasons of cropping with on-farm modernisation (four in total) over the 14-year period.
Figure 9 Modelled hectares of cotton for large cotton farms without groundwater
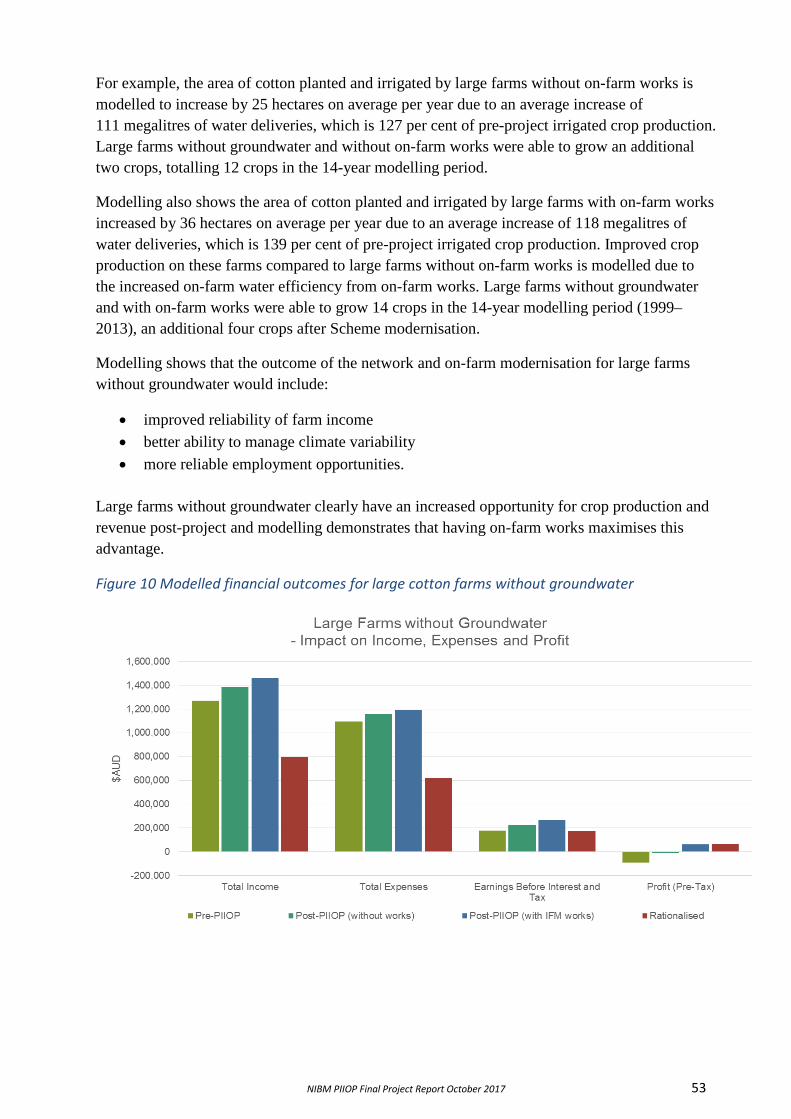
NIBM PIIOP Final Project Report October 2017 53
For example, the area of cotton planted and irrigated by large farms without on-farm works is modelled to increase by 25 hectares on average per year due to an average increase of 111 megalitres of water deliveries, which is 127 per cent of pre-project irrigated crop production. Large farms without groundwater and without on-farm works were able to grow an additional two crops, totalling 12 crops in the 14-year modelling period.
Modelling also shows the area of cotton planted and irrigated by large farms with on-farm works increased by 36 hectares on average per year due to an average increase of 118 megalitres of water deliveries, which is 139 per cent of pre-project irrigated crop production. Improved crop production on these farms compared to large farms without on-farm works is modelled due to the increased on-farm water efficiency from on-farm works. Large farms without groundwater and with on-farm works were able to grow 14 crops in the 14-year modelling period (1999–2013), an additional four crops after Scheme modernisation.
Modelling shows that the outcome of the network and on-farm modernisation for large farms without groundwater would include:
• improved reliability of farm income • better ability to manage climate variability • more reliable employment opportunities.
Large farms without groundwater clearly have an increased opportunity for crop production and revenue post-project and modelling demonstrates that having on-farm works maximises this advantage.
Figure 10 Modelled financial outcomes for large cotton farms without groundwater

NIBM PIIOP Final Project Report October 2017 54
The increased crop production and increased years of crop production for large farms without groundwater increased income, expenses, earnings before interest and tax and pre-tax profit.
Before network modernisation, large farms without groundwater are modelled to have had a cumulative loss of $1,264,000 over 14 years. With network modernisation and without on-farm works, large farms without groundwater are modelled to improve this to a cumulative loss of only $122,000 over 14 years. With on-farm works, there is a modelled cumulative pre-tax profit of $864,000 over 14 years despite transferring additional water entitlements to the Commonwealth Environmental Water Holder.
Figure 11 Modelled changes in equity for large cotton farms without groundwater
Before network modernisation, large farms without groundwater are modelled to have had a change in equity (the ratio of assets to debt) of 70 to 48 per cent over 14 years. With network modernisation and without on-farm works, for large farms without groundwater this could be a change in equity of 70 to 68 per cent over 14 years. With on-farm works, this could further improve to a change in equity of 70 to 80 per cent over 14 years despite transferring additional water entitlements to the Commonwealth Environmental Water Holder.
Rationalised farms were also modelled to have experienced improvements in financial outcomes. The model assumed that the payments for water entitlements would be used to reduce debt and the farm has been converted to dryland farming and grazing.
Before network modernisation, large farms without groundwater are modelled to have had a cumulative loss of $1,264,000 over 14 years. After rationalisation, modelling shows these farms could improve this to a pre-tax profit of $947,000 over 14 years. Before network modernisation, modelling shows large farms without groundwater would have had a change in equity (the ratio of assets to debt) of 70 to 48 per cent over 14 years. After rationalisation, these farms could have a change in equity of 89 to 114 per cent. Actual results for rationalised farms in the future will depend greatly on the level of debt retained.

NIBM PIIOP Final Project Report October 2017 55
3.6 Large Farms with Groundwater
The modelling shows that large farms with groundwater that remain can plant more cotton more often—every year. The additional reliable groundwater enabled these farms to produce crops every year.
Figure 12 Modelled hectares of cotton for large cotton farms with groundwater
The modelled area of cotton planted and irrigated by large farms without on-farm works increased by 25 hectares on average per year due to an average increase of 93 megalitres of water deliveries, which is 109 per cent of pre-project irrigated crop production.
The modelled area of cotton planted and irrigated by large farms with on-farm works increased by 38 hectares on average per year due to an average increase of 92 megalitres of water deliveries, which is 114 per cent of pre-project irrigated crop production. There was an improved crop production modelled compared to large farms without on-farm works due to the increased on-farm water efficiency delivered by the on-farm works.
Modelling shows that the outcome of the network and on-farm modernisation for large farms with groundwater are the same as those without.

NIBM PIIOP Final Project Report October 2017 56
Figure 13 Modelled financial outcomes for large cotton farms with groundwater
The modelled increased crop production for large farms with groundwater results in increased income, expenses, earnings before interest and tax and pre-tax profit. Before network modernisation, large farms without groundwater modelled have had a pre-tax profit of $1,680,000 over 14 years. With network modernisation and without on-farm works, modelling shows large farms without groundwater could improve this to a pre-tax profit of $2,830,000 over 14 years. With on-farm works, there could be a cumulative pre-tax profit of $4,830,000 over 14 years despite having transferred additional water entitlements to the Commonwealth Environmental Water Holder. Figure 14 Modelled changes in equity for large cotton farms with groundwater

NIBM PIIOP Final Project Report October 2017 57
Before network modernisation, large farms with groundwater are modelled to have had a change in equity (the ratio of assets to debt) of 70 to 91 per cent over 14 years. With network modernisation and without on-farm works, large farms with groundwater could have improved this change in equity from 70 to 108 per cent over 14 years, a significant improvement. With on-farm works, there could be a further improvement in the change in equity of 70 to 138 per cent over 14 years despite having transferred additional water entitlements to the Commonwealth Environmental Water Holder.
There were no large farms with groundwater that elected to be rationalised. The potential outcomes were also modelled for completeness. The model assumed that the payments for water entitlements would be used to reduce debt and the farm has been converted to dryland farming and grazing.
Before network modernisation, large farms without groundwater were modelled to have had a pre-tax profit of $1,680,000 over 14 years. After rationalisation, these farms were modelled to have a pre-tax profit of $947,000 over 14 years. Before network modernisation, large farms with groundwater would have had a change in equity (the ratio of assets to debt) of 70 to 91 per cent over 14 years. After rationalisation, these farms would have a change in equity of 89 to 114 per cent. Actual results for rationalised farms in the future would have depended greatly on the level of debt retained, however, the modelling shows that it was better for farms in this group to continue farming and not to choose rationalisation.
3.7 Small Farms without Groundwater
The modelling shows that small farms without groundwater that remain can plant more cotton more often - every year, with one additional season of cropping from PIIOP network modernisation. Figure 15 Modelled hectares of cotton for small cotton farms without groundwater

NIBM PIIOP Final Project Report October 2017 58
Modelling shows the area of cotton planted and irrigated by small farms without on-farm works increased by three hectares on average per year due to an average increase of two megalitres of water deliveries, which is 122 per cent of pre-project production. Small farms without groundwater and without on-farm works were able to grow one additional crop, totalling seven crops in the 14-year modelling period.
Modelling shows the area of cotton planted and irrigated by small farms with on-farm works increased by nine hectares on average per year due to an average increase of 30 megalitres of water deliveries, which is 137 per cent of pre-project irrigated crop production. There was an improved crop production modelled compared to small farms without on-farm works due to increased on-farm water efficiency following on-farm works. Small farms without groundwater and with on-farm works were able to grow one additional crop, totalling seven crops in the 14-year modelling period.
The outcomes of network and on-farm modernisation for small farms without groundwater could include improved reliability of farm income, reduced impacts of climate change, and more reliable employment opportunities. Small farms without groundwater clearly have an increased opportunity for crop production and revenue post-project and having on-farm works maximises this advantage.
Figure 16 Modelled financial outcomes for small cotton farms without groundwater
The increased crop production (both in volume and years) for small farms without groundwater show modelled increases in Income, Expenses, Earnings Before Interest and Tax and pre-tax profit.

NIBM PIIOP Final Project Report October 2017 59
Modelling shows that before network modernisation, small farms without groundwater could have had a cumulative loss of $284,000 over 14 years. With network modernisation and without on-farm works, small farms without groundwater could have had an improved cumulative loss of $112,000 over 14 years. With on-farm works, there could be a cumulative pre-tax profit of $257,000 over 14 years despite transferring water entitlements to the Commonwealth Environmental Water Holder.
Figure 17 Modelled changes in equity for small cotton farms without groundwater
Before network modernisation, small farms without groundwater are modelled to have had a change in equity (the ratio of assets to debt) of 70 to 56 per cent over 14 years. With network modernisation and without on-farm works, small farms without groundwater could have had an improved change in equity of 70 to 64 per cent over 14 years. With on-farm works, there could be a change in equity of 70 to 78 per cent over 14 years despite having transferring water entitlements to the Commonwealth Environmental Water Holder.
Rationalised farms were also modelled to have improvements in financial outcomes. The assumption is that the payments for water entitlements would be used to reduced debt and the farm would switch to dryland farming and grazing. Before network modernisation, small farms without groundwater have a modelled cumulative loss of $284,000 over 14 years. After rationalisation, these farms improve this cumulative loss to $106,000 over 14 years. Before network modernisation, small farms without groundwater are modelled to have had a change in equity (the ratio of assets to debt) of 70 to 56 per cent over 14 years. After rationalisation, these farms would have a change in equity of 98 to 95 per cent. Actual results for rationalised farms in the future will depend greatly on the level of debt retained.

NIBM PIIOP Final Project Report October 2017 60
3.8 Small Farms with Groundwater
The modelling shows that small farms with groundwater that remain can plant more cotton more often, with five additional seasons of cropping following PIIOP network modernisation.
Figure 18 Modelled hectares of cotton for small cotton farms with groundwater
The area of cotton planted and irrigated by small farms without on-farm works is modelled to have increased by 14 hectares on average per year due to an average increase of 29 megalitres of water deliveries, which is 135 per cent of pre-project irrigated crop production. Small farms with groundwater and without on-farm works were able to grow an additional five crops, totalling 14 crops in the 14-year modelling period.
The area of cotton planted and irrigated by small farms with on-farm works is modelled to have increased by 18 hectares on average per year due to an average increase of 29 megalitres of water deliveries, which is 146 per cent of pre-project irrigated crop production. There was modelled improved crop production compared to small farms without on-farm works due to the increased on-farm water efficiency delivered by the on-farm works. Small farms with groundwater and with on-farm works were able to grow an additional five crops, totalling 14 crops in the 14-year modelling period.
Modelling shows that the outcome of the network and on-farm modernisation for small farms with groundwater are the same as those without.

NIBM PIIOP Final Project Report October 2017 61
Figure 19 Modelled financial outcomes for small cotton farms with groundwater
The increased crop production (in volume and years) for small farms without groundwater show modelled increases in Income, Expenses, Earnings Before Interest and Tax and pre-tax profit.
Before network modernisation, small farms with groundwater are modelled to have had a pre-tax profit of $204,000 over 14 years. With network modernisation and without on-farm works, small farms with groundwater could have had an improved pre-tax profit of $613,000 over 14 years. With on-farm works, there could be a cumulative pre-tax profit of $1,112,000 over 14 years despite transferring water entitlements to the Commonwealth Environmental Water Holder.
Figure 20 Modelled changes in equity for large cotton farms with groundwater

NIBM PIIOP Final Project Report October 2017 62
Before network modernisation, small farms with groundwater are modelled to have had a change in equity (the ratio of assets to debt) of 70 to 76 per cent over 14 years. With network modernisation and without on-farm works, small farms with groundwater could have had a change in equity of 70 to 94 per cent over 14 years. With on-farm works, there could be a further improvement in change in equity of 70 to 115 per cent over 14 years despite transferring water entitlements to the CEWH.
3.9 Overall Outcomes
All of the model farms were modelled to show improvements in crop outcomes and/or financial outcomes. The table below shows that each type of model farm was modelled to show an improvement in average pre-tax income, average farm equity and average return on assets managed. As all but one farm received funding for on-farm works, the typical improvement for Narromine farmers was modelled at the higher end of the scale.
While the network improvements funded by PIIOP would have provided significant benefits, the additional on-farm works funding provided additional advantages.

NIBM PIIOP Final Project Report October 2017 63
Table 3 Predicted financial performance of all farms during the 14-year modelling period
Farm Type Period Average Pre-Tax Income
Average Farm Equity over 14 Years
Average Return on Assets Managed
Large without groundwater Pre-PIIOP -90,298 0.54 2.95%
Post-PIIOP -8,705 0.62 3.77% PIIOP & IFM 61,745 0.69 4.45%
Large with groundwater Pre-PIIOP 120,076 0.69 5.41%
Post-PIIOP 202,167 0.76 6.32% PIIOP & IFM 345,323 0.88 7.81%
Small without groundwater Pre-PIIOP -20,290 0.55 5.72%
Post-PIIOP -8,017 0.59 6.04% PIIOP & IFM 18,384 0.66 6.78%
Small with groundwater Pre-PIIOP 14,583 0.63 6.79%
Post-PIIOP 43,779 0.71 7.62% PIIOP & IFM 79,412 0.81 8.63%
Rationalised Large 67,644 0.87 4.96% Small -7,568 0.83 5.60%
3.10 Overall NIBM Scheme Level Outcome
For NIBM as a whole, the modelling demonstrates improved total scheme performance which may lead to improved sustainability for farmers following the PIIOP investment. The modelling indicates that there would be an opportunity created for a $105 million improvement in overall outcomes for a $60 million investment. This improved sustainability is likely to lead to improved social and economic outcomes compared to the without-project scenario.
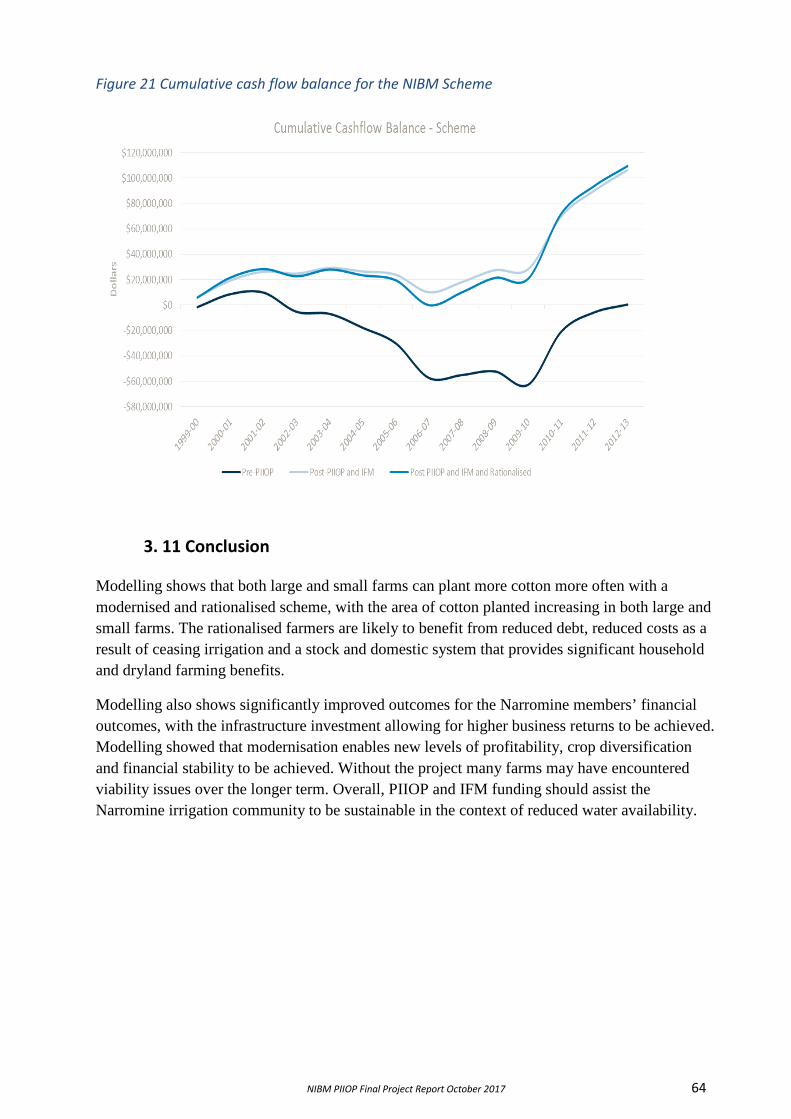
NIBM PIIOP Final Project Report October 2017 64
Figure 21 Cumulative cash flow balance for the NIBM Scheme
3. 11 Conclusion
Modelling shows that both large and small farms can plant more cotton more often with a modernised and rationalised scheme, with the area of cotton planted increasing in both large and small farms. The rationalised farmers are likely to benefit from reduced debt, reduced costs as a result of ceasing irrigation and a stock and domestic system that provides significant household and dryland farming benefits.
Modelling also shows significantly improved outcomes for the Narromine members’ financial outcomes, with the infrastructure investment allowing for higher business returns to be achieved. Modelling showed that modernisation enables new levels of profitability, crop diversification and financial stability to be achieved. Without the project many farms may have encountered viability issues over the longer term. Overall, PIIOP and IFM funding should assist the Narromine irrigation community to be sustainable in the context of reduced water availability.

NIBM PIIOP Final Project Report October 2017 65
3.12 Disclaimer
These results are modelled and are not a prediction. Results are based on the assumptions and limited information that has been provided.
This model cannot predict the outcomes for either individual farmers or irrigation networks with certainty because this will depend on individual circumstances including unexpected events and external factors such as climatic conditions, commodity prices, investment earnings, tax and inflation. This model holds a number of factors constant so the model can show the effect of things affected by PIIOP.
Individuals should not rely solely on results to make decisions about their enterprises as there are other factors to take into account. Individuals may wish to get advice from relevant professionals.
Due care and skill has been used in preparing and compiling the information and data in this report. Notwithstanding, the Department of Agriculture and Water Resources its employees and advisers disclaim all liability, including liability for negligence, for any loss, damage, injury, expense or cost incurred by any person as a result of accessing, using or relying on any of the information or data in this publication to the maximum extent permitted by law.