feature agricultural irrigation in china irrigation in china.pdf · irrigation, optimizing...
TRANSCRIPT
147ANOV/DEC 2013—VOL. 68, NO. 6JOURNAL OF SOIL AND WATER CONSERVATION
Xiufang Zhu, Yizhan Li, Muyi Li, Yaozhong Pan, and Peijun ShiAgricultural irrigation in China
doi:10.2489/jswc.68.6.147A
Xiufang Zhu is an assistant professor, Yizhan Li and Muyi Li are graduate students, and Yaozhong Pan and Peijun Shi are professors at State Key Laboratory of Earth Processes and Resource Ecol-ogy, College of Resources Science and Technol-ogy, Beijing Normal University, Beijing, China.
FEATURE
A s the most populous country in the world, China always faces challenges for food security. The
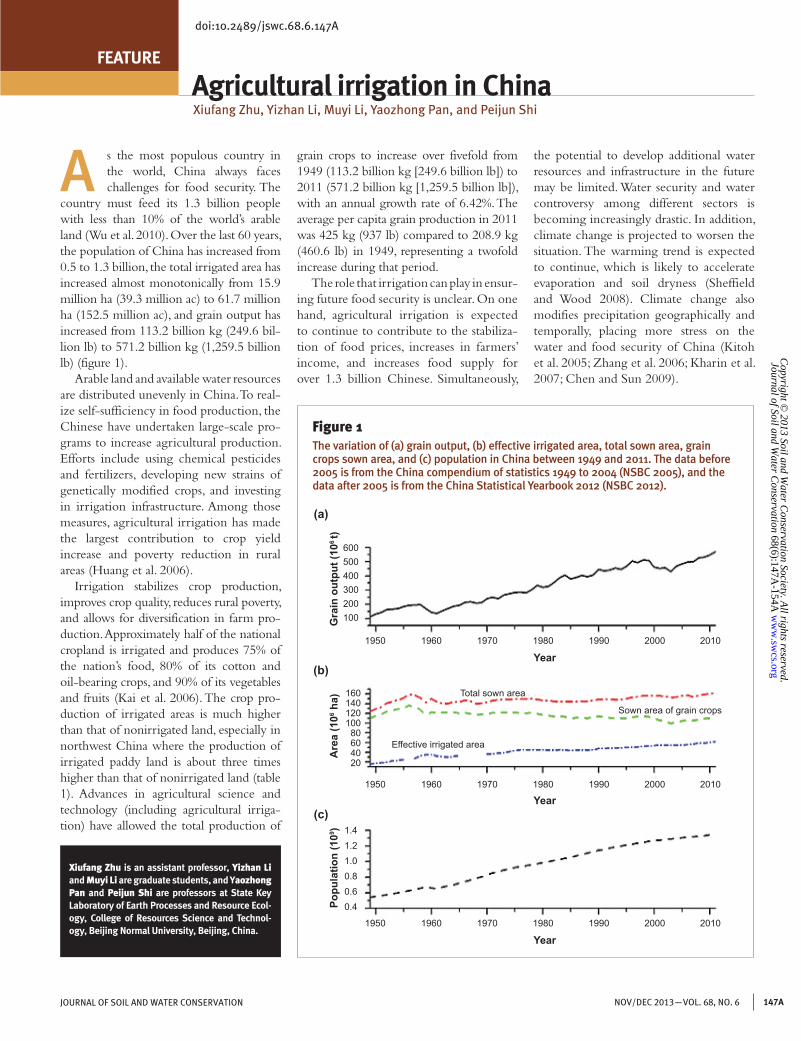
country must feed its 1.3 billion people with less than 10% of the world’s arable land (Wu et al. 2010). Over the last 60 years, the population of China has increased from 0.5 to 1.3 billion, the total irrigated area has increased almost monotonically from 15.9 million ha (39.3 million ac) to 61.7 million ha (152.5 million ac), and grain output has increased from 113.2 billion kg (249.6 bil-lion lb) to 571.2 billion kg (1,259.5 billion lb) (figure 1).
Arable land and available water resources are distributed unevenly in China. To real-ize self-sufficiency in food production, the Chinese have undertaken large-scale pro-grams to increase agricultural production. Efforts include using chemical pesticides and fertilizers, developing new strains of genetically modified crops, and investing in irrigation infrastructure. Among those measures, agricultural irrigation has made the largest contribution to crop yield increase and poverty reduction in rural areas (Huang et al. 2006).
Irrigation stabilizes crop production, improves crop quality, reduces rural poverty, and allows for diversification in farm pro-duction. Approximately half of the national cropland is irrigated and produces 75% of the nation’s food, 80% of its cotton and oil-bearing crops, and 90% of its vegetables and fruits (Kai et al. 2006). The crop pro-duction of irrigated areas is much higher than that of nonirrigated land, especially in northwest China where the production of irrigated paddy land is about three times higher than that of nonirrigated land (table 1). Advances in agricultural science and technology (including agricultural irriga-tion) have allowed the total production of
grain crops to increase over fivefold from 1949 (113.2 billion kg [249.6 billion lb]) to 2011 (571.2 billion kg [1,259.5 billion lb]), with an annual growth rate of 6.42%. The average per capita grain production in 2011 was 425 kg (937 lb) compared to 208.9 kg (460.6 lb) in 1949, representing a twofold increase during that period.
The role that irrigation can play in ensur-ing future food security is unclear. On one hand, agricultural irrigation is expected to continue to contribute to the stabiliza-tion of food prices, increases in farmers’ income, and increases food supply for over 1.3 billion Chinese. Simultaneously,
the potential to develop additional water resources and infrastructure in the future may be limited. Water security and water controversy among different sectors is becoming increasingly drastic. In addition, climate change is projected to worsen the situation. The warming trend is expected to continue, which is likely to accelerate evaporation and soil dryness (Sheffield and Wood 2008). Climate change also modifies precipitation geographically and temporally, placing more stress on the water and food security of China (Kitoh et al. 2005; Zhang et al. 2006; Kharin et al. 2007; Chen and Sun 2009).
Figure 1The variation of (a) grain output, (b) effective irrigated area, total sown area, grain crops sown area, and (c) population in China between 1949 and 2011. The data before 2005 is from the China compendium of statistics 1949 to 2004 (NSBC 2005), and the data after 2005 is from the China Statistical Yearbook 2012 (NSBC 2012).
Gra
in o
utpu
t (10
6 t)
Are
a (1
06 ha)
Popu
latio
n (1
09 )
Year1950 1960 1970 1980 1990 2000 2010
1950 1960 1970 1980 1990 2000 2010
1950 1960 1970 1980 1990 2000 2010
Year
Year
600500400300200100
160140120100
80604020
1.41.21.00.80.60.4
Effective irrigated area
Sown area of grain crops
Total sown area
(a)
(b)
(c)
Copyright ©
2013 Soil and Water C
onservation Society. All rights reserved.
ww
w.sw
cs.org 68(6):147A
-154A
Journal of Soil and Water C
onservation
148A JOURNAL OF SOIL AND WATER CONSERVATIONNOV/DEC 2013—VOL. 68, NO. 6
THE CURRENT STATUS OF AGRICULTURAL IRRIGATION
Effective Irrigated Area. China began to forcefully exploit water resources and develop irrigation starting at the time of the foundation of New China in 1949. The development of the effective irrigated area (EIA) can be generally divided into three phases: 1949 to 1980, 1981 to 1990, and 1991 to present.
During 1949 to 1980, a period of rapid expansion, the Chinese government invested heavily in irrigation projects such as canals, reservoirs, dams, and wells. The EIA increased dramatically from 15.9 mil-lion ha (39.3 million ac) in 1949 to 44.9 million ha (111 million ac ) in 1980, repre-senting nearly a threefold increase (NSBC 2012). The number of mechanical and electrical wells for irrigation increased from 0.11 million in 1961 to 2.69 million in 1980, representing a 23.6-fold increase. The number of completed reservoirs reached 86,822, with a total storage capac-ity of 413 billion m3 (90,860 billion gal).
From 1980 to 1990, the Chinese gov-ernment reduced its financial expenditures of irrigation development and manage-ment. During the same period, with the fast industrialization and urbanization, more water was consumed by domestic and industrial sectors. The EIA remained stable, and by 1990, it had decreased slightly to 47.4 million ha (117.1 million ac).
After 1990, the total EIA increased slowly because reductions in existing EIA
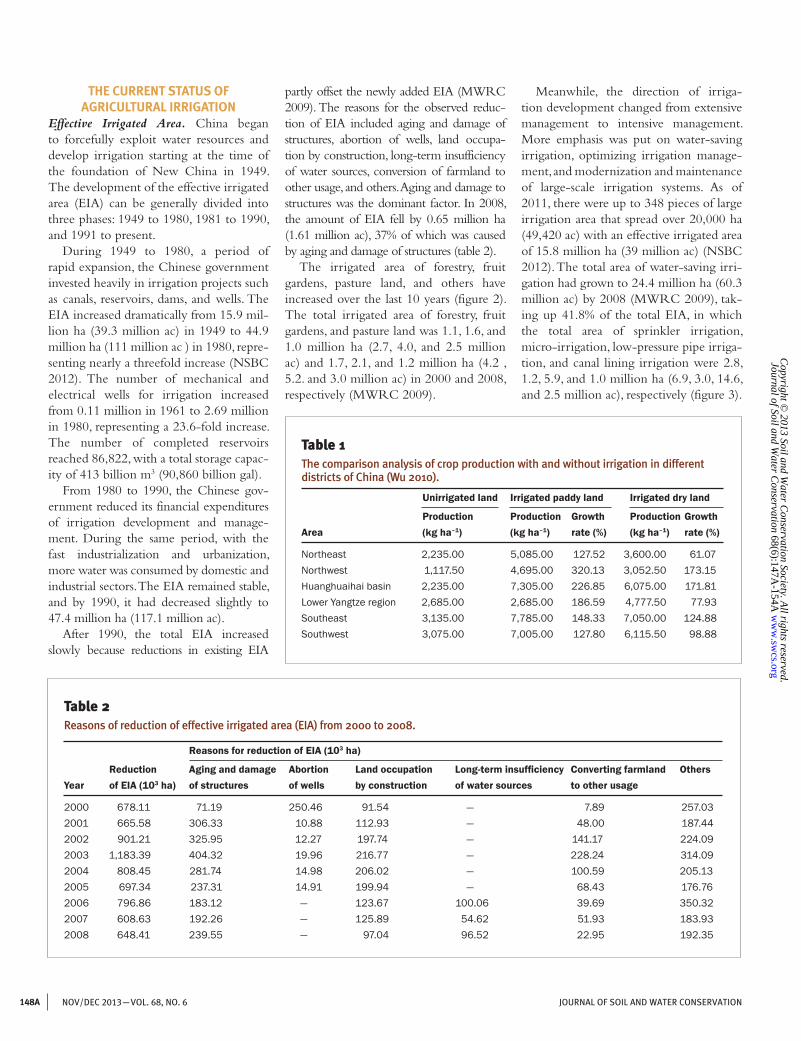
partly offset the newly added EIA (MWRC 2009). The reasons for the observed reduc-tion of EIA included aging and damage of structures, abortion of wells, land occupa-tion by construction, long-term insufficiency of water sources, conversion of farmland to other usage, and others. Aging and damage to structures was the dominant factor. In 2008, the amount of EIA fell by 0.65 million ha (1.61 million ac), 37% of which was caused by aging and damage of structures (table 2).
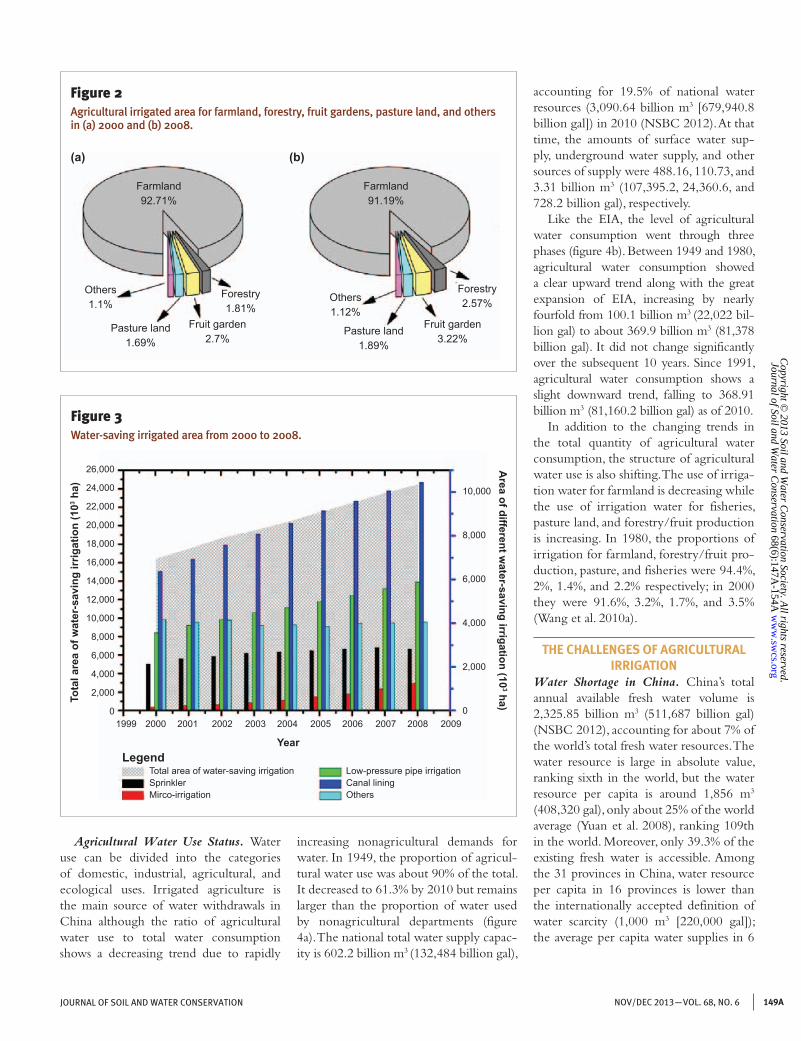
The irrigated area of forestry, fruit gardens, pasture land, and others have increased over the last 10 years (figure 2). The total irrigated area of forestry, fruit gardens, and pasture land was 1.1, 1.6, and 1.0 million ha (2.7, 4.0, and 2.5 million ac) and 1.7, 2.1, and 1.2 million ha (4.2 , 5.2. and 3.0 million ac) in 2000 and 2008, respectively (MWRC 2009).
Meanwhile, the direction of irriga-tion development changed from extensive management to intensive management. More emphasis was put on water-saving irrigation, optimizing irrigation manage-ment, and modernization and maintenance of large-scale irrigation systems. As of 2011, there were up to 348 pieces of large irrigation area that spread over 20,000 ha (49,420 ac) with an effective irrigated area of 15.8 million ha (39 million ac) (NSBC 2012). The total area of water-saving irri-gation had grown to 24.4 million ha (60.3 million ac) by 2008 (MWRC 2009), tak-ing up 41.8% of the total EIA, in which the total area of sprinkler irrigation, micro-irrigation, low-pressure pipe irriga-tion, and canal lining irrigation were 2.8, 1.2, 5.9, and 1.0 million ha (6.9, 3.0, 14.6, and 2.5 million ac), respectively (figure 3).
Table 2Reasons of reduction of effective irrigated area (EIA) from 2000 to 2008.
Reasons for reduction of EIA (103 ha)
Reduction Aginganddamage Abortion Landoccupation Long-terminsufficiency Convertingfarmland OthersYear of EIA (103ha) ofstructures ofwells byconstruction ofwatersources tootherusage
2000 678.11 71.19 250.46 91.54 — 7.89 257.03 2001 665.58 306.33 10.88 112.93 — 48.00 187.44 2002 901.21 325.95 12.27 197.74 — 141.17 224.09 2003 1,183.39 404.32 19.96 216.77 — 228.24 314.09 2004 808.45 281.74 14.98 206.02 — 100.59 205.13 2005 697.34 237.31 14.91 199.94 — 68.43 176.76 2006 796.86 183.12 — 123.67 100.06 39.69 350.32 2007 608.63 192.26 — 125.89 54.62 51.93 183.93 2008 648.41 239.55 — 97.04 96.52 22.95 192.35
Table 1The comparison analysis of crop production with and without irrigation in different districts of China (Wu 2010).
Unirrigatedland Irrigatedpaddyland Irrigateddryland
Production Production Growth Production Growth Area (kg ha–1) (kg ha–1) rate (%) (kg ha–1) rate (%)
Northeast 2,235.00 5,085.00 127.52 3,600.00 61.07Northwest 1,117.50 4,695.00 320.13 3,052.50 173.15Huanghuaihai basin 2,235.00 7,305.00 226.85 6,075.00 171.81Lower Yangtze region 2,685.00 2,685.00 186.59 4,777.50 77.93Southeast 3,135.00 7,785.00 148.33 7,050.00 124.88Southwest 3,075.00 7,005.00 127.80 6,115.50 98.88
Copyright ©
2013 Soil and Water C
onservation Society. All rights reserved.
ww
w.sw
cs.org 68(6):147A
-154A
Journal of Soil and Water C
onservation
149ANOV/DEC 2013—VOL. 68, NO. 6JOURNAL OF SOIL AND WATER CONSERVATION
26,000
24,000
22,000
20,000
18,000
16,000
14,000
12,000
10,000
8,000
6,000
4,000
2,000
0
10,000
8,000
6,000
4,000
2,000
01999 2000 2001 2002 2003 2004 2005 2006 2007 2008 2009
Total area of water-saving irrigationSprinklerMirco-irrigation
Low-pressure pipe irrigationCanal liningOthers
Year
Tota
l are
a of
wat
er-s
avin
g irr
igat
ion
(103 h
a)
Legend
Area of different w
ater-saving irrigation (103 ha)
Figure 3Water-saving irrigated area from 2000 to 2008.
accounting for 19.5% of national water resources (3,090.64 billion m3 [679,940.8 billion gal]) in 2010 (NSBC 2012). At that time, the amounts of surface water sup-ply, underground water supply, and other sources of supply were 488.16, 110.73, and 3.31 billion m3 (107,395.2, 24,360.6, and 728.2 billion gal), respectively.
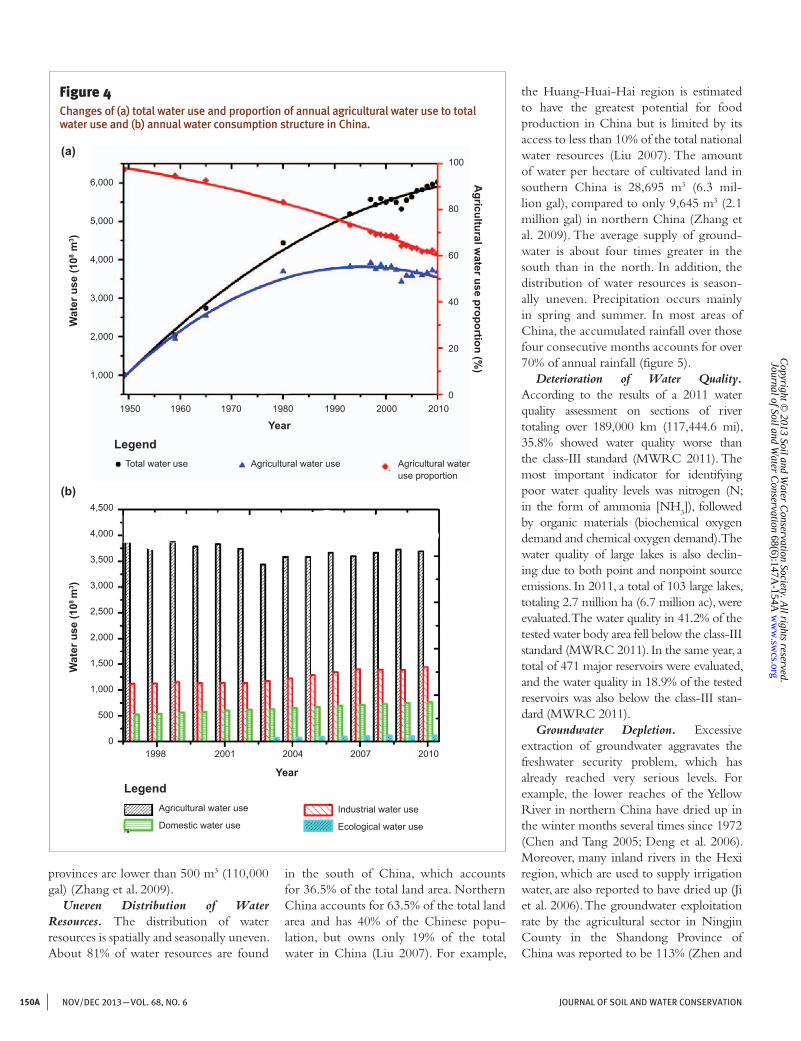
Like the EIA, the level of agricultural water consumption went through three phases (figure 4b). Between 1949 and 1980, agricultural water consumption showed a clear upward trend along with the great expansion of EIA, increasing by nearly fourfold from 100.1 billion m3 (22,022 bil-lion gal) to about 369.9 billion m3 (81,378 billion gal). It did not change significantly over the subsequent 10 years. Since 1991, agricultural water consumption shows a slight downward trend, falling to 368.91 billion m3 (81,160.2 billion gal) as of 2010.
In addition to the changing trends in the total quantity of agricultural water consumption, the structure of agricultural water use is also shifting. The use of irriga-tion water for farmland is decreasing while the use of irrigation water for fisheries, pasture land, and forestry/fruit production is increasing. In 1980, the proportions of irrigation for farmland, forestry/fruit pro-duction, pasture, and fisheries were 94.4%, 2%, 1.4%, and 2.2% respectively; in 2000 they were 91.6%, 3.2%, 1.7%, and 3.5% (Wang et al. 2010a).
THE CHALLENGES OF AGRICULTURAL IRRIGATION
Water Shortage in China. China’s total annual available fresh water volume is 2,325.85 billion m3 (511,687 billion gal) (NSBC 2012), accounting for about 7% of the world’s total fresh water resources. The water resource is large in absolute value, ranking sixth in the world, but the water resource per capita is around 1,856 m3
(408,320 gal), only about 25% of the world average (Yuan et al. 2008), ranking 109th in the world. Moreover, only 39.3% of the existing fresh water is accessible. Among the 31 provinces in China, water resource per capita in 16 provinces is lower than the internationally accepted definition of water scarcity (1,000 m3 [220,000 gal]); the average per capita water supplies in 6
Farmland 92.71%
Farmland 91.19%
Forestry2.57%
Forestry1.81%
Fruit garden3.22%
Fruit garden2.7%
Pasture land 1.89%
Pasture land 1.69%
Others1.12%
Others1.1%
Figure 2Agricultural irrigated area for farmland, forestry, fruit gardens, pasture land, and others in (a) 2000 and (b) 2008.
(a) (b)
Agricultural Water Use Status. Water use can be divided into the categories of domestic, industrial, agricultural, and ecological uses. Irrigated agriculture is the main source of water withdrawals in China although the ratio of agricultural water use to total water consumption shows a decreasing trend due to rapidly
increasing nonagricultural demands for water. In 1949, the proportion of agricul-tural water use was about 90% of the total. It decreased to 61.3% by 2010 but remains larger than the proportion of water used by nonagricultural departments (figure 4a). The national total water supply capac-ity is 602.2 billion m3 (132,484 billion gal),
Copyright ©
2013 Soil and Water C
onservation Society. All rights reserved.
ww
w.sw
cs.org 68(6):147A
-154A
Journal of Soil and Water C
onservation
150A JOURNAL OF SOIL AND WATER CONSERVATIONNOV/DEC 2013—VOL. 68, NO. 6
provinces are lower than 500 m3 (110,000 gal) (Zhang et al. 2009).
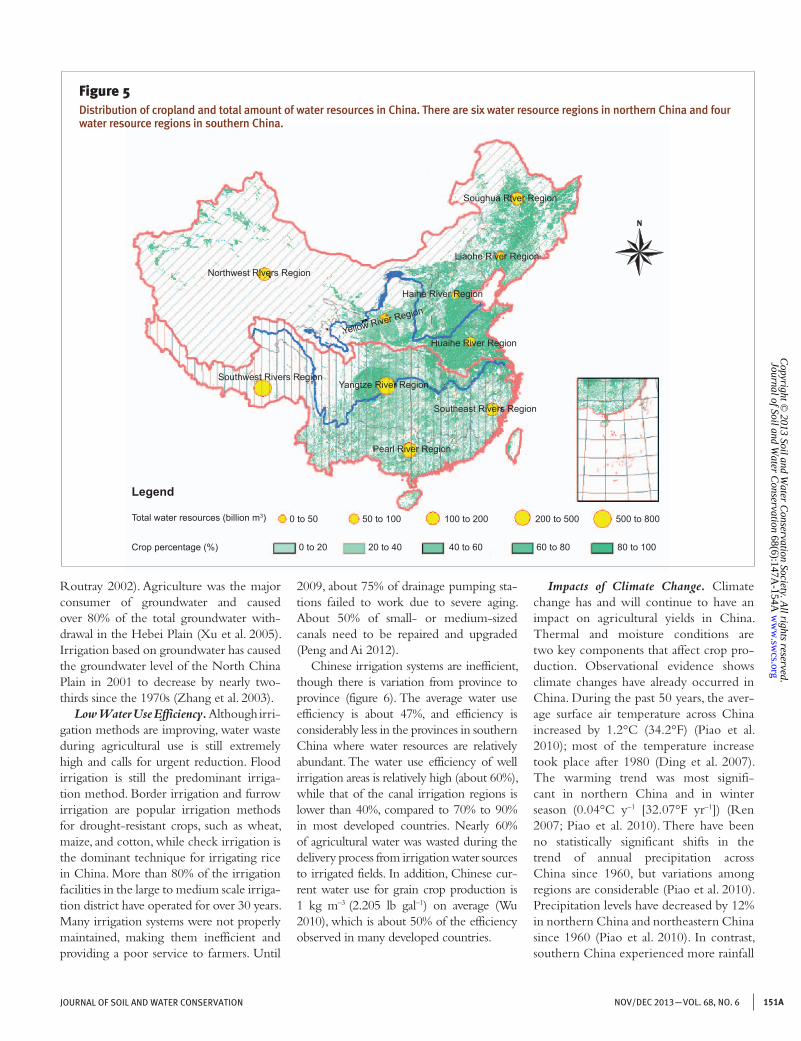
Uneven Distribution of Water Resources. The distribution of water resources is spatially and seasonally uneven. About 81% of water resources are found
in the south of China, which accounts for 36.5% of the total land area. Northern China accounts for 63.5% of the total land area and has 40% of the Chinese popu-lation, but owns only 19% of the total water in China (Liu 2007). For example,
the Huang-Huai-Hai region is estimated to have the greatest potential for food production in China but is limited by its access to less than 10% of the total national water resources (Liu 2007). The amount of water per hectare of cultivated land in southern China is 28,695 m3 (6.3 mil-lion gal), compared to only 9,645 m3 (2.1 million gal) in northern China (Zhang et al. 2009). The average supply of ground-water is about four times greater in the south than in the north. In addition, the distribution of water resources is season-ally uneven. Precipitation occurs mainly in spring and summer. In most areas of China, the accumulated rainfall over those four consecutive months accounts for over 70% of annual rainfall (figure 5).
Deterioration of Water Quality. According to the results of a 2011 water quality assessment on sections of river totaling over 189,000 km (117,444.6 mi), 35.8% showed water quality worse than the class-III standard (MWRC 2011). The most important indicator for identifying poor water quality levels was nitrogen (N; in the form of ammonia [NH3]), followed by organic materials (biochemical oxygen demand and chemical oxygen demand). The water quality of large lakes is also declin-ing due to both point and nonpoint source emissions. In 2011, a total of 103 large lakes, totaling 2.7 million ha (6.7 million ac), were evaluated. The water quality in 41.2% of the tested water body area fell below the class-III standard (MWRC 2011). In the same year, a total of 471 major reservoirs were evaluated, and the water quality in 18.9% of the tested reservoirs was also below the class-III stan-dard (MWRC 2011).
Groundwater Depletion. Excessive extraction of groundwater aggravates the freshwater security problem, which has already reached very serious levels. For example, the lower reaches of the Yellow River in northern China have dried up in the winter months several times since 1972 (Chen and Tang 2005; Deng et al. 2006). Moreover, many inland rivers in the Hexi region, which are used to supply irrigation water, are also reported to have dried up (Ji et al. 2006). The groundwater exploitation rate by the agricultural sector in Ningjin County in the Shandong Province of China was reported to be 113% (Zhen and
Figure 4Changes of (a) total water use and proportion of annual agricultural water use to total water use and (b) annual water consumption structure in China.
100
80
60
40
20
0
Agricultural w
ater use proportion (%)
6,000
5,000
4,000
3,000
2,000
1,000
Wat
er u
se (1
08 m3 )
1950 1960 1970 1980 1990 2000 2010
Year
LegendTotal water use Agricultural water use Agricultural water
use proportion
(a)
(b)4,500
4,000
3,500
3,000
2,500
2,000
1,500
1,000
500
0
Wat
er u
se (1
08 m
3 )
1998 2001 2004 2007 2010
YearLegend
Agricultural water use
Domestic water use
Industrial water use
Ecological water use
Copyright ©
2013 Soil and Water C
onservation Society. All rights reserved.
ww
w.sw
cs.org 68(6):147A
-154A
Journal of Soil and Water C
onservation
151ANOV/DEC 2013—VOL. 68, NO. 6JOURNAL OF SOIL AND WATER CONSERVATION
Routray 2002). Agriculture was the major consumer of groundwater and caused over 80% of the total groundwater with-drawal in the Hebei Plain (Xu et al. 2005). Irrigation based on groundwater has caused the groundwater level of the North China Plain in 2001 to decrease by nearly two-thirds since the 1970s (Zhang et al. 2003).
Low Water Use Efficiency. Although irri-gation methods are improving, water waste during agricultural use is still extremely high and calls for urgent reduction. Flood irrigation is still the predominant irriga-tion method. Border irrigation and furrow irrigation are popular irrigation methods for drought-resistant crops, such as wheat, maize, and cotton, while check irrigation is the dominant technique for irrigating rice in China. More than 80% of the irrigation facilities in the large to medium scale irriga-tion district have operated for over 30 years. Many irrigation systems were not properly maintained, making them inefficient and providing a poor service to farmers. Until
Figure 5Distribution of cropland and total amount of water resources in China. There are six water resource regions in northern China and four water resource regions in southern China.
Northwest Rivers Region
Liaohe River Region
Soughua River Region
Haihe River Region
Huaihe River Region
Southeast Rivers Region
Pearl River Region
Yangtze River Region
Yellow River Region
Southwest Rivers Region
0 to 50 50 to 100 100 to 200 200 to 500 500 to 800
0 to 20 20 to 40 40 to 60 60 to 80 80 to 100
Legend
Total water resources (billion m3)
Crop percentage (%)
N
2009, about 75% of drainage pumping sta-tions failed to work due to severe aging. About 50% of small- or medium-sized canals need to be repaired and upgraded (Peng and Ai 2012).
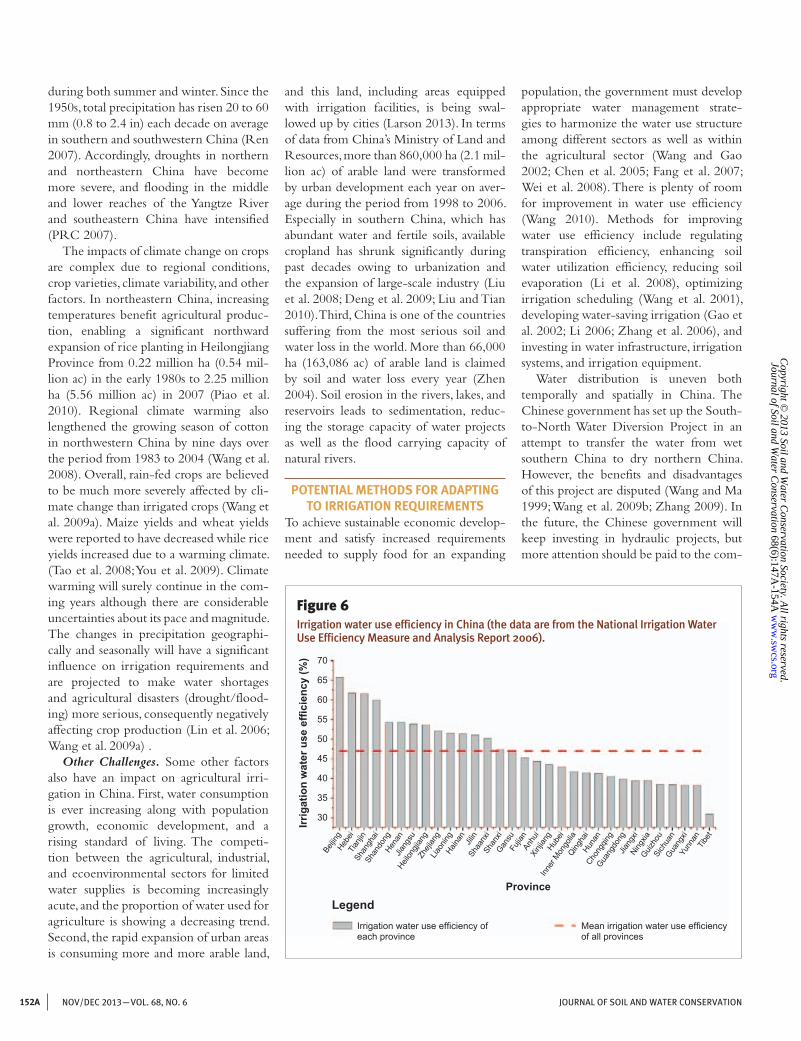
Chinese irrigation systems are inefficient, though there is variation from province to province (figure 6). The average water use efficiency is about 47%, and efficiency is considerably less in the provinces in southern China where water resources are relatively abundant. The water use efficiency of well irrigation areas is relatively high (about 60%), while that of the canal irrigation regions is lower than 40%, compared to 70% to 90% in most developed countries. Nearly 60% of agricultural water was wasted during the delivery process from irrigation water sources to irrigated fields. In addition, Chinese cur-rent water use for grain crop production is 1 kg m–3 (2.205 lb gal–1) on average (Wu 2010), which is about 50% of the efficiency observed in many developed countries.
Impacts of Climate Change. Climate change has and will continue to have an impact on agricultural yields in China. Thermal and moisture conditions are two key components that affect crop pro-duction. Observational evidence shows climate changes have already occurred in China. During the past 50 years, the aver-age surface air temperature across China increased by 1.2°C (34.2°F) (Piao et al. 2010); most of the temperature increase took place after 1980 (Ding et al. 2007). The warming trend was most signifi-cant in northern China and in winter season (0.04°C y–1 [32.07°F yr–1]) (Ren 2007; Piao et al. 2010). There have been no statistically significant shifts in the trend of annual precipitation across China since 1960, but variations among regions are considerable (Piao et al. 2010). Precipitation levels have decreased by 12% in northern China and northeastern China since 1960 (Piao et al. 2010). In contrast, southern China experienced more rainfall
Copyright ©
2013 Soil and Water C
onservation Society. All rights reserved.
ww
w.sw
cs.org 68(6):147A
-154A
Journal of Soil and Water C
onservation
152A JOURNAL OF SOIL AND WATER CONSERVATIONNOV/DEC 2013—VOL. 68, NO. 6
during both summer and winter. Since the 1950s, total precipitation has risen 20 to 60 mm (0.8 to 2.4 in) each decade on average in southern and southwestern China (Ren 2007). Accordingly, droughts in northern and northeastern China have become more severe, and flooding in the middle and lower reaches of the Yangtze River and southeastern China have intensified (PRC 2007).
The impacts of climate change on crops are complex due to regional conditions, crop varieties, climate variability, and other factors. In northeastern China, increasing temperatures benefit agricultural produc-tion, enabling a significant northward expansion of rice planting in Heilongjiang Province from 0.22 million ha (0.54 mil-lion ac) in the early 1980s to 2.25 million ha (5.56 million ac) in 2007 (Piao et al. 2010). Regional climate warming also lengthened the growing season of cotton in northwestern China by nine days over the period from 1983 to 2004 (Wang et al. 2008). Overall, rain-fed crops are believed to be much more severely affected by cli-mate change than irrigated crops (Wang et al. 2009a). Maize yields and wheat yields were reported to have decreased while rice yields increased due to a warming climate. (Tao et al. 2008; You et al. 2009). Climate warming will surely continue in the com-ing years although there are considerable uncertainties about its pace and magnitude. The changes in precipitation geographi-cally and seasonally will have a significant influence on irrigation requirements and are projected to make water shortages and agricultural disasters (drought/flood-ing) more serious, consequently negatively affecting crop production (Lin et al. 2006; Wang et al. 2009a) .
Other Challenges. Some other factors also have an impact on agricultural irri-gation in China. First, water consumption is ever increasing along with population growth, economic development, and a rising standard of living. The competi-tion between the agricultural, industrial, and ecoenvironmental sectors for limited water supplies is becoming increasingly acute, and the proportion of water used for agriculture is showing a decreasing trend. Second, the rapid expansion of urban areas is consuming more and more arable land,
and this land, including areas equipped with irrigation facilities, is being swal-lowed up by cities (Larson 2013). In terms of data from China’s Ministry of Land and Resources, more than 860,000 ha (2.1 mil-lion ac) of arable land were transformed by urban development each year on aver-age during the period from 1998 to 2006. Especially in southern China, which has abundant water and fertile soils, available cropland has shrunk significantly during past decades owing to urbanization and the expansion of large-scale industry (Liu et al. 2008; Deng et al. 2009; Liu and Tian 2010). Third, China is one of the countries suffering from the most serious soil and water loss in the world. More than 66,000 ha (163,086 ac) of arable land is claimed by soil and water loss every year (Zhen 2004). Soil erosion in the rivers, lakes, and reservoirs leads to sedimentation, reduc-ing the storage capacity of water projects as well as the flood carrying capacity of natural rivers.
POTENTIAL METHODS FOR ADAPTING TO IRRIGATION REQUIREMENTS
To achieve sustainable economic develop-ment and satisfy increased requirements needed to supply food for an expanding
population, the government must develop appropriate water management strate-gies to harmonize the water use structure among different sectors as well as within the agricultural sector (Wang and Gao 2002; Chen et al. 2005; Fang et al. 2007; Wei et al. 2008). There is plenty of room for improvement in water use efficiency (Wang 2010). Methods for improving water use efficiency include regulating transpiration efficiency, enhancing soil water utilization efficiency, reducing soil evaporation (Li et al. 2008), optimizing irrigation scheduling (Wang et al. 2001), developing water-saving irrigation (Gao et al. 2002; Li 2006; Zhang et al. 2006), and investing in water infrastructure, irrigation systems, and irrigation equipment.
Water distribution is uneven both temporally and spatially in China. The Chinese government has set up the South-to-North Water Diversion Project in an attempt to transfer the water from wet southern China to dry northern China. However, the benefits and disadvantages of this project are disputed (Wang and Ma 1999; Wang et al. 2009b; Zhang 2009). In the future, the Chinese government will keep investing in hydraulic projects, but more attention should be paid to the com-
70
65
60
55
50
45
40
35
30Irrig
atio
n w
ater
use
effi
cien
cy (%
)
Province
Beijin
gHeb
eiTia
njin
Shan
ghai
Shan
dong
Henan
Jiang
suHeil
ongji
ang
Zheji
ang
Liaon
ingHain
an Jilin
Shaa
nxi
Shan
xiGan
su
Fujia
nAn
hui
Xinji
ang
Hubei
Inne
r Mon
golia
Qingha
iCho
ngqin
gGua
ngdo
ngJia
ngxi
Ningxia
Guizho
uSi
chua
n Gua
ngxi
Yunn
an
Tibet
Hunan
Figure 6Irrigation water use efficiency in China (the data are from the National Irrigation Water Use Efficiency Measure and Analysis Report 2006).
LegendIrrigation water use efficiency of each province
Mean irrigation water use efficiency of all provinces
Copyright ©
2013 Soil and Water C
onservation Society. All rights reserved.
ww
w.sw
cs.org 68(6):147A
-154A
Journal of Soil and Water C
onservation
153ANOV/DEC 2013—VOL. 68, NO. 6JOURNAL OF SOIL AND WATER CONSERVATION
prehensive assessment of the profits and costs—especially the potential ecologi-cal costs—of such projects (Yin and Yang 2011). Meanwhile, adjusting planting and harvest dates based on temporal cli-mate change effects, such as precipitation seasons, might be a useful adaptation to variations in temporal water distribution.
Currently, farmers have little incentive to save water, and not all of them real-ize that water is a finite resource (Wang et al. 2006; Bluemling et al. 2010). They also lack the knowledge to optimize their irrigation schedule and apply water-saving measures. Therefore, the Chinese gov-ernment needs to create organizations to help farmers develop water-saving tech-nologies and enhance their consciousness of water conservation. The water price reform is helpful for controlling water consumption, but it must be implemented in cooperation with other water manage-ment policies.
In addition, developing drought-resistant crops, planting new strains of genetically modified crops and water effi-cient cultivars (Hu et al. 2006; Zhang et al. 2010), shifting sowing dates, and adjusting crop distribution and structure would also help to reduce water consumption and keep agricultural production high (Li et al. 2010; Tao and Zhang 2010; Wang et al. 2010b; Wang et al. 2011).
SUMMARYDuring the past decade, the Chinese gov-ernment launched a series of programs to enhance the sustainable use of water resources and has made great strides in water-saving strategies. The task of fight-ing water shortage remains challenging, however, and will be increasingly difficult in the future because of increased irriga-tion requirements due to climate change and other factors. Various measures must work together to deal with irrigation requirement increases. Improving water resource management infrastructure; repairing old irrigation systems; investing in hydraulic projects; promoting water-saving technologies; adjusting agricultural water structures; increasing harmonization among agriculture, forestry, herding, and fisheries as well as water consumption by grain crops, cash crops, and grazing grass;
enhancing agriculture water use effi-ciency; and planting more water efficient cultivars can all contribute to sustainable future management of water resources.
REFERENCESBluemling, B., H. Yang, and H.J. Mosler. 2010.
Adoption of agricultural water conservation
practices - A question of individual or collective
behaviour? The case of the North China Plain.
Outlook on Agriculture 39(1):7-16.
Chen, H.P., and J.Q. Sun. 2009. How the “best”
models project the future precipitation change
in China. Advances in Atmospheric Sciences
26(4):773-782.
Chen, Y., and H. Tang. 2005. Desertification in north
China: background, anthropogenic impacts and
failures in combating it. Land Degradation &
Development 16:367-376.
Chen, Y., D.Q. Zhang, Y.B. Sun, X.N. Liu, N.Z. Wang,
and H.H.G. Savenije. 2005. Water demand man-
agement: A case study of the Heihe River Basin
in China. Physics and Chemistry of the Earth
30(6-7):408-419.
Deng, J.S., K. Wang, Y. Hong, and J.G. Qi. 2009.
Spatio-temporal dynamics and evolution of land
use change and landscape pattern in response
to rapid urbanization. Landscape and Urban
Planning 92(3-4):187-198.
Deng, X-P., L. Shan, H. Zhang, and N.C. Turner.
2006. Improving agricultural water use efficiency
in arid and semiarid areas of China. Agricultural
Water Management 80:23-40.
Ding, Y.H., G.Y. Ren, Z.C. Zhao, Y. Xu, Y. Luo,
Q.P. Li, and J. Zhang. 2007. Detection, causes
and projection of climate change over China:
An overview of recent progress. Advances in
Atmospheric Sciences 24(6):954-971.
Fang, C.L., C. Bao, and J.C. Huang. 2007.
Management implications to water resources
constraint force on socio-economic system in
rapid urbanization: A case study of the hexi cor-
ridor, NW China. Water Resources Management
21(9):1613-1633.
Gao, Q.Z., H.L. Du, and R.P. Zu. 2002. The balance
between supply and demand of water resources
and the water-saving potential for agriculture in
the Hexi corridor. Chinese Geographical Science
12(1):23-29.
Hu, Y.C., H.B. Shao, L.Y. Chu, and W. Gang. 2006.
Relationship between water use efficiency
(WUE) and production of different wheat geno-
types at soil water deficit. Colloids and Surfaces
B-Biointerfaces 53(2):271-277.
Huang, Q.Q., S. Rozelle, B. Lohmar, J.K. Huang, and
J.X. Wang. 2006. Irrigation, agricultural perfor-
mance and poverty reduction in China. Food
Policy 31(1):30-52.
Ji, X.B., E.S. Kang, R.S. Chen, W.Z. Zhao, Z.H.
Zhang, and B.W. Jin. 2006. The impact of the
development of water resources on environ-
ment in arid inland river basins of Hexi region,
Northwestern China. Environmental Geology
50(6):793-801.
Kai, W.U., L.U. Bu, and Y. Zhang. 2006. The recent
developments and the contributation of rarm-
land irrigation to national grain safeness in China.
Journal of Irrigation and Drainage 25(4):7-10.
Kharin, V.V., F.W. Zwiers, X.B. Zhang, and G.C.
Hegerl. 2007. Changes in temperature and pre-
cipitation extremes in the IPCC ensemble of
global coupled model simulations. Journal of
Climate 20(8):1419-1444.
Kitoh, A., M. Hosaka, Y. Adachi, and K. Kamiguchi.
2005. Future projections of precipitation char-
acteristics in East Asia simulated by the MRI
CGCM2. Advances in Atmospheric Sciences
22(4):467-478.
Larson, C. 2013. Losing arable land, China faces
stark choice: Adapt or go hungry. Science
339(6120):644-645.
Li, S., S.H. Kang, F.S. Li, and L. Zhang. 2008.
Evapotranspiration and crop coefficient of spring
maize with plastic mulch using eddy covari-
ance in northwest China. Agricultural Water
Management 95(11):1214-1222.
Li, S.A., T. Wheeler, A. Challinor, E.D. Lin, Y.L.
Xu, and H. Ju. 2010. Simulating the impacts
of global warming on wheat in China using a
large area crop model. Acta Meteorologica Sinica
24(1):123-135.
Li, Y.H. 2006. Water saving irrigation in China.
Irrigation and Drainage 55(3):327-336.
Lin, E., Y. Xu, J. Jiang, Y. Li, X. Yang, J. Zhang, C. Li,
S. Wu, Z. Zhao, J. Wu, H. Ju, C. Yan, S. Wang, Y.
Liu, B. Du, C. Zhao, B. Qin, C. Liu, C. Huang,
X. Zhang, and S. Ma. 2006. National asessment
report of climate change (II): Climate change
impacts and adaptation. Advances in Climate
Change Research 2(2):51-56.
Liu, M.L., and H.Q. Tian. 2010. China’s land
cover and land use change from 1700 to 2005:
Estimations from high-resolution satellite data
and historical archives. Global Biogeochemical
Cycles 24:18.
Liu, W. 2007. Analysis on the Problem of Agricultural
Water Resource in China. Ecological Economy
(1):63-66.
Liu, Y.S., L.J. Wang and H.L. Long. 2008. Spatio-
temporal analysis of land-use conversion in the
Copyright ©
2013 Soil and Water C
onservation Society. All rights reserved.
ww
w.sw
cs.org 68(6):147A
-154A
Journal of Soil and Water C
onservation
154A JOURNAL OF SOIL AND WATER CONSERVATIONNOV/DEC 2013—VOL. 68, NO. 6
VIEWPOINTeastern coastal China during 1996-2005. Journal
of Geographical Sciences 18(3):274-282.
MWRC (Ministry of Water Resources, P.R. China).
2009. China Water Statistical Yearbook 2009.
Beijing: China WaterPower Press.
MWRC. 2011. China Water Resources Bulletin
2011. Beijing: China WaterPower Press.
NSBC (National Statistical Bureau, P.R. China).
2005. China Compendium of Statistics, 1949-
2004. Beijing: China Statistics Press.
NSBC. 2012. China Statistical Yearbook 2012.
Beijing: National Statistical Bureau.
Peng, S.Z., and L.K. Ai. 2012. Improving irrigation
water use coefficient and ensuring national food
and water safety. Water Resources Protection
28(3):79-82.
Piao, S.L., P. Ciais, Y. Huang, Z.H. Shen, S.S. Peng,
J.S. Li, L.P. Zhou, H.Y. Liu, Y.C. Ma, Y. H. Ding,
P. Friedlingstein, C.Z. Liu, K. Tan, Y.Q. Yu, T.Y.
Zhang, and J.Y. Fang. 2010. The impacts of cli-
mate change on water resources and agriculture
in China. Nature 467(7311):43-51.
PRC (People’s Republic of China). 2007. China’s
National Assessment Report on Climate Change.
Beijing: Science Publishing House.
Ren, G. 2007. Climate Change and Water Resources
in China. Beijing: China Meteorological Press.
Sheffield, J., and E.F. Wood. 2008. Projected changes
in drought occurrence under future global warm-
ing from multi-model, multi-scenario, IPCC AR4
simulations. Climate Dynamics 31(1):79-105.
Tao, F., M. Yokozawa, J. Liu, and Z. Zhang. 2008.
Climate-crop yield relationships at provincial
scales in China and the impacts of recent climate
trends. Climate Research 38(1):83-94.
Tao, F.L., and Z. Zhang. 2010. Adaptation of maize
production to climate change in North China
Plain: Quantify the relative contributions of adap-
tation options. European Journal of Agronomy
33(2):103-116.
Wang, H.L., Y.T. Gan, R.Y. Wang, J.Y. Niu, H. Zhao,
Q.G. Yang, and G.C. Li. 2008. Phenological
trends in winter wheat and spring cotton in
response to climate changes in northwest China.
Agricultural and Forest Meteorology 148(8-
9):1242-1251.
Wang, H.X., L. Zhang, W.R. Dawes, and C.M. Liu.
2001. Improving water use efficiency of irrigated
crops in the North China Plain - measurements
and modelling. Agricultural Water Management
48(2):151-167.
Wang, J.X., R. Mendelsohn, A. Dinar, J.K. Huang, S.
Rozelle, and L.J. Zhang. 2009a. The impact of cli-
mate change on China’s agriculture. Agricultural
Economics 40(3):323-337.
Wang, J.X., Z.G. Xu, J.K. Huang, and S. Rozelle. 2006.
Incentives to managers or participation of farmers
in China’s irrigation systems: Which matters most
for water savings, farmer income, and poverty?
Agricultural Economics 34(3):315-330.
Wang, L.S., and C. Ma. 1999. A study on the envi-
ronmental geology of the Middle Route Project
of the South-North water transfer. Engineering
Geology 51(3):153-165.
Wang, M., Y.P. Li, W. Ye, J.F. Bornman, and X.D. Yan.
2011. Effects of climate change on maize produc-
tion, and potential adaptation measures: A case
study in Jilin Province, China. Climate Research
46(3):223-242.
Wang, W., J.R. Dai, Y.S. Liang, Y.X. Huang, and G.C.
Coles. 2009b. Impact of the South-to-North
Water Diversion Project on the transmission
of Schistosoma japonicum in China. Annals of
Tropical Medicine and Parasitology 103(1):17-29.
Wang, X.Q., and Q.Z. Gao. 2002. Sustainable devel-
opment and management of water resources
in the Hei River basin of north-west China.
International Journal of Water Resources
Development 18(2):335-352.
Wang, X.Y. 2010. Irrigation water use efficiency of
farmers and its determinants: Evidence from
a survey in northwestern China. Agricultural
Sciences in China 9(9):1326-1337.
Wang, Y.B., P.T. Wu, X.N. Zhao, and J.L. Li. 2010a.
Development tendency of agricultural water
structure in China. Chinese Journal of Eco-
Agriculture 18(2):399-404 (In Chinese).
Wang, Y.B., P.T. Wu, X.N. Zhao, J.L. Li, L. Lv, and
H.B. Shao. 2010b. The optimization for crop
planning and some advances for water-saving
crop planning in the semiarid Loess Plateau of
China. Journal of Agronomy and Crop Science
196(1):55-65.
Wei, Y.C., H. Miao, and Z.Y. Ouyang. 2008.
Environmental water requirements and sustain-
able water resource management in the Haihe
River Basin of North China. International
Journal of Sustainable Development and World
Ecology 15(2):113-121.
Wu, P.T. 2010. Strategic considerations for Chinese
agricultural water and food safety: Issues, chal-
lenges and suggestions. African Journal of
Biotechnology 9(33):5251-5261.
Wu, P.T., J M. Jin, and X.N. Zhao. 2010. Impact
of climate change and irrigation technology
advancement on agricultural water use in China.
Climatic Change 100(3-4):797-805.
Xu, Y.Q., X.G. Mo, Y.L. Cai, and X.B. Li. 2005.
Analysis on groundwater table drawdown by
land use and the quest for sustainable water use
in the Hebei Plain in China. Agricultural Water
Management 75(1):38-53.
Yin, X.A., and Z.F. Yang. 2011. Development of a cou-
pled reservoir operation and water diversion model:
Balancing human and environmental flow require-
ments. Ecological Modelling 222(2):224-231.
You, L., M.W. Rosegrant, S. Wood, and D. Sun. 2009.
Impact of growing season temperature on wheat
productivity in China. Agricultural and Forest
Meteorology 149(6-7):1009-1014.
Yuan, W., S. Lianxi, L.I. Ke, and S.U.N. Hongyan. 2008.
Analysis of present situation of water resources
and countermeasures for sustainble development
in China. Journal of Water Resources and Water
Engineering 19(3):10-14.
Zhang, B.C., F.M. Li, G.B. Huang, Z.Y. Cheng, and
Y.H. Zhang. 2006. Yield performance of spring
wheat improved by regulated deficit irrigation
in an and area. Agricultural Water Management
79(1):28-42.
Zhang, L.P., J. Xia, and Z.F. Hu. 2009. Situation
and problem analysis of water resource security
in china. Resources and Environment in the
Yangtze Basin 18(2):116-120.
Zhang, Q.F. 2009. The South-to-North Water
Transfer Project of China: Environmental
implications and monitoring strategy. Journal
of the American Water Resources Association
45(5):1238-1247.
Zhang, X.Y., S.Y. Chen, H.Y. Sun, Y.M. Wang, and
L.W. Shao. 2010. Water use efficiency and associ-
ated traits in winter wheat cultivars in the North
China Plain. Agricultural Water Management
97(8):1117-1125.
Zhang, X.Y., D. Pei, and C.S. Hu. 2003. Conserving
groundwater for irrigation in the North China
Plain. Irrigation Science 21(4):159-166.
Zhang, Y., Y.L. Xu, W.J. Dong, L.J. Cao, and M.
Sparrow. 2006. A future climate scenario of
regional changes in extreme climate events
over China using the PRECIS climate model.
Geophysical Research Letters 33(24):6.
Zhen, L. 2004. Soil and Water Conservation in
China. Proceedings of the Ninth International
Symposium on River Sedimentation.
Zhen, L., and J.K. Routray. 2002. Groundwater
resource use practices and implications for sus-
tainable agricultural development in the North
China Plain: A case study in Ningjin County
of Shandong Province, PR China. International
Journal of Water Resources Development
18(4):581-593.
Copyright ©
2013 Soil and Water C
onservation Society. All rights reserved.
ww
w.sw
cs.org 68(6):147A
-154A
Journal of Soil and Water C
onservation