impact of irrigation water quality, irrigation systems, irrigation...
TRANSCRIPT

Impact of irrigation water quality, irrigation systems,irrigation rates and soil amendments on
tomato production in sandy calcareous soil
Abdulrasoul M. AL-OMRAN1, A. R. AL-HARBI2, Mahmoud A. WAHB-ALLAH2,Mahmoud NADEEM1, Ali AL-ETER1
1Soil Science Department, College of Food and Agricultural Sciences, King Saud University, P.O. Box 2460, Riyadh 11451 - SAUDI ARABIA
2Plant production Department, College of Food and Agricultural Sciences,King Saud University P.O. Box 2460, Riyadh 11451 - SAUDI ARABIA
Received: 16.02.2009
Abstract: Low quality water for irrigation can impose a major environmental constraint to crop productivity. Effects ofwater quality, irrigation system, irrigation rates, and type of amendment on the yield and quality of tomato plants wereinvestigated during the 2 growing seasons of 2005/2006 and 2006/2007. Two water quality treatments (fresh water withelectrical conductivity (EC) of 0.86 dS m–1, and saline water with EC of 3.6 dS m–1), 2 drip irrigation systems (surface andsubsurface), 3 irrigation rates (2, 4, and 6 L h–1) and 3 amendment types (clay deposit, and organic matter and withoutamendment) were applied. The results revealed that the water quality significantly affected both the yield and water useefficiency (WUE). The decreases in yields due to using low quality water were 39.2% and 17.6% for the first and secondseason, respectively. At a high irrigation rate (6 L h–1), tomato yields were higher and decreased significantly at a lowirrigation rate (2 L h–1) in both seasons. When fresh water was used, the amendment type affected both the yield and WUEin both seasons. Clay deposit increased the yield by 11.7% and 15% in the control treatments in the first and secondseason, respectively. Low quality of irrigation water significantly increased fruit pH, and significantly decreased the other3 traits (average fruit weight, total soluble solid, and fruit thickness). The influence of salinity was more obvious onaverage fruit weight than the other 2 traits. Application of clay deposits on sandy soils modifies the distribution of soilwater content in the root zone area where water could be retained by clay deposits applied in the subsurface layer. Usingsaline water increased the salt accumulation in the surface to about 15 dS m–1 compared with 5 dS m–1 for fresh watertreatments. The clay deposit amendments for subsurface sandy soils using good irrigation water show quite valuableeffects in storing irrigation water and then enhance the root growth and the yield.
Key words: Lycopersicon esculentum L., saline water, amendment, irrigation methods, irrigation rate, water use efficiency
59
Research Article
Turk J Agric For34 (2010) 59-73© TÜBİTAKdoi:10.3906/tar-0902-22
* E-mail: [email protected]

IntroductionTomato (Lycopersicon esculentum Mill.), one of the
world’s most important and widespread crops, isclassified as moderately salt tolerant (Maas 1986) andcould act as a model crop for saline land recovery anduse of poor-quality water as there is a wealth ofknowledge of the physiology and genetics of thisspecies, and the crop is already grown in large areaswhere saline conditions are a problem (Reina-Sanchezet al. 2005).
The continuous decrease in water resources in theworld in general, and in arid regions such as SaudiArabia in particular has forced farmers to use lowquality water and to alter their irrigation practices.The agricultural sectors in the Gulf countriesconsume more than 85% of the total water (Al-Rashedand Sherif, 2000). Therefore, it is necessary to get themaximum yield in agriculture by using the availablewater in order to get the maximum profit from theunit area, and to achieve this we need to know andsupply the right amount of water needed for theplants. Furthermore, it is essential to develop the mostsuitable irrigation schedule to get the optimum plantyield for different ecological regions (Ertek et al.2002). To get the desired profit from irrigation, time,length, and quantity of irrigation should be usefullydetermined. Erroneous irrigation applicationsunderestimating the irrigation time and quantity maycause yield decrease and salinity as well as alkalinityproblems (Onest et al. 1995). Irrigation water qualitycan affect soil fertility and irrigation systemperformance as well as crop yields and soil physicalcondition. Therefore, knowledge of irrigation waterquality is critical to the understanding of necessarymanagement changes for long-term productivity(Bauder et al. 2004).
Most of the cultivated soils in Saudi Arabia aresandy soils characterized by low water holdingcapacities, high infiltration and evaporation rates, lowfertility levels and deep percolation losses that inducelow water use efficiency. The use of clay depositmaterials and a drip irrigation system has helped toimprove some of these constraints in crop productionwith better water management strategies (Al-Omranet al. 2002, 2004, 2005). The drip irrigation systemprovides an advantage using saline water with morefrequent irrigation to keep a high soil matric and low
salt concentration in the root zone. Malash et al.(2005) and Abdelgawad et al. (2005) reported thatwater use efficiency (WUE) was higher with dripirrigation over traditional methods on differenttomato varieties. They also found higher sugarcontent of tomato fruit using saline irrigation watercompared with soil irrigated with non-saline water.Wan et al. (2007) concluded on a 3-year fieldexperiment using saline irrigation water ranging from1.1 to 4.9 dS m–1 with a drip irrigation system andreported that water salinity had little effect on tomatoyields, but had some effect on seasonal accumulativewater use, water use efficiency (WUE), and irrigationwater use efficiency (IWUE). They also concludedthat soil salinity in 0-90 cm soil depth did notincrease. The work on the use of subsurface dripirrigation on crop yields shows that crop yields undersubsurface drip irrigation are equal or greater thanthose obtained by surface drip irrigation (Phene et al.1987; Ayars et al. 1999; Al-Omran et al. 2005). Intomatoes, during the first stages of crop growth,subsurface drip irrigation can increase the efficiencyof water use when compared with surface dripirrigation (Machado et al. 2003).
Soil water and salt distributions were reported inseveral studies using surface and subsurface dripirrigation. Shalhevet (1994) stated that it is stillcontroversial whether the reduction in water uptakewith increasing salinity is the cause or result of thereduction in growth, while Wan et al. (2007)concluded that water salinity of (1.1- 4.9 dS m–1) hadlittle effect on tomato yields. However, Al-Omran etal. (2008) reported that salt accumulation in the fieldwas an important factor in reducing the yield. Thepurpose of this study was to investigate the influenceof water quality, irrigation systems, and irrigationrates on tomato quality, yield, water use efficiency, andsalt distribution in irrigated sandy soils amended withclay deposits or manure.
Materials and methodsTwo successive field experiments were conducted
at the College of Agricultural Research Station atDirab (24°25´ N, 46°34´ E), 40 km southwest ofRiyadh, Saudi Arabia, during the months ofSeptember-April (2005-2006 and 2006-2007).
Impact of irrigation water quality, irrigation systems, irrigation rates and soil amendments on tomato production in sandy calcareous soil
60

Meteorological data are given in Table 1. Theexperiment included 36 treatments representing thecombination of (A) 2 water quality treatments (freshwater with EC 0.86 dS m–1, and saline water with EC3.6 dSm–1, (B) 2 drip irrigation systems (surface andsubsurface), (C) 3 irrigation rates (2, 4, and 6 L h–1),and (D) 2 amendment types (2.25% clay deposits and1.25% organic manure added at 25 cm depth). Anadditional 12 control treatments (withoutamendment) were also included. The physical andchemical characteristics of clay deposits used weredescribed previously by Al-Omran et al. (2005). Theused main lines’ tubing (16 mm in diameter withemitters built in at 50 cm spacing with 2, 4, and 6 Lh–1 discharge rates) was placed at 25 cm depth in thesubsurface system. Furthermore, gauges wereinstalled for measuring the amount of water appliedfor each treatment as shown in Figure 1.
The experimental layout was a split-split plot inrandomized complete block design with 3replications. Water quality treatments were allocatedto the main plots, irrigation system treatments werearranged in the sub-plots, and irrigation rates andamendment type treatments (9 treatments) were
allocated to the sub-sub plots. A drip irrigationnetwork was designed for this study, and the 60-m-long × 12-m-wide field plot was divided into 4 equalplots (7 × 4 m2) with a buffer strip of 2 m left in themiddle (Figure 1).
Tomato seeds (Tanshet Crystal cv.) were sown in anursery on 1 September 2005. One-month-oldseedlings were transplanted in the field for the firstseason. For the second season the seeds were sown ina greenhouse on 4 September 2006 and transplantedon 5 October 2006. Nitrogen as urea (46%, N),potassium as potassium sulfate (48%, K2O), and micronutrients were weekly applied with the irrigationwater at recommended doses, which were 300 kg ureaand 150 kg potassium sulfate. Surface drip irrigationwas applied to all treatments for 1 week to establishthe plants and to avoid any accumulation of saltaffecting growth early. The irrigation treatments wereapplied for all the treatments by providing theirrigation water through the irrigation network, butdifferent irrigation rates were obtained by usingdifferent emitter rates. Data collected in theexperiment were applied to water for each treatment,total ripe fruit yield, root distribution, soil salinity, and
A. M. AL-OMRAN, A. R. AL-HARBI, M. A. WAHB-ALLAH, M. NADEEM, A. AL-ETER
61
Table 1. Metrological data of the experimental site.
Average Maximum Total Solar WindMonth Air Relative Rainfall Radiation Speed ET0Year Temperature °C Humidity % mm 104 W-2 m s-1 mm day-1
September 2005 31.69 38.33 0 38.24 5.30 6.31October 2005 24.94 54.32 0 34.01 4.49 4.72November 2005 21.79 69.88 4.57 27.55 3.71 2.98December 2005 16.00 73.47 0 24.94 3.73 2.77January 2006 14.65 68.85 0.5 24.40 4.69 2.72February 2006 18.05 67.28 0.29 27.65 4.95 3.53March 2006 21.04 53.97 0 35.26 5.11 4.73April 2006 26.15 59.41 2.52 35.95 5.35 5.43September 2006 30.77 37.64 0 37.89 4.95 6.20October 2006 27.8 45.18 0 33.01 4.96 4.97November 2006 20.1 69.93 7.88 24.10 4.31 3.07December 2006 12.69 79.99 9.9 22.68 4.33 2.23January 2007 11.84 76.37 15.99 24.41 4.33 2.41February 2007 17.94 71.71 12.96 30.58 4.65 3.52March 2007 22.11 52.88 0 35.99 5.17 4.84April 2007 27.71 52.5 2.53 38.13 7.70 6.07

soil water content during seasons. Sampling locationsfor both soil water content and soil salinity were 0.25m from the plant at the soil surface and 0.15 m depthintervals down to 0.60 m depth. The electricconductivity of saturation extract (ECe, dS m–1) wasdetermined for each sample then contour maps forwater and salt distributions in the root zone area wereintroduced using Surfer Software (Golden Software,2000). Root distribution was determined using adigital camera. Soil water content was determined bythe gravimetric method.
Water-use efficiency (WUE) was calculatedaccording to the following formula as reported inKirda et al. (2004):
WUE (kg m–3) = Gross fruit yield (kg ha–1) /applied water (m3 ha–1)
Before starting the experiment, a composite soilsample was taken from surface and subsurface layersfrom the study area for analysis. Some physical andchemical characteristics of soil samples and irrigationwater are shown in Tables 2 and 3. Recommendedmethods as outlined in Kulte (1986) were used foranalyzing the soil samples. A random representativesample of fruits, consisting of 5 tomatoes, was takenfrom each replication at middle harvesting time andthe fruit thickness was measured. From thehomogenized juice of the fruits, pH and TSS wererecorded using a hand pH meter and refractometer.
Impact of irrigation water quality, irrigation systems, irrigation rates and soil amendments on tomato production in sandy calcareous soil
62
Surface Drip Irrigation EC 3.6 dS m -1
Subsurface Drip Irrigation EC 0.86 dSm-1
Subsurface Drip Irrigation EC 3.6 dSm-1
Surface Drip Irrigation EC 0.86 dSm-1
Fertilizer Injector
Figure 1. Field experiment layout for each block.C = Control, B = Clay Deposits, O = Organic Matter, I = IrrigationRates 2 L h–1, II = Irrigation Rates 4 L h–1, III = Irrigation Rates 6L h–1, number 1,2,3 = Replicates.

At the end of growing seasons, tomato growthparameters such as plant weight, shoot system weight,root system weight, weight of tomato fruits per plantand the weight of 10 cm segments of root system wererecorded and the gross yield was calculated. Total fruityield for each replicate was recorded to calculate thegross yield (t ha–1). The distribution of root systemwas calculated for each treatment by digging a soilblock of 50 cm × 50 cm × 70 cm and excavating thesoil around the plant; then the plant was picked andthe adhesive soil was removed. The root system wasweighed and the root density system was calculatedfor each plant according to Machado and Oliveria(2003).
Results Yield and WUEThe data in Table 4 show that there were
significant effects of the studied factors (10 differenttreatments; 2 water quality, 2 irrigation systems, 3irrigation rates, and 3 amendment types) with theexception of amendment type during the 2 growingseasons. The results show that subsurface dripirrigation system, high irrigation rate, and fresh waterimproved tomato yield and WUE. The results arefurther elaborated in order to evaluate the effect ofeach treatment on the yield and WUE of the studiedfactors. There were significant decreases in the tomato
A. M. AL-OMRAN, A. R. AL-HARBI, M. A. WAHB-ALLAH, M. NADEEM, A. AL-ETER
63
Table 2. Some physical and chemical characteristics of experimental soil.
Soil depth, cmParameters
0-15 15-30 30-50 50-70
Particle–size distribution, %
Sand 93.0 89.0 89.0 89.0Silt 1.0 6.0 4.0 6.0Clay 6.0 5.0 7.0 5.0Textural Class sand sand sand sandOrganic matter content, % 0.03 0.13 0.16 0.02CaCO3, % 32.0 27.0 24.0 30.0Saturation water content, %(w/w) 27.2 28.3 29.3 29.8Field capacity, %(w/w) 14.8 16.4 17.1 16.8Permanent wilting point, %(w/w) 6.4 7.2 6.7 6.3Plant available water, %(w/w) 8.4 9.2 10.4 10.5pH 7.51 7.72 7.92 8.05Electrical conductivity (ECe dS m–1) 2.75 2.65 2.00 1.80
Soluble Cations, me L–1
Ca2+ 16.4 11.1 11.1 9.1Mg2+ 6.0 6.7 5.6 5.0Na+ 11.0 14.4 6.5 6.4K+ 1.5 2.1 1.7 1.5
Soluble Anions, me L–1
CO3= Tr. Tr. Tr. Tr.
HCO3– 3.9 4.0 2.0 4.0
Cl– 9.8 10.5 7.0 5.0SO4
= 12.8 13.9 10.9 8.7SAR 3.29 4.83 2.18 2.41

yield in the second season compared to that in thefirst season. However, the trend of the influence of thestudied factors was similar in the 2 seasons.
The results indicate that the tomato yield washigher at a high irrigation rate (6 L h–1), but decreasedsignificantly at a low irrigation rate (2 L h–1) in bothseasons. The average yield of the first and secondseasons increased to about 38.7% and 46% with theincreasing irrigation rate from low to high,respectively. With a medium irrigation rate (4 L h–1)the yield increased by 25% and 39% for the first andsecond seasons, respectively. In contrast, WUEdecreased with the increasing irrigation rate. Itdecreased to about 115% and 105% for the first andsecond seasons, respectively, with the increasingirrigation rate from 6 L h–1 to 2 L h–1. Moreover, itdecreased to about 61% for the first season and about42% for the second season with the medium irrigationrate. The results also showed that using saline watersignificantly reduced the tomato yield and WUE
Impact of irrigation water quality, irrigation systems, irrigation rates and soil amendments on tomato production in sandy calcareous soil
64
Table 3. Chemical analysis of the 2 sources of irrigation water.
Parameters Well water Fresh water
pH 7.45 6.05
Electric conductivity (dS m–1) 3.60 0.86
Sodium Adsorption Ratio (SAR) 4.33 7.7
Soluble Cations, me L–1
Ca2+ 12.11 1.30Mg2+ 10.83 0.36Na+ 16.69 7.00K+ 0.50 0.17
Soluble Anions (mg L–1)CO3
– Tr. Tr.HCO3
– 4.00 1.00Cl– 14.76 4.80SO4
– 2.80 5.40NO3
– 44.34 14.28
Table 4. Effect of amendment, irrigation system, irrigation level and water quality on tomato yield and water use efficiency (WUE).
Yield (t ha–1) WUE (kg m–3)Treatment
First Season Second Season First Season Second Season
Amendment TypeControl 61.0 28.2 17.01 8.75Clay Deposits 62.8 27.6 17.01 8.3Organic Matter 58.3 27.1 17.0 9.4LSD0.05 n.s. n.s. n.s. n.s.
Irrigation SystemSurface Drip 55.8 b 23.9 b 15.6 b 7.9 bSubsurface Drip 65.6 a 31.8 a 18.6 a 9.7 aLSD0.05 3.7 2.7 1.7 0.9
Irrigation Level2 L h–1 50.1 c 21.7 b 24.6 a 12.1 a4 L h–1 62.5 b 30.2 a 15.3 b 8.5 b6 L h–1 69.5 A 31.7 A 11.4 c 5.9 cLSD0.05 4.6 3.3 0.8 1.2
Water QualityFresh Water 75.0 a 30.6 a 21.3 a 9.7 aSaline Water 45.6 b 25.2 b 12.8 b 7.9 bLSD0.05 7.8 2.8 1.7 1.0
Values followed by the same alphabetical letter in each column do not differ significantly from each other using LSD test at 0.05 level.

compared to fresh water. The decrease in the yield was39.2% and 17.6% for the first and second seasons,respectively. A similar trend was found with WUE; itdecreased to 40% and 18.5% for the first and secondseasons, respectively.
The results are further elaborated in order toevaluate the effect of each parameter tested with freshand saline water on the yield and WUE (16 treatmentsrepresent the combination of the 2 water quality andthe other 8 treatments: 2 irrigation systems, 3irrigation rates, and 3 amendment types). The data inTable 5 show that using fresh water the amendmenttype affected both the yield and WUE in both seasons.When sand was amended with clay deposit andirrigated with fresh water, fruit yields increased by11.7% and 15% compared to the control treatment forthe first and second seasons, respectively. Amendedwith organic matter and irrigated with saline water,sand has a higher yield in both seasons. A similartrend was found with WUE. Differences in the tomato
yield and WUE due to the irrigation system, i.e.surface and subsurface drip irrigation, weresignificant in both seasons. Subsurface irrigationincreased the yield by about 18.6% and 41% over thesurface drip irrigation in the first and second seasons,respectively. Furthermore, subsurface irrigationincreased WUE by 24.7% and 33.7% compared tosurface drip irrigation for the first and second seasons,respectively. Subsurface irrigation system using bothfresh and saline water increased the yield comparedto surface irrigation. The increase of irrigation ratesignificantly increased the yield in the case of usingfresh water, but made no significant difference in theyield between 4 and 6 L h–1 using saline water (Table5).
Fruit qualityThe results presented in Table 6 illustrated that
effects of amendment type, irrigation system, andirrigation level on average fruit weight, pH, total
A. M. AL-OMRAN, A. R. AL-HARBI, M. A. WAHB-ALLAH, M. NADEEM, A. AL-ETER
65
Table 5. Effect of amendment, irrigation system, and irrigation level on tomato yield and water use efficiency (WUE) under the 2 waterqualities.
Yield (t ha–1) WUE (kg m–3)
First Season Second Season First Season Second SeasonTreatment
Fresh Saline Fresh Saline Fresh Saline Fresh Saline Water Water Water Water Water Water Water Water
Amendment TypeControl 75.3 b 46.2ab 29.7 b 26.6ab 20.8 b 13.1ab 9.0 8.5 abClay Deposits 84.1 a 41.2 b 34.2 a 21.0 b 23.1 a 11.0 b 10.4 6.3 bOrganic Matter 67.0 c 49.1 a 27.9 c 27.9ab 20.2 b 14.2 a 9.7 9.0 abLSD0.05 3.9 6.0 4.2 3.5 1.55 1.7 n.s. 1.2
irrigation systemSurface Drip 69.2 b 42.0 b 25.4 b 22.4 b 19.0 b 12.2 8.3 b 7.5Subsurface Drip 82.1 a 49.0 a 35.8 a 27.9 a 23.7 a 13.4 11.1 a 8.4LSD0.05 3.2 4.9 3.4 2.8 1.3 n.s. 1.5 n.s.
irrigation level2 L h–1 63.7 c 35.8 b 24.7 c 18.7 b 31.4 a 17.7 a 13.8 a 10.4 a4 L h–1 74.0 b 51.0 a 30.8 b 29.7 a 18.3 b 12.5 b 8.6 b 8.3 b6 L h–1 89.3 a 49.7 a 36.3 a 27.1 a 14.6 c 8.1 c 6.7 c 5.1 cLSD0.05 3.9 6.0 4.2 3.5 1.55 1.7 1.79 1.2
Values followed by the same alphabetical letter in each column do not differ significantly from each other using LSD test at 0.05 level

soluble solid (TSS), and fruit thickness of tomatoplants were not significant, except for pH trait, whichwas high with organic matter, and for average fruitweight, which was high with subsurface irrigation. Onthe other hand, irrigation with saline watersignificantly increased fruit pH, and significantlydecreased the other 3 traits. The influence of salinitywas more obvious on average fruit weight than on theother 2 traits and the reduction was more than 50%in both seasons.
Water content and salt distributionsThe data of soil water content and salt
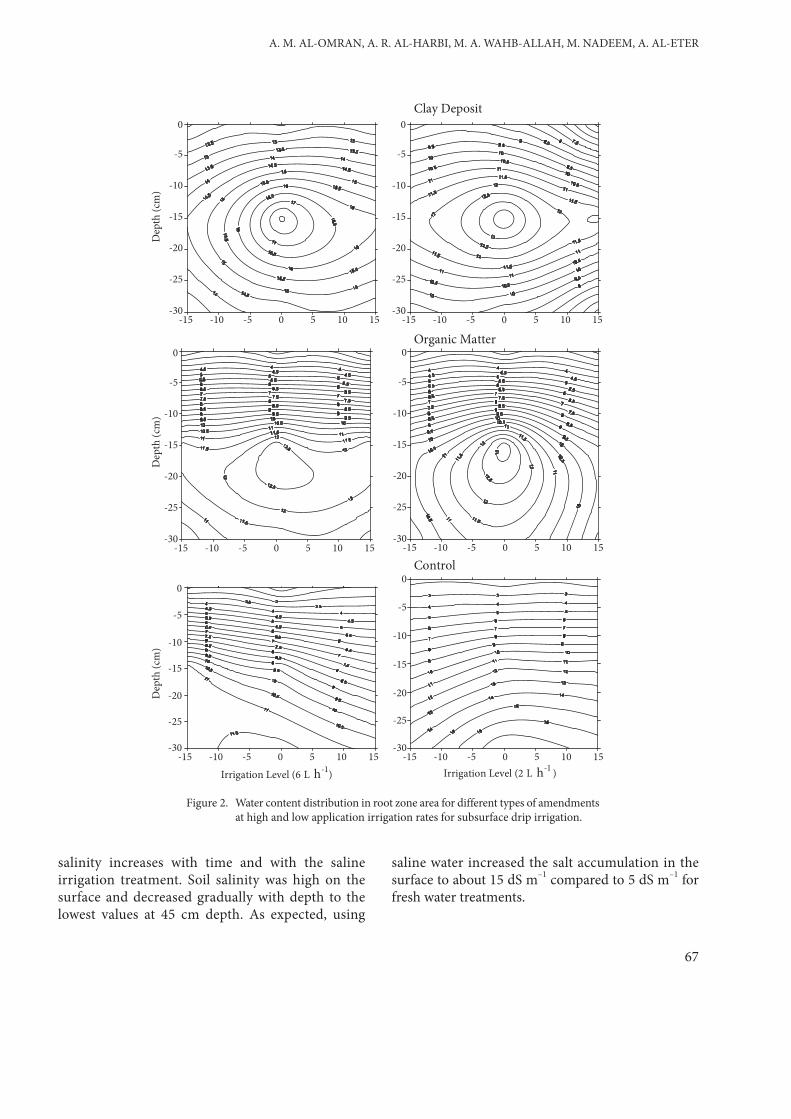
distributions in the root zone area for the 2 seasonsand at different times during the growth period for allthe treatments are graphically illustrated on a surfacecontour base and the data of selected treatments arepresented in Figures 2 and 3, respectively. Figure 2shows that soil water content has specific distributionpatterns in amended soil when compared with the
control soil in both high and low irrigation rate. Insoil treated with clay deposit, soil water contents at adepth of 15-20 cm, amended subsurface layer, weregenerally higher (16% and 12.5% for high and lowirrigation rate, respectively) compared with organicor control treatments. In all the treatments, soil watercontents were generally low in the surface andincreased gradually with depth.
Soluble salt distribution (ECe, dS m–1) in the rootzone area showed an adverse trend when comparedwith soil water distribution, i.e high salt accumulationon the surface and decreased gradually with the depthfor all treatments. Amended soil with clay depositindicated a higher salt accumulation on the surface(Figure 3).
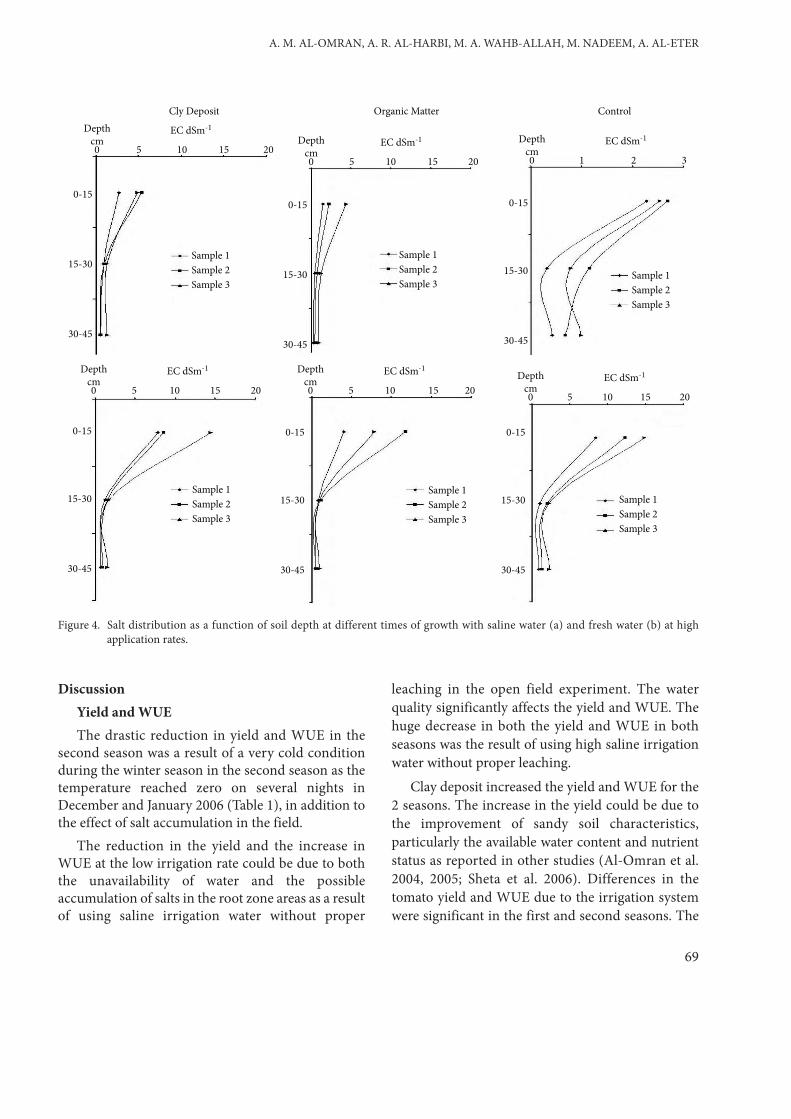
The data of salt distribution in the root zone atdifferent times of growth for all treatments aregraphically illustrated and data of selected treatmentsare given in Figure 4. The figures show that soil
Impact of irrigation water quality, irrigation systems, irrigation rates and soil amendments on tomato production in sandy calcareous soil
66
Table 6. Effect of amendment, irrigation system, irrigation level, and water quality on average fruit weight, pH, TSS, and fruit thicknessof tomato plants.
Average fruit Fruit juice TSS Fruit thicknessweight (g) (%) (%) (mm)
TreatmentFirst Second First Second First Second First Second
Season Season Season Season Season Season Season Season
Amendment TypeControl 86.7 84.2 5.54 b 5.56b 6.45 6.80 0.74 0.80Clay Deposits 82.5 83.6 5.62 ab 5.58b 6.06 6.18 0.71 0.78Organic Matter 85.0 89.1 5.71 a 5.79a 6.11 6.61 0.71 0.77LSD0.05 n.s. n.s. 0.13 0.16 n.s. n.s. n.s. n.s.
Irrigation SystemSurface Drip 79.3 b 81.1 b 5.57 5.61 6.1 6.0 0.73 0.81Subsurface Drip 90.2 a 91.6 a 5.68 5.82 6.2 6.4 0.71 0.75LSD0.05 10.4 8.3 n.s. n.s. n.s. n.s. n.s. n.s.
Irrigation Level2 L h–1 79.8 78.2 5.73 5.60 5.97 6.08 0.70 0.824 L h–1 88.0 90.2 5.56 5.68 6.25 6.33 0.73 0.806 L h–1 86.4 88.9 5.59 5.71 6.40 6.60 0.74 0.79LSD0.05 n.s. n.s. n.s. n.s. n.s. n.s. n.s. n.s.
Water QualityFresh Water 123.1a 120.2a 5.55 b 5.60 b 7.3 a 7.1 a 0.83 a 0.90 aSaline Water 46.4 b 54.6 b 5.70 a 5.80 a 5.0 b 5.2 b 0.62 b 0.69 bLSD0.05 10.4 8.3 0.13 0.16 0.3 0.4 0.04 0.06
Values followed by the same alphabetical letter in each column do not differ significantly from each other using LSD test at 0.05 level
salinity increases with time and with the salineirrigation treatment. Soil salinity was high on thesurface and decreased gradually with depth to thelowest values at 45 cm depth. As expected, using
saline water increased the salt accumulation in thesurface to about 15 dS m–1 compared to 5 dS m–1 forfresh water treatments.
A. M. AL-OMRAN, A. R. AL-HARBI, M. A. WAHB-ALLAH, M. NADEEM, A. AL-ETER
67
Clay Deposit
Organic Matter
Control
-15 -10 -5 0 5 10 15-30
-25
-20
-15
-10
0
-5
-15 -10 -5 0 5 10 15-30
-25
-20
-15
-10
0
-5
-15 -10 -5 0 5 10 15-30
-25
-20
-15
-10
0
-5
-15 -10 -5 0 5 10 15-30
-25
-20
-15
-10
0
-5
-15 -10 -5 0 5 10 15-30
-25
-20
-15
-10
0
-5
-15 -10 -5 0 5 10 15-30
-25
-20
-15
-10
0
-5
Dep
th (c
m)
Dep
th (c
m)
Dep
th (c
m)
Irrigation Level (6 L h-1) Irrigation Level (2 L h-1 )
Figure 2. Water content distribution in root zone area for different types of amendmentsat high and low application irrigation rates for subsurface drip irrigation.

Root distributionThe data of root distributions in the root zone area
for the 2 seasons and at different times during thegrowth for all the treatments are graphicallyillustrated on a surface contour base and the data ofselected treatments are given in Figure 5. The data
showed that clay deposit treatment had the highestroot density compared with the organic matter orcontrol treatments. Moreover, fresh water treatmentseems to enhance root growth and distributionespecially in the subsurface treated layer, which hashigher soil water content.
Impact of irrigation water quality, irrigation systems, irrigation rates and soil amendments on tomato production in sandy calcareous soil
68
Clay deposit
Organic Matter
Control
(b) Irrigation Level (2L h-1)(a) Irrigation Level (6L h-1)-15 -10 -5 0 5 10 15
-25
-30
-20
-15
-10
-5
0
-15 -10 -5 0 5 10 15
-25
-30
-20
-15
-10
-5
0
-15 -10 -5 0 5 10 15
-25
-30
-20
-15
-10
-5
0
-15 -10 -5 0 5 10 15
-25
-30
-20
-15
-10
-5
0
-15 -10 -5 0 5 10 15
-25
-30
-20
-15
-10
-5
0
-15 -10 -5 0 5 10 15
-25
-30
-20
-15
-10
-5
0
Figure 3. Salt distribution in the root zone area at different types of amendments at ahigh application rate (a) and a low application rate (b).
DiscussionYield and WUEThe drastic reduction in yield and WUE in the
second season was a result of a very cold conditionduring the winter season in the second season as thetemperature reached zero on several nights inDecember and January 2006 (Table 1), in addition tothe effect of salt accumulation in the field.
The reduction in the yield and the increase inWUE at the low irrigation rate could be due to boththe unavailability of water and the possibleaccumulation of salts in the root zone areas as a resultof using saline irrigation water without proper
leaching in the open field experiment. The waterquality significantly affects the yield and WUE. Thehuge decrease in both the yield and WUE in bothseasons was the result of using high saline irrigationwater without proper leaching.
Clay deposit increased the yield and WUE for the2 seasons. The increase in the yield could be due tothe improvement of sandy soil characteristics,particularly the available water content and nutrientstatus as reported in other studies (Al-Omran et al.2004, 2005; Sheta et al. 2006). Differences in thetomato yield and WUE due to the irrigation systemwere significant in the first and second seasons. The
A. M. AL-OMRAN, A. R. AL-HARBI, M. A. WAHB-ALLAH, M. NADEEM, A. AL-ETER
69
0 5 20
Depthcm
10
0-15
15-30
30-45
0-15
15-30
30-45
0-15
15-30
30-45
0-15
15-30
30-45
0-15
15-30
30-45
0-15
15-30
30-45
EC dSm-1
15
0 5 20
Depthcm
10
EC dSm-1
15 0 5 20
Depthcm
10
EC dSm-1
15 0 5 20
Sample 1
Sample 3Sample 2
Sample 1
Sample 3Sample 2 Sample 1
Sample 3Sample 2
Sample 1
Sample 3Sample 2
Sample 1
Sample 3Sample 2 Sample 1
Sample 3Sample 2
Depthcm
10
EC dSm-1
15
0 5 20
Depthcm
10
EC dSm-1
15 0 1
ControlOrganic MatterCly Deposit
Depthcm
2
EC dSm-1
3
Figure 4. Salt distribution as a function of soil depth at different times of growth with saline water (a) and fresh water (b) at highapplication rates.

Impact of irrigation water quality, irrigation systems, irrigation rates and soil amendments on tomato production in sandy calcareous soil
70
Figu
re 5
. Ro
ot d
istrib
utio
n as
a fu
nctio
n of
soil
dept
h at
a hi
gh ap
plic
atio
n ra
te (a
) and
a lo
w ap
plic
atio
n ra
te (b
).
Clay
Dep
osit
O
rgan
ic M
atte
r
Cont
rol
(b)
(a)
Dep
th (
cm )
-45
-40
-35
-30
-25
-20
-15
-10-50
-30
-20
-1
0
0
10
2
0
30
Ver
y Fi
neFi
neM
ediu
mD
epth
( cm
)
-25
-50
-45
-40
-35
-30
-20
-15
-10-50
-30
-20
-1
0
0
1
0
20
3
0
Dep
th (
cm )
-50
-45
-40
-35
-30
-25
-20
-15
-10-50
-30
-20
-1
0
0
1
0
20
3
0
Ver
y Fi
neFi
neM
ediu
m
Dep
th (
cm )
-50
-45
-40
-35
-30
-25
-20-1
5
-10-50
-30
-20
-1
0
0
1
0
20
3
0
Ver
y Fi
neFi
neM
ediu
mCo
arse
Ver
y Fi
neFi
neM
ediu
mCo
arse
Dep
th (
cm )
-50
-45
-40
-35
-30
-25
-20
-15
-10-50
-30
-20
-1
0
0
10
20
30
Ver
y Fi
neFi
neM
ediu
mCo
arse
Dep
th (
cm )
-50
-45
-40
-35
-30
-25
-20
-15
-10-50
-30
-20
-1
0
0
10
2
0
30
Ver
y Fi
neFi
neM
ediu
m
advantages of subsurface drip irrigation might be dueto the creation of more suitable conditions in the rootzone area by the subsurface drip irrigation comparedto surface drip irrigation. These results are inagreement with the results reported by (Lamm andTrooien 2003; Al-Omran et al. 2005). Lower yield withthe clay deposit treatment using saline water may bedue to the accumulation of salts in the root zone. Suchdecrease in the yield using saline irrigation could bedue to the characteristics of the treated soil with claydeposit, particularly higher water content and thushigher salt accumulation without proper leaching.The reduction in the yield supports the suggestion ofCuartero and Fernandez-Munoz (1999) that evenunder normal growing conditions the EC of the rootsolution is close to the threshold for yield reduction.The effect of salinity in the yield becomes moreobvious as the salinity levels increased; about 50%yield reduction occurs under saline regime of 8 dSm–1 (Subbarao and Johansen 1994).
Fruit qualityThe influence of salinity was more obvious on the
average fruit weight than on the other 2 traits and thereduction was more than 50% in both seasons. Van-Ieppren (1996) reported a significant reduction in theaverage fruit weight even when low levels of salinitywere applied for the whole experimental period.These results are in general agreement with thefinding reported by Olympios (2003). The effect ofsalinity in the yield becomes more marked as theharvest period progresses, due initially to a restrictionin fruit size during the first 4 weeks of the harvest, butlater to a decrease in fruit number (Adams and Ho1989; Cuartero and Fernandez-Munnza 1999).Sanders et al. (1989) reported that fruit pH decreasedas irrigation rates increased. In contrast, Machado etal. (2003) reported that fruit pH was not affected bythe irrigation rate. Irrigation with saline watersignificantly decreased TSS traits. Stress-specificresponses determine fruit quality to a larger extent,which could even result in a more variable responsedue to different sensitivity levels and defense strategiesof cultivars. Keutgen and Pawelizik (2007) reportedthat 2 cultivars of strawberry varied significantly intheir response to salt stress. In fruit of cv. Korona (lesssalt sensitive) TSS did not change under NaCl salinitywhile, in cv. Elsanta (salt sensitive) a considerable
decrease of more than 40% was detected. The presentresults are in contrast to those published by Machadoet al. (2003) and Yurtseven et al. (2005), who reporteda significant increase in TSS in response to salttreatments. The differences between the presentresults and those reported by Machado et al. (2003)and Yurtseven et al. (2005) are due to the differencesin cultivars’ response to salinity level.
Water content distributionSoil water contents were generally low in the
surface and increased gradually with depth. Thistrend could be due to water evaporation from thesurface and hence decreased soil water content in thesurface layer. Similarly, Malash et al. (2008) reportedthat soil moisture was at a minimum in the root zone(20-40 cm layer), but showed a gradual increase at 40-60 and 60-90 cm and was stable at 90-120 cm depth.They also reported that soil water content decreasedgradually as the distance from the irrigation watersource increased. The highest irrigation rate showedrelatively high soil water content along with the soilprofile and it was more pronounced in the clay deposittreatment. It is clear that water seems to be stored inan amended layer with little seepage below 30 cmdepth. It might be concluded that application of claydeposits in sandy soils modifies the distribution of soilwater content in the root zone area where water couldbe retained by clay deposits applied in the subsurfacelayer.
Salt and root distributionsSalt accumulation was lower in the amended layer
with clay deposits compared to the control treatment.It appears that salt accumulation is reversibly relatedto soil water content distribution. Therefore,irrigation, increasing soil water content in the claydeposit amended layer counters the harmful effect ofsalt accumulation.
The distribution of root growth was clearly relatedto the subsurface application of clay deposits.Therefore, the clay deposit amendments forsubsurface sandy soils using good irrigation watershow quite valuable effects in storing irrigation waterand then enhance the root growth and the yield. Theresult indicated that fresh water treatment enhancesroot growth and distribution, especially in thesubsurface treated layer, which has higher soil water
A. M. AL-OMRAN, A. R. AL-HARBI, M. A. WAHB-ALLAH, M. NADEEM, A. AL-ETER
71

content. Similar results have been reported previously(Bar-Yosef et al. 1980; Oliveira et al. 1996; Machado etal. 2003). They reported that root growth occurspreferentially in the 0-40 cm soil layer and theincrease in the quantity of water applied led to greaterroot development in the top 30 cm of the soil.However, Sanders et al. (1989) observed contrastingresults in a trial in which 0.35, 0.70 and 1.05 of ETwere applied, the root density being the highest in thefirst 30 cm of soil where the lowest water regime wasapplied.
ConclusionThe study showed that subsurface drip irrigation
increased the yield and WUE of the tomato crop andresulted in the saving of applied irrigation water bycreating a good moisture distribution in the root zonedepth. At a high irrigation rate (6 L h–1), tomato yieldswere higher and decreased significantly at a lowirrigation rate (2 L h–1). It can also be concluded thatusing saline water salinity (3.6 dS m–1) for irrigationreduced the average tomato yield by 20%-40%
compared with good water quality (0.86 dS m–1).Addition of clay deposits to sandy soils improves soilwater content in the root zone area where water couldbe retained by clay deposits applied in the subsurfacelayer. Using saline water increased the saltaccumulation in the surface to about 15 dS m–1
compared to 5 dSm–1 for fresh water treatment. Theclay deposit amendments for subsurface sandy soilsusing good irrigation water show quite valuableeffects in storing irrigation water and then enhancethe root growth and the yield.
AcknowledgementsThe authors are thankful to King Abdul Aziz City
for Science and Technology (KACST) for funding partof this research through project # AR-24-47.
The authors also wish to express their deep thanksand gratitude to "Shaikh Mohammad Alamoudi Chairfor Water Research" http://awc.ksu.edu.sa at KingSaud University, http://www.ksu.edu.sa, who kindlyparticipated in sponsoring this work.
Impact of irrigation water quality, irrigation systems, irrigation rates and soil amendments on tomato production in sandy calcareous soil
72
Abdelgawad G, Arslan A, Gaihbe A and Kadouri F (2005) The effectof saline irrigation water management and salt tolerant tomatovarieties on sustainable production of tomato in Syria (1999-2002). Agric Water Manage 73: 39-53.
Adams P and Ho LC (1989) Effects of constant and fluctuating salin-ity on the yield quality and calcium status of tomatoes. J Hort Sci64: 725-732.
Al-Omran AM, El-Damry S, Nadeem M and Al-Eter A (2008) Im-pact of irrigation regime and emitter depth on tomato growthand yield. King Saud J Agric Science (accepted).
Al-Omran AM, Choudahry MI, Shalaby AA and Mursi MM (2002)Impact of nature clay deposits on water movement in calcareoussandy soil. Arid Land Res Manage 16: 185-193.
Al-Omran AM, Falatah AM, Sheta AS and Al-Harbi AR (2004) Claydeposits for water management of sandy soils. Arid Land Res.Manage 18: 171-183.
Al-Omran AM, Sheta AS, Falatah AM and Al-Harbi AR (2005) Effectof drip irrigation on squash (Cucurbita pepo) yield and water-use efficiency in sandy calcareous soils amended with clay de-posits. Agric Water Manage 73: 43-55.
Al-Rashed MF and Sherif MM (2000) Water resources in the GCCcountries: overview. Water Resources Manage 14: 59-75.
Ayars JE, Phene CJ, Hutmacher RB, Davis KR, Schoneman RA, VailSS and Mead RM (1999) Subsurface drip irrigation of row crops:a review of 15 years of research at the Water Management Re-search Laboratory. Agric Water Manage 42: 1-27.
Bar-Yosef B, Stammers C and Sagiv B (1980) Growth of trickle-irri-gated tomato as related to rooting volume and uptake of N andwater. Agron J 72: 815-822.
Bauder TA, Cardon GE, Waskam RM and Davis JG (2004) Irrigationwater quality. Calorado State University. Cooperative ExtensionAgriculture 506.
Cuartero J and Fernandez-Munoz R (1999) Tomato and salinity. Sci-entia Horticulturae 78: 83-125.
Ertek A, Sensoy S, Ildis M and Kabay T (2002) Estimation of the mostsuitable irrigation frequencies and quantities in eggplant grownin greenhouse condition by using pan evaporation coefficient.KS Univ Life Sci Eng J 5: 57-67 (in Turkish).
Golden Software. 2000. Contouring and 3D surface mapping for sci-entists and engineers version 7. Golden Software, Inc.www.goldensoftware.com
Keutgen A and Pawelizik E (2007) Modifications of taste-relevantcompounds in strawberry fruit under NaCl salinity. FoodChemistry 105: 1487-1494.
References
A. M. AL-OMRAN, A. R. AL-HARBI, M. A. WAHB-ALLAH, M. NADEEM, A. AL-ETER
73
Kirda C, Cetin M, Dasgan Y, Topcu S, Kaman H, Ekici B, Derici MRand Ozguven AI (2004) Yield response of greenhouse-growntomato to partial root drying and conventional deficit irriga-tion. Agric Water Manage 69: 191-201.
Kulte A (1986) Methods of soil analysis. Part 1. Physical and miner-alogical methods. 2nd ed. Agronomy No. 9 American Society ofAgronomy, Madison, WI.
Lamm FR and Trooien TP (2003) Subsurface drip irrigation for cornproductivity: a review of 10 years of research in Kansas. IrrigSci 22: 195-200.
Machado RMA, Rosario M, Oliveira G and Portas CAM (2003)Tomato root distribution, yield and fruit quality under subsur-face drip irrigation. Plant and Soil 255: 333-341.
Machado RMA and Oliveira G (2003) Comparison of tomato rootdistributions by minirhizotron and destructive sampling. Plantand Soil 255: 375-385.
Maas EV (1986) Salt tolerance of plants. Applied Agriculture Research1: 12-26.
Malash NM, Flowers TJ and Ragab R (2005) Effect of irrigation sys-tem and water management practices using saline and non-saline water on tomato production. Agric Water Manage 78:25-38.
Malash NM, Flowers TJ and Ragab R (2008) Effect of irrigation meth-ods, management and salinity of irrigation water on tomatoyield, soil moisture and salinity distribution. Irrig Sci 26: 313-323.
Oliveira MRG, Calado AM and Portas CAM (1996) Tomato root dis-tribution under drip irrigation. J Am Soc Hort Sci 121: 644-648.
Olympios CM, Karapanos IC, Lionoudakis K and Apidianakis I(2003) The growth, yield and quality of greenhouse tomato inrelation to salinity applied at different stages of plant growth.Acta Hort 609.
Onest A, Demir K, Cakmak B and Kendirili B (1995) Drip IrrigationScheduling in Head Lettuce Grown in Greenhouse Condition(In Turkish). 5. Ulusal Kulturteknik Kongresi Bildirileri, Kemer-Antalya, p.208
Phene CJ, Davis KR, Hutmacher RB and McCormick RL (1987) Ad-vantages of subsurface drip irrigation for processing tomatoes.Acta Hort 200: 101-113.
Reina-Sanchez A, Romero-Aranda R and Cuartero J (2005) Plantwater uptake and water use efficiency of greenhouse tomato cul-tivars irrigated with saline water. Agric Water Manage 78: 54-66.
Sanders DC, Howell TA, Hile MMS, Hodges L, Meek D and PheneCJ (1989) Yield and quality of processing tomatoes in responseto irrigation rate and schedule. J Am Soc Hort Sci 114: 904-908.
Shalhevet J (1994) Using water of marginal quality for crop produc-tion: major issues. Agric Water Manage 25: 233-269.
Sheta AS, Al-Omran AM, Falatah AM and Al-Harbi AR (2006) Effectof clay deposit, physiochemical and intermittent evaporationcharacteristics of Torripsamment. Arid Land Research andManage 20: 295-307.
Subbarao GV and Johansen C (1994) Strategies and scope for im-proving salinity tolerance in crop plants. In: Pessarakli, M. (Ed.),Handbook of Plant Crop Stress. Marcel Dekker Inc., New York,pp 559-579.
Van-Ieperen W (1996) Effects of different day and night salinity lev-els on vegetative growth, yield and quality of tomato. J Hort Sci71: 99-111.
Wan S, Kang Y, Wang D, Liu SH and Feng L (2007) Effect of drip ir-rigation with saline water on tomato (Lycopersicon esculentum)yield and water use in semi-humid area. Agric Water Manage90: 63-74.
Yurtseven E, Kesmez GD and Unlukara A (2005) The effects of watersalinity and potassium levels on yield, fruit quality and waterconsumption of native center anatolian tomato species (Lyco-persicon esculentum). Agric Water Manage 78: 128-135.