private equity opportunities in nutrition and active … · private equity opportunities in...
TRANSCRIPT

Private Equity Opportunitiesin Nutrition and Active Lifestyle
BREUNIG MatthiasGOLESTANI SaharGOMEZ ArmandoSAWJIANY SwatiVAHIA DhwaniApril 28, 2011

Private Equity – Nutrition & Active Lifestyle
Page 2 of 28
Executive SummaryThe objective of this project sponsored by Roberts Mitani was to identify private equityopportunities in the Nutrition and the Active Lifestyle industries. This reportsummarizes our findings.Since our team team lacked specific experience in the Nutrition and Active Lifestyleindustries, we proposed and agreed on a top down approach for the analysis. Thisstructured approach minimizes the risk of missing interesting investment opportunities.First, we structured the Nutrition and Active Lifestyle industries top-down intosegments and sub-segments. We then defined criteria for identifying attractive marketsegments (growth, fragmentation). From the identified segments and based on thedeveloped criteria, we chose five segments for a detailed analysis of the attractiveness.These five segments were chosen based on feedback from industry experts and ourpersonal expertise and interests. The results of the market attractiveness analysis led usto select three of the five segments for further research on the investment landscape:Food Allergy/Food Intolerance, Organics and Sports Nutrition.We then looked at the deal activity in these three segments and documented the level ofactivity, typical size of deals and the motivation behind these deals. Whenever available,we included financial data on the deals we found.Our team held telephone conferences with Patrick Abouchalache from Roberts Mitani ona weekly basis to validate our progress at every step of our selection process, receivefeedback on our work and agree on the next steps.* * *
Private Equity – Nutrition & Active Lifestyle
Page 3 of 28
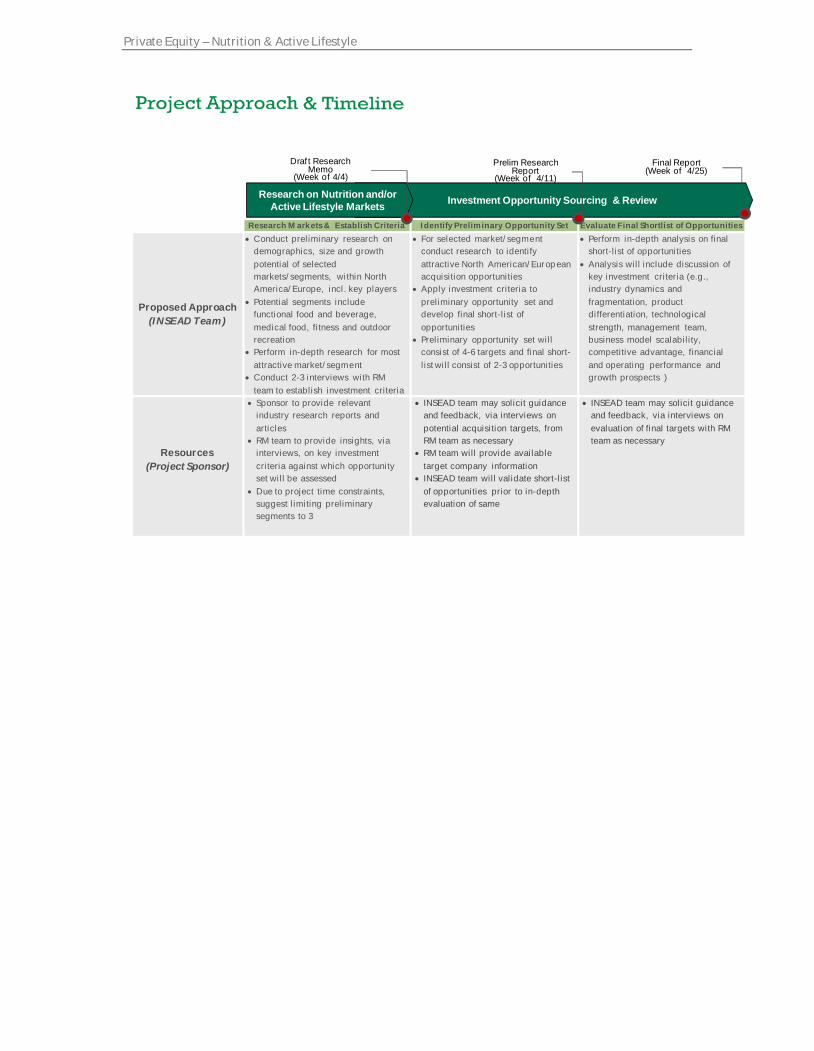
Investment Opportunity Sourcing & ReviewResearch on Nutrition and/orActive Lifestyle Markets
Research Markets & Establish Criteria Identify Preliminary Opportunity Set Evaluate Final Shortlist of Opportunities
Proposed Approach(INSEAD Team)
Conduct preliminary research ondemographics, size and growthpotential of selectedmarkets/segments, within NorthAmerica/Europe, incl. key players
Potential segments includefunctional food and beverage,medical food, fitness and outdoorrecreation
Perform in-depth research for mostattractive market/segment
Conduct 2-3 interviews with RMteam to establish investment criteria
For selected market/segmentconduct research to identifyattractive North American/Europeanacquisition opportunities
Apply investment criteria topreliminary opportunity set anddevelop final short-list ofopportunities
Preliminary opportunity set willconsist of 4-6 targets and final short-list will consist of 2-3 opportunities
Perform in-depth analysis on finalshort-list of opportunities
Analysis will include discussion ofkey investment criteria (e.g.,industry dynamics andfragmentation, productdifferentiation, technologicalstrength, management team,business model scalability,competitive advantage, financialand operating performance andgrowth prospects )
Resources(Project Sponsor)
Sponsor to provide relevantindustry research reports andarticles
RM team to provide insights, viainterviews, on key investmentcriteria against which opportunityset will be assessed
Due to project time constraints,suggest limiting preliminarysegments to 3
INSEAD team may solicit guidanceand feedback, via interviews onpotential acquisition targets, fromRM team as necessary
RM team will provide availabletarget company information
INSEAD team will validate short-listof opportunities prior to in-depthevaluation of same
INSEAD team may solicit guidanceand feedback, via interviews onevaluation of final targets with RMteam as necessary
Draf t ResearchMemo
(Week of 4/4)Prelim Research
Report(Week of 4/11)
Final Report(Week of 4/25)
Private Equity – Nutrition & Active Lifestyle
Page 3 of 28
Investment Opportunity Sourcing & ReviewResearch on Nutrition and/orActive Lifestyle Markets
Research Markets & Establish Criteria Identify Preliminary Opportunity Set Evaluate Final Shortlist of Opportunities
Proposed Approach(INSEAD Team)
Conduct preliminary research ondemographics, size and growthpotential of selectedmarkets/segments, within NorthAmerica/Europe, incl. key players
Potential segments includefunctional food and beverage,medical food, fitness and outdoorrecreation
Perform in-depth research for mostattractive market/segment
Conduct 2-3 interviews with RMteam to establish investment criteria
For selected market/segmentconduct research to identifyattractive North American/Europeanacquisition opportunities
Apply investment criteria topreliminary opportunity set anddevelop final short-list ofopportunities
Preliminary opportunity set willconsist of 4-6 targets and final short-list will consist of 2-3 opportunities
Perform in-depth analysis on finalshort-list of opportunities
Analysis will include discussion ofkey investment criteria (e.g.,industry dynamics andfragmentation, productdifferentiation, technologicalstrength, management team,business model scalability,competitive advantage, financialand operating performance andgrowth prospects )
Resources(Project Sponsor)
Sponsor to provide relevantindustry research reports andarticles
RM team to provide insights, viainterviews, on key investmentcriteria against which opportunityset will be assessed
Due to project time constraints,suggest limiting preliminarysegments to 3
INSEAD team may solicit guidanceand feedback, via interviews onpotential acquisition targets, fromRM team as necessary
RM team will provide availabletarget company information
INSEAD team will validate short-listof opportunities prior to in-depthevaluation of same
INSEAD team may solicit guidanceand feedback, via interviews onevaluation of final targets with RMteam as necessary
Draf t ResearchMemo
(Week of 4/4)Prelim Research
Report(Week of 4/11)
Final Report(Week of 4/25)

Private Equity – Nutrition & Active Lifestyle
Page 4 of 28
Table of Contents
Executive Summary .........................................................................................................................2
Table of Contents ..............................................................................................................................41. Industry and Segment Analysis...........................................................................................4
1.1. Definition of Segments ................................................................................................................41.1.1. Nutrition................................................................................................................................................ 41.1.2. Active Lifestyle ................................................................................................................................... 41.2. Selection Criteria ..........................................................................................................................41.2.1. Market Segment Criteria ................................................................................................................ 41.2.2. Company Criteria............................................................................................................................... 51.3. Evaluation of Segments...............................................................................................................51.3.1. Children’s Nutrition.......................................................................................................................... 51.3.2. Food Allergy/Food Intolerance ................................................................................................... 91.3.3. Organics...............................................................................................................................................121.3.4. Sports Nutrition ...............................................................................................................................151.3.5. Biking Equipment and Accessories..........................................................................................191.4. Selection of Most Attractive Segments ............................................................................... 24
2. Deal Activity in Previous Years ........................................................................................ 242.1. Food Allergy/Food Intolerance............................................................................................. 242.1.1. Level of Activity................................................................................................................................232.1.2. Size of Deals .......................................................................................................................................232.1.3. Motivation ..........................................................................................................................................242.2. Organics......................................................................................................................................... 242.2.1. Level of Activity................................................................................................................................252.2.2. Size of Deals .......................................................................................................................................262.2.3. Motivation ..........................................................................................................................................252.3. Sports nutrition ........................................................................................................................2652.3.1. Level of Activity............................................................................................................................. 2652.3.2. Size of Deals .................................................................................................................................... 2652.3.3. Motivation ....................................................................................................................................... 276
References........................................................................................................................................ 27
Private Equity – Nutrition & Active Lifestyle
Page 5 of 28
1. Industry and Segment Analysis
1.1. Definition of SegmentsIn order to evaluate the attractiveness of opportunities in the nutrition and activelifestyle industries, we first structure these industries into segments and sub-segments.1.1.1. NutritionWe see the following segments and sub-segments within the nutrition industry:
Vitamins/Dietary Supplements Sports Nutrition Food Allergy/Food Intolerance Children’s Nutrition:
o Regularo Supplements
Organic Food (incl. Retail) Naturally Healthy (“regular good for you food”) Slimming Products Restaurants/Delivery Herbal/Traditional Remedies Multi-brand retailer
o Offlineo Online (with social media or networking function)
1.1.2. Active LifestyleWe see the following segments and sub-segments within the active lifestyle industry: Gym/Spa Sports Gear
o Clotheso Distribution of Gear
Online Retailers Offline Retailers
o Machineso Weightso Special Equipment
Service Business (e.g., Personal Training) Orthopedic
1.2. Selection CriteriaThere are selection criteria for both the market segments and companies operatingwithin these segments. While for the market segments industry indicators like growthand fragmentation are most important, for the companies there is a need of specificperformance indicators like size, geography and capabilities of the management team.1.2.1. Market segment criteriaGrowth:

Private Equity – Nutrition & Active Lifestyle
Page 6 of 28
Growing at a CAGR of 10-20% 10% growth on a long term basisFragmentation: Segment in fragmented market with potential for consolidation
1.2.2. Company criteriaSize: Middle Buyout Revenue of $25M-$100M USD (Targets up to $200M USD) Bottom line – healthy cash generationGeography: Located in US and Western Europe (Turkey/Western Europe)Management Team: Diversification Track record Historic successes
1.3. Evaluation of SegmentsFrom the segments defined above, we selected five segments for further investigation,based on feedback from industry experts and our personal expertise and interests: Children’s Nutrition Food Allergy/Food Intolerance Organics Sports Nutrition Biking Equipment
1.3.1. Children’s NutritionAs children’s obesity rates have been increasing rapidly children’s nutrition and healthyeating have come to the forefront of everyone’s attention. Parents and new companiesare trying to deliver better options to children in the midst of media-driven confusionover what are 'good' and 'bad' foods and beverages. Parents across the word are nowaiming to reduce children’s calorie intake while enhancing the amount of healthynutrients their kids consume. Children in this generation are more connected toinformation, advertisements on TV and an addiction to the Internet. These factors havehugely shaped their loyalties and passions to certain products and brands. Thechildren’s market is typically divided into the following segments:Table 1: Children and stages of development
Age Group Classic theory Characteristic behaviour0-2 Infant Sensory Motor Period Differentiation of self3-7 Children The Preoperationalperiod Use of language and object recognition
Private Equity – Nutrition & Active Lifestyle
Page 7 of 28
Age Group Classic theory Characteristic behaviour8-12 Tweenager Period of concreteoperations Can think logically about objects and events13-19 Teenager Period of FormalOperationsSource: Piaget’s stages of cognitive developmentMore information will be provided below on the market size, market share of majorplayers, key trends, growth, margins and the overall industry analysis.
Market Size and GrowthFrom 2009, Business Insights forecasts that the growth of the kids' food and beveragemarket will remain fairly flat although still positive, at a CAGR of around 1.2% to 2013.This is in line with economic projections from the Federal Reserve suggesting a return totypical GDP growth of 2–3% in 2010, with inflation remaining at standard levels ofaround 1–2%. As the figure below depicts the industry was heavily affected during theyears of the recession and has just began to stabilize.Figure 1: Food and beverage sales for the kids market (EU, US and Japan combined)
Source: Business InsightsAs it can be seen there was a significant drop after 2007 and now the growth year byyear is beginning to stabilize. Looking closely at the international markets for kids'products, it can be seen that the industry leader is the US, with over $69bn in sales in2009. However, the combined European members of the G7 represented a total marketvalue of $14.3bn in 2009, making Europe important for those looking to enter or expandin the kids' foods and beverage category and succeed in the long run.The kids' market will always be a strong category, yet increasing regulations regardingwhat messages can be used for foods and beverages are stifling growth in some markets.However, the desire for parents to deliver healthy and nutritious foods to their childrenhas never been so strong. With government intervention surrounding the requirementsof foods with good nutrient profiles, the category of 'better-for-you' kids' foods willcontinue to offer opportunities across all international markets.
Private Equity – Nutrition & Active Lifestyle
Page 8 of 28
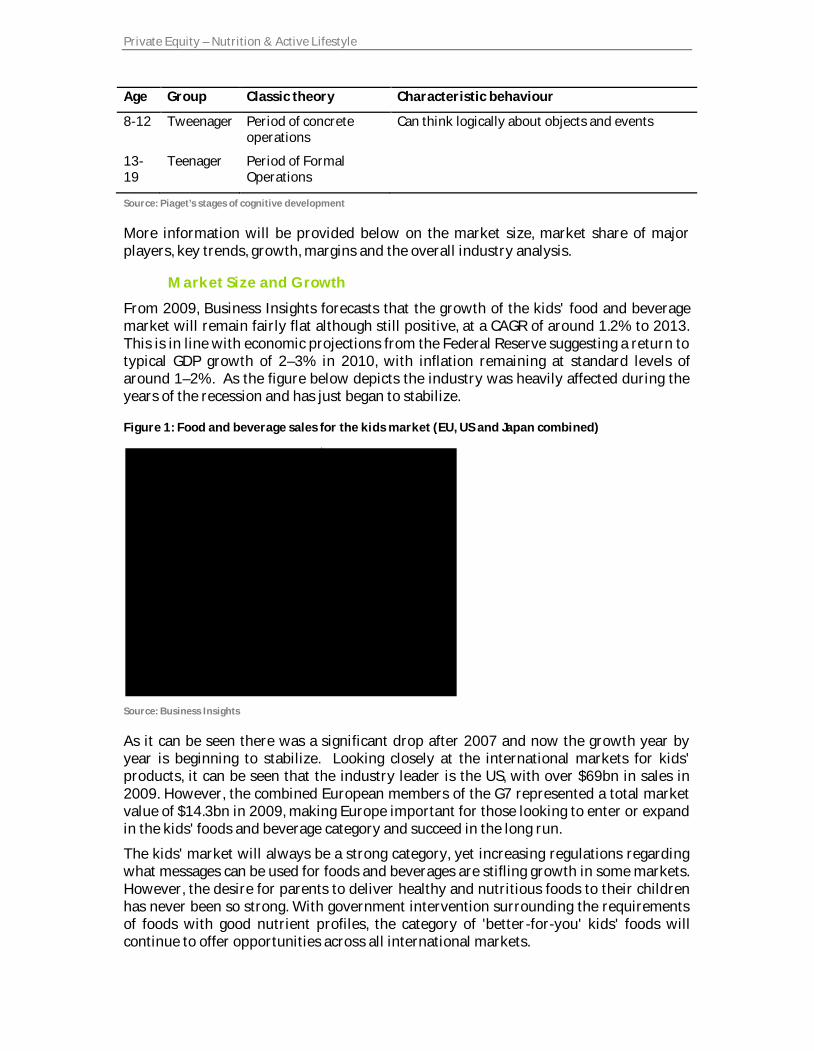
Market Share of Key PlayersNestle, DANONE, Pepsi, Coke are major players in this market. Depending on the type offood and nutrition, players have different market shares.Key TrendsA few population trends should be kept in mind when viewing the children’s markets.There is an overall aging population globally; this in fact means that the children’smarket is shrinking. The impact of fewer children on the marketing and sale of food andbeverages must be considered. On the other hand, children’s own spending money hassignificantly increased. Nearly one in 10 (8%) children living in the UK stated that theirparents looked after their pocket money, suggesting that around 90% control their ownspending behavior. Kids discretionary income has increased over the past few years, infact, in the US, eight to 12 year olds are said to have spent $30bn of their own money.Below is a chart of the growth of the discretionary income of children.
Table 2: European and US five to nine year-old children’s discretionary incomes ($ per week), bycountry, 2002–12
2002 2007 2012 CAGR 02-07 CAGR 07-12France 2.3 3.15 4.02 6.5% 5.0%Germany 3.11 4.15 5.19 6.0% 4.6%Italy 2.59 3.42 4.26 5.7% 4.5%Netherlands 3.25 4.37 5.46 6.1% 4.5%Spain 2.95 3.93 4.9 5.9% 4.5%Sweden 3.57 4.84 6.04 6.3% 4.5%UK 4.97 6.63 7.88 5.9% 3.5%Europe 3.25 4.35 5.38 6.0% 4.4%US 5.25 7.07 8.51 6.1% 3.8%Source: Business InsightsMoreover, publications and focus on children’s health has risen significantly. Over thepast 10 years the number of research publications on child nutrition has increased by113%, and this growth has been dwarfed by the rise in articles related to childhoodobesity. In response to the higher obesity rates, much more stringent regulation onadvertising and product labeling has somewhat stifled the growth of the junk foodmarket.In summary, although children now make up a smaller percentage of the overallpopulation, there is a bigger focus on their health and they do have a higher amount ofpersonal money that they are willing to spend.
Porters Five ForcesSuppliers to the major players in this market are often the commodities providers ofbasic raw materials, chemicals and packaging. Most of this can be thought ofcommodities and cause no major threat. Due to the relative lack of differentiation of atleast some input materials, and the availability of alternative suppliers, supplier poweris weakened (although the quality of the raw materials is generally significant). However,

Private Equity – Nutrition & Active Lifestyle
Page 9 of 28
as manufacturers are under regulatory and parental pressures to provide healthierfoods, the demand for more natural raw materials will most definitely increase.Some of the buyers in this industry can exert strong bargaining power due to their largesize and strong financial muscle, which allows them to make large purchases. Losing acustomer such as a large supermarket chain could have a significant impact on players’revenues hence it strengthens buyer power. Switching costs for buyers are not all thathigh, which increases buyer power in all markets further. Beverage manufacturers candifferentiate their products quite efficiently. End customers are either the childrenthemselves or the parents purchasing on behalf of their children. Often timesmanufacturers also target the schools as children do spend 35 hours a week at schooland regulation is being defined within schools to offer healthy foods. In most cases,buyers do not have a collectively strong power, and hence overall the buyer power ismoderate.Entry to the industry may be achieved by starting up a new company, diversifying anexisting company's operations or acquisition of an existing company. It is possible toenter the industry in a small way in some segments, for example, a super food or snack,since in many countries there is a rising demand for healthy and organic food thatchildren like, which are marketed on the basis of quality and diversity, and can be sold athigher prices. Investment in production equipment can be then recouped by adding agood margin to the price of the end product. The existing brand strength in this industry,such as Nestle or DANONE, is strong, with the most established brands in each definedcategory being recognized worldwide. Newcomers may find it difficult to compete withthem effectively. Producers need to distribute their product widely, which generallyinvolves channels such as supermarkets. Most countries have stringent governmentregulations according to manufacturing and selling of foods impact the ease of industryentry. The threat of entry is assessed as moderate.It is difficult to unambiguously define the benefits of the substitutes; there are somedifferences between the ways different children nutritional goods are consumed.Switching in the sense of allocating more shelf space to the substitutes may beadvantageous for retailers in cost terms. Switching between different types of foods israther easy and therefore threat of substitutes is considered high.Large numbers of industry players as well as the presence of the leading companiesboosts rivalry. It is possible to differentiate these products effectively, and someindustry players have developed strong brands. However, purchasers have a very widerange of selection to choose from, with relatively low switching costs. This tends tointensify rivalry. Major players most commonly offer mass-market products. Thisimplies high fixed costs, because of the need to operate large plants. Additionally, once acompany becomes established it can fairly readily increase its production capacity.Under these circumstances, leaving the industry would require divestment of thesespecialized assets, and the high exit costs imply stronger rivalry.1ConclusionThere are three major trends within this industry that limit the attractiveness of thisindustry. Firstly, the market size is shrinking as the population is aging and the totalnumber of children is the market is reducing. The overall CAGR of this market isapproximately forecasted to remain fairly flat although still positive, at a CAGR of
1 http://www.nourishinteractive.com/parents_area/healthy_family_nutrition_newsletter/free_nutrition_articles

Private Equity – Nutrition & Active Lifestyle
Page 10 of 28
around 1.2% until 2013. Secondly, children are projected to control more and morecontrol over their growing spending money. Although fortunate for junk food marketand toys, it is clear that none of their spending money will go towards healthy andnutritious foods. This implies that not only is the total size of the market shrinking butso is the total amount spent in this industry due to the shift in spending. Thirdly,although there is a shift towards the consolidation within this industry, the power isshifted towards the major players such as DANONE and Pepsi who are acquiring smallercompanies to have access to new markets and distribution channels. Overall, theChildren’s Nutrition industry is not a very appealing industry for potential acquisitionsand moving forward with additional research is not recommended.1.3.2. Food Allergy/Food IntoleranceFrom a medical perspective, there is a difference between food allergies and foodintolerances. The following paragraphs quickly describe these differences and explainwhat the most common allergies and intolerances are.Food AllergyRecent studies have found that almost 1 in 20 young children (5%) under the age of 5years and almost 1 in 25 adults (4%) are allergic to at least one food. Other studiesindicate that food allergy, especially allergy to peanut, is on the rise. As a result, moreand more people are becoming aware of food allergy, making it a subject of increasingpublic concern.2Food allergy is an abnormal response to a food triggered by the body’s immune system.There are several types of immune responses to food. This booklet focuses on one typeof adverse reaction to food—that in which the body produces a specific type of antibodycalled immunoglobulin E (IgE). The binding of IgE to specific molecules present in a foodtriggers the immune response. The response may be mild or in rare cases it can beassociated with the severe and life- threatening reaction called anaphylaxis.3Although any food could potentially cause a reaction, eight foods are responsible for upto 90% of all food-allergic reactions. They are41. Milk and milk products2. Eggs3. Peanuts4. Soy5. Wheat6. Tree nuts (such as almonds, pecans, walnuts, etc.)7. Fish (such as salmon)8. Shellfish (such as shrimp, crayfish, lobster, and crab)Food allergies generally develop early in life but can develop at any age. For example,milk allergy tends to develop early in life, whereas shrimp allergy generally developslater in life. Children usually outgrow their egg, milk, and soy allergies, but people whodevelop allergies as adults usually have their allergies for life. Children generally do notoutgrow their allergy to peanut.5
2 http://www.niaid.nih.gov/topics/foodAllergy/Documents/foodallergy.pdf3 ibid4 http://www.foodallergy.org/files/DoYouHaveBrochure.pdf5 http://www.niaid.nih.gov/topics/foodAllergy/Documents/foodallergy.pdf

Private Equity – Nutrition & Active Lifestyle
Page 11 of 28
Food Intolerance
Lactose intolerance: Lactose is a sugar found in milk and most milk products. Lactaseis an enzyme in the lining of the gut that breaks down or digests lactose. Lactoseintolerance occurs when lactase is missing. Instead of the enzyme breaking down thesugar, bacteria in the gut break it down, which forms gas, which in turn causessymptoms of bloating, abdominal pain, and sometimes diarrhea.Lactose intolerance is uncommon in babies and young children under the age of 5 years.Because lactase levels decline as people get older, lactose intolerance becomes morecommon with age. Lactose intolerance also varies widely based on racial and ethnicbackground.6Food additives: Another type of food intolerance is a reaction to certain products thatare added to food to enhance taste, add color, or protect against the growth of microbes.Several compounds such as MSG (monosodium glutamate) and sulfites are tied toreactions that can be confused with food allergy.
MSG is a flavor enhancer. When taken in large amounts, it can cause some of thefollowing: Flushing, Sensations of warmth, Headache, Chest discomfort. These passingreactions occur rapidly after eating large amounts of food to which MSG has been added. Sulfites are found in food for several reasons: They have been added to increasecrispness or prevent mold growth, they occur naturally in the food or they have beengenerated during the winemaking process. Sulfites can cause breathing problems inpeople with asthma.7
Gluten intolerance: Gluten is a part of wheat, barley, and rye. Gluten intolerance isassociated with celiac disease, also called gluten-sensitive enteropathy. This diseasedevelops when the immune system responds abnormally to gluten. This abnormalresponse does not involve IgE antibody and is not considered a food allergy.8Market Size and GrowthThere are currently thought to be over 300 million people managing special dietsworldwide, as a result of food allergies or intolerances, and the number is rising eachyear. The increased diagnosis of food sensitivities has given rise to a new and growingmarket for food intolerance – or "free-from" – products, as well as stricter labelling anda greater awareness in general of the content and origins of packaged foods.9The market for food intolerance products is still in its infancy, but has grown rapidly inrecent years, with global value sales rising by 77% between 2003 and 2008, to reach anestimated US$6.8 billion. At the same time, however, stronger growth in sales of free-from products has been held back by factors such as high prices, restricted distributionand lack of competition in some markets.10
Lactose-free products is by far the largest of the three main sectors in value terms, withsales reaching US$4.0 billion in 2008. It is also the most mature sector, recording growthof 54% over the 2003-3008 period (although the lactose-free ice cream subsector is stillembryonic). Lactose-free dairy products compete strongly with non-dairy products, such6 http://www.niaid.nih.gov/topics/foodAllergy/Documents/foodallergy.pdf7 ibid8 ibid9 Euromonitor International: Global Market for Food Intolerance Products: At War With Our Food10 ibid

Private Equity – Nutrition & Active Lifestyle
Page 12 of 28
as soy- and rice-based products. Many varieties of soya milk are fortified with calciumand other nutrients, and some are also low-fat. Gluten-free products enjoyed rapid growth of 126% in value over the review period.Most products in this sector are alternatives to traditional grain-based goods, and aremade with different grains and flours, such as rice, corn, amaranth and quinoa. Gluten-free beers are also growing in demand and are increasingly available throughmainstream outlets (although they are not included in Euromonitor International data).These are usually made with sorghum or buckwheat.The US dominates the world in terms of total sales of food intolerance products, withvalue sales worth US$2.8 billion in 2008. It is followed at some distance by Germany,Russia, Italy and Canada.11
Figure 2: Top 10 Markets for Food Intolerance Products
Source: Euromonitor InternationalFood intolerance products is one of the key sectors that has been identified for growthby analysts for the next few years, along with segments such as super-foods, certainethnic foods, satiety foods and natural foods. The main drivers of growth in free-fromfoods will be increased awareness and diagnosis of food allergies and intolerances, as aresult of such factors as new product development, changes to labelling legislation,mainstream distribution and the entry of multinationals to this market.12
11 Euromonitor International: Global Market for Food Intolerance Products: At War With Our Food12 ibid
Private Equity – Nutrition & Active Lifestyle
Page 13 of 28
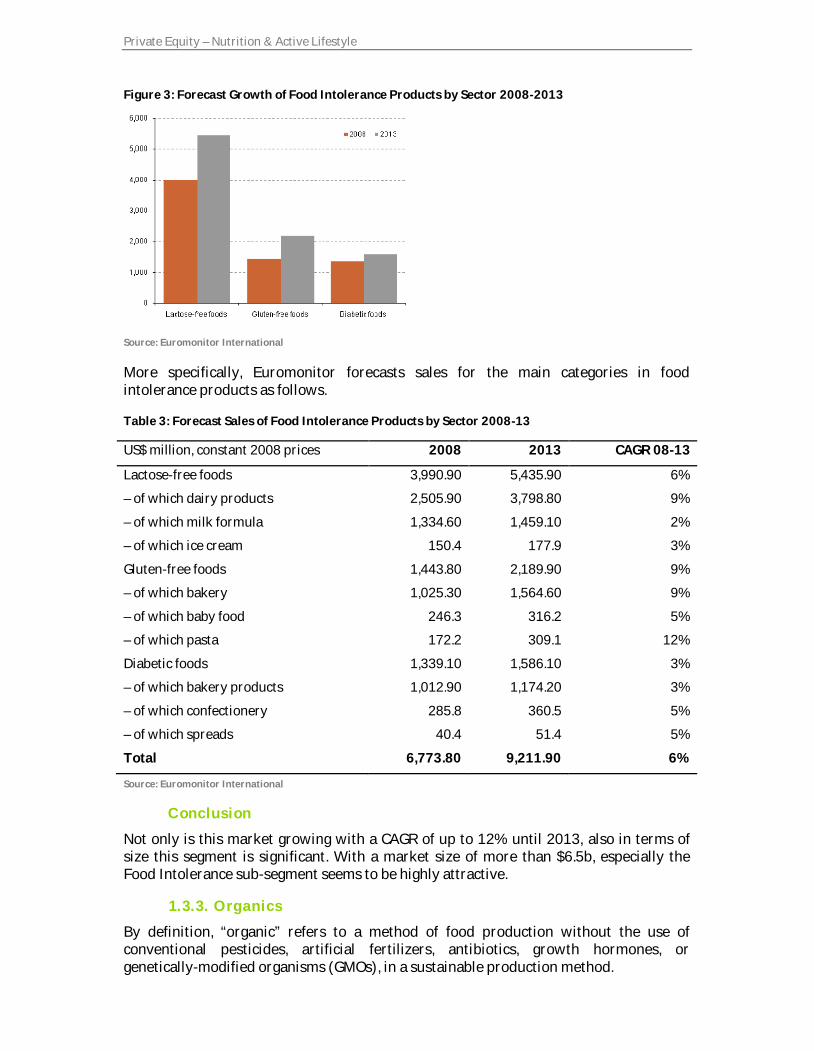
Figure 3: Forecast Growth of Food Intolerance Products by Sector 2008-2013
Source: Euromonitor InternationalMore specifically, Euromonitor forecasts sales for the main categories in foodintolerance products as follows.Table 3: Forecast Sales of Food Intolerance Products by Sector 2008-13US$ million, constant 2008 prices 2008 2013 CAGR 08-13Lactose-free foods 3,990.90 5,435.90 6%– of which dairy products 2,505.90 3,798.80 9%– of which milk formula 1,334.60 1,459.10 2%– of which ice cream 150.4 177.9 3%Gluten-free foods 1,443.80 2,189.90 9%– of which bakery 1,025.30 1,564.60 9%– of which baby food 246.3 316.2 5%– of which pasta 172.2 309.1 12%Diabetic foods 1,339.10 1,586.10 3%– of which bakery products 1,012.90 1,174.20 3%– of which confectionery 285.8 360.5 5%– of which spreads 40.4 51.4 5%Total 6,773.80 9,211.90 6%
Source: Euromonitor International
ConclusionNot only is this market growing with a CAGR of up to 12% until 2013, also in terms ofsize this segment is significant. With a market size of more than $6.5b, especially theFood Intolerance sub-segment seems to be highly attractive.1.3.3. OrganicsBy definition, “organic” refers to a method of food production without the use ofconventional pesticides, artificial fertilizers, antibiotics, growth hormones, orgenetically-modified organisms (GMOs), in a sustainable production method.
Private Equity – Nutrition & Active Lifestyle
Page 13 of 28
Figure 3: Forecast Growth of Food Intolerance Products by Sector 2008-2013
Source: Euromonitor InternationalMore specifically, Euromonitor forecasts sales for the main categories in foodintolerance products as follows.Table 3: Forecast Sales of Food Intolerance Products by Sector 2008-13US$ million, constant 2008 prices 2008 2013 CAGR 08-13Lactose-free foods 3,990.90 5,435.90 6%– of which dairy products 2,505.90 3,798.80 9%– of which milk formula 1,334.60 1,459.10 2%– of which ice cream 150.4 177.9 3%Gluten-free foods 1,443.80 2,189.90 9%– of which bakery 1,025.30 1,564.60 9%– of which baby food 246.3 316.2 5%– of which pasta 172.2 309.1 12%Diabetic foods 1,339.10 1,586.10 3%– of which bakery products 1,012.90 1,174.20 3%– of which confectionery 285.8 360.5 5%– of which spreads 40.4 51.4 5%Total 6,773.80 9,211.90 6%
Source: Euromonitor International
ConclusionNot only is this market growing with a CAGR of up to 12% until 2013, also in terms ofsize this segment is significant. With a market size of more than $6.5b, especially theFood Intolerance sub-segment seems to be highly attractive.1.3.3. OrganicsBy definition, “organic” refers to a method of food production without the use ofconventional pesticides, artificial fertilizers, antibiotics, growth hormones, orgenetically-modified organisms (GMOs), in a sustainable production method.

Private Equity – Nutrition & Active Lifestyle
Page 14 of 28
Organic foods have traditionally been marketed as being “better for you,” both in termsof food safety and in delivering better taste and nutrients. However, “organic” is mostlyan unregulated term, but trends towards standardization are emerging. For example,there are specific regulations required by the FDA in the US and the EU is movingtowards a single EU-wide organic designation.Currently, products sold as organic in leading markets require certification from anaccredited organization. As each country has its own accreditation agency, standardsvary significantly. Similarly, no standard substantiates claims that organic products aretastier, more nutritious, etc.13The MarketThe global organic food market grew by 12.4% in 2010 to reach $59.3 billion, at a 12%CAGR from 2006-2010.14 In the US alone, the largest organic food market by volume,sales of organic foods have grown from $ 1.0 billion in 1990 to $25 billion in 2009, with2009 representing a 5% yoy growth with organic fruits and vegetables up nearly 12%from the year prior.15 Additionally, 3.7% of all food purchases in the US are of organicproducts, and fruits and vegetables make up 11.4% of all US produce sales. 16
Table 4: Global organic food market value
Year $ million € million % Growth2006 37,711.2 27,120.42007 43,688.2 31,418.8 15.82008 49,839.0 35,842.2 14.12009 52,775.1 37,953.8 5.92010(e) 59,341.2 42,675.9 12.4CAGR: 2006-10 12.0
Source: DatamonitorEven with the global recession, organic food demand remained relatively stable, largelydue to its inelastic nature, and more affluent customer base. Contracting pricedifferentials between organic and non-organic products have also led more and morecustomers to choosing an organic alternative.
13 The Evolution of Organic Food and Drinks, Business Insights, 200714 Datamonitor Global Organic Industry Profile 201015 ibid16 ibid

Private Equity – Nutrition & Active Lifestyle
Page 15 of 28
Figure 4: Global Organic Food Market Value
Source: DatamonitorGrowth in organic farming has led to the price drop mentioned above, which has also ledto more competitive pricing and lower margins. Grocery stores have also introducedprivate-label organic brands, whereby further decreasing the margins that premiumlabels can charge. Areas that have particularly been impacted are grains and dairy,where organic products are no longer significantly more expensive than non-organic.Figure 5: Global Organic Food Market Segmentation (by value)
Source: Datamonitor
GrowthBy 2015, the global organic food market is predicted to reach $88 billion in sales, anincrease of 48.4% from 2010 levels. This represents a deceleration in the growth rate, toan 8.4% CAGR (2010-2015). Fruits and vegetables are attributed to accounting for muchof this growth, making up 30.9% of the organic market.17 Furthermore, the Americas areprojected to be the largest geographical segment purchasing organic goods, with anestimated 54.2% of organic purchases. 18
17 Datamonitor Global Organic Industry Profile 201018 ibid
Private Equity – Nutrition & Active Lifestyle
Page 16 of 28
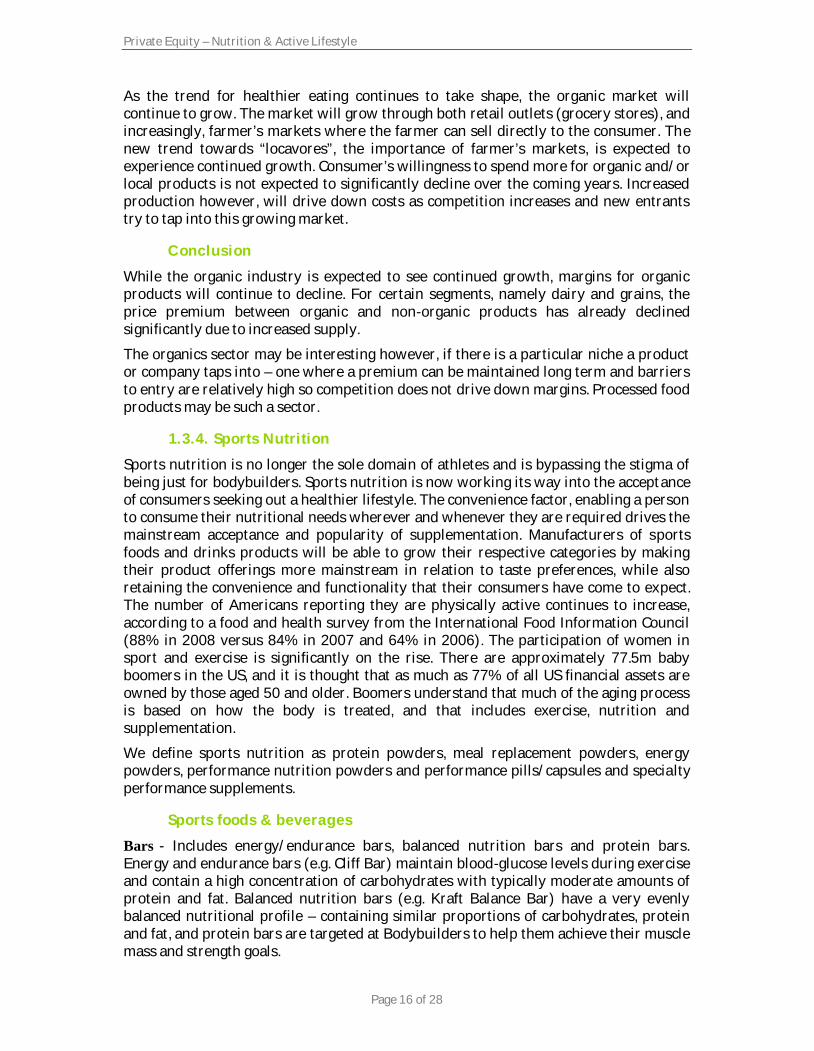
As the trend for healthier eating continues to take shape, the organic market willcontinue to grow. The market will grow through both retail outlets (grocery stores), andincreasingly, farmer’s markets where the farmer can sell directly to the consumer. Thenew trend towards “locavores”, the importance of farmer’s markets, is expected toexperience continued growth. Consumer’s willingness to spend more for organic and/orlocal products is not expected to significantly decline over the coming years. Increasedproduction however, will drive down costs as competition increases and new entrantstry to tap into this growing market.ConclusionWhile the organic industry is expected to see continued growth, margins for organicproducts will continue to decline. For certain segments, namely dairy and grains, theprice premium between organic and non-organic products has already declinedsignificantly due to increased supply.The organics sector may be interesting however, if there is a particular niche a productor company taps into – one where a premium can be maintained long term and barriersto entry are relatively high so competition does not drive down margins. Processed foodproducts may be such a sector.1.3.4. Sports NutritionSports nutrition is no longer the sole domain of athletes and is bypassing the stigma ofbeing just for bodybuilders. Sports nutrition is now working its way into the acceptanceof consumers seeking out a healthier lifestyle. The convenience factor, enabling a personto consume their nutritional needs wherever and whenever they are required drives themainstream acceptance and popularity of supplementation. Manufacturers of sportsfoods and drinks products will be able to grow their respective categories by makingtheir product offerings more mainstream in relation to taste preferences, while alsoretaining the convenience and functionality that their consumers have come to expect.The number of Americans reporting they are physically active continues to increase,according to a food and health survey from the International Food Information Council(88% in 2008 versus 84% in 2007 and 64% in 2006). The participation of women insport and exercise is significantly on the rise. There are approximately 77.5m babyboomers in the US, and it is thought that as much as 77% of all US financial assets areowned by those aged 50 and older. Boomers understand that much of the aging processis based on how the body is treated, and that includes exercise, nutrition andsupplementation.We define sports nutrition as protein powders, meal replacement powders, energypowders, performance nutrition powders and performance pills/capsules and specialtyperformance supplements.Sports foods & beverages
Bars - Includes energy/endurance bars, balanced nutrition bars and protein bars.Energy and endurance bars (e.g. Cliff Bar) maintain blood-glucose levels during exerciseand contain a high concentration of carbohydrates with typically moderate amounts ofprotein and fat. Balanced nutrition bars (e.g. Kraft Balance Bar) have a very evenlybalanced nutritional profile – containing similar proportions of carbohydrates, proteinand fat, and protein bars are targeted at Bodybuilders to help them achieve their musclemass and strength goals.

Private Equity – Nutrition & Active Lifestyle
Page 17 of 28
Sports drinks - A sports drink is a non-alcoholic product, which uses scientific analysisto make claims about enhancing physical performance during sporting activity and/orspeeding recovery afterwards. In this context sports drinks are designed specifically todeliver both carbohydrate and fluid rapidly to the body.Gels - Sports gels provide a concentrated dose of carbohydrates in a dense form that caneither be squeezed out of a tube or drunk like a syrup, depending on its viscosity. Gelsare primarily designed for endurance athletes, such as cyclists and runners to replenishand boost energy levels. Examples include Power Gel from Power Bar.
Sports nutrition supplements
Performance enhancers - Performance enhancers promote energy-release from musclesto improve power and strength capacity. Creatine is the most promising of theseproducts with several studies supporting its effectiveness, indeed it is the most highlyrecognized sports nutrition supplement on the market.Muscle builders - Protein and amino-acid formulations that are designed to promoteand/or facilitate muscle-tissue development. Supplementing with additional protein andamino-acids (the building blocks of protein) is believed to encourage greater levels ofmuscle tissue repair. Meal replacement powders (MRP) - Drink or shake-basedsubstitutes for daily whole meals. These products typically have a more balancednutritional profile than weight gainers via less carbohydrate, more protein and typicallyprovide a spectrum of vitamins and minerals and possibly other micro-nutrients.Weight gainers - These are high calorie drinks used to aid or supplement calorific intakeensuring required levels for muscle growth and mass development.Figure 6: Key Sports Nutrition Consumer Groups
Source: Datamonitor – Opportunities and Key Players in Sports Nutrition
Market Size and GrowthRecent data suggests the global sports nutrition market is currently valued at between$27-32bn. Although there is some disagreement on the total market size, there is nodisputing that the US and Europe represent the largest market share.
Private Equity – Nutrition & Active Lifestyle
Page 18 of 28
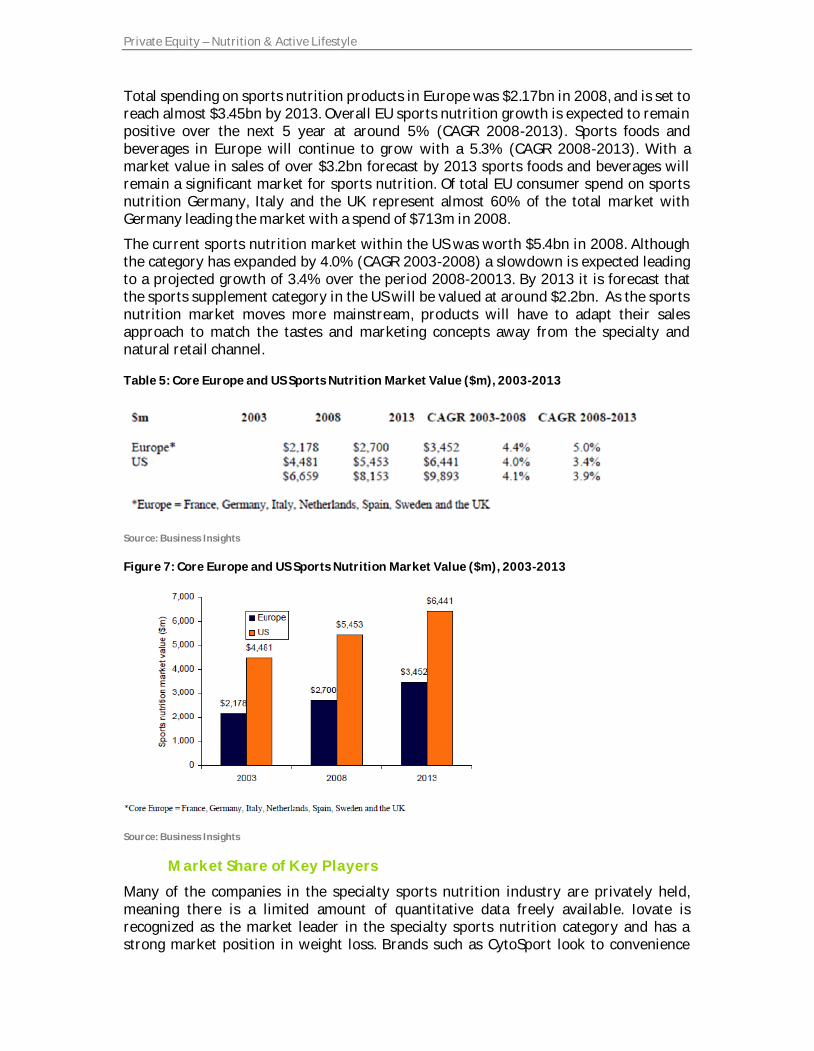
Total spending on sports nutrition products in Europe was $2.17bn in 2008, and is set toreach almost $3.45bn by 2013. Overall EU sports nutrition growth is expected to remainpositive over the next 5 year at around 5% (CAGR 2008-2013). Sports foods andbeverages in Europe will continue to grow with a 5.3% (CAGR 2008-2013). With amarket value in sales of over $3.2bn forecast by 2013 sports foods and beverages willremain a significant market for sports nutrition. Of total EU consumer spend on sportsnutrition Germany, Italy and the UK represent almost 60% of the total market withGermany leading the market with a spend of $713m in 2008.The current sports nutrition market within the US was worth $5.4bn in 2008. Althoughthe category has expanded by 4.0% (CAGR 2003-2008) a slowdown is expected leadingto a projected growth of 3.4% over the period 2008-20013. By 2013 it is forecast thatthe sports supplement category in the US will be valued at around $2.2bn. As the sportsnutrition market moves more mainstream, products will have to adapt their salesapproach to match the tastes and marketing concepts away from the specialty andnatural retail channel.Table 5: Core Europe and US Sports Nutrition Market Value ($m), 2003-2013
Source: Business Insights
Figure 7: Core Europe and US Sports Nutrition Market Value ($m), 2003-2013
Source: Business Insights
Market Share of Key PlayersMany of the companies in the specialty sports nutrition industry are privately held,meaning there is a limited amount of quantitative data freely available. Iovate isrecognized as the market leader in the specialty sports nutrition category and has astrong market position in weight loss. Brands such as CytoSport look to convenience
Private Equity – Nutrition & Active Lifestyle
Page 18 of 28
Total spending on sports nutrition products in Europe was $2.17bn in 2008, and is set toreach almost $3.45bn by 2013. Overall EU sports nutrition growth is expected to remainpositive over the next 5 year at around 5% (CAGR 2008-2013). Sports foods andbeverages in Europe will continue to grow with a 5.3% (CAGR 2008-2013). With amarket value in sales of over $3.2bn forecast by 2013 sports foods and beverages willremain a significant market for sports nutrition. Of total EU consumer spend on sportsnutrition Germany, Italy and the UK represent almost 60% of the total market withGermany leading the market with a spend of $713m in 2008.The current sports nutrition market within the US was worth $5.4bn in 2008. Althoughthe category has expanded by 4.0% (CAGR 2003-2008) a slowdown is expected leadingto a projected growth of 3.4% over the period 2008-20013. By 2013 it is forecast thatthe sports supplement category in the US will be valued at around $2.2bn. As the sportsnutrition market moves more mainstream, products will have to adapt their salesapproach to match the tastes and marketing concepts away from the specialty andnatural retail channel.Table 5: Core Europe and US Sports Nutrition Market Value ($m), 2003-2013
Source: Business Insights
Figure 7: Core Europe and US Sports Nutrition Market Value ($m), 2003-2013
Source: Business Insights
Market Share of Key PlayersMany of the companies in the specialty sports nutrition industry are privately held,meaning there is a limited amount of quantitative data freely available. Iovate isrecognized as the market leader in the specialty sports nutrition category and has astrong market position in weight loss. Brands such as CytoSport look to convenience

Private Equity – Nutrition & Active Lifestyle
Page 19 of 28
options to ensure a deeper penetration of branded products into convenience, food,drug, grocery and specialty retailers nationwide.Future acquisitions and manufacturer-to-brand integration holds promise for brandslooking to strengthen their position, and will change the competitive landscape. Lack ofinnovation and complacency in product development has led to a decline in marketshare and total sales of some previously market leading brands. Brands focus on nichesectors for continued growth and to establish points of differentiation in their productoffering.Key TrendsResponsible sports nutrition companies are now finding an ally in organizations thatoffer drug testing for their supplements prior to being released onto the market.Consumers are looking to become more informed about their purchases and what theyconsume. A nutritional label survey showed more than two thirds of global consumersare reading nutritional panels more than they did a year ago. The category has not yetexperienced a decline as in some other health based sectors, but consumers are makingchanges to their purchasing habits. Sports nutrition consumers are most likely to tradetheir premium purchases for solid nutrition essentials.The current economic downturn in the US is opening the door to strong sales andincreases for private label products in all categories, and high priced sports nutrition isno exception. The improving economies and growth in population in emerging marketssuch as China, Southeast Asia and Latin America are driving increased demand fornutritional products, and in particular sports nutrition products. Innovation drives thesports nutrition category as consumers seek for the holy grail of natural performanceenhancement.New product categories are the lifeblood of the industry and for brands looking to createa point of differentiation in the marketplace. Packaging is a powerful extrinsic attributeto any product, not only in its role for protection but also due to its influence on thebrand image and purchase motivation. This is especially important for brands with lowmarketing budgets. Sports nutrition can become part of the customer’s solution bybecoming a part of their daily ritual, fitting with ease into a consumers consumptionhabits. Brands that can inspire passion and authenticity in their company and customerscan create a strong loyalty effect. Sports nutrition marketers could learn from the foodand pharmaceutical industries whose expertise in positioning and messaging reaps therewards in their sales.

Private Equity – Nutrition & Active Lifestyle
Page 20 of 28
Figure 8: Key Market Drivers
Source: Business Insights
ConclusionThe Sports Nutrition segment is growing at a moderate rate (CAGR of 3.4-5%) with apotential market size in 2013 of $6.4 b and $3.5 b in the United States and the UK,respectively. Segment growth is primarily driven due to shifts in consumer profile andpreferences. As the sports nutrition category continues to evolve niche consumer setsare emerging, and as they do brands must fully understand who their customer really is.As the market continues to grow and mature, key opportunities will continue to emergefor scientifically supported ingredients that can substantiate their claims.1.3.5. Biking Equipment and Accessories
Market SizeBiking Equipment and Accessories is a $5.8 billion industry, including the retail value ofbicycles, related parts, and accessories through all channels of distribution, according toresearch funded by the National Sporting Goods Association19Thereof, bicycles and accessories sales are 84%, cycling apparel is 14% and footwear is2%.Market ShareThe Market is highly fragmented despite the presence of some larger players,particularly chain stores such as The Sports Authority, Champs Sports, Jumbo Sports,Sportmart and Big 5.Bicycles are sold through five main channels of distribution:
19 The NBDA Statpack

Private Equity – Nutrition & Active Lifestyle
Page 21 of 28
Mass merchants (74% volume, 35% value) Specialty retailers (4,200 stores, dominate the parts, accessories and services sales, 17%volume, 50% value) Sporting goods stores (4% volume, 5% value) Outdoor specialty stores (2% volume, 6% value) Online (3% volume, 6% value)
Key trendsWe identified 4 key trends: Fitness is no longer a matter of showing off a nice looking body; rather it is becoming anecessity as the incidence of chronic diseases derived from overweight and obesitycontinue to rise, and consumers turn older20 Although the market is still primarily focused on recreation, cycling for transportation isgrowing and expected to continue to do so. Participation seems to be correlated to oiland gas prices Cycling is often cited as the seventh most popular recreational activity in the U.S., behindexercise walking, swimming, camping, fishing, exercising with equipment and bowling Cycling facilities construction is at an all-time high and both pedestrian and bicyclefacilities have received an increasing level of support from the government in recentyears
Figure 9: Breakdown of Participation by Household Income
Source: NSGA
GrowthThe bicycle industry is a seasonal business that can be impacted by unusual weather, aswell as an industry that relies on discretionary spending impacted by economicconditions. Industry sales of bicycles seem to be stable at around 18 million bicycle unitsannually, plus parts, accessories and service, which historically is a very healthy numberfor the industry.20 Euromonitor international
Private Equity – Nutrition & Active Lifestyle
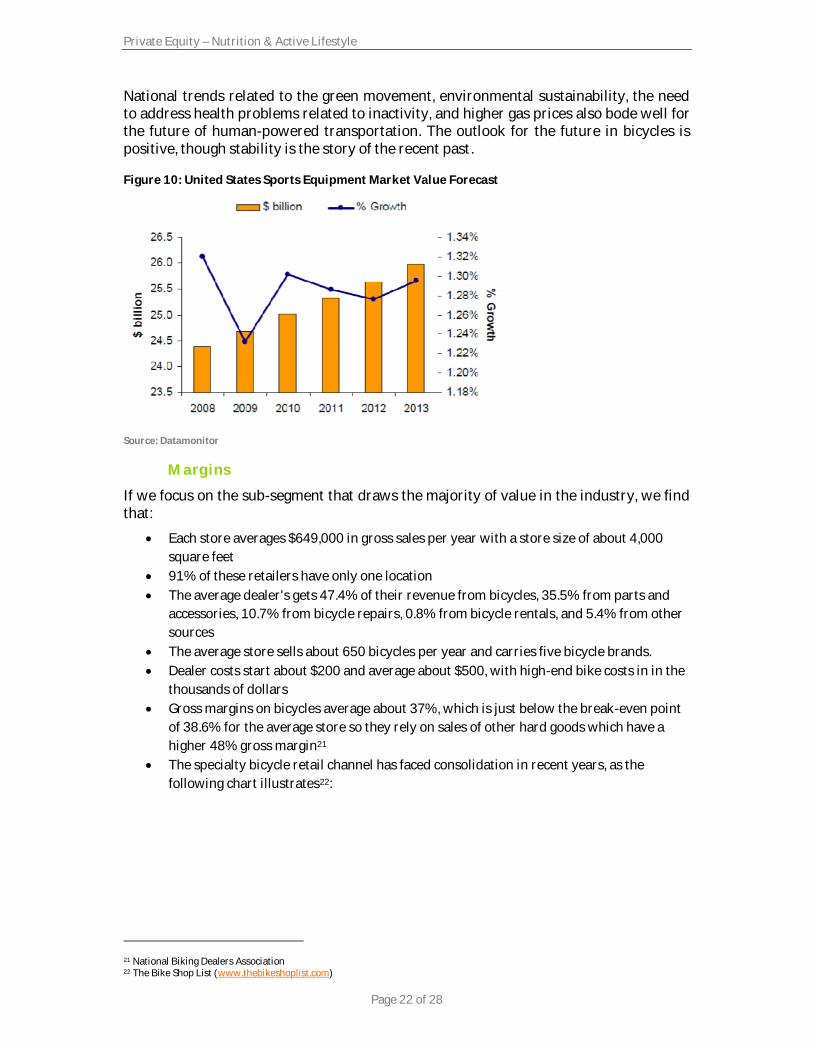
Page 22 of 28
National trends related to the green movement, environmental sustainability, the needto address health problems related to inactivity, and higher gas prices also bode well forthe future of human-powered transportation. The outlook for the future in bicycles ispositive, though stability is the story of the recent past.Figure 10: United States Sports Equipment Market Value Forecast
Source: Datamonitor
MarginsIf we focus on the sub-segment that draws the majority of value in the industry, we findthat: Each store averages $649,000 in gross sales per year with a store size of about 4,000square feet 91% of these retailers have only one location The average dealer's gets 47.4% of their revenue from bicycles, 35.5% from parts andaccessories, 10.7% from bicycle repairs, 0.8% from bicycle rentals, and 5.4% from othersources The average store sells about 650 bicycles per year and carries five bicycle brands. Dealer costs start about $200 and average about $500, with high-end bike costs in in thethousands of dollars Gross margins on bicycles average about 37%, which is just below the break-even pointof 38.6% for the average store so they rely on sales of other hard goods which have ahigher 48% gross margin21 The specialty bicycle retail channel has faced consolidation in recent years, as thefollowing chart illustrates22:
21 National Biking Dealers Association22 The Bike Shop List (www.thebikeshoplist.com)

Private Equity – Nutrition & Active Lifestyle
Page 23 of 28
Figure 11: United States Bicycle Retail Locations
Source: The Bike Shop ListWhile the number of physical stores has clearly declined, specialty bicycle retailers stillsold approximately 3.1 million bicycles in 2008 – a historically healthy number. Thisleads to the conclusion that the stores are becoming larger on average, with similar salesvolume through fewer stores.Porter’s Five ForcesFor this analysis we consider the retailers as players, the buyers as individualconsumers, and manufacturers as the key suppliers.The three main forces present in the industry are:
Competitiono Number of playerso Competitor size
Substituteso Low-cost switchingo Cheap alternative
Supplier powero Forward integrationo Player independence
ConclusionThe size of the biking equipment/accessories industry is considerable and so are thenumber of products and participants. Demand is expected to rise as both, recreationaland transport users find a better alternative in cycling.The sub-segments that are the most notorious for the consumers’ awareness are themass merchants and the chain stores. However, in terms of our investment criteria, themost attractive sub-segment would be the specialty retailers. With around 4,200 storesin the North American region, it dominates the parts, accessories and services sales, thuscapturing up to 50% of the market’s transactions in value with only 17% of the volume.Nevertheless, specialty stores are usually small shops that bring together propermaterials, technical labor and a local brand that becomes intimate with the customers.
Private Equity – Nutrition & Active Lifestyle
Page 24 of 28
Prices of bikes and accessories are relatively high yet the resulting margins are quiteunattractive.The segment has seen an important amount of consolidation in the past years but wethink there is room for more. Additionally, the size of the stores seems to be increasingwhich confirms the hypothesis of owners and investors seeking to increase the chanceto obtain more attractive margins. We believe that the segment is most suitable forinvestments that have a broader set of criteria.1.4. Selection of Most Attractive SegmentsBased on the results of the segment research listed above, we decided to select threesegments for further analysis:
Food Allergy/Food Intolerance Organics Sports NutritionFor these segments, we identified M&A and private equity deals in the previous years,created long lists of potentially attractive investment opportunities and developedspecific investment recommendations for three companies in each segment. The resultscan be found in the following three chapters.
2. Deal Activity in Previous Years
2.1. Food Allergy/Food Intolerance
2.1.1. Level of ActivityThe general level of activity in mergers and acquisitions and buyout deals in the FoodAllergy/Food Intolerance segment is low. Most companies that operate in this segment –either as producer or as distributor – are small- to medium-sized companies andtypically do not own sufficient resources for M&A. On the other end of the spectrum,there are brands being owned by large food multinationals like Nestlé, Heinz, Arla Foods,or the Dean Foods Company. These companies typically hold allergy/intolerance brandsas part of their brand portfolio, and there was little activity in acquisition or sale of thesebrand assets in recent years.A noteworthy exception is the Italian food producer and distributor Dr Schär (also seechapter Error! Reference source not found.). As part of their growth strategy, theyacquired a couple of allergy/nutrition brands from larger companies that wanted todivest this segment. As a production company, Dr Schär presumably is able to realizesynergies through economies of scale in production of these products.Deals in recent years include: Nutrition Point Ltd./Dietary Specials brand (gluten-free), acquired by Dr Schär in 2002 Royal Numico’s TRUfree business (gluten-free), acquired by Dr Schär in 2007 Royal Numico’s Glutafin business (gluten-free), acquired by Dr Schär in 2007
2.1.2. Size of DealsFor the deals mentioned above, there is unfortunately no information on the deal sizeavailable.

Private Equity – Nutrition & Active Lifestyle
Page 25 of 28
2.1.3. MotivationNutrition products for people suffering under food allergy or food intolerance cannot bebought from conventional food producers. Therefore, there is a need in specializedproduction facilities. Since the total market size – compared to conventional food – israther small, there is still large potential in economies of scale achieved by pooling theproduction process for multiple brands. On the buy side, this is one major driver of M&Aactivity.On the other hand, with an increasing number of companies specializing on the FoodAllergy/Food Intolerance segment, conventional food conglomerates are facingincreasing competition. Some companies acknowledge the strategic advantage of thosenew competitors, decide to drop out of these segments and are selling their specializedbrands. On the sell side, this is one major driver of M&A activity.2.2. Organics
2.2.1. Level of ActivitySince January of 2011 roughly 12 deals have been initiated in the organic food industryglobally. The General Mills acquisition of Yoplait is most probably one of the biggertransactions occurring with a total valuation of Yoplait SA France of roughly 1.6BillionEuros. Other interesting transaction included the acquisition of 68% stake of ShawWallace (a German company manufacturing food products) by Renuka HoldingCompany. This transaction was announced in March 2011.Some other acquisitions included the following deals: Mach One Corporation, a producer of animal care products, acquired Ceres OrganicHarvest, Inc., a provider of organic ingredients, commodities, and custom services to theorganic food industry. Both the companies are based in the US. Mach One acquired100% of the stock of Ceres Organic for $8 million in a combination of stock andconvertible debentures. Sycamore Ventures, Inc. acquired Whole in One Products, Inc. (Whole in one Organics,Ltd.), a food nutrition company. Both the companies are based in the US. Following thisacquisition, Sycamore Ventures will, through the Whole in One Products brand, developand market nutritional, personal care, and education based products. SAMBAZON, a US-based producer and seller of acai food and beverages securedinvestment in a funding round led by Verlinvest S.A. with participation by BradmerFoods and RSF Social Finance. Partnership Capital Growth was the advisor on the deal. Strube GmbH & Co., KG, a Germany-based family business specializing in plant breedingfor the agriculture, signed an agreement to acquire Maribo Seed Espana S.A.U., a Spanishproducer of sunflower seed, from Nordic Sugar A/S. Whole Foods Market, Inc., announced on November 2008 an agreement to sell Series APreferred Stock due 2020 to Green Equity Investors V, L.P., an affiliate of Leonard Green& Partners, L.P. for $425 million. This amount equates to an ownership interest,assuming conversion of the preferred stock to common stock, of approximately 17% atthis time.
Private Equity – Nutrition & Active Lifestyle
Page 26 of 28
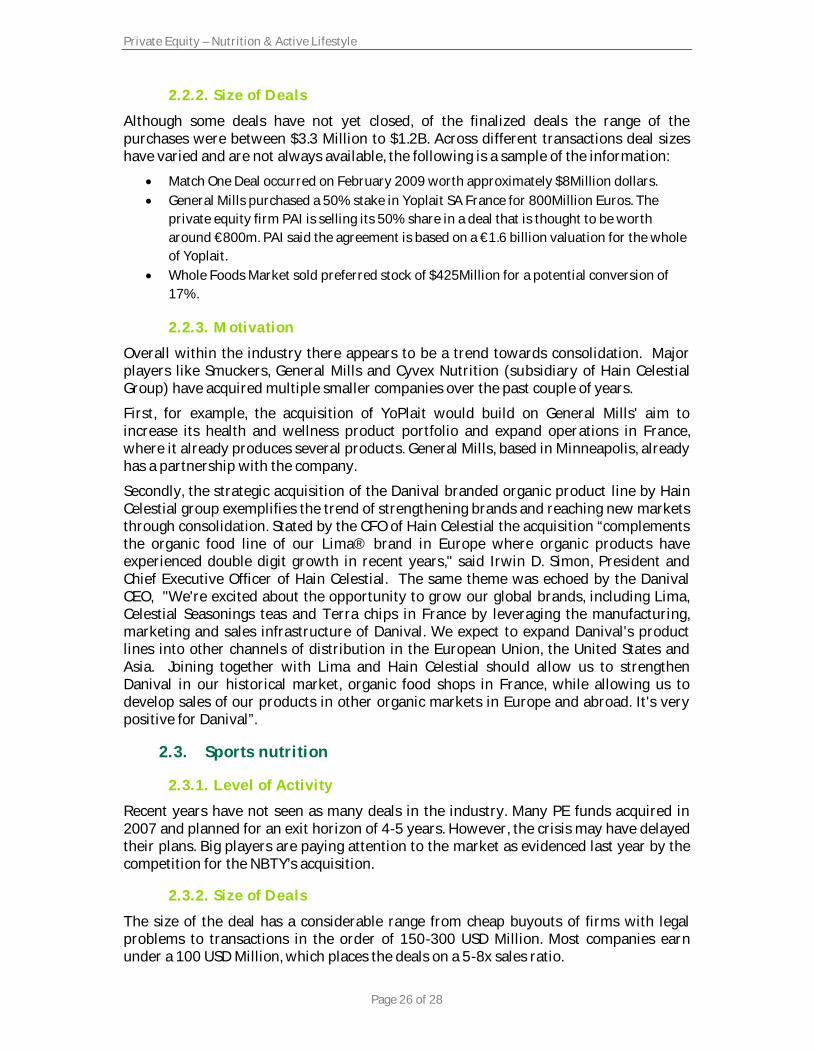
2.2.2. Size of DealsAlthough some deals have not yet closed, of the finalized deals the range of thepurchases were between $3.3 Million to $1.2B. Across different transactions deal sizeshave varied and are not always available, the following is a sample of the information: Match One Deal occurred on February 2009 worth approximately $8Million dollars. General Mills purchased a 50% stake in Yoplait SA France for 800Million Euros. Theprivate equity firm PAI is selling its 50% share in a deal that is thought to be wortharound €800m. PAI said the agreement is based on a €1.6 billion valuation for the wholeof Yoplait. Whole Foods Market sold preferred stock of $425Million for a potential conversion of17%.
2.2.3. MotivationOverall within the industry there appears to be a trend towards consolidation. Majorplayers like Smuckers, General Mills and Cyvex Nutrition (subsidiary of Hain CelestialGroup) have acquired multiple smaller companies over the past couple of years.First, for example, the acquisition of YoPlait would build on General Mills' aim toincrease its health and wellness product portfolio and expand operations in France,where it already produces several products. General Mills, based in Minneapolis, alreadyhas a partnership with the company.Secondly, the strategic acquisition of the Danival branded organic product line by HainCelestial group exemplifies the trend of strengthening brands and reaching new marketsthrough consolidation. Stated by the CFO of Hain Celestial the acquisition “complementsthe organic food line of our Lima® brand in Europe where organic products haveexperienced double digit growth in recent years," said Irwin D. Simon, President andChief Executive Officer of Hain Celestial. The same theme was echoed by the DanivalCEO, "We're excited about the opportunity to grow our global brands, including Lima,Celestial Seasonings teas and Terra chips in France by leveraging the manufacturing,marketing and sales infrastructure of Danival. We expect to expand Danival's productlines into other channels of distribution in the European Union, the United States andAsia. Joining together with Lima and Hain Celestial should allow us to strengthenDanival in our historical market, organic food shops in France, while allowing us todevelop sales of our products in other organic markets in Europe and abroad. It's verypositive for Danival”.2.3. Sports nutrition
2.3.1. Level of ActivityRecent years have not seen as many deals in the industry. Many PE funds acquired in2007 and planned for an exit horizon of 4-5 years. However, the crisis may have delayedtheir plans. Big players are paying attention to the market as evidenced last year by thecompetition for the NBTY’s acquisition.2.3.2. Size of DealsThe size of the deal has a considerable range from cheap buyouts of firms with legalproblems to transactions in the order of 150-300 USD Million. Most companies earnunder a 100 USD Million, which places the deals on a 5-8x sales ratio.

Private Equity – Nutrition & Active Lifestyle
Page 27 of 28
2.3.3. MotivationThe segment is mostly driven by innovation, marketing and distribution capabilities.Online sales are rapidly absorbing market share. Players that enjoy a strong brandequity and proven innovation record had been targeted already as consumers seem tobe loyal to their chosen products.Another motivation behind acquisitions is vertical integration as distributionrequirements are high for these kinds of products.Finally, consumers have grown conscious about the importance of getting informed andlook for the ability of providers to substantiate their claims. This brings moreimportance to the alliances that firms within the segment can create with organizationsthat can test and verify their products. This trend also seems to attract investors.
Private Equity – Nutrition & Active Lifestyle
Page 28 of 28
References
Global Functional Drinks. DataMonitor. April 2010 – Reference code: 0199-2285 Global Organic Food. DataMonitor. November 2010 – Reference code: 0199-2283 Key Players and Innovative Start-Ups in Nutraceuticals – Emerging strategies iningredients, pharma, food and drinks. Dr. Cheryl L Barton. 2009 NPD in Children’s Nutrition. DataMonitor. May 2010 – Mark J. Tallon Probiotics and Prebiotics in Clinical Nutrition. DataMonitor. April 2011 The Infant Nutrition Market in the EU. DataMonitor. August 2009 Opportunities and Key Players in Sports Nutrition – Emerging ingredients, key trendsand market forecasts. Mark J. Tallon and James O’Byrne. 2009 Global Health and Wellness: Powerful Nutrition 2009 and Beyond. EuroMonitorInternational. July 2009 Consumer Products – Health, Wellness and Lifestyle – Canaccord Genuity – March 2011 Health and Wellness – United Kingdom Dietary Supplements Regulatory and Market Outlook: Growth Opportunities in Europeand the US and market forecasts to 2015. January 2011 - Reference code: BI00044-001 Capital IQ database Food Intolerance – Germany, Euromonitor International: Country Sector Briefing, August2010 Food Allergy: An Overview, National Institute of Allergy and Infectious Diseases, U.S.DEPARTMENT OF HEALTH AND HUMAN SERVICES Global Market for Food Intolerance Products: At War With Our Food, EuromonitorInternational: Strategy Briefing, April 2009 Bicycle retailer and industry news. NBDA Publication, July 2010 Sports Equipment in the United States: Industry profile, Datamonitor, September 2009 Global Sports Equipment: Industry profile, Datamonitor, May 2010