equity, health & active transportation - downtown …€¦ · equity, health & active...
TRANSCRIPT

Equity, Health & Active Transportation Downtown: On the Go! Friday Forum
April 17, 2015
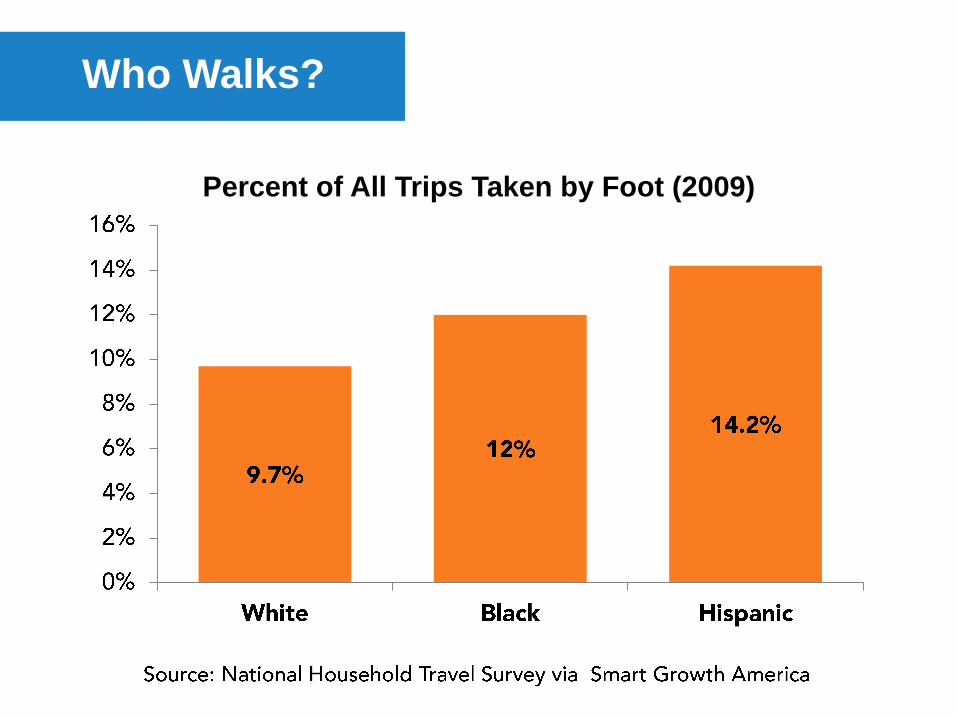
Who Walks?
Percent of All Trips Taken by Foot (2009)

13.3% of Students Walk
to School
More Affluent Schools <20% of Students Enrolled in Free Lunch Program
Less Affluent Schools >80% of Students Enrolled in Free Lunch Program
54.9% of Students Walk
to School

Who Bikes?

Percent of All Bike Trips Taken by Income
(2009)
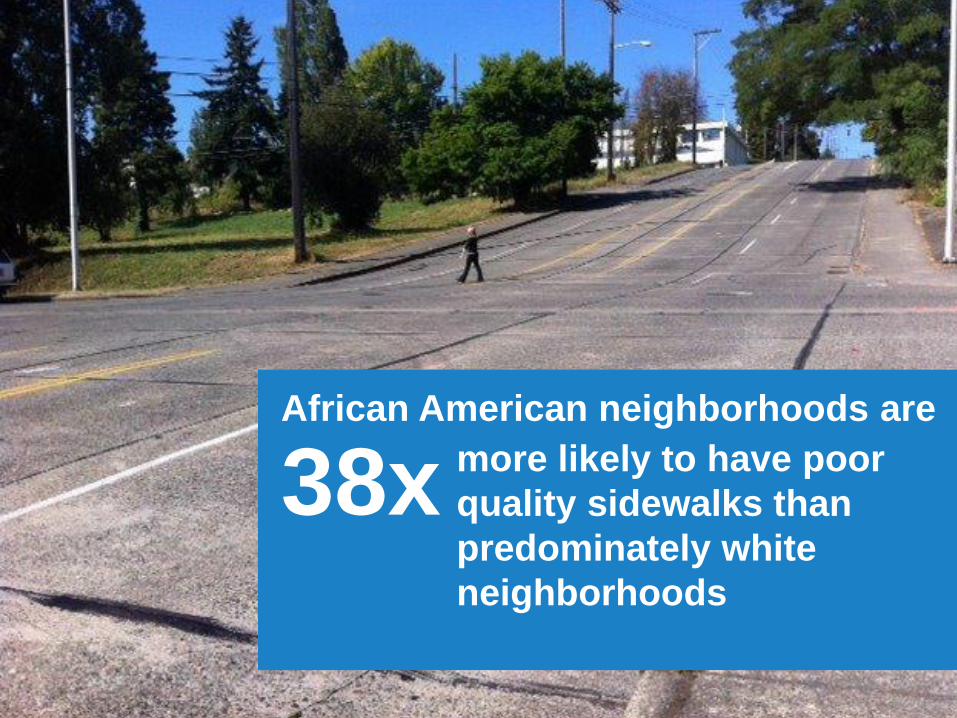
African American neighborhoods are
38x more likely to have poor
quality sidewalks than
predominately white
neighborhoods

57% of
neighborhoods with a
1% poverty level
have bike paths or
bike lanes
57% of
neighborhoods
with a 1%
poverty level
have bike paths
or bike lanes 9% of
neighborhoods with a
10% poverty level
have bike paths or
bike lanes


In Fort Lauderdale,
87% of people cited
for lack of bicycle
registration are
African American
The community is
just 31% African
American

2x as many drivers fail to
yield to black pedestrians
than white pedestrians

The Fatality Rate for Bicyclists is
23% 30%
The Fatality Rate for Pedestrians is
60% 43% 254%


A Call to Action
1
2
3

Liz Kaster
Active Transportation COI Manager
Puyallup Watershed Initiative
www.pwi.org

Sources
1. Photo: Downtown to Defiance. Photo by Russ Carmack via Tacoma Mobility. 2. Data: National Household Travel Survey via Smart Growth America. “Dangerous by Design 2014.” May 2014. http://www.smartgrowthamerica.org/documents/dangerous-by-design-2014/dangerous-by-design-2014.pdf. 3. Data: Su, Jason G., Michael Jerrett, Rob McConnell, Kiros Berhane, Genevieve Dunton, Ketan Shankardass, Kim Reynolds, Roger Chang, and Jennifer Wolch. "Factors influencing whether children walk to school." Health & place 22 (2013): 153-161. Photo: Dan Burden/Pedestrian and Bicycle Information Center 4. Charts: League of American Bicyclists. “The New Majority: Pedaling Towards Equity. ” (2013). http://bikeleague.org/sites/default/files/equity_report.pdf 5. Data: Pucher, John R., and Ralph Buehler. “Analysis of bicycling trends and policies in large North American cities: Lessons for New York..” University Transportation Research Center Region 2, 2011. 6. Data: Kelly, Cheryl M., Mario Schootman, Elizabeth A. Baker, Ellen K. Barnidge, and Amanda Lemes. "The association of sidewalk walkability and physical disorder with area-level race and poverty." Journal of epidemiology and community health 61, no. 11 (2007): 978-983. Photo: 19th and Fawcett. Tacoma Mobility. 7. Data: Powell, Lisa M., Sandy Slater, and Frank J. Chaloupka. "The relationship between community physical activity settings and race, ethnicity and socioeconomic status." Evidence-Based Preventive Medicine 1, no. 2 (2004): 135-44. Photo: Downtown to Defiance. Photo by Russ Carmack via Tacoma Mobility.

Sources
8. Photo: "Biking Thru Tacoma" by Scott Hingst. CC BY 2.0. flickr.com/photos/shingst/5086929203 Logo: Black Lives Matter. Blacklivesmatter.com
9. Data: Swenson, Kyle. “Fort Lauderdale Cops are still Arresting Dozens for Biking While Black. “The New Times. January 8, 2015. http://www.miaminewtimes.com/news/fort-lauderdale-cops-are-still-arresting-dozens-for-biking-while-black-6520544. Photo: Downtown to Defiance. Photo by Russ Carmack via Tacoma Mobility.
10. Data: Goddard, Tara, Kimberly Barsamian Kahn, and Arlie Adkins. "Racial Bias in Driver Yielding Behavior at Crosswalks." (2014). trec.pdx.edu/research/project/733 Photo: Dan Burden/Pedestrian and Bicycle Information Center
11. Pedestrian Data: League of American Bicyclists. “The New Majority: Pedaling Towards Equity. ” (2013). http://bikeleague.org/sites/default/files/equity_report.pdf
Bicycling Data: Smart Growth America. “Dangerous by Design 2014.” May 2014. http://www.smartgrowthamerica.org/documents/dangerous-by-design-2014/dangerous-by-design-2014.pdf.
12. Photos (clockwise from top left): SRTS. Tacoma Mobility // Downtown to Defiance. Photo by Russ Carmack via Tacoma Mobility. // Photo by Sammich. CC BY-NC-SA 2.0. https://www.flickr.com/photos/sammich/5002656781 // Metro Parks Swan Creek Park Evergreen Mountain Bike work party by Comcast Washington State. CC BY 2.0 https://flic.kr/p/eftD8D// Downtown to Defiance. Photo by Russ Carmack via Tacoma Mobility.
