private education is good for - cato institute · private education is good for the poor a study of...
TRANSCRIPT


PRIVATE EDUCATION
IS GOOD FOR THE POOR
A Study of Private Schools Serving the Poor in Low-Income Countries
JAMES TOOLEY& PAULINE DIXON

Copyright © 2005 by the Cato Institute.All rights reserved.
Cover Design by Jon Meyers.
Printed in the United States of America.
CATO INSTITUTE1000 Massachusetts Ave., N.W.
Washington, D.C. 20001www.cato.org
ContentsACKNOWLEDGMENTS............................................................................................................................................................vii
EXECUTIVE SUMMARY............................................................................................................................................................1
INTRODUCTION .......................................................................................................................................................................3
OVERVIEW OF RESEARCH........................................................................................................................................................5
1. WHAT ARE THE NATURE AND EXTENT OF PRIVATE EDUCATION FOR THE POOR? ................................................................7
2. HOW DID FREE PRIMARY EDUCATION IMPACT ENROLLMENT? .........................................................................................19
3. HOW DO PRIVATE AND STATE SCHOOLS COMPARE?.........................................................................................................23
4. HOW WELL DO CHILDREN ACHIEVE? .............................................................................................................................29
5. HOW WELL ARE PRIVATE SCHOOLS FUNDED, AND DO ALL PUPILS PAY FEES? .................................................................37
CONCLUSIONS AND IMPLICATIONS .........................................................................................................................................43
NOTES ..................................................................................................................................................................................47
ABOUT THE AUTHORS...........................................................................................................................................................51


List of Tables TABLE 1.1 NUMBER AND PROPORTION OF SCHOOLS, BY SCHOOL TYPE..................................................................................................8TABLE 1.2 NUMBER AND PROPORTION OF PUPIL ENROLLMENT, BY SCHOOL TYPE ...............................................................................10TABLE 1.3 GENDER OF PUPILS, BY SCHOOL TYPE................................................................................................................................11TABLE 1.4 HYDERABAD, INDIA—OFFICIAL AND ESTIMATED OUT-OF-SCHOOL CHILDREN ....................................................................12TABLE 1.5 LAGOS STATE, NIGERIA—OFFICIAL AND ESTIMATED OUT-OF-PRIMARY-SCHOOL CHILDREN ...............................................13TABLE 1.6 PUPIL-TEACHER RATIOS, BY SCHOOL TYPE ........................................................................................................................13TABLE 1.7 AVERAGE DATE OF ESTABLISHMENT OF SCHOOLS, BY SCHOOL TYPE..................................................................................16TABLE 1.8 MANAGEMENT OF PRIVATE SCHOOLS (%)...........................................................................................................................17TABLE 2.1 KIBERA’S NET DECLINE IN PRIVATE SCHOOL ENROLLMENT................................................................................................19TABLE 2.2 NET INCREASE/DECREASE IN ENROLLMENT IN KIBERA SINCE THE INTRODUCTION OF FREE PUBLIC EDUCATION IN 2003 ...21TABLE 3.1 TEACHER ACTIVITY OF GRADE 4/5 TEACHER, BY PERCENT IN EACH SCHOOL TYPE, IN THREE SURVEYS ...........................23TABLE 3.2 AVAILABILITY OF DRINKING WATER, BY PERCENT IN EACH SCHOOL TYPE, IN THREE SURVEYS..........................................24TABLE 3.3 AVAILABILITY OF BLACKBOARDS, BY PERCENT IN EACH SCHOOL TYPE, IN THREE SURVEYS ..............................................25TABLE 3.4 AVAILABILITY OF DESKS IN EVERY CLASSROOM (%)..........................................................................................................25TABLE 3.5 AVAILABILITY OF CHAIRS IN EVERY CLASSROOM (%) ........................................................................................................25TABLE 3.6 AVAILABILITY OF FANS IN EVERY CLASSROOM (%)............................................................................................................26TABLE 3.7 AVAILABILITY OF TAPE RECORDERS IN THE SCHOOL (%)....................................................................................................26TABLE 3.8 AVAILABILITY OF ELECTRIC LIGHT IN EVERY CLASSROOM (%) ..........................................................................................26TABLE 3.9 AVAILABILITY OF OWN PLAYGROUND (%)..........................................................................................................................27TABLE 3.10 AVAILABILITY OF TOILETS FOR CHILDREN (%) ...................................................................................................................27TABLE 3.11 AVAILABILITY OF A LIBRARY FOR CHILDREN (%) ...............................................................................................................27TABLE 3.12 AVAILABILITY OF COMPUTERS FOR CHILDREN (%) .............................................................................................................28TABLE 3.13 AVAILABILITY OF TELEVISION AND/OR VIDEO FOR CHILDREN (%) ......................................................................................28TABLE 4.1 SCHOOLS IN STRATIFIED RANDOM SAMPLES, BY SCHOOL TYPE..........................................................................................29TABLE 4.2 HYDERABAD, INDIA—RAW SCORES ...................................................................................................................................31TABLE 4.3 HYDERABAD, INDIA—STANDARDIZED SCORES ...................................................................................................................32TABLE 4.4 GA, GHANA—RAW SCORES ...............................................................................................................................................32TABLE 4.5 GA, GHANA—STANDARDIZED SCORES...............................................................................................................................33TABLE 4.6 LAGOS STATE, NIGERIA—RAW SCORES..............................................................................................................................33TABLE 4.7 LAGOS STATE, NIGERIA—STANDARDIZED SCORES .............................................................................................................34TABLE 4.8 NAIROBI, KENYA—RAW SCORES........................................................................................................................................34TABLE 4.9 NAIROBI, KENYA—STANDARDIZED SCORES .......................................................................................................................35TABLE 5.1 AVERAGE MONTHLY TEACHER SALARIES, BY SCHOOL TYPE ..............................................................................................37TABLE 5.2 NAIROBI, KENYA—AVERAGE MONTHLY TEACHER SALARIES IN STRATIFIED RANDOM SCHOOLS ........................................39TABLE 5.3 TEACHER SATISFACTION WITH SALARY (%)........................................................................................................................40
List of FiguresFIGURE 1.1 PROPORTION OF SCHOOLS, BY SCHOOL TYPE........................................................................................................................9FIGURE 1.2 HYDERABAD, INDIA—OFFICIAL VERSUS ACTUAL ENROLLMENT FIGURES ...........................................................................12FIGURE 1.3 HYDERABAD, INDIA—AVERAGE MONTHLY FEES FOR PRIVATE UNAIDED RECOGNIZED AND UNRECOGNIZED SCHOOLS ($ U.S.) ...14FIGURE 1.4 GA, GHANA—AVERAGE TERM FEES FOR PRIVATE UNAIDED REGISTERED AND PRIVATE UNREGISTERED SCHOOLS .............15FIGURE 1.5 LAGOS STATE, NIGERIA—AVERAGE TERM FEES FOR PRIVATE UNAIDED REGISTERED AND PRIVATE UNREGISTERED SCHOOLS.......15FIGURE 5.1 HYDERABAD, INDIA—AVERAGE MONTHLY TEACHER SALARIES.........................................................................................38FIGURE 5.2 GA, GHANA—AVERAGE MONTHLY TEACHER SALARIES.....................................................................................................38FIGURE 5.3 LAGOS STATE, NIGERIA—AVERAGE MONTHLY TEACHER SALARIES ...................................................................................39FIGURE 5.4 HYDERABAD, INDIA—FREE AND CONCESSIONARY SEATS IN PRIVATE UNAIDED SCHOOLS ..................................................41


We wish to thank the John Templeton Foundation, the Thomas B. FordhamFoundation, and the Goodrich Foundation for their support of this research. Deepgratitude is also extended to all of the school managers, teachers, pupils, and parents
who took part in the research. Thanks also to the team leaders in each country—Dr. OlanrewajuOlaniyan (University of Ibadan, Nigeria), Thompson Ayodele (Institute of Public Policy Analysis,Nigeria), Dr. Isaac Amuah (University of Cape Coast, Ghana), James Shikwati (Inter-RegionEconomic Network, Kenya), and S. V. Gomathi (Educare Trust, Hyderabad). Additional Kenyanresearch was conducted by James Stanfield (University of Newcastle) and George Mikwa (KenyaNon-formal Schools Association). Statistical inputs were provided by Andrew Hunt (Universityof Durham).
Acknowledgments
vii


Many observers believe that the privatesector has very little to offer in termsof reaching the United Nations Mil-
lennium Development Goal of “education forall” by 2015. Private education is often assumedto be concerned only with serving the elite ormiddle classes, not the poor. And unregisteredor unrecognized private schools are thought tobe of the lowest quality and hence demandingof detailed regulation, or even closure, by gov-ernmental authorities.
Our findings from a two-year in-depthstudy in India, Ghana, Nigeria, and Kenyasuggest that these conclusions are unwar-ranted. Private schools, we argue, can play—indeed, already are playing—an important, ifunsung, role in reaching the poor and satis-fying their educational needs.
The first component of our research con-sisted of a systematic census and survey of allprimary and secondary schools, governmentand private, in selected low-income areas. Thesecond component examined a stratified ran-dom sample of between 2,000 and 4,000 chil-dren from each of those areas. Tests in mathe-matics, English, and (in Africa) one other sub-ject were administered. Children and teacherswere also tested for their IQ, and questionnaireswere administered to students, parents, teach-ers, and school managers or headteachers.
In each area, we found the majority ofschoolchildren attending private schools. Inthe areas officially designated as “slums” ofthree zones of Hyderabad’s Old City, wefound 918 schools, of which only 35 percentwere government schools, fewer than the 37percent of unrecognized private schools. Intotal, 65 percent of schoolchildren in thoselow-income areas attended private unaidedschool. In the Ga District of Ghana (the low-income suburban and rural area surround-ing the capital city of Accra) we investigated779 schools in the same way, finding thatonly 25 percent were government schools
and that 64 percent of schoolchildren attend-ed private school.
In the “poor” areas of three local govern-ment districts (one rural, two urban) of LagosState, Nigeria, we found 540 schools, of which34 percent were government, and the largestproportion, 43 percent, were private unregis-tered. An estimated 75 percent of schoolchil-dren were enrolled in private schools.
We also conducted research in the smallshanty town of Makoko, in Mainland, LagosState, and in the slum of Kibera, Nairobi,Kenya (reportedly the largest slum in sub-Saharan Africa). In both cases, the largemajority of poor children attended private,not public, school. Moreover, in Kenya wewere able to observe the impact of free pri-mary education on enrollment. Despite thefact that huge increases in enrollment havebeen noted in government schools by com-mentators, our research suggests that, atbest, children appear to have transferredfrom private to government schools. Giventhe advantages of private schools and prob-lems found in government schools, that maynot be to their advantage.
In each location, the private schools are runlargely by proprietors, with very few receivingoutside philanthropic support and nonereceiving state funding. Roughly equal num-bers of boys and girls attend private unaidedschools, which have better pupil-teacherratios, higher teacher commitment, and some-times better facilities than governmentschools. A significant number of places in pri-vate unaided schools are provided free or atreduced rates to serve the poorest of the poor.
The raw scores from our student achieve-ment tests show considerably higher achieve-ment in the private than in government schools.In Hyderabad, for instance, mean scores inmathematics were about 22 percentage pointsand 23 percentage points higher in privateunrecognized and recognized schools, respec-
1
Executive Summary

tively, than in government schools. The advan-tage was even more pronounced for English. Inall cases, this achievement advantage wasobtained at between half and a quarter of theteacher salary costs.
Our research indicates that a great successstory is taking place, usually beneath the gov-ernment’s radar. The mushrooming privateschools, if noticed at all by the authorities anddevelopment experts, are assumed to be educa-tionally inadequate. Our research shows thatthis assumption is false. Moreover, because somany children are in unrecognized privateschools that do not appear in government sta-tistics, achieving universal basic education—the United Nations Millennium Development
Goal of “education for all”—may be much eas-ier to reach than is currently believed. In LagosState, for instance, including enrollment in pri-vate unregistered schools would reduce thepercentage of out-of-school children from 50to 26 percent.
Certainly, the private schools for low-income families could be improved even fur-ther by creating revolving loan programs tohelp infrastructural investment or, followingthe private schools’ own example, creatingtargeted voucher programs to enable thepoorest of the poor to attend private schools.But above all, the existence and the contribu-tion of private schools to “education for all”is a cause for celebration.
2
Can private education help meet theeducational needs of poor children inlow-income countries? To some
observers, this question may seem strange.Private education is most often perceived to befor the elite and middle classes, not the poor.However, there is a growing body of evidencethat challenges that conception.
The Oxfam Education Report (the handbookof the major international aid agency, OxfamInternational), for instance, reports that “thenotion that private schools are servicing theneeds of a small minority of wealthy parents ismisplaced,” and that “a lower cost private sec-tor has emerged to meet the demands of poorhouseholds.”1 Research in Haryana, India,found that private unrecognized schools “areoperating practically in every locality of theurban centers as well as in rural areas” oftenlocated adjacent to a government school.2
Reporting on evidence from the Indian statesof Haryana, Uttar Pradesh, and Rajasthan,researchers noted that “private schools havebeen expanding rapidly in recent years” andthat they “now include a large number of pri-mary schools which charge low fees,” in urbanas well as rural areas.3 Serving the poor ofCalcutta, there has been a “mushrooming ofprivately managed unregulated pre-primaryand primary schools.”4
In Uganda and Malawi, private schoolshave “mushroomed due to the poor qualitygovernment primary schools,”5 and in Kenya“the deteriorating quality of public educa-tion . . . created demand for private alterna-tives.”6 In sub-Saharan Africa and Asia gener-ally, “the poor and declining quality of publiceducation has led to growing numbers ofparents sending their children to non-stateschools” and in south Asia “this amounts toa mass exodus.”7
In India and Africa, private schools forlow-income families seem to be flourishing.Why do poor parents send their children to
private unaided schools when governmentschooling is available, usually free of charge?Several reasons have been given to explainthis mushrooming of the private school sec-tor. Those reasons include the deteriorationof government schools, the lack of govern-ment schools, and (in India) the desire of par-ents for instruction in English.
Researchers reporting on private and pub-lic schools in northern Indian states describethe “malfunctioning” of public schools forlow-income families.8 The schools sufferedfrom poor physical facilities and high pupil-teacher ratios, but what is most disturbing isthe low level of teaching activity taking place.When the researchers called unannouncedon a randomly selected sample of schools,they found “teaching activity” going on inonly half of the schools. In fully 33 percent,the headteacher was absent. Significantly, thelow level of teaching activity “has become away of life in the profession.”9
These problems, the researchers note, werenot found in the private schools serving poorand low-income families. In the great majorityof those schools there “was feverish classroomactivity.” So much so that the majority of par-ents reported that “if the costs of sending achild to a government and private school werethe same, they would rather send their chil-dren to a private school.”10 The deteriorationof government school standards has beenattributed to the lack of teacher accountabili-ty, strong unions (which contribute to teachercomplacency and lack of motivation to teach),poor facilities, high pupil-teacher ratios, andpoor management.11
Furthermore, in a number of countries,public schools have limited spaces because gov-ernment spending has not kept up with anincrease in the number of school-aged children.In Nigeria “the inadequacy of the infrastructur-al facilities to cope with the very rapid rate ofexpansion in student enrollment is a major
3
Introduction
source of crisis in the education system.” In the1990s “very few new classrooms were built toaccommodate the extra three million pupils.”12
In Tanzania “as in many low-income countries,excess demand was sufficient to stimulate thegrowth of a large private education sector.”13
Finally, the demand for private schools hasincreased in India because private schools often,ostensibly at least, provide instruction inEnglish, which parents regard as desirable. Inmost government schools, lessons are taught inthe State language, and English doesn’t becomea subject until approximately the fifth grade.14
But are parents correct in their belief thatprivate schools are superior to governmentschools? According to two studies, the evidencefrom Africa is mixed, with one study showinghigher academic achievement for privateschools15 and another showing lower achieve-ment.16 However, neither study looked specifi-cally at private schools serving low-incomefamilies. Several studies have compared the rel-ative performance of private unaided, privateaided, and government schools in India—butagain none has specifically looked at schoolsfor the poor, and all appear to have consideredonly recognized private schools.17 A study inurban Lucknow, Uttar Pradesh, found that,after controlling for background variables, stu-dents in private unaided schools scored higheron standardized tests in mathematics than didchildren in the other school types. When thecost per unit gain in achievement was comput-ed, private unaided schools showed higherachievement results for less than half the costof government schools.18 Similarly, a study inTamil Nadu found that students in privateunaided high schools performed better thanthose in government schools in English andmathematics.19 Children attending privateunaided schools in Madhya Pradesh outper-formed children attending governmentschools in math and Hindi: “management-type—government or private—emerges as themost significant factor influencing learnerachievement.”20
However, until now the quality of privateschools serving low-income families has beenunknown, because no quantitative research
has been carried out in private schools in low-income areas. It has simply been assumedthat the quality of the unrecognized privateunaided schools that are serving the pooracross Africa and Asia is low.
The Oxfam Education Report, for instance,notes that although “there is no doubtingthe appalling standard of provision in publiceducation systems,” this does not mean thatprivate education is necessarily better.21 Asfar as private schools for the poor are con-cerned, they are of “inferior quality;” indeedthey “offer a low-quality service” that is sobad it will “restrict children’s future opportu-nities.” The report concludes, “Surprisingly,in view of the confident assertions made insome quarters, there is little hard evidence tosubstantiate the view that private schools sys-tematically outperform public schools withcomparable levels of financial resources.”22
The United Nations Human Development Report2003 makes precisely the same claim.23 Similarclaims of the low quality of the unrecognized pri-vate schools come from other sources, includinga study from Calcutta, which found that: “themushrooming of privately managed unregulat-ed pre-primary and primary schools . . . can haveonly deleterious consequences for the spread ofeducation in general and that among the poor inparticular.”24 The quality of education in privateschools is “often suspect.”25
Significantly, none of these sources offersdetailed evidence for the assertion of lowquality in unrecognized private schools;indeed, the claim is precisely that no quanti-tative evidence is available. Poorer achieve-ment has been assumed, in part because ofthe low-quality infrastructure in the schools,and because such schools often haveuntrained and low-paid teachers. The “unrec-ognized” or “unregistered” schools are unreg-ulated by the state and are perceived to be ofminimal quality. But does being unregulatedmake for lower quality in the schools? Inaddition to answering this important ques-tion, our research examined the exact extentto which private unaided schools serve thepoor and the relative quality of the privateschools compared with government schools.
4

The current research project, which ranfrom April 2003 to June 2005, was alarge international undertaking, with
parallel research going on simultaneously inIndia, Ghana, Nigeria, and Kenya.26 The re-search had two major components. The firstincluded the administration of a Census ofSchools in selected low-income regions and aSurvey of Inputs to these schools. The secondcomponent compared student achievement ina random sample of government and privateschools as well as the financial resources avail-able to both types of schools. This report pre-sents the results of this research under the fol-
lowing headings:
• What Are the Nature and Extent ofPrivate Education for the Poor?
• How Many Schools Are There and WhatProportion Is Private?
• What Is the Proportion of Pupil Enroll-ment in Private Education?
• How Did Free Primary Education ImpactEnrollment?
• How Do Private and State Schools Compare? • How Well Do Children Achieve?• How Well Are Private Schools Funded
and Do All Pupils Pay Fees?
5
Overview of Research


Research Countries and Method
The following section reports theresults of research on private educa-tion in selected low-income areas
within Ghana, Nigeria, Kenya, and India. Allof the chosen countries were rated in thelower half of the Education PerformanceIndex, indicating that those countries arewhere educational needs are not being met bygovernment systems.27 The four countrieswere chosen for a mixture of practical andresearch reasons.
We were particularly interested in Kenya,where free primary (elementary) educationhad just been introduced. Specifically, wewanted to know how the introduction of freepublic education affected private schools forthe poor, should they be found to exist. Herewe looked at the slum of Kibera, reportedlythe largest slum area in sub-Saharan Africa.28
Nigeria was chosen because it is the coun-try with the largest population in sub-SaharanAfrica, and its significance to the continent’sfuture is clear. We selected three local govern-ment areas for study—one from each of thethree senatorial districts making up LagosState: Surulere, Kosofe, and Badagry. Surulereand Kosofe are urban; Badagry is rural. Wealso separately looked at the urban shantytown of Makoko.29
We had conducted research earlier inHyderabad, India, were familiar with the ter-rain, and had many contacts in both the gov-ernment and the private sector, so it seemedsensible to continue the project there. Here,we covered three zones in the Old City:Bandlaguda, Bhadurpura, and Charminar.30
Finally, because of a chance meeting at aconference with the Ghanaian minister ofeducation, we were invited to conduct ourresearch in Ghana as well. We conducted ourresearch in the Ga district, which surrounds
the country’s capital city of Accra.31
In India, we followed the usual definitionof school management type as being of threekinds: government, private aided, and privateunaided.32 Government schools are totallyfunded and managed by some level of gov-ernment, state or local. Private aided schoolsare privately managed but have teachersalaries paid for by the government. Otherexpenses are partly funded privately andpartly by the government. Private unaidedschools are entirely privately managed andprivately funded. Private unaided schools areof two types: recognized and unrecognized.Recognized schools have purportedly metthe regulatory requirements of the state.Unrecognized schools are in effect operatingin the informal sector of the economy. Theyeither have not applied for recognition orhave not succeeded in gaining recognitionfrom the government.
In the African countries, we distinguishedbetween two types of schools, governmentand private. Government schools receive allof their funding from the state. In some casesthey may have private management.33 Privateschools are both privately managed and pri-vately funded. Private schools are again oftwo types. Registered private schools arethose that have, purportedly, met state regu-lations and been inspected. Unregistered pri-vate schools are those that either have notapplied to be registered or have not (yet) beensaid to have met those regulations.
The first part of our research used aCensus of Schools and a Survey of Inputsthat aimed to discover the extent of privateschools in selected low-income areas and tocompare their inputs with those of publicschools serving the same populations. Thisinformation was used as the basis for the sec-ond part of our study that dealt with student
7
According to OxfamInternational, the notion that private schoolsare servicing theneeds of a smallminority ofwealthy parents is misplaced.
1. What Are the Nature and Extent ofPrivate Education for the Poor?

achievement. That aspect of the study aimedto explore the relative achievement of pupilsin private and public schools in low-incomeareas by testing a stratified random sample ofprivate and public school students in keysubjects. We also gave questionnaires topupils, parents, teachers, and school man-agers. Information obtained from the ques-tionnaires allowed us to control for relevantbackground variables.
One key caveat must be made about theresults that follow. Although we are sure thatall private recognized/registered, privateaided, and government schools were found(as they were checked against governmentlists), we cannot be certain that all unrecog-nized/unregistered schools were located,because there were no official lists withwhich to compare our findings. So the datahere must be taken as indicating a lowerbound on the numbers of private unrecog-nized/unregistered schools and, hence, ofprivate enrollment.
How Many Schools Are There and WhatProportion Is Private?
In India, Nigeria, and Ghana, we were inter-ested in the same major issues—the propor-tion of children in private and government
schools, gender issues, the respective teacher-pupil ratios, the age of schools, and manage-ment of private schools. In Kenya, we wereonly looking at a small sample of governmentschools on the periphery of the slums com-pared with a large number of private schoolswithin the slums, so it was not statisticallyviable to make comparisons or to generalizeabout the overall enrollment in private andgovernment schools. The same was true of thesmaller study in Makoko, Nigeria.
In the study locations in India, Nigeria,and Ghana, government schools were foundto be in a minority. In Hyderabad, of the 918schools in the low-income area schools, 34.9percent (320 schools) were government, 5.3percent (49 schools) private aided, and 59.8percent (549 schools) private unaided. Ofthose, the largest number were unrecognized(335 schools or 36.5 percent of the total),while 214 private unaided schools were rec-ognized (23.3 percent of the total). Hence,not only are government schools in theminority, there also were more unrecognizedprivate unaided schools than governmentschools.
Of the 779 schools in Ga, 25.3 percent (197schools) were government and the rest—74.7percent of the total (582 schools)—were pri-
8
Until now thequality of private
schools servinglow-income
families has beenunknown.
Table 1.1Number and Proportion of Schools, by School Type
Hyderabad, India Ga, Ghana Lagos State, NigeriaNumber % Number % Number %
Government 320 34.9 197 25.3 185 34.3Private Aided 49 5.3 0 0 0 0Private
UnaidedUnrecognized/Unregistered 335 36.5 177 22.7 233 43.1
PrivateUnaidedRecognized/Registered 214 23.3 405 52.0 122 22.6
Total 918 100 779 100 540 100
Source: Census of Schools data.

vate (unaided) schools. That is, the largemajority of schools were private unaided. Ofthose schools, the largest number were regis-tered (405 schools or 52.0 percent of the total),compared with 177 unregistered (22.7 percentof the total). There also were almost as manyunregistered private unaided schools as therewere government schools.
In Lagos State, of the 540 schools in thelow-income areas, 34.3 percent (185 schools)were government and the rest—65.7 percent ofthe total (355 schools)—were private unaidedschools. That is, a large majority of schoolswere private. Of those schools, the largest num-ber were unregistered (233 schools or 43.1 per-cent of the total), compared with 122 privateunaided schools that were registered (22.6 per-cent of the total). Hence, there were moreunregistered private unaided schools than gov-ernment schools. These results are summa-rized in Table 1.1 and Figure 1.1.
What Is the Proportion of PupilEnrollment in Private Education?
In the low-income areas of India, Ghana,
and Nigeria that we studied, a majority ofschool children were either calculated or esti-mated to be in private (unaided) schools.
In Hyderabad, 262,075 children attended918 schools. Breaking this down by schooltype, 24.0 percent of children were at govern-ment schools, 11.4 percent at private aidedschools, 41.5 percent at recognized privateunaided schools, and 23.1 percent at unrec-ognized private unaided schools. That is,there were roughly the same number of chil-dren in unrecognized private schools as ingovernment schools. In total, 65 percent ofchildren attended private unaided school;that is, a large majority of the children in thelow-income areas of Hyderabad were attend-ing private unaided schools.
In Ga, 161,244 children were in 779 schools.Breaking this down by school type, 35.6 per-cent of children were at government schools,49.1 percent at registered private unaidedschools, and 15.3 percent at unregistered pri-vate unaided schools. In total, 64.4 percent ofchildren attended private unaided school; thatis, a large majority of the children in the low-
9
A large majorityof the children inthe low-incomeareas ofHyderabad wereattending privateunaided schools.
Figure 1.1Proportion of Schools, by School Type
Perc
enta
ge

income areas of Ga were attending privateunaided schools.
In Nigeria, our Census of Schools gaveenrollment figures only for the private schools,so the numbers given here are estimates. Usingthe official Lagos State Ministry of Educationfigures for primary school enrollment in2002–03, we found that the proportions ofchildren in government and private registeredschools were 38 percent and 62 percent, respec-tively (451,798 in government and 737,599 inprivate registered schools).34 Our own censusfigures showed that the proportion of childrenin private unregistered primary schools was 78percent of the number in private registered pri-mary schools. If the proportions in the threelocal government areas included in our studywere similar to the state as a whole, we wouldfind a total of 577,024 children in unregisteredprivate schools across the state (i.e., 78 percentof 737,599). Combining those figures gives theestimated percentage of pupils enrolled in thethree school types across Lagos State. If theseestimates are correct, about 75 percent ofschool children are in private schools, with agreater proportion in private unregistered thanin government schools (33 percent comparedwith 26 percent). These data are summarizedin Table 1.2.
Based on our surveys of schools in theKibera slum of Kenya and the Makoko shantytown in Lagos, we can make some commentsabout those two places as well. In Makoko,Nigeria, the team found 30 private primaryschools.35 There were also three governmentprimary schools situated on the edge ofMakoko. Total enrollment in the 30 privateprimary schools was reported to be 3,611, withgovernment primary school enrollmentreported as 1,709. In the government schools,it was reported that some children came fromoutside Makoko, although no proportion wasgiven. In the private schools, all children camefrom within Makoko. It should also be notedthat we didn’t necessarily find all the privateschools within Makoko. Thus, our count of 68percent of school children in Makoko attend-ing private school should be considered alower bound.
In Kibera, Kenya, we found 76 private pri-mary and secondary schools, enrolling 12,132students (excluding nursery students), togeth-er with 59 nursery-only schools. These figuresdid not include “nonformal education” cen-ters that are also prevalent. In the five govern-ment schools that were reported to serve chil-dren from Kibera, we found a total of about9,000 children. It is not known how many
10
There are significantly
more children inschool than is
recorded in official statistics.
Table 1.2Number and Proportion of Pupil Enrollment, by School Type
Hyderabad, India Ga, Ghana Lagos State, Nigeria (estimate)Number % Number % Number %
Government 62,839 24.0 57,374 35.6 451,798 26Private aided 29,976 11.4 0 0.0 0 0Private unaided
unrecognized/unregistered 60,533 23.1 24,738 15.3 577,024 33
Private unaided recognized/registered 108,727 41.5 79,132 49.1 737,599 42
Total 262,075 100% 161,244 100% 1,766,421 100%
Sources: Census of Schools data and Lagos State Government (2004) Report from Lagos State to the Joint ConsultativeCommittee on Educational Planning (JCCEP) Reference Committee on Educational Planning Holding at Owerri, ImoState, between April 18–23, 2004, Ministry of Education, Alausa, Ikeja.
were from the slum areas, but comments fromheadteachers suggested about half. Hence, it isclear that if children from Kibera go only toeither the private schools in the slums or thegovernment schools on the periphery, a largemajority—perhaps 70 percent—of school chil-dren from this slum attend private schools.
Gender of PupilsFrom information given by the head-
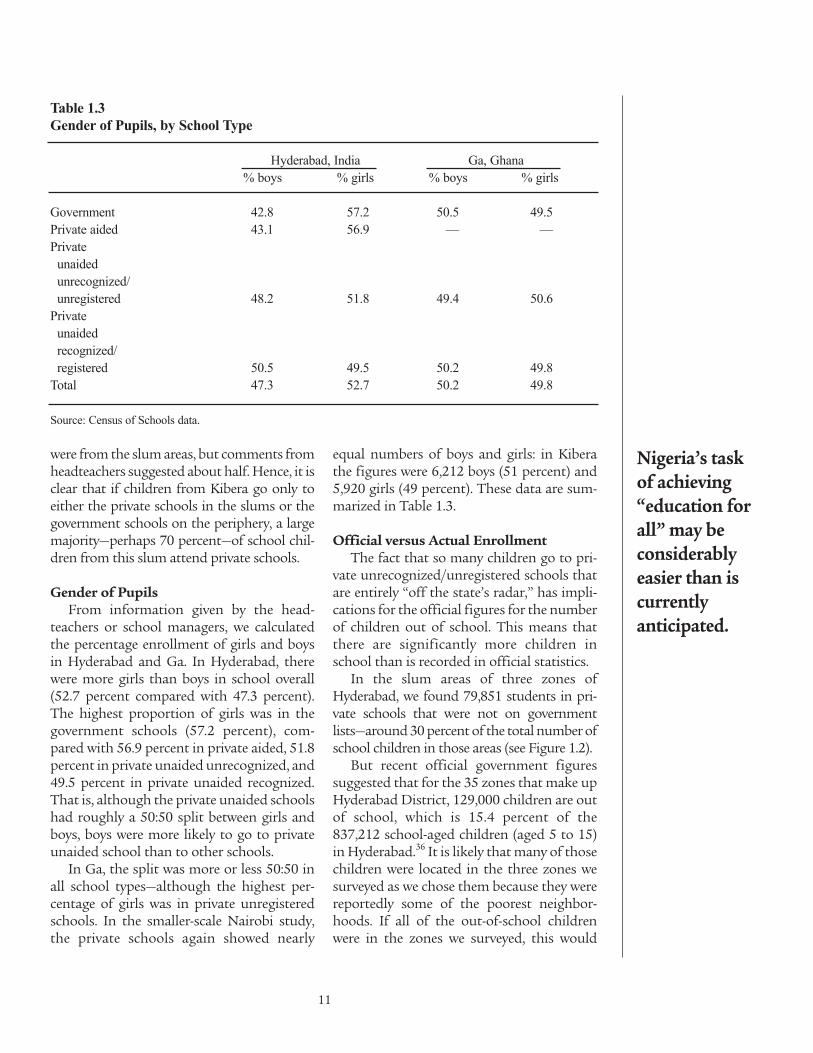
teachers or school managers, we calculatedthe percentage enrollment of girls and boysin Hyderabad and Ga. In Hyderabad, therewere more girls than boys in school overall(52.7 percent compared with 47.3 percent).The highest proportion of girls was in thegovernment schools (57.2 percent), com-pared with 56.9 percent in private aided, 51.8percent in private unaided unrecognized, and49.5 percent in private unaided recognized.That is, although the private unaided schoolshad roughly a 50:50 split between girls andboys, boys were more likely to go to privateunaided school than to other schools.
In Ga, the split was more or less 50:50 inall school types—although the highest per-centage of girls was in private unregisteredschools. In the smaller-scale Nairobi study,the private schools again showed nearly
equal numbers of boys and girls: in Kiberathe figures were 6,212 boys (51 percent) and5,920 girls (49 percent). These data are sum-marized in Table 1.3.
Official versus Actual EnrollmentThe fact that so many children go to pri-
vate unrecognized/unregistered schools thatare entirely “off the state’s radar,” has impli-cations for the official figures for the numberof children out of school. This means thatthere are significantly more children inschool than is recorded in official statistics.
In the slum areas of three zones ofHyderabad, we found 79,851 students in pri-vate schools that were not on governmentlists—around 30 percent of the total number ofschool children in those areas (see Figure 1.2).
But recent official government figuressuggested that for the 35 zones that make upHyderabad District, 129,000 children are outof school, which is 15.4 percent of the837,212 school-aged children (aged 5 to 15)in Hyderabad.36 It is likely that many of thosechildren were located in the three zones wesurveyed as we chose them because they werereportedly some of the poorest neighbor-hoods. If all of the out-of-school childrenwere in the zones we surveyed, this would
11
Nigeria’s task of achieving“education forall” may be considerably easier than is currently anticipated.
Table 1.3Gender of Pupils, by School Type
Hyderabad, India Ga, Ghana% boys % girls % boys % girls
Government 42.8 57.2 50.5 49.5Private aided 43.1 56.9 — —Private
unaidedunrecognized/unregistered 48.2 51.8 49.4 50.6
Privateunaidedrecognized/registered 50.5 49.5 50.2 49.8
Total 47.3 52.7 50.2 49.8
Source: Census of Schools data.

reduce the number of out-of-school childrento about 49,000—the balance being accom-modated in private unrecognized schoolsthat are missed in official figures. Instead of15.4 percent out of school, the figure wouldbe sharply reduced to only about 6 percent(see Table 1.4).
More realistically, if some of the officially“out-of-school” children are spread over the32 other zones, the actual figure of out-of-school children would be even lower. It issurely easier to bring 6 percent of children orfewer into school than it is to bring 15 per-
cent. India’s goal of achieving “education forall” may thus be much easier to reach thanofficial sources claim.
Similar calculations can be made for theother countries. For instance, a recent reportfrom the Lagos State Economic Empowermentand Development Strategy estimates that 50percent of “school-aged” children are out ofschool, although it doesn’t state the ages thesecover.37 In the absence of any better estimates,we can compare these with our estimated fig-ures given previously. If the 50 percent of chil-dren out of school applies to primary enroll-
12
Kibera, Kenya,had a pupil-
teacher ratio of 60:1 in
governmentschools,
compared with21:1 in private
schools.
Figure 1.2Hyderabad, India—Official versus Actual Enrollment Figures
Table 1.4Hyderabad, India—Official and Estimated Out-of-School Children
Worst Case Scenario(all out-of-school children in
Hyderabad (official figures) the three zones surveyed)
Total number of school-aged children 837,212 837,212Number of children in schools 708,212 788,063Number of children out of school 129,000 49,149Percent of children out of school 15 6
Sources: Census of Schools data and Azim Premji Foundation Web site, Andhra Pradesh Programmes, www.indianngos.com/azimpremjifoundation/andhrapradesh.htm.
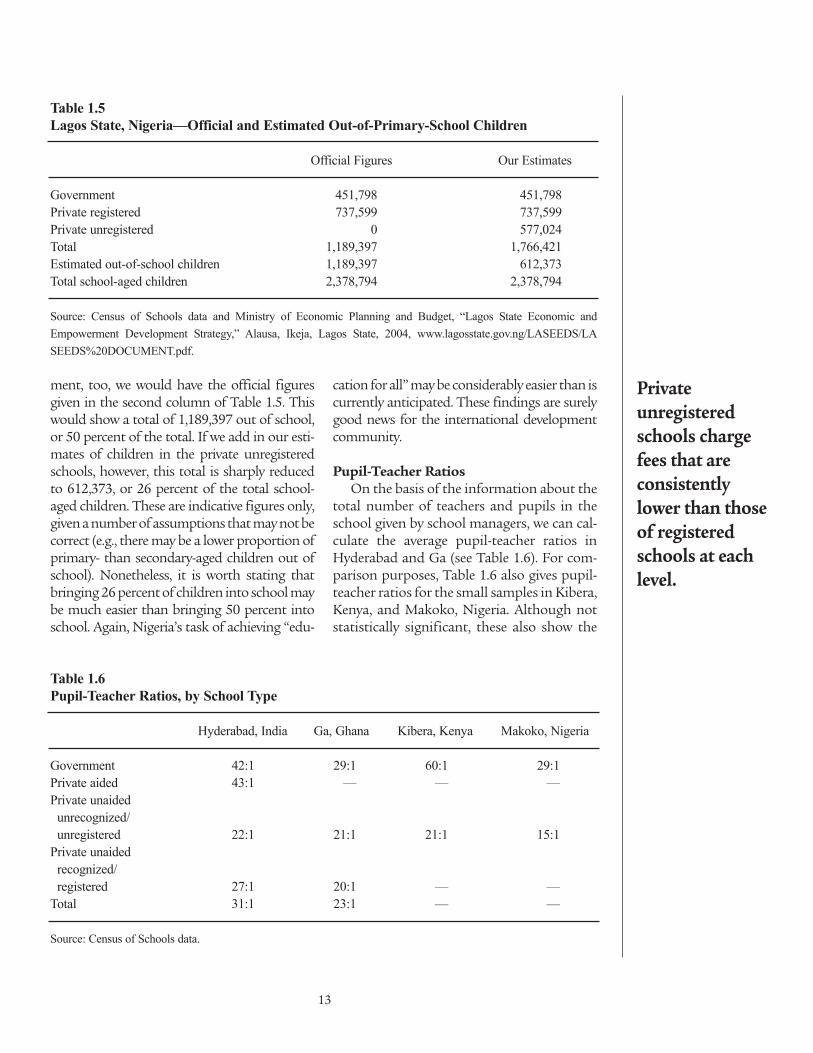
ment, too, we would have the official figuresgiven in the second column of Table 1.5. Thiswould show a total of 1,189,397 out of school,or 50 percent of the total. If we add in our esti-mates of children in the private unregisteredschools, however, this total is sharply reducedto 612,373, or 26 percent of the total school-aged children. These are indicative figures only,given a number of assumptions that may not becorrect (e.g., there may be a lower proportion ofprimary- than secondary-aged children out ofschool). Nonetheless, it is worth stating thatbringing 26 percent of children into school maybe much easier than bringing 50 percent intoschool. Again, Nigeria’s task of achieving “edu-
cation for all” may be considerably easier than iscurrently anticipated. These findings are surelygood news for the international developmentcommunity.
Pupil-Teacher RatiosOn the basis of the information about the
total number of teachers and pupils in theschool given by school managers, we can cal-culate the average pupil-teacher ratios inHyderabad and Ga (see Table 1.6). For com-parison purposes, Table 1.6 also gives pupil-teacher ratios for the small samples in Kibera,Kenya, and Makoko, Nigeria. Although notstatistically significant, these also show the
13
Private unregisteredschools chargefees that are consistentlylower than thoseof registeredschools at eachlevel.
Table 1.5Lagos State, Nigeria—Official and Estimated Out-of-Primary-School Children
Official Figures Our Estimates
Government 451,798 451,798Private registered 737,599 737,599Private unregistered 0 577,024Total 1,189,397 1,766,421Estimated out-of-school children 1,189,397 612,373Total school-aged children 2,378,794 2,378,794
Source: Census of Schools data and Ministry of Economic Planning and Budget, “Lagos State Economic andEmpowerment Development Strategy,” Alausa, Ikeja, Lagos State, 2004, www.lagosstate.gov.ng/LASEEDS/LASEEDS%20DOCUMENT.pdf.
Table 1.6Pupil-Teacher Ratios, by School Type
Hyderabad, India Ga, Ghana Kibera, Kenya Makoko, Nigeria
Government 42:1 29:1 60:1 29:1Private aided 43:1 — — —Private unaided
unrecognized/unregistered 22:1 21:1 21:1 15:1
Private unaided recognized/registered 27:1 20:1 — —
Total 31:1 23:1 — —
Source: Census of Schools data.

school choices facing parents in those slumareas.
In Hyderabad, the highest pupil-teacherratio was in the government (42:1) and privateaided (43:1) schools. The private unaidedunrecognized schools had the lowest (22:1),almost half that of the government and aidedschools. Private unaided recognized schoolshad a pupil-teacher ratio of 27:1.
In Ga, the highest ratio was again foundin the government schools (29:1) comparedwith 21:1 and 20:1 in the unregistered andregistered private schools, respectively. InMakoko, Nigeria, government schools hadthe highest ratio (29:1) with private unregis-tered (15:1) about half that ratio. Kibera,Kenya, had the largest disparity, with a pupil-teacher ratio of 60:1 in the governmentschools, compared with 21:1 in the privateschools—nearly three times lower.
Pupil FeesAs part of our research, we asked school
managers for their fees, checking these wherepossible against advertised fee amounts. InHyderabad, the private unaided schoolscharge a range of monthly, term, and admis-sion fees. There is a statistically significant dif-ference in the fees charged in unrecognized
and recognized schools, with the former con-sistently lower than the latter at each level. Forexample, for first grade, average monthly feesin recognized private unaided schools are R95.60 ($2.20) per month, compared with R68.32 ($1.57) per month in the unrecognizedschools.38 At fourth grade, the same figures areR 102.55/- ($2.36) compared with R 78.17($1.80) (see Figure 1.3).
In Ga, we found a similar picture. Schoolsthere generally charge only term fees. Unreg-istered private schools consistently charge lowerfees than the private registered schools at eachlevel. For example, for nursery, average fees in pri-vate unaided registered schools are Cedis175,380 ($19.38) per term, compared with Cedis101,685 ($11.24) per term in the private unregis-tered schools.39 At fourth grade, the same figuresare Cedis 220,898 ($24.41) compared with Cedis132,263 ($14.61) (see Figure 1.4).
In Nigeria, private schools usually chargeterm fees. Again, private unregistered schoolscharge fees that are consistently lower thanthe registered schools at each level. For exam-ple, for Primary 1 class, average fees in privateunaided registered schools are Naira 4,064($29.72) per term, compared with Naira2,744 ($20.07) in the unregistered schools.40
At Primary 4, the same figures are Naira
14
In all of the countries
surveyed, wefound that a considerable
number of placeswere provided
free or at reducedrates.
Figure 1.3Hyderabad, India—Average Monthly Fees for Private Unaided Recognized and Unrecog-nized Schools ($ U.S.)
U.S
. Dol
lars

4,362 ($31.90) compared with Naira 2,993($21.89) (see Figure 1.5).
It should be noted that not all childrenpay these fees. In all of the countries we sur-veyed, we found that a considerable numberof places were provided free or at reducedrates (e.g., to orphans and children fromlarge families).
When Were Schools Established?A common assumption about—and implied
criticism of—private unregistered/unrecog-nized schools is that these schools are usuallynewly established fly-by-night enterprises. Ourdata suggest that this is not true.
For Hyderabad, the average year of estab-lishment for private unaided unrecognized
15
Figure 1.4Ga, Ghana—Average Term Fees for Private Unaided Registered and Private UnregisteredSchools
Figure 1.5Lagos State, Nigeria—Average Term Fees for Private Unaided Registered and PrivateUnregistered Schools
U.S
. Dol
lars
U.S
. Dol
lars
The funding ofschools was predominantlyfrom school fees,not outside philanthropy.
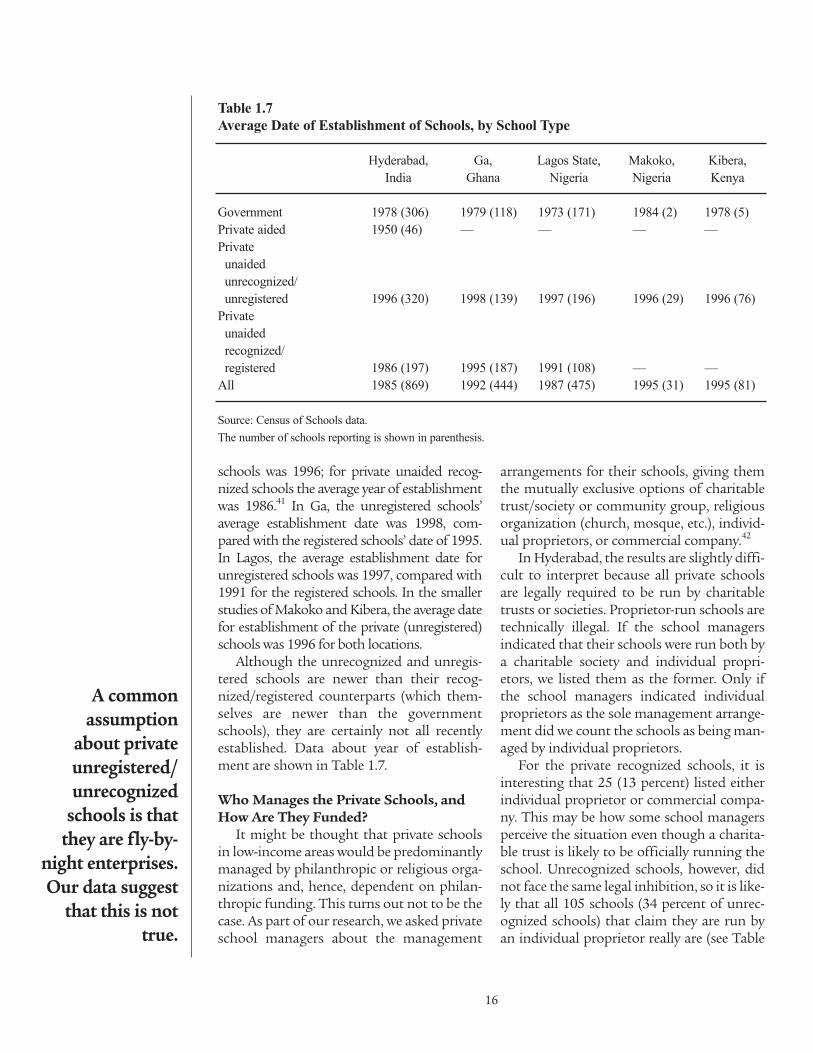
schools was 1996; for private unaided recog-nized schools the average year of establishmentwas 1986.41 In Ga, the unregistered schools’average establishment date was 1998, com-pared with the registered schools’ date of 1995.In Lagos, the average establishment date forunregistered schools was 1997, compared with1991 for the registered schools. In the smallerstudies of Makoko and Kibera, the average datefor establishment of the private (unregistered)schools was 1996 for both locations.
Although the unrecognized and unregis-tered schools are newer than their recog-nized/registered counterparts (which them-selves are newer than the governmentschools), they are certainly not all recentlyestablished. Data about year of establish-ment are shown in Table 1.7.
Who Manages the Private Schools, andHow Are They Funded?
It might be thought that private schoolsin low-income areas would be predominantlymanaged by philanthropic or religious orga-nizations and, hence, dependent on philan-thropic funding. This turns out not to be thecase. As part of our research, we asked privateschool managers about the management
arrangements for their schools, giving themthe mutually exclusive options of charitabletrust/society or community group, religiousorganization (church, mosque, etc.), individ-ual proprietors, or commercial company.42
In Hyderabad, the results are slightly diffi-cult to interpret because all private schoolsare legally required to be run by charitabletrusts or societies. Proprietor-run schools aretechnically illegal. If the school managersindicated that their schools were run both bya charitable society and individual propri-etors, we listed them as the former. Only ifthe school managers indicated individualproprietors as the sole management arrange-ment did we count the schools as being man-aged by individual proprietors.
For the private recognized schools, it isinteresting that 25 (13 percent) listed eitherindividual proprietor or commercial compa-ny. This may be how some school managersperceive the situation even though a charita-ble trust is likely to be officially running theschool. Unrecognized schools, however, didnot face the same legal inhibition, so it is like-ly that all 105 schools (34 percent of unrec-ognized schools) that claim they are run byan individual proprietor really are (see Table
16
A commonassumption
about privateunregistered/unrecognized
schools is thatthey are fly-by-
night enterprises.Our data suggest
that this is nottrue.
Table 1.7Average Date of Establishment of Schools, by School Type
Hyderabad, Ga, Lagos State, Makoko, Kibera, India Ghana Nigeria Nigeria Kenya
Government 1978 (306) 1979 (118) 1973 (171) 1984 (2) 1978 (5)Private aided 1950 (46) — — — —Private
unaided unrecognized/unregistered 1996 (320) 1998 (139) 1997 (196) 1996 (29) 1996 (76)
Private unaided recognized/registered 1986 (197) 1995 (187) 1991 (108) — —
All 1985 (869) 1992 (444) 1987 (475) 1995 (31) 1995 (81)
Source: Census of Schools data.The number of schools reporting is shown in parenthesis.
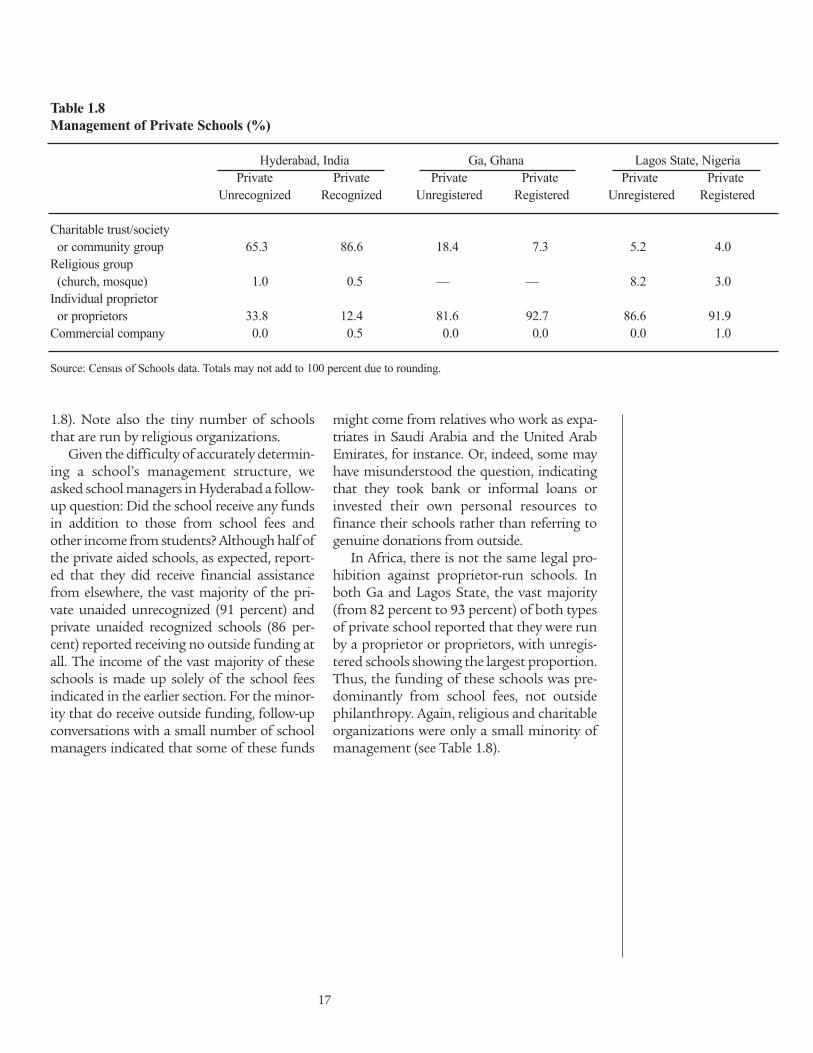
1.8). Note also the tiny number of schoolsthat are run by religious organizations.
Given the difficulty of accurately determin-ing a school’s management structure, weasked school managers in Hyderabad a follow-up question: Did the school receive any fundsin addition to those from school fees andother income from students? Although half ofthe private aided schools, as expected, report-ed that they did receive financial assistancefrom elsewhere, the vast majority of the pri-vate unaided unrecognized (91 percent) andprivate unaided recognized schools (86 per-cent) reported receiving no outside funding atall. The income of the vast majority of theseschools is made up solely of the school feesindicated in the earlier section. For the minor-ity that do receive outside funding, follow-upconversations with a small number of schoolmanagers indicated that some of these funds
might come from relatives who work as expa-triates in Saudi Arabia and the United ArabEmirates, for instance. Or, indeed, some mayhave misunderstood the question, indicatingthat they took bank or informal loans orinvested their own personal resources tofinance their schools rather than referring togenuine donations from outside.
In Africa, there is not the same legal pro-hibition against proprietor-run schools. Inboth Ga and Lagos State, the vast majority(from 82 percent to 93 percent) of both typesof private school reported that they were runby a proprietor or proprietors, with unregis-tered schools showing the largest proportion.Thus, the funding of these schools was pre-dominantly from school fees, not outsidephilanthropy. Again, religious and charitableorganizations were only a small minority ofmanagement (see Table 1.8).
17
Table 1.8Management of Private Schools (%)
Hyderabad, India Ga, Ghana Lagos State, NigeriaPrivate Private Private Private Private Private
Unrecognized Recognized Unregistered Registered Unregistered Registered
Charitable trust/society or community group 65.3 86.6 18.4 7.3 5.2 4.0
Religious group (church, mosque) 1.0 0.5 — — 8.2 3.0
Individual proprietor or proprietors 33.8 12.4 81.6 92.7 86.6 91.9
Commercial company 0.0 0.5 0.0 0.0 0.0 1.0
Source: Census of Schools data. Totals may not add to 100 percent due to rounding.


Our process of data collection tookplace in Kenya about 10 monthsafter the Kenyan government abol-
ished fees in all government primary schoolsthat introduced free primary education(FPE).43 The introduction of FPE in Kenyagenerated a great deal of international admi-ration. Indeed, former president Bill Clintontold a prime time ABC television audiencethat the person he most wanted to meet wasPresident Mwai Kibaki of Kenya “because hehas abolished school fees,” which “wouldaffect more lives than any president had doneor would ever do by the end of this year.”44
The recent introduction of free primary edu-cation provided an additional dimension toour research in Kenya; that is, we also had theopportunity to explore what impact theintroduction of FPE had on pupil enroll-ment in the slum areas.
Official figures suggested a huge increase inenrollment in government schools, includingthose serving the slum areas. However, no oneapparently had investigated the impact on pri-vate school enrollment in poor areas. Weexplored this question in depth by asking own-ers and managers of private schools how FPEhad affected their primary school enrollment.45
In Kibera, 69 of the 76 schools served pri-mary school students. However, it turned outthat one other school, currently serving nurseryand secondary students only, previously had asection of their school that served primarygrade students. That section of the school hadclosed as a result of FPE. Hence we give figuresfor the impact on 70 schools from Kibera (seeTable 2.1). We asked the same question of thegovernment primary schools that we were toldserved Kibera. These figures enable us to makerough estimates of the net impact of FPE. Thefigures we found challenge the official pictureof dramatically increased enrollment.
It is true that FPE had dramatically in-creased the number of students enrolled in allfive government primary schools reportedlyserving Kibera. The total increase reported was3,296 students. However, of the 70 privateschools serving (or previously serving) prima-ry students, FPE led to a net decline in enroll-ment in 48 schools (69 percent), while theremaining reported that either the studentnumbers had stayed roughly the same (14schools, or 20 percent) or school enrollmenthad experienced a net increase in studentnumbers since the introduction of FPE (8schools, or 12 percent).
19
There are about8,000 fewer students fromKibera enrolledin primaryschools thanthere were beforeFPE was introduced.
2. How Did Free Primary EducationImpact Enrollment?
Table 2.1Kibera’s Net Decline in Private School Enrollment
Category Increase/decrease in enrollment
Private–straight decline in enrollment –6,010Private–initial decline then increase –939Private–increase in enrollment +378Net increase/decrease –6,571Average increase/decrease in 70 schools –94
Source: Census of Schools data.

Of the 48 schools reporting a net declinein their enrollment, 41 had suffered astraightforward decrease since the introduc-tion of FPE. For some of these schools, thedecrease was dramatic—with the largestreporting a 93 percent decline. The totalnumber of children leaving these 41 privateschools was reported to be 6,010, with theaverage decrease per school being 147 chil-dren (47 percent).
The remaining seven schools that had suf-fered a net enrollment decline reported thatenrollments were now increasing—eitherbecause some parents who had moved theirchildren to the government schools were nowreturning their children to private schools orwere moving their children from privateschools that had closed. The total net declinein these schools was 939 students. Finally,eight of the private schools reported thatenrollment figures had increased since theintroduction of FPE. The net increase in stu-dents in those eight private schools was 378(see Table 2.1).
From these figures, we can compute thetotal net decrease in the number of studentsreported to be enrolled in the private schoolsin Kibera. The results are also shown in Table2.1. Here we can see that the net decrease inthe enrollment in the 70 schools was 6,571,or 94 per school.
Closing Private SchoolsIn addition to assessing the impact of FPE
on private school enrollment, we also askedschool owners and managers whether theyknew of any private primary schools (orschools serving primary students) that hadclosed directly as a result of the new FPE pol-icy. We asked school managers for the specif-ic names of any schools that had closed toensure that school owners and managerswere not simply guessing. We then followedup on these reports using the network of theKenya Non-Formal Schools Association andsent researchers to find and interview themanager/proprietor of the previously exist-ing school. By this means we were able toascertain the reason for closure and the num-
ber of pupils that had been enrolled when theschool closed.
A total of 33 private schools were reportedby school managers to have closed since theintroduction of FPE. We were able to locateand interview the previous managers of 32 ofthose schools. In the course of our research, weuncovered an additional 3 private schools thathad closed since FPE was introduced. The pre-vious school managers of these 35 privateschools, reported that 25 of them had closedspecifically because of FPE. (Two of theschools had relocated and were still open.) Sixof the schools had closed because of demoli-tion work due to the building of a by-passthrough the slum, and two closed due to mis-management or lack of funds unconnectedwith FPE. In total, 5,691 children had been inthese schools at the time of closing with 4,600in schools that had closed specifically becauseof the impact of FPE.
Owners of private schools that had closedgave the following statements about whathappened to the children who had left theirschools:
Some children joined other privateschools and city council schools butothers are still at home because of lim-ited chances in the present schools.—William Onyando, Upendo Primary
A few went to local private schools, afew to city council schools, and themajority are not in school at all.—Jacinta Josephine Kioko, Sacred HeartPrimary
The needy children remained at home;others went to the local private schooland some to the local governmentschool.—Stephen Juma Kulisher, JesusGospel Church School
Some joined the city council schoolsbut others did not since they wereorphaned and needed special treatmentwhich the city council schools do notprovide.—Oscar Osir, Sinai Academy
20
It was the moreprosperous slum
dwellers whowere able to
afford to sendtheir children to
governmentschools, giventheir “hidden
costs.”
The fact that some of the displaced childrenenrolled at other private schools in Kiberahelps to explain why a few of the remaining pri-vate schools experienced an increase in enroll-ment. However, this cannot account for all themissing children. Some of the preceding com-ments suggest (although by no means con-firm) that those most adversely affected by theintroduction of FPE were those orphans previ-ously enjoying free education at a local privateschool. Following the closure of these schools,such children may have been unable to find afree place at another local private school orbeen unable to afford the “hidden costs” thatare often part of enrolling at a local govern-ment school. (Hidden costs may include suchthings as requirements for expensive schooluniforms or parent-teacher association levies.)It may also be the case that all local govern-ment schools were already oversubscribed.Very poor children would not be able to affordthe transport costs to schools farther away.
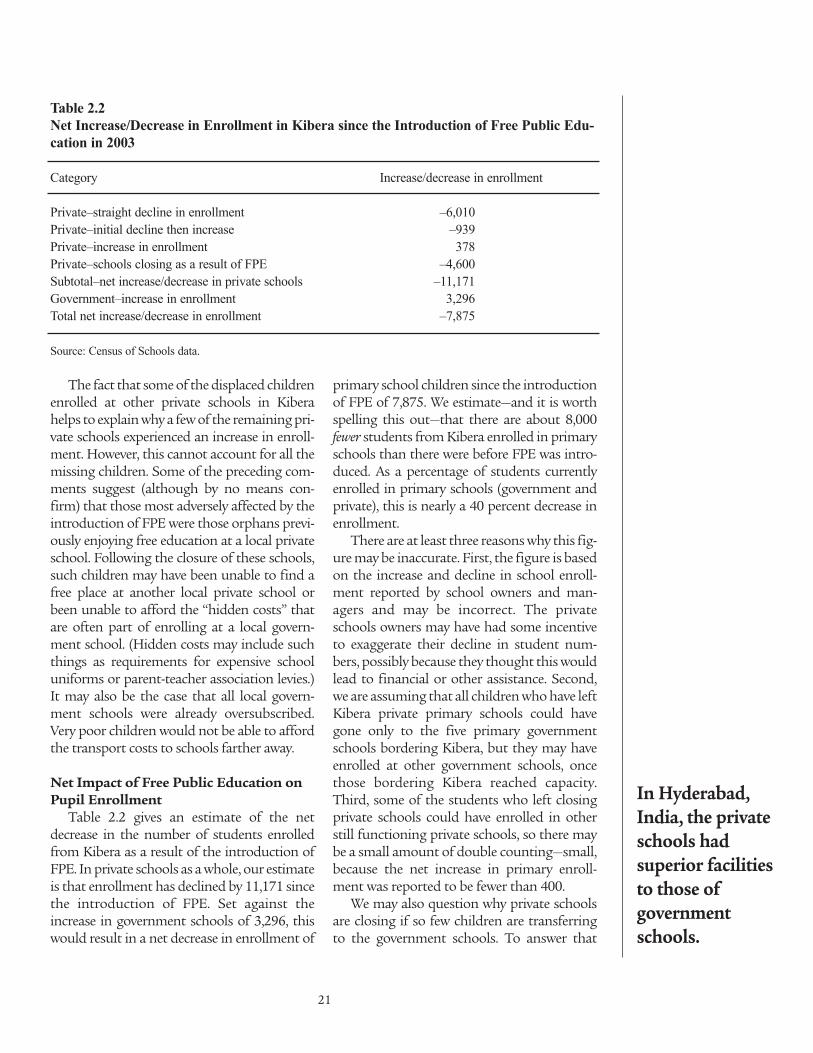
Net Impact of Free Public Education onPupil Enrollment
Table 2.2 gives an estimate of the netdecrease in the number of students enrolledfrom Kibera as a result of the introduction ofFPE. In private schools as a whole, our estimateis that enrollment has declined by 11,171 sincethe introduction of FPE. Set against theincrease in government schools of 3,296, thiswould result in a net decrease in enrollment of
primary school children since the introductionof FPE of 7,875. We estimate—and it is worthspelling this out—that there are about 8,000fewer students from Kibera enrolled in primaryschools than there were before FPE was intro-duced. As a percentage of students currentlyenrolled in primary schools (government andprivate), this is nearly a 40 percent decrease inenrollment.
There are at least three reasons why this fig-ure may be inaccurate. First, the figure is basedon the increase and decline in school enroll-ment reported by school owners and man-agers and may be incorrect. The privateschools owners may have had some incentiveto exaggerate their decline in student num-bers, possibly because they thought this wouldlead to financial or other assistance. Second,we are assuming that all children who have leftKibera private primary schools could havegone only to the five primary governmentschools bordering Kibera, but they may haveenrolled at other government schools, oncethose bordering Kibera reached capacity.Third, some of the students who left closingprivate schools could have enrolled in otherstill functioning private schools, so there maybe a small amount of double counting—small,because the net increase in primary enroll-ment was reported to be fewer than 400.
We may also question why private schoolsare closing if so few children are transferringto the government schools. To answer that
21
In Hyderabad,India, the privateschools had superior facilitiesto those of governmentschools.
Table 2.2Net Increase/Decrease in Enrollment in Kibera since the Introduction of Free Public Edu-cation in 2003
Category Increase/decrease in enrollment
Private–straight decline in enrollment –6,010Private–initial decline then increase –939Private–increase in enrollment 378Private–schools closing as a result of FPE –4,600Subtotal–net increase/decrease in private schools –11,171Government–increase in enrollment 3,296Total net increase/decrease in enrollment –7,875
Source: Census of Schools data.

question, we might consider that if many pri-vate schools are running on a very tight bud-get, the loss of even a small number of childrenmay make them unviable financially and,hence, force them to close.46 Indeed, interviewswith parents gave the impression that it wasthe more prosperous slum dwellers who wereable to afford to send their children to govern-ment schools, given their “hidden costs.” Itshould also be considered that the more pros-perous parents may have been the ones whocould afford to pay fees on time in the privateschools—something that the majority of par-ents reported not being able to do. So the lossof these parents may have been particularlyacute for the private school managers.
If one private school closed, why wouldn’tparents send their children to another privateschool, as there are still plenty of these avail-able? Answering this question requires furtherresearch. However, it could be hypothesizedthat some parents may be reluctant to pay for
tuition, given that it is now supposed to befree. Or a parent may have been very happywith a particular private school, but, once thatschool closed, didn’t feel inclined to try anoth-er private school out of fear that that schooltoo might close for the same reason. Instead,these parents may have chosen to send theirchildren out to work or back to the rural areas.
Nevertheless, whatever the objection to theprecise figures, they clearly point to the needfor a more sober assessment of the net impactof FPE on enrollment, taking into accountenrollment in private schools for the poor aswell as the more customary exercise in exam-ining only government school figures. Even ifwe have overestimated the number of childrendropping out of private schools by a factor offour, our estimates would still mean that thenet impact of FPE was precisely the samenumber of children enrolled in primaryschool—only that some had transferred fromprivate to government schools.
22
In Lagos, Nigeria,private schoolswere markedly
superior to government
schools in termsof teaching
activity.

The Survey of Inputs was conducted overthe same period as the Census ofSchools and by the same research
teams. When the researcher visited unan-nounced and without prior notice to conductthe survey, he or she asked to tour the school.On this school tour, the researcher made a noteof the facilities available in the school using aform listing all of the facilities indicated inTables 3.1–3.13. The researcher also asked tovisit the particular primary school classroomthat would participate in the survey of achieve-ment (grade/class 4, 5, or 6, depending on thecountry), during a time when teaching shouldnormally be taking place.47
In Hyderabad, India, the results of ourSurvey of Inputs showed that the privateschools (including the unrecognized privateschools) had superior facilities to those of gov-ernment schools. When researchers called unan-nounced on the classrooms, 98 percent of teach-
ers were teaching in the private recognizedschools, compared with 91 percent in the unrec-ognized private schools and 75 percent in thegovernment schools (see Table 3.1).
Teacher absenteeism was also highest inthe government schools. On every input,including the availability of blackboards, play-grounds, desks, drinking water, toilets, andseparate toilets for boys and girls, both typesof private schools—recognized and unrecog-nized—were superior to the governmentschools (see Tables 3.2–3.13). For instance,while 78 percent of the government schoolshad blackboards in every classroom, 96 per-cent of the private recognized schools and 94percent of the private unrecognized schoolshad blackboards in every classroom. In onlyhalf the government schools (52 percent) werefunctioning toilets provided for children,compared with 97 percent of both recognizedand unrecognized private schools.
23
The privateschool advantagefound in the rawscores continuesafter backgroundeffects are controlled for.
3. How Do Private and State SchoolsCompare?
Table 3.1Teacher Activities of Grade 4/5 Teacher, by Percent in Each School Type, in Three Surveys
Activity of Teacher Hyderabad, Indiaa Ga, Ghanab Lagos, Nigeriac
Private Teaching 97.5 75.0 87.9recognized/ Nonteaching 2.0 19.8 11.1registered Absent 0.5 5.2 1.0
Private Teaching 90.5 66.4 87.0unrecognized/ Nonteaching 5.5 24.4 12.0unregistered Absent 4.0 9.2 1.1
Government Teaching 74.6 56.7 67.3Nonteaching 19.7 28.3 24.5Absent 5.7 15.0 8.2
Source: Survey of Inputs data.aX 2 = 64.823, df = 4, Significant, p < 0.001.bX 2 = 15.026, df = 4, Significant, p < 0.01.cX 2 = 25.691, df = 4, Significant, p < 0.001.
In Ga, Ghana, teaching commitment washighest in the private schools: 75 percent ofteachers in registered private and 66 percent inunregistered private schools. But only 57 percentof teachers in government schools were teachingat the time when researchers arrived unan-nounced. Teacher absenteeism was also highestin the government schools (see Table 3.1).
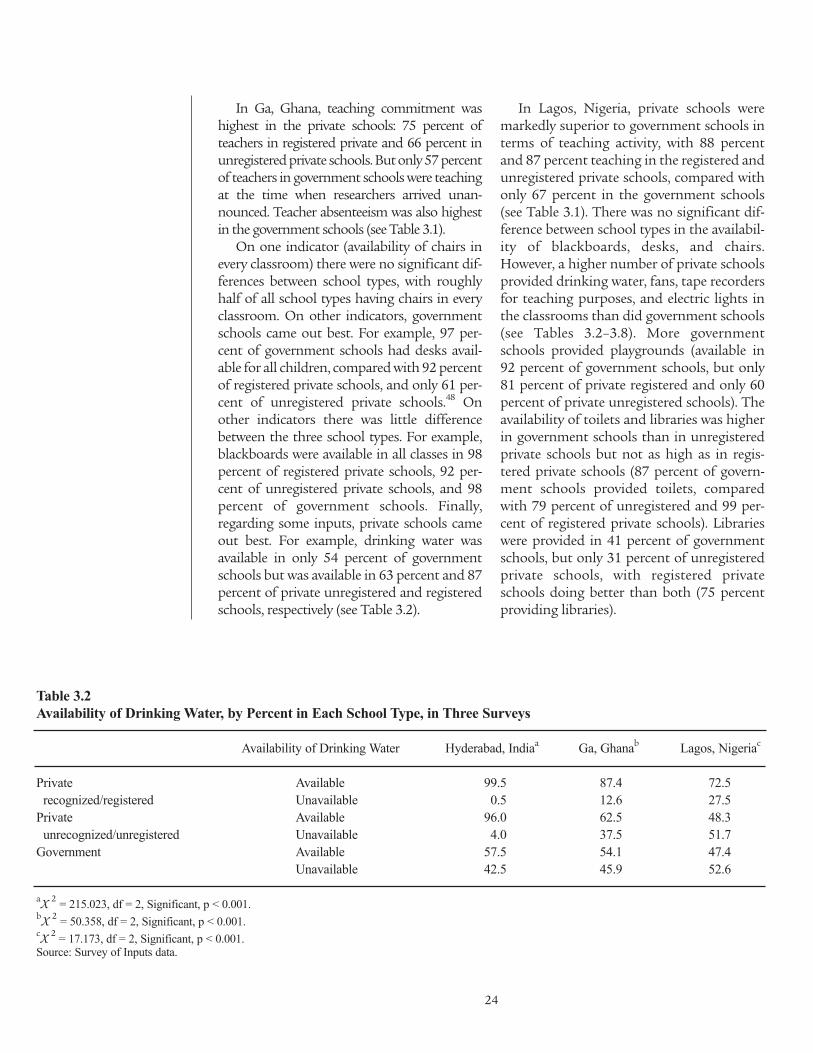
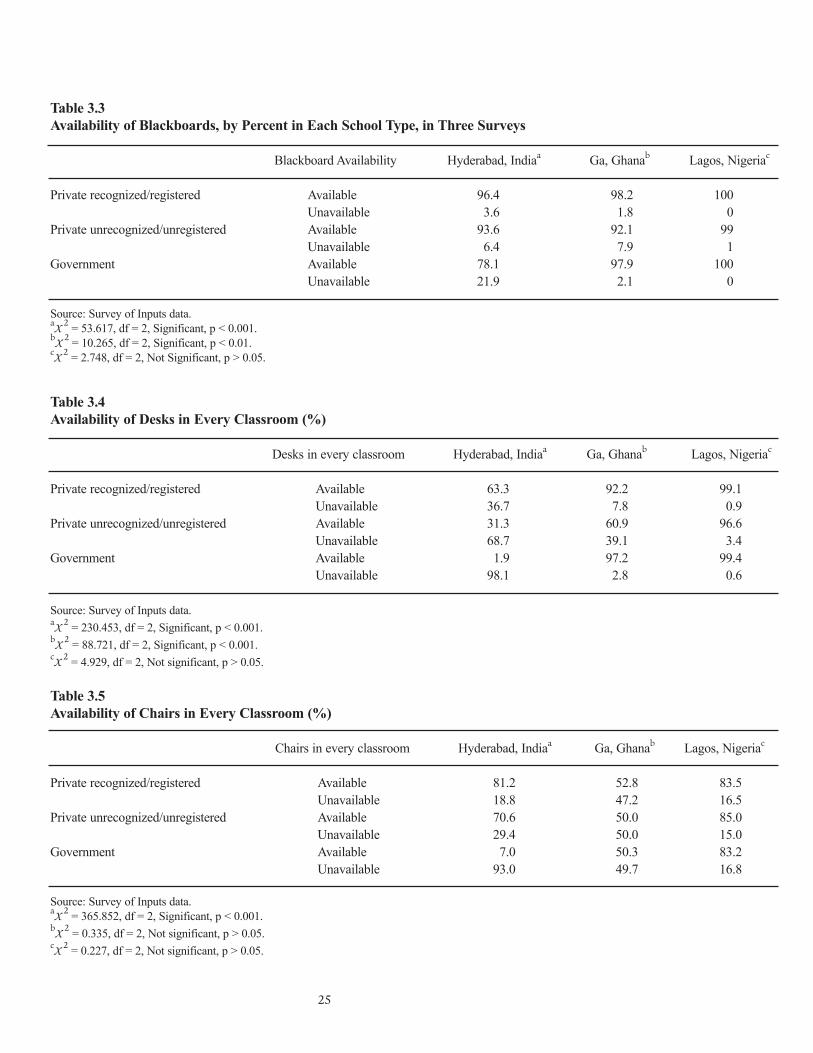
On one indicator (availability of chairs inevery classroom) there were no significant dif-ferences between school types, with roughlyhalf of all school types having chairs in everyclassroom. On other indicators, governmentschools came out best. For example, 97 per-cent of government schools had desks avail-able for all children, compared with 92 percentof registered private schools, and only 61 per-cent of unregistered private schools.48 Onother indicators there was little differencebetween the three school types. For example,blackboards were available in all classes in 98percent of registered private schools, 92 per-cent of unregistered private schools, and 98percent of government schools. Finally,regarding some inputs, private schools cameout best. For example, drinking water wasavailable in only 54 percent of governmentschools but was available in 63 percent and 87percent of private unregistered and registeredschools, respectively (see Table 3.2).
In Lagos, Nigeria, private schools weremarkedly superior to government schools interms of teaching activity, with 88 percentand 87 percent teaching in the registered andunregistered private schools, compared withonly 67 percent in the government schools(see Table 3.1). There was no significant dif-ference between school types in the availabil-ity of blackboards, desks, and chairs.However, a higher number of private schoolsprovided drinking water, fans, tape recordersfor teaching purposes, and electric lights inthe classrooms than did government schools(see Tables 3.2–3.8). More governmentschools provided playgrounds (available in92 percent of government schools, but only81 percent of private registered and only 60percent of private unregistered schools). Theavailability of toilets and libraries was higherin government schools than in unregisteredprivate schools but not as high as in regis-tered private schools (87 percent of govern-ment schools provided toilets, comparedwith 79 percent of unregistered and 99 per-cent of registered private schools). Librarieswere provided in 41 percent of governmentschools, but only 31 percent of unregisteredprivate schools, with registered privateschools doing better than both (75 percentproviding libraries).
24
Table 3.2Availability of Drinking Water, by Percent in Each School Type, in Three Surveys
Availability of Drinking Water Hyderabad, Indiaa Ga, Ghanab Lagos, Nigeriac
Private Available 99.5 87.4 72.5recognized/registered Unavailable 0.5 12.6 27.5
Private Available 96.0 62.5 48.3unrecognized/unregistered Unavailable 4.0 37.5 51.7
Government Available 57.5 54.1 47.4Unavailable 42.5 45.9 52.6
aX 2 = 215.023, df = 2, Significant, p < 0.001.bX 2 = 50.358, df = 2, Significant, p < 0.001.cX 2 = 17.173, df = 2, Significant, p < 0.001.Source: Survey of Inputs data.
25
Table 3.3Availability of Blackboards, by Percent in Each School Type, in Three Surveys
Blackboard Availability Hyderabad, Indiaa Ga, Ghanab Lagos, Nigeriac
Private recognized/registered Available 96.4 98.2 100Unavailable 3.6 1.8 0
Private unrecognized/unregistered Available 93.6 92.1 99Unavailable 6.4 7.9 1
Government Available 78.1 97.9 100Unavailable 21.9 2.1 0
Source: Survey of Inputs data.aX 2 = 53.617, df = 2, Significant, p < 0.001. bX 2 = 10.265, df = 2, Significant, p < 0.01. cX 2 = 2.748, df = 2, Not Significant, p > 0.05.
Table 3.4Availability of Desks in Every Classroom (%)
Desks in every classroom Hyderabad, Indiaa Ga, Ghanab Lagos, Nigeriac
Private recognized/registered Available 63.3 92.2 99.1Unavailable 36.7 7.8 0.9
Private unrecognized/unregistered Available 31.3 60.9 96.6Unavailable 68.7 39.1 3.4
Government Available 1.9 97.2 99.4Unavailable 98.1 2.8 0.6
Source: Survey of Inputs data.aX 2 = 230.453, df = 2, Significant, p < 0.001.bX 2 = 88.721, df = 2, Significant, p < 0.001.cX 2 = 4.929, df = 2, Not significant, p > 0.05.
Table 3.5Availability of Chairs in Every Classroom (%)
Chairs in every classroom Hyderabad, Indiaa Ga, Ghanab Lagos, Nigeriac
Private recognized/registered Available 81.2 52.8 83.5Unavailable 18.8 47.2 16.5
Private unrecognized/unregistered Available 70.6 50.0 85.0Unavailable 29.4 50.0 15.0
Government Available 7.0 50.3 83.2Unavailable 93.0 49.7 16.8
Source: Survey of Inputs data.aX 2 = 365.852, df = 2, Significant, p < 0.001.bX 2 = 0.335, df = 2, Not significant, p > 0.05.cX 2 = 0.227, df = 2, Not significant, p > 0.05.

26
Table 3.6Availability of Fans in Every Classroom (%)
Fans in every classroom Hyderabad, Indiaa Ga, Ghanab Lagos, Nigeriac
Private recognized/registered Available 57.9 12.0 62.6Unavailable 42.1 88.0 37.4
Private unrecognized/unregistered Available 39.3 3.6 38.3Unavailable 60.7 96.4 61.7
Government Available 5.7 0.7 12.1Unavailable 94.3 99.3 87.9
Source: Survey of Inputs data.aX 2 = 171.517, df = 2, Significant, p < 0.001.b X 2 = 20.614, df = 2, Significant, p < 0.001.c X 2 = 68.573, df = 2, Significant, p < 0.001.
Table 3.7Availability of Tape Recorders in the School (%)
Tape Recorders Hyderabad, Indiaa Ga, Ghanab Lagos, Nigeriac
Private recognized/registered Available 53.3 6.0 30.8Unavailable 46.7 94.0 69.2
Private unrecognized/unregistered Available 37.1 2.2 13.7Unavailable 62.9 97.8 86.3
Government Available 5.7 0.7 2.3Unavailable 94.3 99.3 97.7
Source: Survey of Inputs data. aX 2 = 150.017, df = 2, Significant, p < 0.001.bX 2 = 8.155, df = 2, Significant, p < 0.05.cX 2 = 32.718, df = 2, Significant, p < 0.001.
Table 3.8Availability of Electric Light in Every Classroom (%)
Electric light in every classroom Hyderabad, Indiaa Ga, Ghanab Lagos, Nigeriac
Private recognized/registered Available 60.2 58.1 86.9Unavailable 39.8 42.1 13.1
Private unrecognized/unregistered Available 45.4 23.6 58.1Unavailable 54.6 76.4 41.9
Government Available 11.1 23.9 33.3Unavailable 88.9 76.1 66.7
Source: Survey of Inputs data. aX 2 = 147.680, df = 2, p < 0.001.b X 2 = 60.881, df = 2, p < 0.001.cX 2 = 73.905, df = 2, Significant, p < 0.001.

27
Table 3.9Availability of Own Playground (%)
Own Playground Hyderabad, Indiaa Ga, Ghanab Lagos, Nigeriac
Private recognized/registered Available 52.8 82.1 81.1Unavailable 47.2 17.9 18.9
Private unrecognized/unregistered Available 34.9 66.4 60.2Unavailable 65.1 33.6 39.8
Government Available 39.2 95.0 92.4Unavailable 60.8 5.0 7.6
Source: Survey of Inputs data.aX 2 = 16.658, df = 2, p < 0.001.bX 2 =37.448, df = 2, Significant, p < 0.001.cX 2 = 55.140, df = 2, Significant, p < 0.001.
Table 3.10Availability of Toilets for Children (%)
Toilets for Children Hyderabad, Indiaa Ga, Ghanab Lagos, Nigeriac
Private recognized/registered Available 97.4 90.5 99.1Unavailable 2.6 9.5 0.9
Private unrecognized/unregistered Available 96.6 59.2 78.9Unavailable 3.4 40.8 21.1
Government Available 51.9 62.7 86.7Unavailable 48.1 37.3 13.3
Source: Survey of Inputs data.aX 2 = 249.132, df = 2, p < 0.001.bX 2 =53.049, df = 2, Significant, p < 0.001.cX 2 =23.198, df = 2, Significant, p < 0.001.
Table 3.11Availability of a Library for Children (%)
Library Hyderabad, Indiaa Ga, Ghanab Lagos, Nigeriac
Private recognized/registered Available 32.7 26.8 74.7Unavailable 67.3 73.2 25.3
Private unrecognized/unregistered Available 10.7 7.4 30.7Unavailable 89.3 92.6 69.3
Government Available 1.0 7.9 40.7Unavailable 99.0 92.1 59.3
Source: Survey of Inputs data.aX 2 = 114.255, df = 2, p < 0.001.bX 2 =27.379, df = 2, Significant, p < 0.001.cX 2 = 45.790, df = 2, Significant, p < 0.001.

28
Table 3.12Availability of Computers for Children (%)
Computers for Children Hyderabad, Indiaa Ga, Ghanab Lagos, Nigeriac
Private recognized/registered Available 49.7 37.2 69.1Unavailable 50.3 62.8 30.9
Private unrecognized/unregistered Available 13.2 12.0 32.6Unavailable 86.8 88.0 67.4
Government Available 1.6 3.3 2.9Unavailable 98.4 96.7 97.1
Source: Survey of Inputs data.aX 2 = 201.228, df = 2, p < 0.001.bX 2 =60.486, df = 2, Significant, p < 0.001.cX 2 = 115.791, df = 2, Significant, p < 0.001.
Table 3.13Availability of Television and/or Video for Children (%)
Television and/or Video Hyderabad, Indiaa Ga, Ghanab Lagos, Nigeriac
Private recognized/registered Available 30.3 8.7 25.8Unavailable 69.7 91.3 74.2
Private unrecognized/unregistered Available 4.9 2.4 10.1Unavailable 95.1 97.6 89.9
Government Available 4.8 0.8 0.0Unavailable 95.2 99.2 100.0
Source: Survey of Inputs data.aX 2 = 99.767, df = 2, p < 0.001.bX 2 =12.045, df = 2, Significant, p < 0.01.cX 2 = 35.148, df = 2, Significant, p < 0.001.
How do government and private schoolscompare in terms of pupil achieve-ment? We explored this issue by exam-
ining pupil achievement in primary schools ina single class or grade (4, 5, or 6), using tests inEnglish, mathematics, and (in Africa) oneother subject, depending on context, togetherwith other cross-sectional data collected fromthe school and families. This section describesthe methodology used to collect studentachievement data and presents the results ofthe student achievement tests.
MethodBecause unrecognized or unregistered pri-
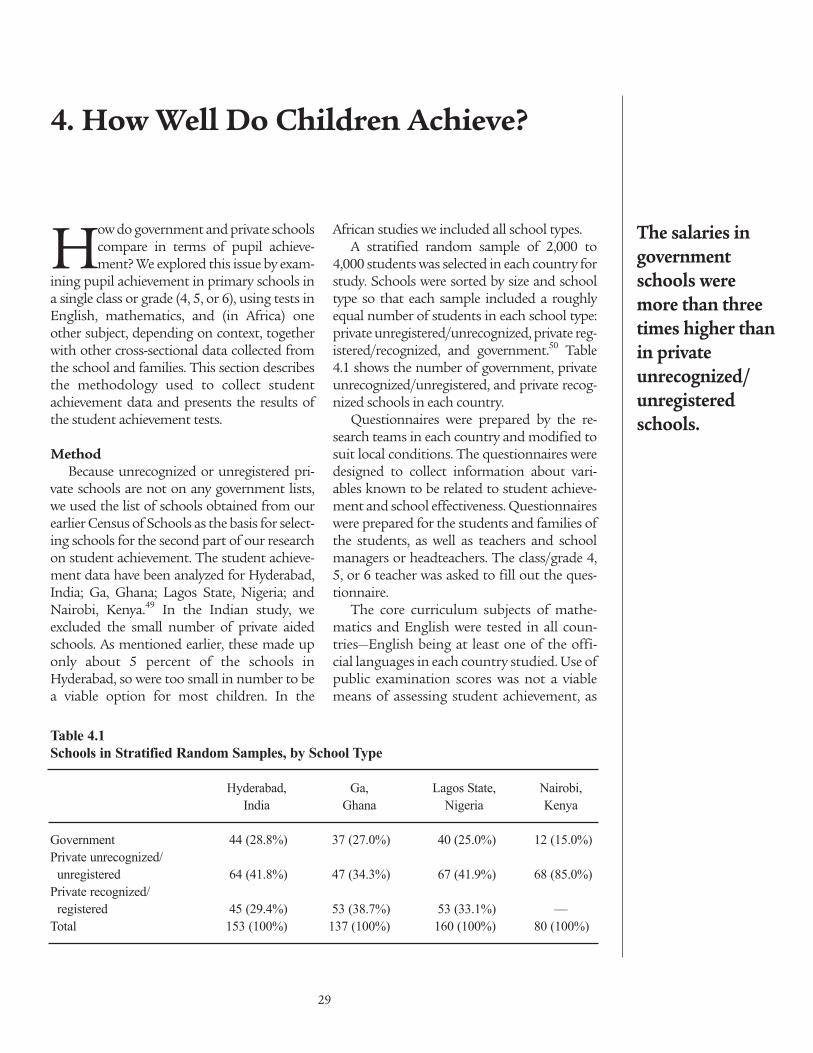
vate schools are not on any government lists,we used the list of schools obtained from ourearlier Census of Schools as the basis for select-ing schools for the second part of our researchon student achievement. The student achieve-ment data have been analyzed for Hyderabad,India; Ga, Ghana; Lagos State, Nigeria; andNairobi, Kenya.49 In the Indian study, weexcluded the small number of private aidedschools. As mentioned earlier, these made uponly about 5 percent of the schools inHyderabad, so were too small in number to bea viable option for most children. In the
African studies we included all school types.A stratified random sample of 2,000 to
4,000 students was selected in each country forstudy. Schools were sorted by size and schooltype so that each sample included a roughlyequal number of students in each school type:private unregistered/unrecognized, private reg-istered/recognized, and government.50 Table4.1 shows the number of government, privateunrecognized/unregistered, and private recog-nized schools in each country.
Questionnaires were prepared by the re-search teams in each country and modified tosuit local conditions. The questionnaires weredesigned to collect information about vari-ables known to be related to student achieve-ment and school effectiveness. Questionnaireswere prepared for the students and families ofthe students, as well as teachers and schoolmanagers or headteachers. The class/grade 4,5, or 6 teacher was asked to fill out the ques-tionnaire.
The core curriculum subjects of mathe-matics and English were tested in all coun-tries—English being at least one of the offi-cial languages in each country studied. Use ofpublic examination scores was not a viablemeans of assessing student achievement, as
29
The salaries ingovernmentschools weremore than threetimes higher thanin private unrecognized/unregisteredschools.
4. How Well Do Children Achieve?
Table 4.1Schools in Stratified Random Samples, by School Type
Hyderabad, Ga, Lagos State, Nairobi,India Ghana Nigeria Kenya
Government 44 (28.8%) 37 (27.0%) 40 (25.0%) 12 (15.0%)Private unrecognized/
unregistered 64 (41.8%) 47 (34.3%) 67 (41.9%) 68 (85.0%)Private recognized/
registered 45 (29.4%) 53 (38.7%) 53 (33.1%) —Total 153 (100%) 137 (100%) 160 (100%) 80 (100%)
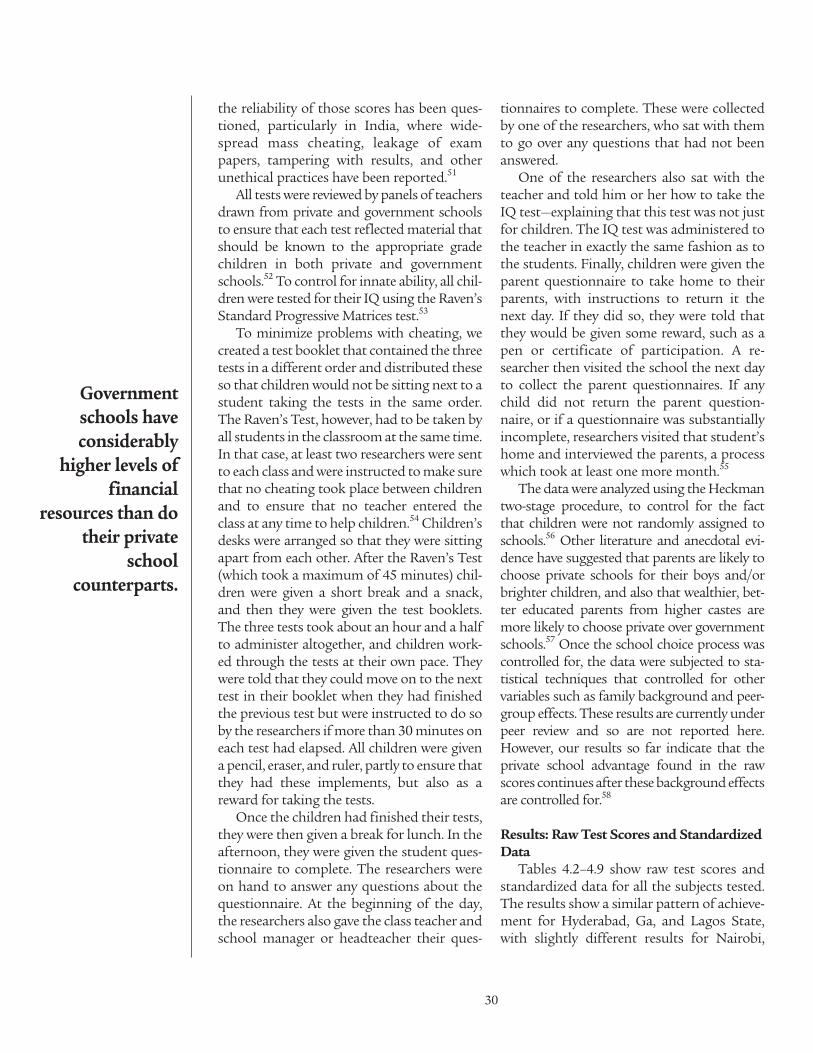
the reliability of those scores has been ques-tioned, particularly in India, where wide-spread mass cheating, leakage of exampapers, tampering with results, and otherunethical practices have been reported.51
All tests were reviewed by panels of teachersdrawn from private and government schoolsto ensure that each test reflected material thatshould be known to the appropriate gradechildren in both private and governmentschools.52 To control for innate ability, all chil-dren were tested for their IQ using the Raven’sStandard Progressive Matrices test.53
To minimize problems with cheating, wecreated a test booklet that contained the threetests in a different order and distributed theseso that children would not be sitting next to astudent taking the tests in the same order.The Raven’s Test, however, had to be taken byall students in the classroom at the same time.In that case, at least two researchers were sentto each class and were instructed to make surethat no cheating took place between childrenand to ensure that no teacher entered theclass at any time to help children.54 Children’sdesks were arranged so that they were sittingapart from each other. After the Raven’s Test(which took a maximum of 45 minutes) chil-dren were given a short break and a snack,and then they were given the test booklets.The three tests took about an hour and a halfto administer altogether, and children work-ed through the tests at their own pace. Theywere told that they could move on to the nexttest in their booklet when they had finishedthe previous test but were instructed to do soby the researchers if more than 30 minutes oneach test had elapsed. All children were givena pencil, eraser, and ruler, partly to ensure thatthey had these implements, but also as areward for taking the tests.
Once the children had finished their tests,they were then given a break for lunch. In theafternoon, they were given the student ques-tionnaire to complete. The researchers wereon hand to answer any questions about thequestionnaire. At the beginning of the day,the researchers also gave the class teacher andschool manager or headteacher their ques-
tionnaires to complete. These were collectedby one of the researchers, who sat with themto go over any questions that had not beenanswered.
One of the researchers also sat with theteacher and told him or her how to take theIQ test—explaining that this test was not justfor children. The IQ test was administered tothe teacher in exactly the same fashion as tothe students. Finally, children were given theparent questionnaire to take home to theirparents, with instructions to return it thenext day. If they did so, they were told thatthey would be given some reward, such as apen or certificate of participation. A re-searcher then visited the school the next dayto collect the parent questionnaires. If anychild did not return the parent question-naire, or if a questionnaire was substantiallyincomplete, researchers visited that student’shome and interviewed the parents, a processwhich took at least one more month.55
The data were analyzed using the Heckmantwo-stage procedure, to control for the factthat children were not randomly assigned toschools.56 Other literature and anecdotal evi-dence have suggested that parents are likely tochoose private schools for their boys and/orbrighter children, and also that wealthier, bet-ter educated parents from higher castes aremore likely to choose private over governmentschools.57 Once the school choice process wascontrolled for, the data were subjected to sta-tistical techniques that controlled for othervariables such as family background and peer-group effects. These results are currently underpeer review and so are not reported here.However, our results so far indicate that theprivate school advantage found in the rawscores continues after these background effectsare controlled for.58
Results: Raw Test Scores and StandardizedData
Tables 4.2–4.9 show raw test scores andstandardized data for all the subjects tested.The results show a similar pattern of achieve-ment for Hyderabad, Ga, and Lagos State,with slightly different results for Nairobi,
30
Governmentschools have considerably
higher levels offinancial
resources than dotheir private
school counterparts.

reflecting the differing circumstances underwhich the student achievement tests wereconducted. In Hyderabad, Ga, and LagosState, all of the private and governmentschools included in our study were located inlow-income areas. In those cases, the datashowed that the slightly wealthier and bettereducated of the low-income families used theprivate schools. In the Nairobi study, howev-er, the private schools were situated in theslums and served only slum children, where-as the government schools were located onthe slum periphery and served middle-classas well as slum children. In that case, the datashowed that the poorer and less educatedparents used the private schools.
For Hyderabad, mean scores in mathe-matics were about 22 percentage points and23 percentage points higher in private unrec-ognized and recognized schools, respectively,than in government schools. The advantagewas even more pronounced for English.
In Ga, the advantage for both types of pri-vate schools was smaller but still large interms of standard deviations, with averagemath scores being about 5 and 12 percentagepoints higher in private unregistered and reg-istered schools, respectively, than in govern-ment schools. In English, the advantage wasabout 8 and 14 percentage points.
In Lagos State, the mean math score advan-tage over government schools was about 14and 19 percentage points, respectively, in pri-vate registered and unregistered schools, whilein English it was 22 and 29 percentage points.
In Kenya, private schools performed at aboutthe same level as government schools in all sub-jects. In math and Kiswahili, the private schoolswere slightly better, while in English, a smalladvantage lay with the government schools. Butthis advantage may be because many of the mid-dle-class children in the government schoolspick up English outside of school—throughwatching television, for example.
31
Although teachersalaries werefound to be considerablyhigher in government than in privateschools, privateschool teacherswere just as satisfied withtheir salaries.
Table 4.2Hyderabad, India—Raw Scores
Subject School Type Mean % Score SD* Cases
Math Government 39.19 25.95 991Private unrecognized 60.82 20.64 1,108Private recognized 62.38 21.21 1,161Total 54.80 24.83 3,260
English Government 22.38 20.57 991Private unrecognized 53.90 19.79 1,108Private recognized 58.69 21.30 1,161Total 46.02 25.91 3,260
Source: Survey of Achievement data. *SD = standard deviation.
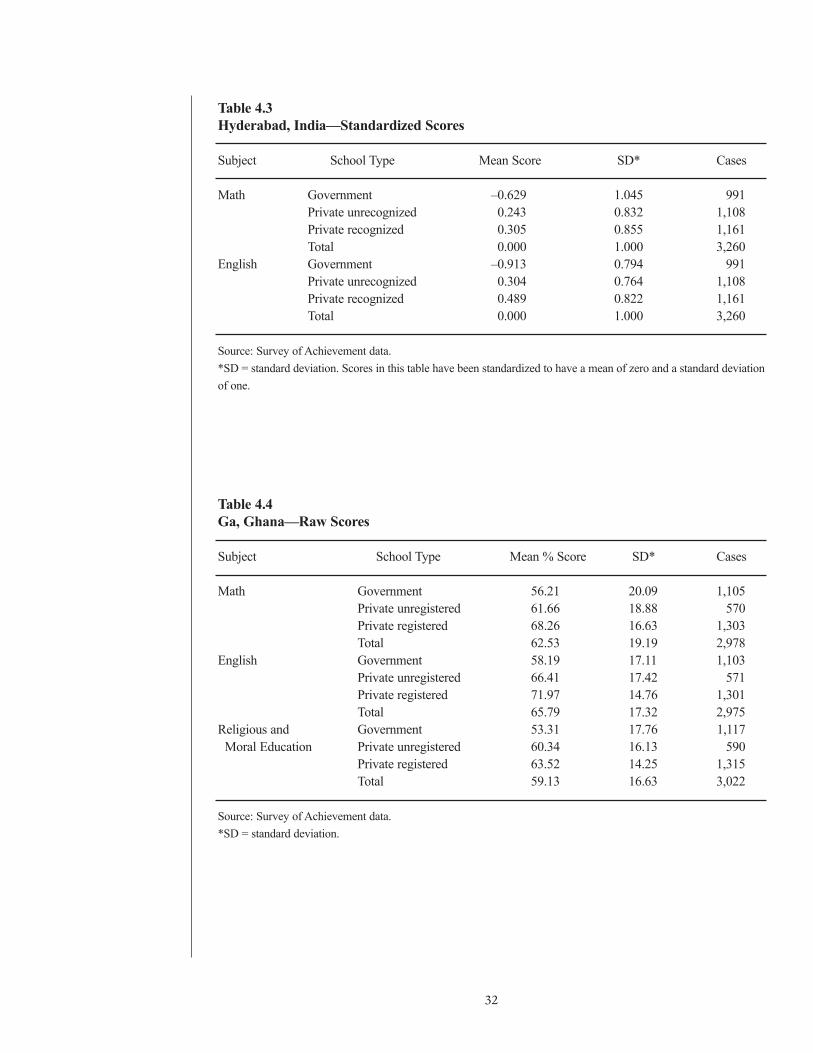
32
Table 4.3Hyderabad, India—Standardized Scores
Subject School Type Mean Score SD* Cases
Math Government –0.629 1.045 991Private unrecognized 0.243 0.832 1,108Private recognized 0.305 0.855 1,161Total 0.000 1.000 3,260
English Government –0.913 0.794 991Private unrecognized 0.304 0.764 1,108Private recognized 0.489 0.822 1,161Total 0.000 1.000 3,260
Source: Survey of Achievement data. *SD = standard deviation. Scores in this table have been standardized to have a mean of zero and a standard deviationof one.
Table 4.4Ga, Ghana—Raw Scores
Subject School Type Mean % Score SD* Cases
Math Government 56.21 20.09 1,105Private unregistered 61.66 18.88 570Private registered 68.26 16.63 1,303Total 62.53 19.19 2,978
English Government 58.19 17.11 1,103Private unregistered 66.41 17.42 571Private registered 71.97 14.76 1,301Total 65.79 17.32 2,975
Religious and Government 53.31 17.76 1,117Moral Education Private unregistered 60.34 16.13 590
Private registered 63.52 14.25 1,315Total 59.13 16.63 3,022
Source: Survey of Achievement data.*SD = standard deviation.
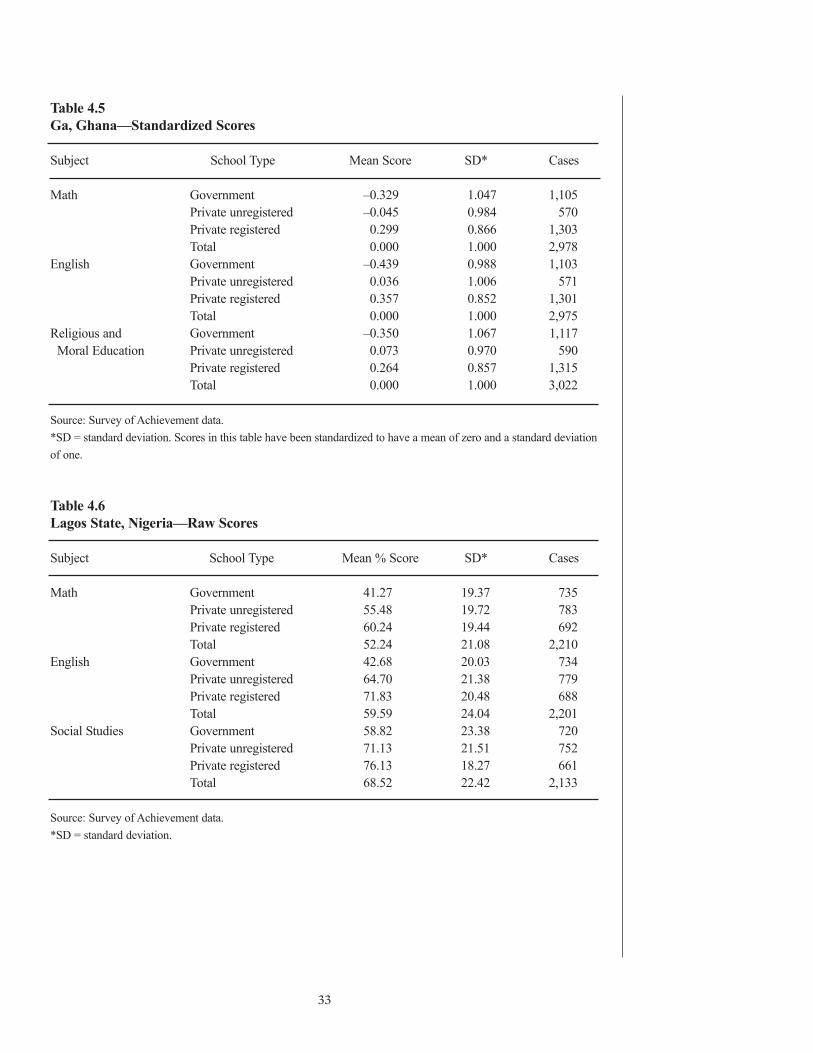
33
Table 4.5Ga, Ghana—Standardized Scores
Subject School Type Mean Score SD* Cases
Math Government –0.329 1.047 1,105Private unregistered –0.045 0.984 570Private registered 0.299 0.866 1,303Total 0.000 1.000 2,978
English Government –0.439 0.988 1,103Private unregistered 0.036 1.006 571Private registered 0.357 0.852 1,301Total 0.000 1.000 2,975
Religious and Government –0.350 1.067 1,117Moral Education Private unregistered 0.073 0.970 590
Private registered 0.264 0.857 1,315Total 0.000 1.000 3,022
Source: Survey of Achievement data. *SD = standard deviation. Scores in this table have been standardized to have a mean of zero and a standard deviationof one.
Table 4.6Lagos State, Nigeria—Raw Scores
Subject School Type Mean % Score SD* Cases
Math Government 41.27 19.37 735Private unregistered 55.48 19.72 783Private registered 60.24 19.44 692Total 52.24 21.08 2,210
English Government 42.68 20.03 734Private unregistered 64.70 21.38 779Private registered 71.83 20.48 688Total 59.59 24.04 2,201
Social Studies Government 58.82 23.38 720Private unregistered 71.13 21.51 752Private registered 76.13 18.27 661Total 68.52 22.42 2,133
Source: Survey of Achievement data. *SD = standard deviation.

34
Table 4.7Lagos State, Nigeria—Standardized Scores
Subject School Type Mean Score SD* Cases
Math Government –0.520 0.919 735Private unregistered 0.153 0.936 783Private registered 0.379 0.922 692Total 0.000 1.000 2,210
English Government –0.703 0.833 734Private unregistered 0.213 0.889 779Private registered 0.509 0.852 688Total 0.000 1.000 2,201
Social Studies Government –0.433 1.043 720Private unregistered 0.116 0.959 752Private registered 0.339 0.815 661Total 0.000 1.000 2,133
Source: Survey of Achievement data.*SD = standard deviation. Scores in this table have been standardized to have a mean of zero and a standard deviationof one.
Table 4.8Nairobi, Kenya—Raw scores
Subject School Type Mean % Score SD* Cases
Math Government 69.87 18.34 1,713Private 70.72 16.80 1,335Total 70.24 17.69 3,048
English Government 68.00 16.12 1,725Private 65.90 16.48 1,318Total 67.09 16.31 3,043
Kiswahili Government 60.97 15.54 1,732Private 64.18 15.75 1,342Total 62.37 15.71 3,074
Source: Survey of Achievement Data. *SD = standard deviation.
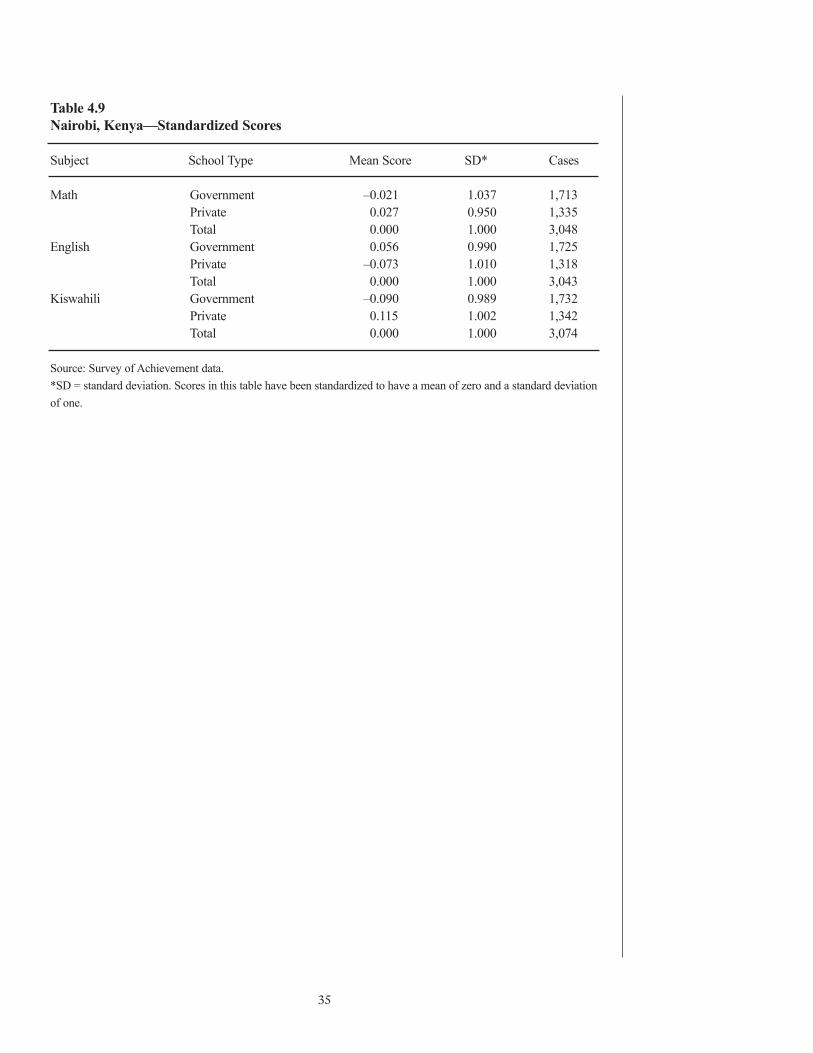
35
Table 4.9Nairobi, Kenya—Standardized Scores
Subject School Type Mean Score SD* Cases
Math Government –0.021 1.037 1,713Private 0.027 0.950 1,335Total 0.000 1.000 3,048
English Government 0.056 0.990 1,725Private –0.073 1.010 1,318Total 0.000 1.000 3,043
Kiswahili Government –0.090 0.989 1,732Private 0.115 1.002 1,342Total 0.000 1.000 3,074
Source: Survey of Achievement data.*SD = standard deviation. Scores in this table have been standardized to have a mean of zero and a standard deviationof one.


Teacher Salaries
We have seen that, in general, studentachievement in private schools serv-ing low-income families is greater
than in government schools. Is achievementgreater because private schools have greaterfinancial resources available to them?
As part of our research, we tried to obtaininformation about the financial resourcesavailable to the different types of schools, butprivate school managers were understand-ably wary of divulging financial details toresearchers. However, we were able to gain atleast some insight into private and govern-ment school financial resources by examin-ing teacher salaries. It should be noted thatalthough teacher salaries are likely to repre-sent the majority of financial resources avail-able to private schools, they do not representthe total level of financial resources going togovernment schools. In the case of govern-
ment schools, funds are also used to financelarge state and local bureaucracies. Suchadministrative bureaucracies will be minimalfor private registered and recognized schoolsand nonexistent for private unregistered andunrecognized schools.59
Table 5.1 shows average monthly teachersalaries in Hyderabad, India; Ga, Ghana; andLagos State, Nigeria, as well as the ratio ofsalaries to those in the private unrecognized orunregistered schools. (The same data areshown graphically in Figures 5.1–5.3.)60 In allthree cases, the salaries in government schoolswere more than three times higher than in pri-vate unrecognized/unregistered schools. InHyderabad and Lagos State, salaries in govern-ment schools were nearly four times thereported private school salaries. Table 5.2shows the same situation with regard toNairobi, Kenya, with additional informationon the number of teachers surveyed. (The
37
5. How Well Are Private SchoolsFunded, and Do All Pupils Pay Fees?
Table 5.1Average Monthly Teacher Salaries, by School Type
Hyderabad, India Ga, Ghana Lagos State, NigeriaAverage Monthly Ratio of Salaries Average Monthly Ratio of Salaries Average Monthly Ratio of Salaries
Salaries of to Private Salaries of to Private Salaries of to PrivateFull-time Teachers Unrecognized Full-time Teachers Unregistered Full-time Teachers Unregistered
(rupees) Salaries (cedis) Salaries (naira) Salaries
Government 4,568 3.86 950,346 3.39 20,781 3.71($105.04) ($105.01) ($151.96)
Private unaided 1,182 1.00 280,333 1.00 5,598 1.00unrecognized/ ($27.18) ($30.98) ($40.94)unregistered
Private unaided 1,964 1.66 449,771 1.60 6,415 1.15recognized/ ($45.16) ($49.70) ($46.91)registered
Total 2,176 1.84 514,532 1.84 9,389 1.68($50.03) ($56.85) ($68.66)
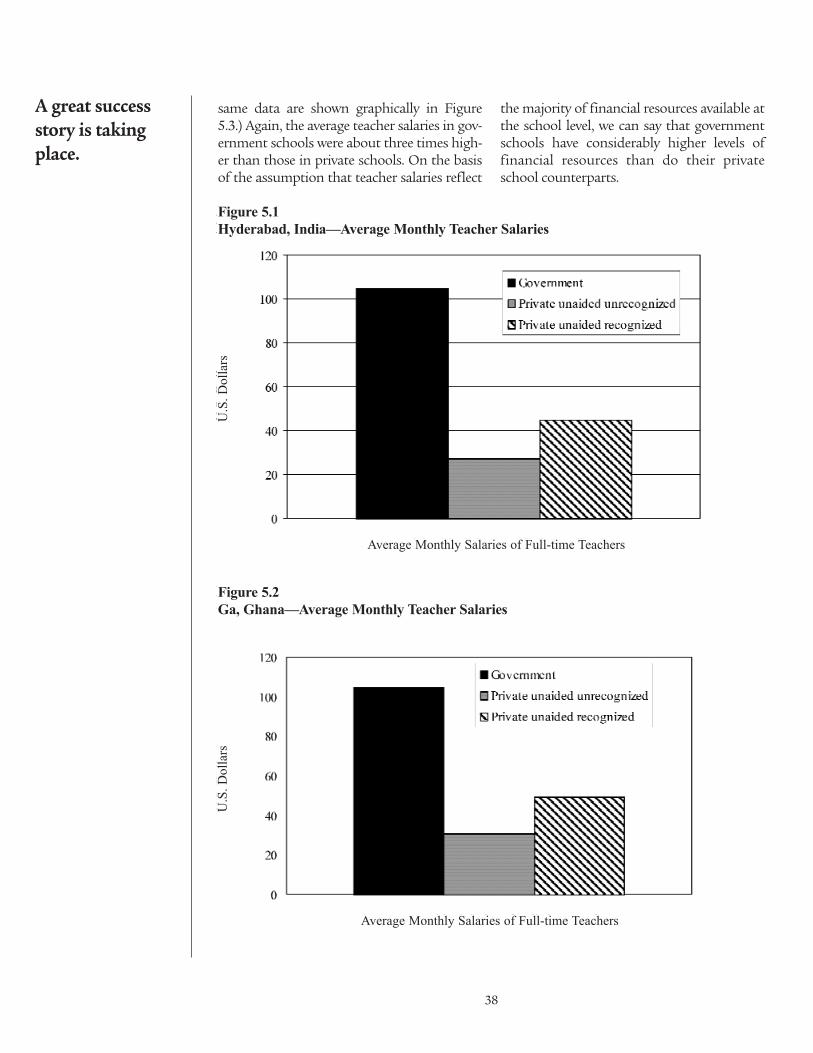
same data are shown graphically in Figure5.3.) Again, the average teacher salaries in gov-ernment schools were about three times high-er than those in private schools. On the basisof the assumption that teacher salaries reflect
the majority of financial resources available atthe school level, we can say that governmentschools have considerably higher levels offinancial resources than do their privateschool counterparts.
38
A great successstory is takingplace.
Figure 5.1Hyderabad, India—Average Monthly Teacher Salaries
Average Monthly Salaries of Full-time Teachers
Average Monthly Salaries of Full-time Teachers
Figure 5.2Ga, Ghana—Average Monthly Teacher Salaries
U.S
. Dol
lars
U.S
. Dol
lars
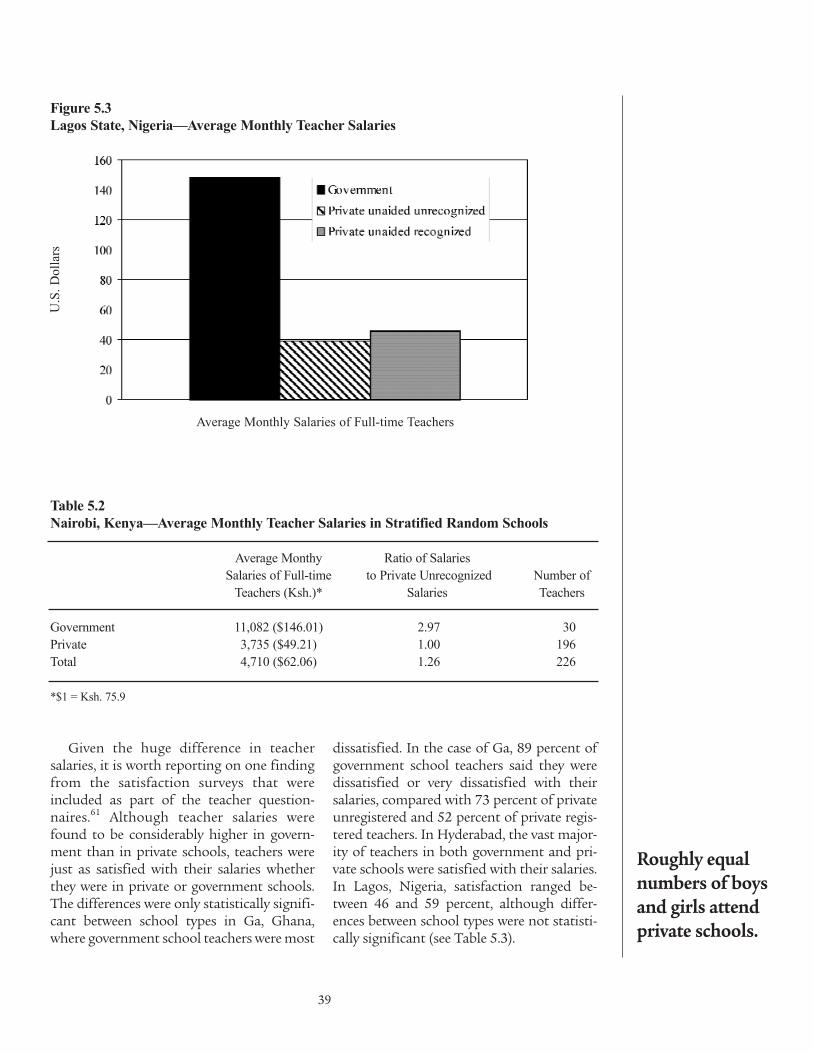
39
Roughly equalnumbers of boysand girls attendprivate schools.
Figure 5.3Lagos State, Nigeria—Average Monthly Teacher Salaries
Average Monthly Salaries of Full-time Teachers
Table 5.2Nairobi, Kenya—Average Monthly Teacher Salaries in Stratified Random Schools
Average Monthy Ratio of SalariesSalaries of Full-time to Private Unrecognized Number of
Teachers (Ksh.)* Salaries Teachers
Government 11,082 ($146.01) 2.97 30Private 3,735 ($49.21) 1.00 196Total 4,710 ($62.06) 1.26 226
*$1 = Ksh. 75.9
Given the huge difference in teachersalaries, it is worth reporting on one findingfrom the satisfaction surveys that wereincluded as part of the teacher question-naires.61 Although teacher salaries werefound to be considerably higher in govern-ment than in private schools, teachers werejust as satisfied with their salaries whetherthey were in private or government schools.The differences were only statistically signifi-cant between school types in Ga, Ghana,where government school teachers were most
dissatisfied. In the case of Ga, 89 percent ofgovernment school teachers said they weredissatisfied or very dissatisfied with theirsalaries, compared with 73 percent of privateunregistered and 52 percent of private regis-tered teachers. In Hyderabad, the vast major-ity of teachers in both government and pri-vate schools were satisfied with their salaries.In Lagos, Nigeria, satisfaction ranged be-tween 46 and 59 percent, although differ-ences between school types were not statisti-cally significant (see Table 5.3).
U.S
. Dol
lars

40
Children in private unaidedschools usually
perform better interms of raw
scores than dochildren in
governmentschools.
Table 5.3Teacher Satisfaction with Salary (%)
Hyderabad, Ga, Lagos, Salary Indiaa Ghanab Nigeriac
Private recognized/ Very satisfied or satisfied 88.1 48.1 46.0registered Dissatisfied or very dissatisfied 11.9 51.9 54.0
Private unrecognized/ Very satisfied or satisfied 91.9 26.7 50.8unregistered Dissatisfied or very dissatisfied 8.1 73.3 49.2
Government Very satisfied or satisfied 88.1 11.1 58.8Dissatisfied or very dissatisfied 11.9 88.9 41.2
Source: Satisfaction survey.aX 2 = 0.571, df = 2, Not significant, p > 0.05.bX 2 = 14.184, df = 2, Significant, p < 0.01.cX 2 = 1.332, df = 2, Not significant, p > 0.05.
Private School PhilanthropyOne notable feature of the private unaided
schools in our study is that, although theycharge fees and are run on business principles,they also offer free or concessionary (reducedfee) seats to some children. We specifically askedquestions about this aspect of private schooloperation on the school and parent question-naires as well as in interviews with a small num-ber of parents and school managers. Figure 5.4shows the results for Hyderabad, but similarpractices take place in each country.62
Of those schools giving information, 71percent of unrecognized and 78 percent of rec-ognized private unaided schools offer freeplaces to some students. Regarding conces-sionary places, 84 percent of unrecognizedand 83 percent of recognized private unaidedschools offer them. The total number of freeseats given was 2,978 (1,731 in unrecognizedand 1,247 in recognized private unaidedschools), and the total number of concession-ary places was 4,768 (2,992 in unrecognizedand 1,776 in recognized private unaidedschools).
Out of a total of 43,852 children attend-ing the private unaided schools (i.e., all theschools, including those that don’t offer freeor concessionary places), 2,978 were givenfree seats and 4,768 had concessionary seats.That is, at least 6.8 percent had free places,
and 10.9 percent had concessionary seats.Altogether, at least 17.7 percent of children inprivate unaided schools had free or conces-sionary places provided for them. Note thatthese figures do not include schools that didnot report information, so the results shouldbe taken as a low estimate of the actual num-ber of free or concessionary seats.
Why do private unaided schools offer free orconcessionary places? We asked a small numberof school managers. Their reasons included suchthings as the following: “To keep the drop-outrate from increasing.” “To help the poorest par-ents by providing education at the cheapestrates.” “To uplift the standard of education byoffering services to the poorest in the slum areas.”“To help the poor[est] among the poor withoutany return from them.” “To gain a good reputa-tion for the school within the community.”
The last answer illustrates that giving freeor concessionary places may not only assistthose in need but can also be a valuable way ofraising the profile and reputation of theschool in the community. That is also the casewhen “very bright” children are assisted.Assisting such children helps the schoolimprove its reputation when exam results arepublished. Although free or reduced-fee seatsmay be provided for the purpose of boosting aschool’s reputation, clearly very poor familiesare helped as a result.

41
Figure 5.4Hyderabad, India—Free and Concessionary Seats in Private Unaided Schools


Many observers have expressed concernthat the mushrooming of private unaidedschools in sub-Saharan Africa and South Asiamay be undesirable. It is accepted by somecommentators that private unaided schoolsare now widespread in low-income areas suchas city slums and villages. But there are worriesexpressed about the quality of education that isprovided in this low-cost sector, for if schoolscharge such low fees and pay teachers so little,how can they offer a high-quality education?
Concerns are also expressed about theinequity that private education for the poorbrings, for as growing numbers of parentstake their children from government schools,it is argued that only the poorest are left. Thisseems unfair to those who are left behind.
Through our detailed two-year research inlow-income areas of Hyderabad, India; Ga,Ghana; Lagos State, Nigeria; and Nairobi, Kenya,we have found challenges to all of those assump-tions.63 The major findings of our research aresummarized in the following sections.
The Majority of Poor Parents ChoosePrivate Unaided Schools for TheirChildren
First, we have shown that the private sectoris indeed huge, with a large majority of schoolchildren—around 65 percent or more—en-rolled in private unaided schools. A large pro-portion of these are enrolled in unrecognizedor unregistered private schools—in some casesthe same proportion or more as are in govern-ment schools. Contrary to some expectations,roughly equal numbers of boys and girlsattend private schools—it is not the case thatparents send only or mainly their boys tothem. The private unaided schools, moreover,have better pupil-teacher ratios, higher teachercommitment, and sometimes better facilitiesthan government schools.
Higher Achievement Is Attained inPrivate Unaided than in GovernmentSchools
Children in private unaided schools usu-ally perform better in terms of raw scoresthan do children in government schools inthree curriculum subjects, including mathe-matics and English. Moreover, private unaid-ed schools achieve these results at betweenhalf and a quarter of the per pupil teachercost. Although teachers are paid considerablyless in private unaided schools, they are notany less satisfied than their governmentschool counterparts.
Teacher Costs Are Significantly Less inPrivate Unaided Schools Than inGovernment Schools
The private unaided school advantage isachieved for considerably less expenditure onteachers—which is likely to make up themajority of recurrent in-school expenditures—than in government schools. In general, theaverage monthly teacher salary in a govern-ment school is between three and four timeshigher than in an unrecognized or unregis-tered private school. Despite this, teacher sat-isfaction with salaries is not lower in privatethan in government schools and, in manycases, is higher. Apart from teacher salarycosts, government schools are supported by ahugely expensive state bureaucracy, which alsoneeds to be taken into account in any compar-ison of school costs. These additional costswill either be minimal or nonexistent for pri-vate schools.
Gender Equity Is Maintained in PrivateUnaided School Enrollment
In general, roughly half of pupil enrollmentin private unaided schools is female—althoughin the Indian case, because more pupils in
43
There was a significantlyhigher level ofteaching going onin private unaided schoolsthan in governmentschools.
Conclusions and Implications

school are female, boys are more likely to befound in private schools. However, in theAfrican cases, gender equity in pupil enroll-ment is maintained.
School Enrollment Is UnderestimatedBecause many children are in unrecog-
nized private schools that do not appear ingovernment statistics, overall enrollment ismuch higher than official figures suggest.This means that “education for all” may bemuch easier to achieve than is currentlybelieved. In Hyderabad, the 80,000 children inprivate unrecognized schools not counted inofficial statistics could bring the proportionof out-of-school children down from 16 per-cent to 6 percent or lower. In Lagos State, theexistence of private unregistered schoolswould reduce the percentage of out-of-schoolchildren from 50 percent to 26 percent.
Free Primary Education Serves to CrowdOut Private Schools and Does NotIncrease Overall Enrollment
In Kenya, we were able to observe theimpact of free primary education on privateschool enrollment in the slums. Despite thefact that huge increases in enrollment havebeen noted in government schools by com-mentators, our research suggests that, atbest, this additional enrollment is fictitious.Instead, children appear to have transferredfrom private to government schools. Giventhe advantages of private schools and prob-lems found in government schools, this maynot really be to their advantage.
Better Pupil-Teacher Ratios Prevail inPrivate Unaided than in GovernmentSchools
Pupil-teacher ratios in unrecognized orunregistered private schools are usuallyabout half those in government schools,although, in the case of Nairobi, they may bea third lower.
More Teaching Is Occurring in PrivateThan in Government Schools
In all cases, when researchers called unan-
nounced on classrooms, there was a signifi-cantly higher level of teaching going on inprivate unaided schools than in governmentschools. In Hyderabad, the percentage ofteachers teaching in private recognizedschools was 98 percent, and 91 percent in pri-vate unrecognized schools, compared withonly 75 percent in the government schools.In Ga, the parallel figures were 75 percent, 66percent, and 57 percent.
The Poorest Children Are Given Free orSubsidized Seats in Private Schools
Notwithstanding the fact that privateschools depend almost entirely on incomefrom pupils to survive, many offer free orreduced-fee places to those most in need. InHyderabad, we suggest that nearly one in fiveof all children in private unaided schools havefree or concessionary seats provided for them:7 percent have free places, and 11 percent haveconcessionary seats. The poor are subsidizingthe poorest to attend private school.
ImplicationsNone of these findings, of course, mean
that nothing could be improved in the pri-vate sector serving the poor. First, access toprivate education could be extended evenfurther by building on the initiatives alreadyundertaken by the private schools themselvesthat offer free and reduced-fee seats to thepoorest children. Such informal schemescould be extended and replicated by philan-thropists and/or the state so that “pupil pass-ports” or vouchers could be targeted at thepoorest children (although there may be dan-gers of additional regulations that could sti-fle the growth of private schools if these wereadministered by the state). With these, manymore of the poor could be empowered toattend private unaided schools.
Private school managers themselves real-ize that their school infrastructure and facili-ties can be improved, and many are active increating private school federations or associ-ations that link together school managers inself-help organizations. Such associations areactively pursuing management and teacher
44
The poor are subsidizing the
poorest to attendprivate school.
training and curriculum development, aswell as challenging the regulatory regimesimposed by government. They could be sup-ported in their endeavors, perhaps throughthe creation of a global network of privateschools and their associations that wouldconduct further research and disseminateinformation about the role of private schoolsfor the poor to opinion leaders and policy-makers. Such networks could reward innova-tion and excellence in the schools and mobi-lize additional resources to help withimprovements.
As a parallel activity to our research inNigeria and Hyderabad, the research teamshave been active in mobilizing resources forthe creation of two revolving loan funds tohelp private schools improve their facilities.
Schools are borrowing up to $1,000 to buildnew classrooms, equip libraries and laborato-ries, and improve teacher training. Such loanfunds could be extended and replicated toenable more children to access education inan even better, safer, and more educationallyconducive environment. Other educationalservices could be offered to help privateunaided schools improve and better servetheir communities.
Rather than assume that the privateunaided education sector is a problem, weshould see it as a great strength. It is a dynam-ic demonstration of how the entrepreneurialtalents of people in Africa and India can force-fully contribute to the improvement of edu-cation, even for the poor. Its existence andflourishing should be a cause for celebration.
45
Rather thanassume that theprivate unaidededucation sectoris a problem, weshould see it as agreat strength.


1. K. Watkins, The Oxfam Education Report (Oxford:Oxfam in Great Britain, 2000), pp. 229–30.
2. Y. Aggarwal, Public and Private Partnership inPrimary Education in India: A Study of UnrecognizedSchools in Haryana (New Delhi: National Instituteof Educational Planning and Administration,2000), p. 20. Unrecognized schools are in effectoperating in the informal sector of the economy.They either have not applied for recognition orhave not succeeded in gaining recognition fromthe government.
3. A. De, M. Majumdar, M. Samson, and C.Noronha, “Private Schools and Universal ElementaryEducation,” in R. Govinda, ed., India Education Report:A Profile of Basic Education (Oxford and New Delhi:Oxford University Press, 2000), p. 148.
4. G. Nambissan, Educational Deprivation andPrimary School Provision: A Study of Providers in theCity of Calcutta, IDS Working Paper 187, Instituteof Development Studies, University of Sussex,Brighton (2003), p. 52.
5. P. Rose, “Is the Non-State Education SectorServing the Needs of the Poor? Evidence from Eastand Southern Africa,” Paper prepared for DfIDSeminar in preparation for 2004 World Develop-ment Report (2002), p. 6; and P. Rose, “From theWashington to the Post-Washington Consensus:The Influence of International Agendas on Edu-cation Policy and Practice in Malawi,” Globalisation,Societies and Education 1, no. 1 (2003): 80.
6. A. Baurer, F. Brust, and J. Hybbert, “Entrepreneur-ship: A Case Study in African Enterprise Growth,Expanding Private Education in Kenya: Mary Okeloand Makini Schools,” Chazen Web Journal of Inter-national Business (Columbia Business School), Fall2002.
7. P. Bennell, Teacher Motivation and Incentives inSub-Saharan Africa and Asia, Knowledge and Skillsfor Development, Brighton (2004), p. iv.
8. The Probe Team, Public Report on Basic Educationin India (Oxford and New Delhi: Oxford UniversityPress, 1999), p. 47.
9. Ibid, p. 63.
10. Ibid., p. 102.
11. Nambissan, note 4; The Probe Team, note 8; M.Kremer, K. Mularidharan, N. Chaudhury, J. Hammer,and H. Rogers, “Teacher Absence in India,” Journal ofthe European Economic Association 3, nos. 2–3 (2005):658–67; J. Habyarimana, J. Das, S. Dercon, and P.Krishnan, Sense and Absence: Absenteeism and Learning inZambian Schools (Washington: World Bank, 2004);Aggarwal, note 2; K. Rana, A. Rafique, and A.Sengupta, The Delivery of Primary Education: A Study inWest Bengal (TLM Books in association with thePratichi Trust, Delhi, 2002).
12. C. C. Nwagwu, “The Environment of Crises inthe Nigerian Education System,” ComparativeEducation 33, no. 1 (1997).
13. G. Lassibille, J. Tan, and S. Sumra, “Expansionof Private Secondary Education: Experience andProspects in Tanzania,” Impact Evaluation of Edu-cation Reforms, Working Paper Series no. 12(Washington, D.C.: World Bank, 1998), p. 38.
14. Nambissan, note 4; De et al., note 3, pp.131–50.
15. D. Cox and E. Jimenez, “The Relative Effective-ness of Private and Public Schools: Evidence fromTwo Developing Countries,” Journal of DevelopmentEconomics 34 (1989): 99–121.
16. G. Lassibille and J. Tan, “Are Private SchoolsMore Efficient Than Public Schools? Evidencefrom Tanzania,” Education Economics 9, no. 2(2001): 145–72.
17. Private unaided schools are entirely privatelymanaged and privately funded and are of two types:recognized and unrecognized. Unrecognized schoolsare in effect operating in the informal sector of theeconomy. They either have not applied for recogni-tion or have not succeeded in gaining recognitionfrom the government. Private aided schools are pri-vately managed but have teacher salaries paid by gov-ernment. Government schools are totally fundedand managed by some level of government.
18. G. Kingdon, “The Quality and Efficiency ofPrivate and Public Education: A Case Study inUrban India,” Oxford Bulletin of Economics andStatistics 5, no. 1 (1996).
19. P. Druaisamy and T. P. Subramanian, “Costs,Financing and Efficiency of Public and Private
47
Notes
Schools in Tamil Nadu,” in J. B. G. Tilak, ed.,Financing Education in India: Current Issues andChanging Perspectives (Delhi: Ravi Books, 2003).
20. R. Govinda and N. V. Varghese, Quality of PrimarySchooling in India: A Case Study of Madhya Pradesh(Delhi: International Institute for EducationalPlanning, National Institute of EducationalPlanning and Administration, 1993), p. 265.
21. Watkins, note 1, p. 230.
22. Ibid.
23. United Nations, Human Development Report 2003:Millennium Development Goals—A Compact amongNations to End Human Poverty (New York: UnitedNations Development Program, 2003), p. 115.
24. Nambissan, note 4.
25. Ibid., p. 15, footnote 25.
26. Further research is ongoing in other parts ofIndia and China, which will be reported in afuture publication.
27. Watkins, note 1, Appendix 1.
28. In Kenya, we conducted our research inKibera, the largest urban slum of Nairobi. JamesShikwati, director of the Inter-Region EconomicNetwork, Nairobi, was team leader. We also con-ducted parallel research in the slums of Mukuruand Kawangware in Nairobi, not reported here,which produced similar findings.
29. In Lagos State, the research team leader was Dr.Olanrewaju Olaniyan, of the Department ofEconomics at the University of Ibadan, Nigeria’spremier university. Using official data, Dr. Olaniyanclassified areas as “poor” or “nonpoor,” with the for-mer featuring overcrowded housing with poordrainage, poor sanitation and lack of potable water,and prone to occasional flooding. We report on ourfindings from only those “poor” areas. We separate-ly looked at the urban shanty town of Makoko, inthe Mainland local government area, where perhaps50,000 people live, many residing in houses built onstilts sunk into the Lagos lagoon.
30. The three zones of Bandlaguda, Bhadurpura,and Charminar together have a population ofabout 800,000 (about 22 percent of Hyderabad’speople) and cover an area of some 19 squaremiles. We included only schools that were foundin “slums,” as determined by the latest availablecensus and Hyderabad municipal guides. Thesewere areas that lacked amenities such as indoorplumbing, running water, electricity, and pavedroads. The team leader was S. V. Gomathi, direc-tor of the Educare Trust. We are also conducting
a parallel study in Mahboobnagar, one of themost impoverished rural areas in AndhraPradesh. The results of this research will bereported in a future publication.
31. In Ghana, our research was conducted in asso-ciation with the University of Cape Coast andEducational Assessment and Research Centre,Accra. Dr. Isaac Amuah was team leader. We choseto conduct our research in the Ga district, whichsurrounds the country’s capital city of Accra andis classified by the Ghana Statistical Service as alow-income suburban and rural area. The GhanaPoverty Reduction Strategy Document (GADistrict Planning Coordinating Unit, 2004) sug-gests that about 70 percent of the population of500,000 lives at or below the poverty line. Gaincludes poor fishing villages along the coast,subsistence farms inland, as well as large dormi-tory towns for workers serving the industries andbusinesses of Accra itself; most of the districtlacks basic social amenities such as potable water,sewerage systems, electricity, and paved roads.
32. See, for example, Kingdon, note 18.
33. Many church schools were nationalized inGhana and Nigeria and operate now as govern-ment schools, but with some vestiges of privatemanagement under state regulations. These arerather like the Anglican and Catholic schools inthe United Kingdom, funded by the state butmanaged by the church under state regulations.
34. Lagos State Government, Report from LagosState to the Joint Consultative Committee onEducational Planning (JCCEP) Reference Committeeon Educational Planning Holding at Owerri, ImoState, April 18–23, 2004, Ministry of Education,Alausa, Ikeja, p. 29.
35. The research team also found one private sec-ondary school and one nursery school. Thesewere not included in this survey.
36. Data were obtained from the Azim PremjiFoundation Web site, Andhra Pradesh Programmes,www.indianngos.com/azimpremjifoundation/andhrapradesh.htm.
37. Lagos State Economic and Empowerment Devel-opment Strategy (LASEEDS), 2004, www.lagosstate.gov.ng/LASEEDS/LASEEDS%20DOCUMENT.pdf.
38. $1 = rupees 43.49.
39. $1 = cedis 9,050.
40. $1 = naira 136.75.
41. Note that the surveys were done in late 2003and early 2004.
48

42. In Ghana, we combined the first two categories.
43. Free primary education was introduced inJanuary 2003.
44. The Nation (Nairobi), November 23, 2004.
45. We intentionally excluded secondary andnursery school students for schools that enrolledthese students as well.
46. Many owners of private schools still in opera-tion reported to us that they were finding itincreasingly difficult to cope with decreasing stu-dent numbers, and several thought that theywould be forced out of business soon unlesssomething drastic happened.
47. If there was an assembly or break period, theresearcher waited until after these had finished.
48. Many private unregistered schools used wood-en combined benches and desktops, which werenot classified by the researchers as “desks.”
49. Further studies are ongoing in Delhi, India;Mahboobnagar (rural Andhra Pradesh), India;and Gansu Province, China. Results of these stud-ies will be reported later.
50. We grouped schools in each of the three man-agement types into 21 size groups, with the aim ofensuring all school sizes were represented within thesample. In the India, Ghana, and Nigeria studies, wealso aimed to restrict the number of children to besampled in any one school to 30. If classes were larg-er than 30, the first 30 children (15 boys and 15 girls,or the maximum number of either gender if therewere fewer than 15) on the register were selected fortesting. Again, this was to avoid the sample beingskewed toward pupils from larger schools. TheKenya case was unique in that we had only a smallnumber of government schools, so we had to testlarger numbers of children in the governmentschools to create a large enough sample.
51. Kingdon, note 18, footnote 8.
52. In India, tests in mathematics and English wereadapted from standardized tests constructed byNIIT Ltd, Delhi, with advice from the State Councilfor Educational Research and Teaching (SCERT) inHyderabad. In the African countries, we used math-ematics and English tests developed for USAID bythe Educational Assessment and Research Centre(EARC), Accra, Ghana. These tests were modified onthe basis of discussions with focus groups broughttogether by the University of Cape Coast (Ghana),the University of Ibadan (Nigeria), and the Inter-Region Economic Network (Kenya). A third test wasused in the African countries as follows: Ghana—a
religious and moral education test developed byEARC; Nigeria—a test in social studies was preparedby educators at the University of Ibadan in conjunc-tion with local teachers; and Kenya—a test inKiswahili was prepared by the Inter-RegionEconomic Network with local teachers and universi-ty experts. All tests were pilot tested with about 80children chosen equally from private unaided andgovernment schools. The internal consistency relia-bility of each test was calculated using the Kuder-Richardson 20 (KR20) coefficient, which was high inall cases. In order to have a roughly normal distribu-tion of results, a few questions were omitted, and themodified tests were again tested with approximatelythe same number of children in different schoolsand the reliability and distribution checked. None ofthe children who took part in the pilot testing par-ticipated in later tests.
53. This test had the advantage of being symbol-rather than language-based. All researchers partici-pated in a one-day training period during whichthey were shown the correct procedure for adminis-tering the Raven’s Test. To ensure that childrenunderstood how to take the test, researchers couldprovide instructions in whatever vernacular lan-guage suited the students in question. The first fivequestions of the test were designed to show whetheror not students understood how to take the test. Ifthey did, then they would get the first five questionscorrect. Researchers were instructed to check thatthese questions were correctly answered and, if not,to explain again to the children the method for tak-ing the test using the first two questions as exem-plars. Any IQ tests that did not have the first fivequestions correct were discarded in the analysis.
54. If there were additional children in the classwho were not tested, they were usually moved to aseparate classroom with the teacher.
55. The collected tests were marked by anothergroup of student researchers and all data fromtests and questionnaires entered into the StatisticalPackage for the Social Sciences by the team leadersonce the research period had expired. The IQs werenormed using Bombay norms published by Delhipsychologists (no African norms were available).
56. In Kenya, it was not possible to conduct thisstatistical procedure because of the way the gov-ernment schools were sampled.
57. See, for example, Kingdon, note 18.
58. In the Kenya study, our analysis shows privateschools outperforming government schools in allsubjects.
59. Data on teacher salaries were obtained from theteacher questionnaires, which were administered to
49

one teacher in each of the sample schools inHyderabad, Ga, and Lagos State. In the Nairobisample, questionnaires were given to an average ofabout three teachers in each school.
60. These data were collected from one teacher ineach of the survey schools.
61. Findings from the satisfaction surveys will be
reported in full elsewhere.
62. Of the 109 private unaided schools takingpart in our study, 99 school managers gave infor-mation about the number of free places, and 86gave information about concessionary places.
63. Additional studies of other settings are underway or under analysis.
50

51
James Tooley is professor of education policy at the University of Newcastle and directorof the E. G. West Centre. He directed the global study of investment opportunities for privateeducation in developing countries for the International Finance Corporation—the privatefinance arm of the World Bank—which led to his book The Global Education Industry, now in its2nd edition. Professor Tooley has also done considerable consultancy work for the IFC, WorldBank (IBRD), UN, UNESCO, and Asian Development Bank Institute on private education indeveloping countries. He is the author of Reclaiming Education and coeditor of What AmericaCan Learn from School Choice in Other Countries.
Pauline Dixon is international research coordinator of the E. G. West Centre in the Schoolof Education at the University of Newcastle. She is the author and coauthor of numerousstudies and journal articles on private education in the developing world.
About the Authors
Cato InstituteFounded in 1977, the Cato Institute is a public policy research foundation dedicated to broad-
ening the parameters of policy debate to allow consideration of more options that are consistentwith the principles of limited government, individual liberty, and peace. To that end, the Institutestrives to achieve greater involvement of the intelligent, concerned lay public in questions of pol-icy and the proper role of government.
The Institute is named for Cato’s Letters, libertarian pamphlets that were widely read in theAmerican Colonies in the early 18th century and played a major role in laying the philosophicalfoundation for the American Revolution.
Despite the achievement of the nation’s Founders, today virtually no aspect of life is free fromgovernment encroachment. A pervasive intolerance for individual rights is shown by govern-ment’s arbitrary intrusions into private economic transactions and its disregard for civil liberties.
To counter that trend, the Cato Institute undertakes an extensive publications program thataddresses the complete spectrum of policy issues. Books, monographs, and shorter studies arecommissioned to examine the federal budget, Social Security, regulation, military spending, inter-national trade, and myriad other issues. Major policy conferences are held throughout the year,from which papers are published thrice yearly in the Cato Journal. The Institute also publishesthe quarterly magazine Regulation.
In order to maintain its independence, the Cato Institute accepts no government funding.Contributions are received from foundations, corporations, and individuals, and other revenue isgenerated from the sale of publications. The Institute is a nonprofit, tax-exempt, educational foun-dation under Section 501(c)3 of the Internal Revenue Code.
CATO INSTITUTE1000 Massachusetts Ave., N.W.
Washington, D.C. 20001www.cato.org


1000 Massachusetts Ave., N.W., Washington, D.C. 20001 www.cato.org
$10.00