prioritizing burn-injured patients during a disaster · 2016-07-12 · chan et al.: prioritizing...
TRANSCRIPT

MANUFACTURING & SERVICEOPERATIONS MANAGEMENT
Vol. 15, No. 2, Spring 2013, pp. 170–190ISSN 1523-4614 (print) � ISSN 1526-5498 (online) http://dx.doi.org/10.1287/msom.1120.0412
© 2013 INFORMS
Prioritizing Burn-Injured Patients During a Disaster
Carri W. Chan, Linda V. Green, Yina LuDecision, Risk, and Operations, Columbia Business School, Columbia University, New York, New York 10027
{[email protected], [email protected], [email protected]}
Nicole Leahy, Roger YurtNew York-Presbyterian Hospital/Weill Cornell Medical Center, New York, New York 10065
{[email protected], [email protected]}
The U.S. government has mandated that, in a catastrophic event, metropolitan areas need to be capableof caring for 50 burn-injured patients per million population. In New York City, this corresponds to 400
patients. There are currently 140 burn beds in the region, which can be surged up to 210. To care for additionalpatients, hospitals without burn centers will be used to stabilize patients until burn beds become available.In this work, we develop a new system for prioritizing patients for transfer to burn beds as they becomeavailable and demonstrate its superiority over several other triage methods. Based on data from previous burncatastrophes, we study the feasibility of being able to admit 400 patients to burn beds within the critical three-to five-day time frame. We find that this is unlikely and that the ability to do so is highly dependent on the typeof event and the demographics of the patient population. This work has implications for how disaster plans inother metropolitan areas should be developed.
Key words : healthcare; disaster planning; triageHistory : Received: December 23, 2011; accepted: August 7, 2012. Published online in Articles in Advance
December 19, 2012.
1. IntroductionFollowing the terrorist attacks on September 11, 2001,the U.S. government initiated the development of dis-aster plans for resource allocation in a bioterrorismor other mass casualty event (AHRQ 2006). There aremany important operational issues to be consideredin catastrophic events. Supply chain management aswell as facility location and staffing are important fac-tors when determining how to dispense antibioticsand other countermeasures (Lee et al. 2009, Bravataet al. 2006). In the event of a nuclear attack, guid-ance is needed on whether people should evacuateor take shelter in place (Wein et al. 2010). For largeevents, a critical consideration is how to determinewho gets priority for limited resources (Argon et al.2008). In this work, we focus on disaster planning forburn victims.
Patients with severe burns require specialized carebecause of their susceptibility to infection and poten-tial complications due to inhalation injury and/orshock. Specialized treatments, including skin-graftingsurgeries and highly specialized wound care, arebest delivered in burn centers and are important inincreasing the likelihood of survival and reducingcomplications and adverse outcomes (Committee onTrauma 1999).
There have been a number of events in recent yearsthat would qualify as “burn disasters.” For instance,in 2003, 493 people were caught in a fire at a Rhode
Island night club, and 215 of them required treat-ment at a hospital (Mahoney et al. 2005). During thisevent, the trauma floor of the Rhode Island Hospitalwas converted to a burn center to provide the nec-essary resources to care for the victims. Other burndisasters were due to terrorist attacks such as thosein Bali in 2002 and 2005 and the Jakarta MarriottHotel bombing in 2003 (Chim et al. 2007). In theseevents, some patients were transported to Australiaand Singapore for treatment. In all of these burn dis-aster events, there were more burn victims than couldbe adequately treated by existing burn centers, andother measures were required to provide care for allthe patients.
To prepare for the possibility of a burn disas-ter occurring in American cities, the Federal HealthResources and Services Administration has developedstandards for metropolitan areas. These include amandate to develop a plan to care for 50 burn-injuredpatients per million people, beyond which a nationalplan would be activated to transport patients to otherlocations. For most metropolitan areas such as NewYork City (NYC), this mandate exceeds the currentburn center capacity. Hence, there is a need to developa burn disaster plan for the triage, transportation, andother related issues involved in managing an over-loaded situation. The plan must include “guidelinesand other materials for the management and treat-ment of selected burn-injured patients for the first
170
Dow
nloa
ded
from
info
rms.
org
by [
128.
59.2
22.1
07]
on 1
2 Ju
ly 2
016,
at 1
2:23
. Fo
r pe
rson
al u
se o
nly,
all
righ
ts r
eser
ved.
Chan et al.: Prioritizing Burn-Injured Patients During a DisasterManufacturing & Service Operations Management 15(2), pp. 170–190, © 2013 INFORMS 171
three to five days in non–burn centers in the event ofa large chemical or explosive event” (Fund for PublicHealth in New York 2005, p. 3). The three- to five-dayhorizon is consistent with clinical guidelines for thesurgical treatment of burn victims.
There are currently 71 burn beds in NYC, which istypically a sufficient number to care for the normaldemands of burn-injured patients. During periods ofvery high demand, burn centers can provide “surge”capacity of about 50% over their normal capacityby treating patients in other units of the hospitalusing burn service personnel. There are an additional69 burn center beds in the 60-mile radius surround-ing NYC (including New Jersey and Connecticut),bringing the total surge bed capacity in the greatermetropolitan area to 210. Based on 2000 U.S. censusdata, the federal mandate of 50 patients per millionpeople corresponds to being able to care for 400 NYCpatients (Yurt et al. 2008), which far exceeds the surgecapacity of 210 beds.
Consequently, a task force of burn specialists, emer-gency medicine physicians, hospital administrators,and NYC officials was created to develop a burn dis-aster response plan (Yurt et al. 2008). To do this, theyidentified hospitals that do not have burn centers,but have agreed to assist in stabilizing burn-injuredpatients until they can be transferred to a burn center.
The main focus of the work presented in this paperwas to develop a detailed triage plan for prioritiz-ing burn-injured patients for transfer to burn beds tomaximize the benefit gained across all patients fromreceiving specialized burn care. More specifically, theNYC Task Force asked us to identify methods forrefining and improving the initial triage system pre-sented in Yurt et al. (2008), which uses broad cat-egories based on age and burn severity to classifypatients. We propose a new triage algorithm thatincludes individual survivability estimates and incor-porates patient length of stay (LOS) as well as spe-cific comorbidities that have significant impact onthe triage performance. Based on data from previ-ous burn catastrophes, we demonstrate that this newalgorithm results in significantly better performancethan other candidate triage methodologies. We alsoconsider the feasibility of the proposed disaster planto provide care in burn units for the vast major-ity of the 400 burn victims mandated by the fed-eral guidelines for NYC. Our analyses suggest that itis highly improbable that most burn-injured patientswill be able to be transferred to burn beds withinthe prescribed three- to five-day stabilization period.This suggests that federal assistance may be necessaryeven when the total number of burn-injured patientsis much smaller than the 50 per million populationguideline. Although this work focuses on improvingthe initial plan for NYC as outlined in Yurt et al.
(2008), it provides useful insights for the developmentof burn disaster plans in other cities.
The rest of this paper is organized as follows.Section 2 provides background on burn care and theinitial disaster plan established in 2008 (Yurt et al.2008). Section 3 presents our stochastic model andoptimization framework. Because of the complexityof the problem, we develop a heuristic prioritizationalgorithm. In §4, we discuss how to translate ourmodel into practice and how to include two addi-tional key factors: LOS and comorbidities. In §5, weshow that including these factors can improve triageperformance, measured in expected number of addi-tional survivors, by up to 15%. Section 6 considersthe feasibility of caring for all 400 patients in tier 1burn beds. We find that the ability to treat all burn-injured patients within the first three to five days ishighly dependent on the type of event and the sever-ity of the patients. Finally, we provide some conclud-ing remarks in §7.
2. BackgroundCareful triage of patients in any disaster scenariois critical in effectively utilizing limited healthcareresources. It is particularly vital in a burn disaster dueto the specific and nuanced care required by burn-injured patients.
2.1. Burn CareFigure 1 summarizes the typical treatment timelinefor a burn-injured patient. During the first hoursafter injury, care for seriously injured burn patientsfocuses upon stabilization, resuscitation, and woundassessment. In the ensuing days, supportive care iscontinued, and, if possible, the patient is taken to theoperating room for wound debridement and graftingas tolerated. It is recommended that such surgeriesare performed by burn specialists. Although there islimited literature on the impact of delayed transferto burn centers, it is widely accepted that it is notlikely that there will be worse outcomes as long aspatients are cared for by burn specialists within thefirst three to five days. Delayed treatment from burnspecialists much longer than five days may result inworse outcomes if wounds are not properly caredfor and begin to exhibit symptoms of infection andother clinical complications (Sheridan et al. 1999).Note that patients who suffer from extensive burnwounds may require multiple surgeries with recoverytimes between them because each skin graft covers alimited area.
2.2. Disaster PlanThe plan developed by the NYC Burn DisasterTask Force included a tiered system to triage andtreat severely burned patients in hospitals with
Dow
nloa
ded
from
info
rms.
org
by [
128.
59.2
22.1
07]
on 1
2 Ju
ly 2
016,
at 1
2:23
. Fo
r pe
rson
al u
se o
nly,
all
righ
ts r
eser
ved.

Chan et al.: Prioritizing Burn-Injured Patients During a Disaster172 Manufacturing & Service Operations Management 15(2), pp. 170–190, © 2013 INFORMS
Figure 1 Timeline for Care of Burn-Injured Patients: From Wang (2010) and Private Communications
Woundassessment
Resuscitation/stabilization
Supportive care
Surgery + Continued care and monitoring
Day 1 Day 2 Day 3 Day 4 Day 5 Day 6 Day 7 Day 8+ …
Initial burninjury
and without burn centers as well as various otherinitiatives—such as communication protocols andcompetency-based training for emergency medicalservice (EMS) personnel and other staff at non–burncenter hospitals (Leahy et al. 2012).
Facilities with New York (or New Jersey/Connecticut) State recognized burn centers aredefined as tier 1 hospitals, hospitals with recog-nized trauma centers are defined as tier 2 hospi-tals, whereas hospitals with neither burn nor traumadesignation are defined as tier 3 hospitals. Tier 3hospitals are distinguished from all other non–burn center/non–trauma center hospitals in that theyhave agreed to participate in the plan and haveaccepted an emergency cache of burn wound caresupplies and supplemental burn care training foremergency department and intensive care unit physi-cians and nurses in exchange for accepting up to 10patients during a burn disaster scenario. Non–burncenter/non–trauma center hospitals that opted out ofplan participation could initially receive burn-injuredpatients who self-refer or are transported to these hos-pitals because of the availability of resources and/orproximity to the scene, but would then be transferredto participating hospitals.
Although some catastrophes may develop over thecourse of a few days, the Task Force was primarilyconcerned with disasters that create a sudden largesurge in patient arrivals, such as those caused by abombing or large fire. In such events, patients arriveat hospitals within a few hours, and certainly by theend of the first day. The timescale of patient arrivalsis extremely short in relation to the average LOS ofburn-injured patients, which is 13 days; hence, theTask Force focused on a reasonable worst-case sce-nario where all patients arrive at the beginning of thehorizon.
As patients arrive at hospital emergency depart-ments, they will be classified and given a triage
score after examination. Based on these assessments,some patients will be transferred into tier 1 hospitals,whereas others may be transferred out, so as to reflectthe prioritization scheme of the burn disaster plan.The Virtual Burn Consultation Center is a centralizedtracking system that will be used to coordinate suchinterfacility transportation (Leahy et al. 2012).
Although the initial transportation and transferlogistics are part of the overall burn disaster plandeveloped by the Task Force, the major focus of thework described here was on the development of atriage algorithm to determine the prioritization ofpatients during the initial assessment and reassign-ment period, as well as for the transfer of patientswho are provided their initial care in tier 2 and tier 3hospitals, but who will be transferred to tier 1 hos-pitals as those beds become available. It is importantto note that any triage algorithm is a decision aidthat is meant to provide guidance to clinicians, whoultimately make the actual determination of patientpriorities. However, given the number of relevant fac-tors, an algorithm is necessary to deal with the com-plexity, and it is assumed that it will be followed inmost cases.
The total surge capacity of tier 1 hospitals’ burnbeds in the greater metropolitan area is 210. If thereare more than 210 burn-injured patients, tier 2 andtier 3 hospitals will be used to stabilize patients untilthey can be transferred into a tier 1 hospital, withpreference given to tier 2 hospitals. Because burn-injured patients may require resuscitation, cardiopul-monary stabilization, and emergency care proceduresprior to skin-grafting surgeries, the tier 2 and tier 3hospitals were selected based on their ability to sta-bilize and provide the basic wound care requiredwithin the first few days. By day 3, most burn-injuredpatients should receive specialized burn care in atier 1 hospital. Some patients are less delay sensi-tive and can wait up to five days to receive tier 1care without incurring harm. If the total number of
Dow
nloa
ded
from
info
rms.
org
by [
128.
59.2
22.1
07]
on 1
2 Ju
ly 2
016,
at 1
2:23
. Fo
r pe
rson
al u
se o
nly,
all
righ
ts r
eser
ved.
Chan et al.: Prioritizing Burn-Injured Patients During a DisasterManufacturing & Service Operations Management 15(2), pp. 170–190, © 2013 INFORMS 173
burn-injured patients is estimated to be beyond thenumber that can be admitted to treatment in a spe-cialized burn bed by day 5, a national plan thatwould involve air transport to other metropolitanareas would go into effect. Because such a nationalplan would be very costly, complex, and potentiallydangerous for many burn victims, the objective of theTask Force was to devise a plan that could providefor the treatment of up to 400 burn-injured patientsin tier 1 facilities within three to five days.
There are three main factors that affect patientsurvivability and LOS: burn size (as measured bytotal body surface area (TBSA)), age, and inhala-tion injury (IHI). The triage decision matrix fromSaffle et al. (2005) classifies patients based on likeli-hood of survival. Patients who are expected to sur-vive and have good outcomes without requiring burncenter admission are categorized as “outpatients”;“very high” patients who are treated in a burn cen-ter have a survival likelihood greater than or equalto 90% and require a length of stay between 14 and21 days and one to two surgical procedures; “high”patients also have a high survival likelihood greaterthan or equal to 90% but require more aggressivecare, with multiple surgeries and LOS greater than21 days; “medium” patients have a survival likeli-hood of 50%–90% and require multiple surgeries andLOS of greater than 21 days; “low” patients have asurvival likelihood of less than 50% even with aggres-sive treatment; “expectant” patients have a survivallikelihood of less than 10%. LOS is defined as theduration of time in the burn unit until discharge.
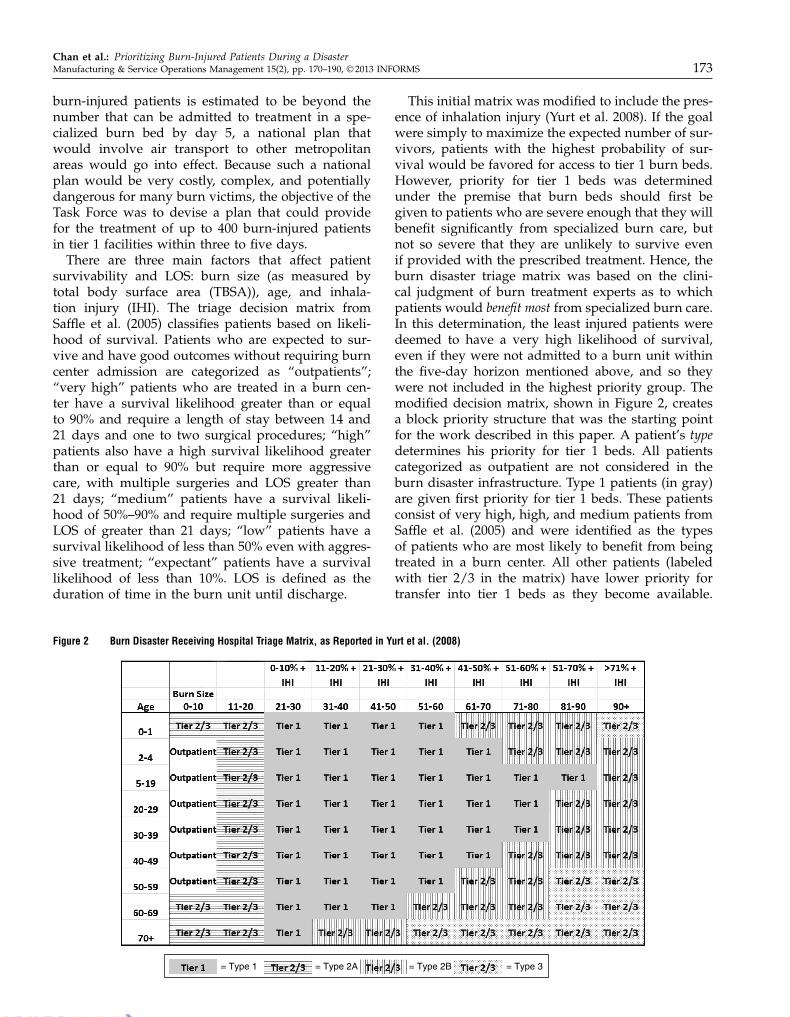
Figure 2 Burn Disaster Receiving Hospital Triage Matrix, as Reported in Yurt et al. (2008)
= Type 1 = Type 2A = Type 2B = Type 3
This initial matrix was modified to include the pres-ence of inhalation injury (Yurt et al. 2008). If the goalwere simply to maximize the expected number of sur-vivors, patients with the highest probability of sur-vival would be favored for access to tier 1 burn beds.However, priority for tier 1 beds was determinedunder the premise that burn beds should first begiven to patients who are severe enough that they willbenefit significantly from specialized burn care, butnot so severe that they are unlikely to survive evenif provided with the prescribed treatment. Hence, theburn disaster triage matrix was based on the clini-cal judgment of burn treatment experts as to whichpatients would benefit most from specialized burn care.In this determination, the least injured patients weredeemed to have a very high likelihood of survival,even if they were not admitted to a burn unit withinthe five-day horizon mentioned above, and so theywere not included in the highest priority group. Themodified decision matrix, shown in Figure 2, createsa block priority structure that was the starting pointfor the work described in this paper. A patient’s typedetermines his priority for tier 1 beds. All patientscategorized as outpatient are not considered in theburn disaster infrastructure. Type 1 patients (in gray)are given first priority for tier 1 beds. These patientsconsist of very high, high, and medium patients fromSaffle et al. (2005) and were identified as the typesof patients who are most likely to benefit from beingtreated in a burn center. All other patients (labeledwith tier 2/3 in the matrix) have lower priority fortransfer into tier 1 beds as they become available.
Dow
nloa
ded
from
info
rms.
org
by [
128.
59.2
22.1
07]
on 1
2 Ju
ly 2
016,
at 1
2:23
. Fo
r pe
rson
al u
se o
nly,
all
righ
ts r
eser
ved.

Chan et al.: Prioritizing Burn-Injured Patients During a Disaster174 Manufacturing & Service Operations Management 15(2), pp. 170–190, © 2013 INFORMS
These patients can be stratified into two differenttypes: type 2 patients (in lines) receive priority overtype 3 patients (in dots). Type 2 patients can be fur-ther divided into two subtypes. The first type havea TBSA less than or equal to 20% and are labeled asvery high in Saffle et al. (2005); the severity of theirburn is limited enough that they are likely to surviveeven with delayed treatment in a tier 1 burn bed. Werefer to these as type 2A patients. The second type arelabeled as low in Saffle et al. (2005); their likelihood ofsurvival is low enough that treatment in a tier 1 hos-pital is not as potentially beneficial as it is for tier 1patients. We refer to these as type 2B patients. The lastpatient type consists of the expectant patients, whoare only treated in a burn bed if there is availabilitybecause their survival is highly unlikely. We refer tothese as type 3 patients.
This block triage plan was considered a good start-ing point, primarily because (1) it is based on datafrom the National Burn Repository as well as theclinical judgment of experienced burn clinicians and(2) it is simple and easy to implement. However, amajor shortcoming of this triage system is that it is agross categorization scheme with three priority types:types 1, 2, and 3. If there are more type 1 patientsthan there are tier 1 beds, there are no guidelinesto determine which patients get priority. Similarly, astier 1 beds become available, there are no guidelinesto differentiate among the type 2 and type 3 patients.Finally, although this block plan is based on expertopinion on patients’ expected increase in likelihoodof survival due to treatment in a burn unit, it doesnot incorporate any individual estimates of survivaleither with or without specialized burn care. We dis-cuss this issue in more detail in §4.
The goal of the work we were asked to perform bythe NYC Task Force was to prioritize patients withinthese gross categories. In doing so, we decided to con-sider if and how to incorporate comorbidities in thetriage plan, noting that comorbidities can significantlyimpact patient survivability and LOS. As we discussin subsequent sections, we also examined the implicitassumptions of the original block matrix plan andthe feasibility of providing burn unit treatment for all400 burn victims within the designated time horizon.
2.3. Operations LiteraturePatient triage, which is essentially a prioritizationscheme, has generated substantial attention from theoperations research community. Classical index ruleresults from the scheduling literature (see Pinedo2008) can often provide insight into how to managepatient triage. The well-known c-� rule minimizesholding costs in a variety of settings (Buyukkocet al. 1985, van Mieghem 1995). Saghafian et al.(2011) modified this priority rule to incorporate a
complexity measure for patient triage in the emer-gency department.
Patient triage in disaster scenarios has the addi-tional complication that, because the number ofpatients exceeds the number of health resources (beds,nurses, physicians, etc.), some, or even many, patientsmay not be able to receive treatment before they die,corresponding to patient abandonment. Glazebrooket al. (2004) proposed a (c-�)-like priority rule thatmaximizes reward as the exponential abandonmentrates go to zero. A similar priority rule was pro-posed by Argon et al. (2008) for general service timesand abandonment rates. What separates our workfrom these works is that we consider how to leveragethe structure and timeline of the treatment of burn-injured patients in designing a triage system. In doingso, we emphasize the need to combine mathematicalrigor with clinical relevance and judgment to encour-age physician adoption.
One issue of great concern to the physicians ishow to triage patients when their medical history isunknown. In a classification scheme based on patientseverity, the presence or lack of comorbidities canhave substantial impact on a patient’s priority. Argonand Ziya (2009) proposed a triage scheme to minimizelong-run average waiting costs under imperfect cus-tomer classification. Each patient was associated witha probability of being of higher priority and triagewas done in decreasing order of this probability. Ourwork also considers uncertainty in patient classifica-tion; however, it may be possible to expend someeffort, via tests or speaking to the patient, to extractinformation about the presence of a particular comor-bidity. Certainly, it is time consuming and costlyto extract information on all possible comorbidities.Hence, we determine which, if any, comorbiditiesare most important in assessing survival probabili-ties and/or length of stay. Finally, the objective ofour triage system is quite different because our timehorizon is finite given the criticality of treating burn-injured patients within the first three to five days fol-lowing injury.
Our goal in this work is to bring a systematic frame-work to a current, important, and real-world prob-lem. Triage plans, especially in disaster scenarios, areinherently qualitative because decisions have to bemade quickly with limited data. The challenge is tobring mathematical rigor based on incomplete data toan inherently clinical and subjective decision process.
3. Model and a HeuristicThe goal of a disaster triage plan is to use the limitedresources available so as to maximize the overall ben-efit to the affected population. Although in the case ofburn patients, benefit can include improvements with
Dow
nloa
ded
from
info
rms.
org
by [
128.
59.2
22.1
07]
on 1
2 Ju
ly 2
016,
at 1
2:23
. Fo
r pe
rson
al u
se o
nly,
all
righ
ts r
eser
ved.

Chan et al.: Prioritizing Burn-Injured Patients During a DisasterManufacturing & Service Operations Management 15(2), pp. 170–190, © 2013 INFORMS 175
respect to scarring and disability, the most impor-tant performance metric is clearly the increase in thelikelihood of survival. Therefore, the ideal model forprioritizing patients to burn beds would be one thatmaximizes the overall increase in the expected num-ber of survivors due to use of these beds. We describesuch a model for the NYC burn disaster situation inthis section. As we explain in more detail in a subse-quent section, we must infer these benefits because oflimitations in available data.
There are N patients who are eligible for treatmentin one of the B tier 1 burn beds at the beginning ofthe horizon, where B < N . We assume that there issufficient capacity in the tier 2/3 beds to accommo-date all burn-injured patients not initially placed intoa tier 1 bed while they wait to be transferred into atier 1 burn bed.
We assume that we know all patients’ probabilityof survival if they do not receive timely care in atier 1 bed, as well as the increase in this probability ifthey do. We further assume that patients fall into oneof two classes that defines their delay tolerance forburn unit care. Specifically, a class 1 patient must betransferred to a tier 1 bed within three days to realizethe associated improvement in survivability, whereasa class 2 patient can remain in a tier 2/3 bed for upto five days before being transferred to a tier 1 bedwithout jeopardizing his probability of survival.
Each patient i ∈ 81121 0 0 0 1N 9 is defined by his class,Ci ∈ 81129, his increase in probability of survival dueto timely tier 1 burn care, ãPi, and his expected LOS,Li. Although we initially assume that patient i’s LOSis exponentially distributed with mean Li, we relaxthis assumption later.
Let ti be the time at which patient i is transferredinto one of the B beds at which time he generatesreward
ãPi618ti≤31Ci=19 + 18ti≤51Ci=2970
That is, a class 1 patient who is transferred within histhree-day delay tolerance will benefit ãPi from tier 1burn care. Note that not all class 1 patients are neces-sarily type 1 patients. Likewise, a class 2 patient mustbe transferred within his five-day delay tolerance. Letti4�5 be the (random) time patient i is transferred intoa tier 1 burn bed under triage policy �. Our objectiveis to select the triage algorithm, �, which maximizesthe total expected increase in the number of survivorsdue to timely burn unit treatment.
max�
E
[ N∑
i=1
ãPi618ti4�5≤31Ci=19 + 18ti4�5≤51Ci=297
]
0 (1)
3.1. Potential Triage PoliciesIf all patients had to complete, rather than start, treat-ment within the first five days, then a simple indexrule that prioritizes patients in decreasing order of
the ratio between patient benefit (i.e., increase in sur-vivability) and expected LOS (ãPi/Li) (i.e., the incre-mental reward per day in the burn center) would beoptimal. This can be shown via a simple interchangeargument. Such an index rule leverages known resultsfrom the classical scheduling literature where weightedshortest processing time (WSPT) first is optimal for anumber of parallel processing scheduling problems(see Pinedo 2008).
Our problem has a modified constraint that requiresclass 1 and class 2 patients to begin treatment withinthe first three and five days, respectively, to gener-ate any reward. This makes our scheduling prob-lem substantially more difficult. In particular, onecan map our scheduling problem with objective (1)to a stochastic scheduling problem with an objectiveof minimizing the weighted number of tardy jobs,where the weight for job i is ãPi and the due date is3 · 18Ci=19+5 ·18Ci=29+Si, where Si is the processing timefor job i. Hence, the job must start processing by timeT = 3 (or 5) days if he is class 1 (or 2). If patient LOSwere deterministic, i.e., if Si = Li with probability 1,this problem would be NP-hard (Pinedo 2008). Themost commonly used heuristic for the deterministicproblem is the WSPT index rule: ãPi/Li. However, inthe worst case, the performance of this heuristic canbe arbitrarily bad. In our stochastic model, the servicetimes are independent exponential random variables,so the due dates are now random and correlated withthe service times, adding additional complexity.
There are various results in the literature on min-imizing expected weighted tardy jobs. More gen-eral models, for instance, with arbitrary deadlinesor service times distribution, can be shown to beNP-hard. In special cases, optimal policies are known.For instance, with independent and identically dis-tributed due dates and processing times, it is optimalto sequence jobs in order of weights (Boxma and Forst1986). Forst (2010) identifies conditions for optimality,which in our case would correspond to the optimalityof WPST if ãPi ≥ ãPj if and only if Li ≤ Lj . Unfor-tunately, this condition is too restrictive for the burntriage problem, and so WSPT is not necessarily opti-mal. In other cases, such as Jang and Klein (2002),which examines a single machine with a commondeterministic due date, heuristic algorithms must beconsidered.
3.2. Proposed HeuristicGiven the inherent difficulty of solving for the opti-mal triage algorithm, we focus on a modified ver-sion of the most commonly used heuristic, which isto prioritize patients in decreasing order of ãPi/Li.The average LOS of burn-injured patients is quitelarge (much more than five days), as seen in Table 4.Consequently, the distinction between starting ver-sus completing treatment within the first three or
Dow
nloa
ded
from
info
rms.
org
by [
128.
59.2
22.1
07]
on 1
2 Ju
ly 2
016,
at 1
2:23
. Fo
r pe
rson
al u
se o
nly,
all
righ
ts r
eser
ved.

Chan et al.: Prioritizing Burn-Injured Patients During a Disaster176 Manufacturing & Service Operations Management 15(2), pp. 170–190, © 2013 INFORMS
five days is significant. Consider a simple examplewith two class 2 patients and one bed. Patient Ahas benefit potential 0.10 and expected LOS of 30days. Patient B has benefit potential 0.05 and expectedLOS of 10 days. Using the WSPT heuristic, patient Bgets priority because 0.05/10 is greater than 0.10/30.With probability 0.3935, patient B completes beforefive days, and patient A can also start treatmentwithin the first five days. Hence, the expected ben-efit, i.e., number of additional patients’ lives saved,by scheduling patient B first is 000893 = 0005+003935 ·
0010. On the other hand, the expected benefit byscheduling patient A first is 001077 = 0010 + 001535 ·
0005. Because these patients both have very long LOS,the likelihood of being able to start treatment for thesecond patient is very low. Hence, it is better to startwith the patient with the highest benefit potential(patient A).
Consider a more general example with two patientsand one bed. Patients A and B have benefit poten-tials ãPA and ãPB, respectively; they are both class 1;their LOS, SA and SB, are exponentially distributedwith mean LA and LB. We consider the criteria suchthat patient A should be given priority. That is, underwhat conditions is the expected benefit larger whenpatient A is given priority versus when patient B isgiven priority? This occurs when
ãPA +ãPBFA435≥ãPB +ãPAFB435
⇔ãPA
1 − FA435≥
ãPB
1 − FB4351
(2)
where Fi4x5 = P4Si < x5 is the cumulative distribu-tion function of an exponential random variable withmean Li. Hence, patient A should be given priorityif his index, ãPA/P4SA ≥ 35, is larger than patient B’sindex, ãPB/P4SB ≥ 35. Based on this analysis, our pro-posed heuristic algorithm is to prioritize patients indecreasing order of the following triage index:
ãPi
P4Si ≥ 35=ãPie
3/Li 0 (3)
This new triage index would give priority topatient A in the example given above where WSPTgives priority to patient B. Hence, it has a higherexpected benefit than WSPT. In general, the proposedalgorithm is not optimal. Consider the followingexample with three patients and one bed. The patientparameters are summarized in Table 1. Patient A hasthe shortest expected LOS but also the lowest ben-efit potential. However, given the short horizon ofthree days, patient A has high priority. Based on theproposed triage algorithm in (3), patients should beprioritized in the order A, B, C. One can do somequick algebra to conclude that this ordering results inthe expected benefit of 0.1146. If, instead, patients are
Table 1 Patient Parameters for Three-Patient, One-Bed Example
Class Benefit potential Mean LOS Priority indexPatient (Ci ) (ãPi ) (Li ) (ãPie3/Li )
A 1 00080 7 001228B 1 00090 15 001099C 1 00095 30 001050
prioritized in the order A, C, B, the expected benefit is0.1147, which is marginally (<0005%) higher than theproposed heuristic. Because the LOS are so large com-pared to the horizon of three days, the second patientis unlikely to finish before the end of the horizon, soit is better to schedule patient C, with the highest ben-efit potential, than patient B, which has a shorter LOSand lower benefit potential. Despite the suboptimalityof the proposed heuristic, the magnitude of subopti-mality in this example is very small, suggesting thatthis heuristic is likely to perform well in practice.
One could potentially consider more sophisticatedalgorithms, such as varying the denominator basedon patient class and time. For instance, the indexin (3) could use the probability of completing withinfive days instead of three days: ãPie
5/Li . Because themajority of patients are class 1, and so must starttreatment within three days of a burn injury, this isunlikely to have a substantial impact on performance.Furthermore, we conducted simulation studies (usingthe simulation model described in Appendix A) andfound there is no discernible difference between con-sidering the five- or three-day limit given the longLOS of typical burn-injured patients. We note thatwhen patient LOS is very long, the proposed indexis primarily determined by the benefit ãPi. This isbecause the portion of the index that depends on LOS,ee/Li , is very flat for large Li. Therefore, we expectthe suboptimality to be small in such cases. Finally,our proposed triage index in (3) is relatively simple,which makes it ideal for real-world implementation.
A major challenge in actually using the proposedmodel and heuristic is the lack of appropriate data.Quantifying the benefit, ãPi, for each patient is notpossible because there is no source of data on thelikelihood of survival for burn patients not treatedin a burn unit since almost all burn patients aretransferred to burn units for care. The National BurnRepository only maintains outcome data for burn-injured patients who are treated in burn units. In thenext section, we describe several approaches for deal-ing with this data limitation.
4. Parameter Estimation andModel Refinement
4.1. Parameter EstimationWe now consider how to estimate the parameters forour proposed algorithm for use in the burn disaster
Dow
nloa
ded
from
info
rms.
org
by [
128.
59.2
22.1
07]
on 1
2 Ju
ly 2
016,
at 1
2:23
. Fo
r pe
rson
al u
se o
nly,
all
righ
ts r
eser
ved.

Chan et al.: Prioritizing Burn-Injured Patients During a DisasterManufacturing & Service Operations Management 15(2), pp. 170–190, © 2013 INFORMS 177
plan. In particular, we need to determine the bene-fit, expected LOS, and class (ãPi, Li, and Ci) for eachpatient i.
4.1.1. Survival Probability. We begin with thelikelihood of survival from which we infer the ben-efit of tier 1 care. The nominal survival probabilitycan be estimated using the thermal injury mortalitymodel (TIMM model) in Osler et al. (2010), which isbased on a nonlinear function of patient’s age, burnsize, and presence of inhalation injury. This providesa continuous measure for mortality rate rather thanthe previously used coarse matrix blocks based onage and severity of burn, as in Saffle et al. (2005).More specifically, the TIMM model uses the followinglogistic regression model to predict the thermal injuryprobability of survival:
Pi = 61 + exp4�0 +�1TBSA +�2Age +�3IHI
+�4
√TBSA +�5
√
Age +�6TBSA × IHI
+�7Age × IHI +�8TBSA × Age/10057−11 (4)
where TBSA is measured in percentage, Age is mea-sured in years, and IHI is a binary variable. The coeffi-cients of the function are estimated from the NationalBurn Repository data set (39,888 patients) and arelisted in Table 2. We assume that this survival prob-ability decreases for patients who are admitted to aburn center after the initial three- or five-day window.This decrease captures the benefit of tier 1 burn care.
4.1.2. Benefit. There is no generally acceptedmodel for how patients’ conditions evolve over timedepending on the type of treatment given. This is pri-marily because of the limited quantitative data on thereduction in mortality when transferred into a burncenter. Sheridan et al. (1999) is one of the few worksthat looks at the impact of delayed transfers; however,the study only includes a total of 16 pediatric patientswith delayed treatment of up to 44 days. The smallsample size, the specialized population, and the oftenlong delays involved make it impossible to use theSheridan et al. (1999) results in our model. As such,we infer the benefit of burn center care based on theNew York City plan and the judgment of the clini-cians on the Task Force.
Table 2 TIMM Coefficients, as Reported in Osler et al. (2010)
k Variable �k
0 Constant −7063881 TBSA 0003682 Age 0013603 IHI 3033294
√TBSA 004839
5√
Age −0081586 TBSA× IHI −0002627 Age × IHI −0002228 TBSA×Age/100 000236
To translate our objective into the increase innumber of survivors, we introduce the followingconstruct: Each patient has a deterioration factorw ∈ 60117, which represents the relative benefit of tier 1burn care; i.e., the patient’s survivability will decreaseby w if he is not transferred to a burn bed before hisdelay tolerance expires. A patient’s absolute benefit isthen
ãPi =wiPi0
The deterioration factors are chosen so that, in gen-eral, priority is given to type 1 patients, followed bytype 2 patients, and finally type 3 patients. This isto be consistent with the clinical judgment used toestablish the initial triage matrix. In that spirit weassume that, within each patient type, the relativebenefit of tier 1 treatment is identical. As such, wemust derive four deterioration factors: w1, w2A, w2B,and w3. Because the survivability of patients withineach type can vary quite a bit, the absolute benefit,ãPi, will differ across patients of the same type.
We start with an estimate of the range of w2A andderive ranges for the remaining patient types. Thesurvivability for type 2A patients is very high; hence,even a small deterioration factor translates into alarge benefit. As such, and supported by clinical judg-ment, we assume this factor is between 5% and 15%.Because the absolute benefit for type 1 patients isassumed to be the largest (resulting in their initial pri-ority for tier 1 treatment), we require that w1 > w2A.More generally, given w2A, the ranges of deteriorationfactors for the other patient types are estimated so asto be consistent with the priorities given by the triagematrix in Figure 2. These deterioration factors andapproximate survivability ranges are listed in Table 3.We see that there is a substantial range for each ofthe deterioration factors. The majority of our resultsbelow assumes 4w11w2A1w2B1w35 = 40051001100410025;however, we do sensitivity analysis over the entirerange of each parameter.
Because of a lack of data on the health evolutionof burn patients and how it is affected by delay intreatment in burn units, the best estimates of survivalbenefit must be based on a combination of generalsurvival data and clinical judgment. However, ourmethodology can readily be modified as more workis done to establish more sophisticated health evolu-tion models. Such work would be very valuable inassessing alternative burn disaster response plans.
Table 3 Approximate Range of Survival Probability and DeteriorationWeights for Different Types of Patients
Patient type Type 1 Type 2A Type 2B Type 3
Survival probability: Pi 0.5–1.0 0.6–1.0 0.1–0.6 0–0.2Deterioration weight: wi 0.1–0.75 0.05–0.15 0.1–0.6 0.05–0.3
Dow
nloa
ded
from
info
rms.
org
by [
128.
59.2
22.1
07]
on 1
2 Ju
ly 2
016,
at 1
2:23
. Fo
r pe
rson
al u
se o
nly,
all
righ
ts r
eser
ved.

Chan et al.: Prioritizing Burn-Injured Patients During a Disaster178 Manufacturing & Service Operations Management 15(2), pp. 170–190, © 2013 INFORMS
Table 4 Mean Patient Length of Stay and Standard Deviation for Burn-Injured Patients Grouped by Burn Size and Survival Outcome, as Summarizedfrom the American Burn Association (2009)
Burn severity in % TBSA
Outcome 0.1–9.9 10–19.9 20–29.9 30–39.9 40–49.9 50–59.9 60–69.9 70–79.9 80–89.9 90+
AllLOS, days 504 1200 2105 3206 4004 4205 4501 3905 3503 1905Std. dev. 1000 1303 2102 2800 3507 4009 4900 5500 6201 5402
LivedLOS, days 504 1107 2107 3408 4707 5607 6605 7508 8809 6506Std. dev. 1000 1301 2003 2702 3504 3908 5001 6206 8403 9902
DeadLOS, days 1606 2108 1907 2006 1801 1703 1607 1207 1105 806Std. dev. 2209 2505 2504 3001 2601 2901 2903 2508 2400 2703
4.1.3. Length of Stay. There currently does notexist a continuous model to predict mean LOS; how-ever, once one becomes available, the proposed algo-rithm can easily be adapted to incorporate it. In themeantime, we utilize a discontinuous model whereLOS is determined by the extent of the burn, asmeasured by TBSA. TBSA is the most critical fac-tor in determining LOS. Skin-grafting surgeries thattransplant healthy skin cells are limited in the areathat can be treated in each surgery; therefore, largerTBSA tends to correspond with more surgeries andlonger LOS for patients who survived. The expectedLOS of a patient (Li) is given by the mean LOSin the American Burn Association (2009), based onpatient’s TBSA and survival outcome, as summarizedin Table 4.
4.1.4. Class. A patient’s class, Ci, reflects his delaytolerance. This tolerance is determined based onthe clinical judgment of the experienced burn clini-cians. Recall that patients who are not treated withinfive days of burn injury are susceptible to infectionand clinical complications. Such complications canarise earlier, by day 3, in more severe patients. We canrefer to these patients as being less “delay tolerant,”and therefore we assume that these patients mustbe transferred within three days to earn a reward.Clinical factors indicate that type 1 patients fall intothis category and are defined as class 1 patients.Because type 2B and type 3 patients have more exten-sive burns and/or are older than type 1 patients, weexpect them to be just as delay sensitive as the type 1patients and are also classified as class 1. However,type 2A patients are better able to withstand transferdelays and therefore are classified as class 2 and gen-erate a reward up to day 5. Because the first 72 hoursare typically devoted to stabilizing the patient, weassume that the benefit of tier 1 treatment is invariantto the timing of admission as long as it falls withinthe relevant deadline.
Our proposed algorithm prioritizes patients indecreasing order of the ratio between benefit and
Table 5 Summary of How Model Parameters Are Assigned to Patients
Patient type
Parameter Type 1 Type 2A Type 2B Type 3
Class: Ci 1 2 1 1Mean LOS: Li NBR data in Table 4Survival probability: Pi TIMM model (4)Deterioration weight: wi 005 001 004 002Benefit: ãPi wiPi
Notes. Deterioration weights wi are listed as the values used for most results.Ranges for these values can be found in Table 3.
probability of LOS less than three days (ãPie3/Li ). In
this case, patient i’s benefit is the increase in likeli-hood of survival based on timely tier 1 care, wiPi,where Pi is given by the TIMM model (4); his expectedLOS, Li, is given by Table 4; and his delay toleranceclass, Ci, depends on his triage tier given by Fig-ure 2. Table 5 summarizes how these parameters areassigned.
4.2. Inclusion of Patient ComorbiditiesThus far, the triage score assumes that there is noinformation regarding patient comorbidities. Thombset al. (2007) demonstrated that certain comorbiditiescan significantly affect a patient’s survival probabil-ity and LOS. In a more recent paper, Osler et al.(2011) developed a regression model for estimatingsurvival probabilities that incorporates comorbidities.However, the Osler et al. (2011) model was basedon a more limited database from New York Statethat included patients who were treated in non–burnunits. Therefore, we used the results in Thombs et al.(2007) to consider the impact of including specificpatient comorbidities. More precisely, if patient i hascomorbidity j with associated odds ratio, ORj , andtransform coefficient, TCj ,1 then his probability of
1 A transform coefficient is a multiplier that increases LOS by aproportional amount, TCj .
Dow
nloa
ded
from
info
rms.
org
by [
128.
59.2
22.1
07]
on 1
2 Ju
ly 2
016,
at 1
2:23
. Fo
r pe
rson
al u
se o
nly,
all
righ
ts r
eser
ved.
Chan et al.: Prioritizing Burn-Injured Patients During a DisasterManufacturing & Service Operations Management 15(2), pp. 170–190, © 2013 INFORMS 179
survival and LOS are adjusted from the base values ifhe did not have comorbidity j :
P Yi =
PNi
PNi + 41 − PN
i 5ORj
1
LYi = TCjL
Ni 1
(5)
where the superscript denotes whether the patient hasthe comorbidity: Y for yes and N for no. Note that theTIMM model and LOS estimates include patients withcomorbidities. Hence, those estimates can be used todetermine PN
i and LNi based on the prevalence, qj , of
comorbidity j in the sample used for estimation:
E6Pi7= 41 − qj5PNi + qjP
Yi
= 41 − qj5PNi + qj
PNi
PNi + 41 − PN
i 5ORj
1
E6Li7= 41 − qj5LNi + qjL
Yi = 41 − qj5L
Ni + qjTCjL
Ni 0
(6)
Table 6 summarizes the odds ratios and transformcoefficients for the comorbidities that have statisticallysignificant impact on mortality and/or LOS. It alsoincludes the prevalence in the National Burn Reposi-tory data set, which was used to estimate these param-eters and was required to determine PN
i and LNi .
Thombs et al. (2007) determined that if a patienthas more than one comorbidity, then his survival
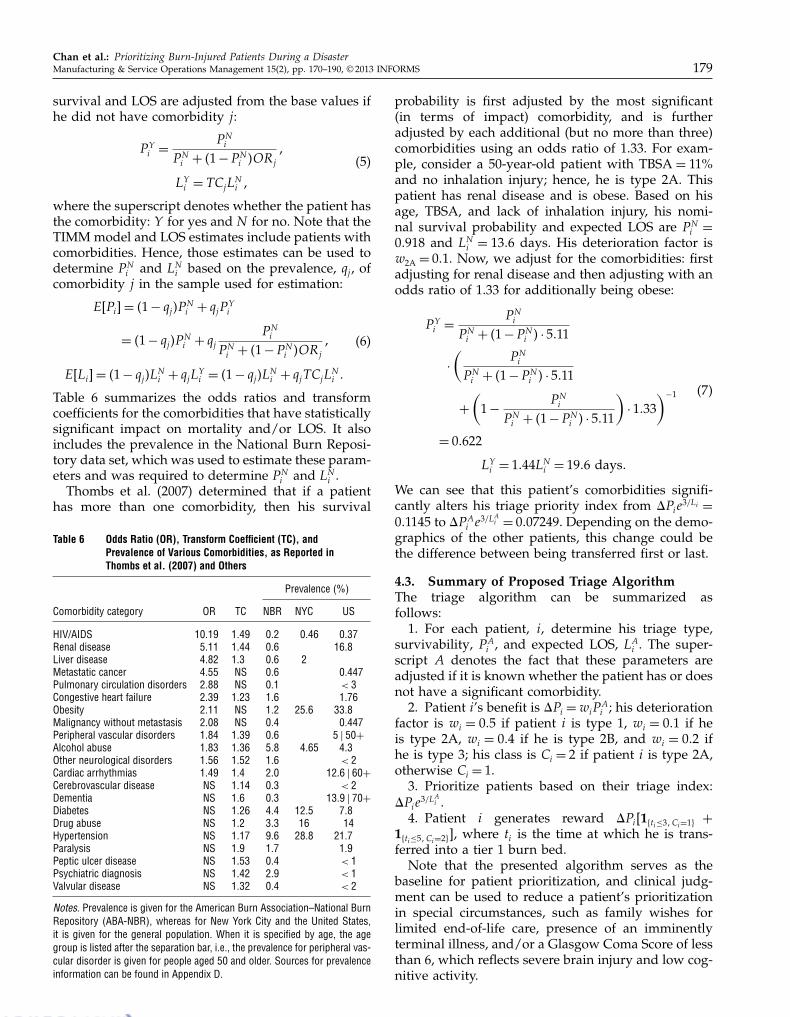
Table 6 Odds Ratio (OR), Transform Coefficient (TC), andPrevalence of Various Comorbidities, as Reported inThombs et al. (2007) and Others
Prevalence (%)
Comorbidity category OR TC NBR NYC US
HIV/AIDS 10019 1049 002 0046 0037Renal disease 5011 1044 006 1608Liver disease 4082 103 006 2Metastatic cancer 4055 NS 006 00447Pulmonary circulation disorders 2088 NS 001 < 3Congestive heart failure 2039 1023 106 1076Obesity 2011 NS 102 2506 3308Malignancy without metastasis 2008 NS 004 00447Peripheral vascular disorders 1084 1039 006 5 � 50+
Alcohol abuse 1083 1036 508 4065 403Other neurological disorders 1056 1052 106 < 2Cardiac arrhythmias 1049 104 200 1206 � 60+
Cerebrovascular disease NS 1014 003 < 2Dementia NS 106 003 1309 � 70+
Diabetes NS 1026 404 1205 708Drug abuse NS 102 303 16 14Hypertension NS 1017 906 2808 2107Paralysis NS 109 107 109Peptic ulcer disease NS 1053 004 < 1Psychiatric diagnosis NS 1042 209 < 1Valvular disease NS 1032 004 < 2
Notes. Prevalence is given for the American Burn Association–National BurnRepository (ABA-NBR), whereas for New York City and the United States,it is given for the general population. When it is specified by age, the agegroup is listed after the separation bar, i.e., the prevalence for peripheral vas-cular disorder is given for people aged 50 and older. Sources for prevalenceinformation can be found in Appendix D.
probability is first adjusted by the most significant(in terms of impact) comorbidity, and is furtheradjusted by each additional (but no more than three)comorbidities using an odds ratio of 1.33. For exam-ple, consider a 50-year-old patient with TBSA = 11%and no inhalation injury; hence, he is type 2A. Thispatient has renal disease and is obese. Based on hisage, TBSA, and lack of inhalation injury, his nomi-nal survival probability and expected LOS are PN
i =
00918 and LNi = 1306 days. His deterioration factor is
w2A = 001. Now, we adjust for the comorbidities: firstadjusting for renal disease and then adjusting with anodds ratio of 1.33 for additionally being obese:
P Yi =
PNi
PNi + 41 − PN
i 5 · 5011
·
(
PNi
PNi + 41 − PN
i 5 · 5011
+
(
1 −PNi
PNi + 41 − PN
i 5 · 5011
)
· 1033)−1
= 00622
LYi = 1044LN
i = 1906 days0
(7)
We can see that this patient’s comorbidities signifi-cantly alters his triage priority index from ãPie
3/Li =
001145 to ãPAi e
3/LAi = 0007249. Depending on the demo-graphics of the other patients, this change could bethe difference between being transferred first or last.
4.3. Summary of Proposed Triage AlgorithmThe triage algorithm can be summarized asfollows:
1. For each patient, i, determine his triage type,survivability, PA
i , and expected LOS, LAi . The super-
script A denotes the fact that these parameters areadjusted if it is known whether the patient has or doesnot have a significant comorbidity.
2. Patient i’s benefit is ãPi =wiPAi ; his deterioration
factor is wi = 005 if patient i is type 1, wi = 001 if heis type 2A, wi = 004 if he is type 2B, and wi = 002 ifhe is type 3; his class is Ci = 2 if patient i is type 2A,otherwise Ci = 1.
3. Prioritize patients based on their triage index:ãPie
3/LAi .4. Patient i generates reward ãPi618ti≤31Ci=19 +
18ti≤51Ci=297, where ti is the time at which he is trans-ferred into a tier 1 burn bed.
Note that the presented algorithm serves as thebaseline for patient prioritization, and clinical judg-ment can be used to reduce a patient’s prioritizationin special circumstances, such as family wishes forlimited end-of-life care, presence of an imminentlyterminal illness, and/or a Glasgow Coma Score of lessthan 6, which reflects severe brain injury and low cog-nitive activity.
Dow
nloa
ded
from
info
rms.
org
by [
128.
59.2
22.1
07]
on 1
2 Ju
ly 2
016,
at 1
2:23
. Fo
r pe
rson
al u
se o
nly,
all
righ
ts r
eser
ved.

Chan et al.: Prioritizing Burn-Injured Patients During a Disaster180 Manufacturing & Service Operations Management 15(2), pp. 170–190, © 2013 INFORMS
5. Evaluating the AlgorithmWe now evaluate our proposed algorithm relativeto four others using simulation. The first algorithm,referred to as the original algorithm, is the originalthree-tier triage matrix proposed in Yurt et al. (2008)and depicted in Figure 2. Because there is no differ-entiation within each tier, the algorithm is equivalentto randomly prioritizing patients within each tier. Thesecond algorithm, referred to as the survival algo-rithm, follows the initial proposal of the Task Force,which is to differentiate patients within a single triagetier based only on survival probability. The remain-ing algorithms utilize the parameters whose estima-tion is given in §4.1. The third algorithm is weightedshortest processing time first. The fourth algorithm,referred to as the proposed-N algorithm, is our pro-posed algorithm, but assumes that no informationabout comorbidities is known. The fifth algorithm isour proposed-W algorithm with comorbidities, i.e., itaccounts for the presence (or lack) of comorbiditiesand ranks patients based on their adjusted index. Weuse simulation to estimate expected rewards. Detailsof our simulation model can be found in Appendix A.Table 7 summarizes the algorithms that are simulated.
5.1. Data DescriptionIn this section, we describe the patient data that weuse in our simulation model to compare the triagealgorithms described in the previous section. Wehave a number of data sources: 775 cases of patientstreated at the New York-Presbyterian/Weill CornellMedical Center Burn Center during the year 2009,published data from previous disaster events, andpublished census data. The patient population fromNY-Presbyterian (NYP) is generally not indicative ofwhat would be expected in a disaster scenario—forexample, nearly 50% of the patients are under the ageof five and the median TBSA was 2%. Given that ageis a significant factor in determining patient surviv-ability and LOS, we turn to published data on previ-ous disaster events to build representative scenariosof the types for which the Federal Health Resourcesand Services Administration wants to prepare. Wewill return to the NYP data when considering the fea-sibility of the federal mandate in §6.
Table 7 Triage Index
Triage algorithm Index
Original (from Yurt et al. 2008) Tiered with random selectionSurvival Tiered with priority in each tier
according to PiWSPT ãPi/L
Ai
Proposed-N ãPie3/Li
Proposed-W ãPie3/LA
i
Note. Higher index corresponds to higher priority for a tier 1 bed.
Table 8 Distribution of Age, Severity of Burn (TBSA), and InhalationInjury (When Known) in Burn Data, as Summarized from Yurtet al. (2005), Chim et al. (2007), and Mahoney et al. (2005)
Age TBSA 4%5
Event Median Min. Max. Median Min. Max. IHI 4%5
9/11 44 (avg.) 27 59 52 (avg.) 14 100 66.7Bali 2002 29 20 50 29 5 55Jakarta 2003 35 24 56 10 2 46Rhode Island 2005 31 (avg.) 18 43 < 20 < 20 > 40
Each simulation scenario we consider attempts toemulate the demographics and severity of prior burndisasters. We looked at four disaster events: the NYCWorld Trade Center attacks on September 11, 2001(9/11) (Yurt et al. 2005), a 2002 suicide bombing inBali (Chim et al. 2007), a 2003 suicide bombing at theJakarta Marriot hotel (Chim et al. 2007), and a 2003nightclub fire in Rhode Island (Mahoney et al. 2005).The patients’ ages ranged from 18 to 59, and the sever-ity of burns ranged from 2% to 100% TBSA. Thesestatistics are summarized in Table 8. The patients inthe four disaster events were older and experiencedmore severe burns than the average patient treated atNYP in 2009.
Besides the 9/11 event, there was no informationon patient inhalation injury. However, the data fromthe National Burn Repository (NBR) does include thisinformation for burn-injured patients treated from1973 to 2007. We have summarized the distributionof IHI based on age and extent of burn in Table B.1in Appendix B. The average IHI across patients inthe NBR data who fall within the same demograph-ics as 9/11—i.e., age from 6301607 and TBSA from620%1100%7—is 48.95%, which is slightly lower thanthe observed 66.7% documented from 9/11.
There was no information on the presence ofcomorbidities in these references. We used a seriesof references to collect prevalence data of relevantcomorbidities in the general population. Prevalenceof any given comorbidity could be dependent on thetype of event as well as where it takes place. Thepopulation in an office building may have a differ-ent set of demographics than that in a subway orsports arena. Therefore, it would be desirable to haveprevalence data based on, at the very least, age andgender. However, this fine-grained information wasnot generally available; therefore, for consistency, weused prevalence for the general population. In somecases, we were able to get prevalence data specificto NYC or New York State rather than national data.Because these data more closely correspond to thepotential burn-injured patient population for whichthe algorithm was being developed, we used thesewhen available. The prevalence of the comorbiditiesof interest are summarized in Table 6.
Dow
nloa
ded
from
info
rms.
org
by [
128.
59.2
22.1
07]
on 1
2 Ju
ly 2
016,
at 1
2:23
. Fo
r pe
rson
al u
se o
nly,
all
righ
ts r
eser
ved.

Chan et al.: Prioritizing Burn-Injured Patients During a DisasterManufacturing & Service Operations Management 15(2), pp. 170–190, © 2013 INFORMS 181
Table 9 Distribution of Age, Severity of Burn (TBSA), and InhalationInjury for Four Simulation Scenarios
Age TBSA 4%5 IHI
Scenario Uniform distribution Uniform distribution Bernoulli distribution
1 6181607 601607 0.6672 6181607 601607 NBR data in Table B.13 6181607 6101907 0.6674 6181607 6101907 NBR data in Table B.1
5.2. Simulation ScenariosBecause of the variability across the burn disasterevents, we consider a number of simulation scenarios.We simulate the average increase in number of sur-vivors due to tier 1 treatment for the triage policiesdescribed above.
For the sake of simplicity, our simulations assumethat all burn beds are available to handle the burnvictims resulting from the catastrophe. We discuss theimplications of this assumption later. The number ofburn beds is fixed at 210 to represent the total num-ber of tier 1 beds in the NYC region when accountingfor the surge capacity. We consider scenarios that arelikely to be representative of an actual burn disas-ter. The first scenario is based on the Indonesia andRhode Island events. Age is uniformly distributedfrom 6181607, burn severity is uniformly distributedfrom 60%160%7, and inhalation injury is present withprobability that is consistent with 9/11, i.e., 00667. Forour second scenario, we consider inhalation injurythat is dependent on age and TBSA as summarizedin Table B.1. Our third and fourth scenarios aim tobe representative of events like 9/11: the age distri-bution is still 6181607, but the extent of the burn ismore severe, with TBSA uniformly distributed from610%190%7. In summary, the four scenarios we con-sider are listed in Table 9, and Table 10 shows thestatistics of patients in terms of class and type undereach scenario.
5.3. Simulation Results: Unknown ComorbiditiesWe compare the relative improvement in benefit underfour different triage algorithms described in Table 7.Hence, the performance is given by the increase inaverage number of survivors due to timely transferinto tier 1 beds within the three- to five-day windowdivided by the number of survivors under the origi-nal block triage system. We assume that comorbiditiesare unknown or ignored. Hence, in this case PA
i = Pi
Table 10 Scenario Statistics
Scenario Class 1 4%5 Class 2 4%5 Type 1 4%5 Type 2 or 3 4%5
1 9309 601 8505 14042 8107 1803 7402 25083 9509 401 5807 41034 8808 1103 5405 4504
and LAi = Li, so that the proposed-N and proposed-W
algorithms are identical. Figure 3 shows the relativeimprovement of the objective compared to the originaltriage algorithm from Yurt et al. (2008).
It is clear that the impact of including LOS in thetriage score depends on the type of event as givenby the age and severity of the burn victims. In severecases (scenarios 3 and 4), ignoring LOS and sim-ply using survivability (survival algorithm: P0) doesnoticeably worse than the proposed-N algorithm. Theproposed-N algorithm always outperforms the origi-nal algorithm, by as much as 10%, which correspondsto 21 additional lives saved. In some cases, WSPTgenerates more than 5% less benefit than the originalalgorithm; this is expected because, as discussed in§3.1, WSPT is suboptimal.
5.4. Simulation Results: ComorbiditiesWe now consider the impact of incorporating comor-bidities in triaging patients. Determining the presenceof comorbidities may be costly or difficult. This deter-mination has to be made within the first hours andcertainly within the first day as triage decisions aremade. Some comorbidities, such as obesity, can eas-ily be determined upon simple examination, whereasothers, such as HIV, may be less so. Although somecomorbidities will show up via routine blood workdone upon arrival at the hospital, the laboratory maybe overwhelmed in a disaster scenario, causing delaysin obtaining these results. Additionally, some patientsmay arrive at the hospital unconscious or they maybe intubated immediately upon arrival to the hospital,making it difficult or impossible for them to commu-nicate which comorbidities they have. As informationabout comorbidities becomes available, they can beused to transfer patients to the correct tier.
The NYC Task Force was hesitant to incorporatecomorbidities into the triage algorithm because ofpotential difficulties in identifying the presence ofcomorbidities. However, as seen in Thombs et al.(2007), the presence of comorbidities can significantlyaffect mortality and LOS, which will ultimately affecta patient’s triage priority. Uncertainty about the pres-ence of a comorbidity may result in an incorrect triagepriority, ultimately resulting in a reduction in totalaverage benefit generated by the triage algorithm. Onthe other hand, the impact of some comorbidities maybe so limited that knowledge of them would not sig-nificantly affect the expected benefit. Therefore, it isimportant to determine which comorbidities are likelyto be worth the cost of identifying for use in triage.
For each comorbidity, j , with associated odds ratioORj , transform coefficient TCj , and prevalence qj , con-sider the following two extreme scenarios:
1. Perfect information of comorbidity j is avail-able. That is, we know whether each patient does
Dow
nloa
ded
from
info
rms.
org
by [
128.
59.2
22.1
07]
on 1
2 Ju
ly 2
016,
at 1
2:23
. Fo
r pe
rson
al u
se o
nly,
all
righ
ts r
eser
ved.

Chan et al.: Prioritizing Burn-Injured Patients During a Disaster182 Manufacturing & Service Operations Management 15(2), pp. 170–190, © 2013 INFORMS
Figure 3 Relative Improvement of Average Additional Survivors
200 250 300 350 400–0.05
0.00
0.05
0.10
Number of patients
Rel
ativ
e im
prov
emen
tImprovement in the objective, Scenario 1
200 250 300 350 400–0.05
0.00
0.05
0.10
Number of patients
Rel
ativ
e im
prov
emen
t
Improvement in the objective, Scenario 2
200 250 300 350 400–0.05
0.00
0.05
0.10
Number of patients
Rel
ativ
e im
prov
emen
t
Improvement in the objective, Scenario 3
200 250 300 350 400–0.05
0.00
0.05
0.10
Number of patients
Rel
ativ
e im
prov
emen
t
Improvement in the objective, Scenario 4
P0
WSPT
Proposed-N
or does not have comorbidity j , in which case wecan adjust the survival probability and LOS accord-ingly as described in (5). That is, if the patient has thecomorbidity, PA
i = P Yi and LA
i = LYi , else PA
i = PNi and
LAi = LN
i .2. No information of comorbidity j is available.
We assume each patient has comorbidity j withprobability qj , where qj is the prevalence of comor-bidity j in the population. The expectation of theadjusted probability and probability of completingwithin three days are
PAi = qjP
Yi + 41 − qj5P
Ni 1
E6P4Si < 357= E6e3/LAi 7= qje3/LYi + 41 − qj5e
3/LNi 1(8)
where PNi and LN
i are the nominal survival proba-bility and LOS, respectively, given that patient i hasno comorbidities. Patient i’s index is then given byãPiE6e
3/LAi 7, with ãPi =wiPAi .
For each comorbidity, we compare the averageadditional number of survivors due to burn bed treat-ment in each scenario. In particular, we examinethe relative improvement of having perfect informa-tion for comorbidity j versus having no informa-tion. Again, we consider the four scenarios based onthe previous disaster events. Because these referencesdo not have information regarding comorbidities, werandomly generated comorbidities for each patient
based on the available prevalence data in Table 6. Wegenerated 10,000 patient cohorts and correspondingrealizations of LOS, survival, inhalation injury, and(non) existence of comorbidity j .
The comorbidities with significant impact are sum-marized in Table 11. The comorbidities that are omit-ted have no significant impact due to the smalleffect on LOS or survival and/or due to low preva-lence. In all scenarios, renal disease has the mostsignificant improvement for having full informa-tion versus no information with relative improve-ment 1.381%–1.578%. The relative improvement forall remaining comorbidities is less than 0.5%—morethan a factor of two less than renal disease. We notethat in this case, renal disease includes varying lev-els of disease severity and is defined by 13 differentICD9 codes, one of which corresponds to end-stagerenal disease. Recognizing that highly complex algo-rithms that require a lot of information gathering andtraining will be difficult to implement during disasterscenarios, we elect to include only one comorbidity inthe final triage algorithm: renal disease.
5.5. Performance of the ProposedTriage Algorithm
The final triage algorithm we propose prioritizespatients based on the index that is the ratio of theirbenefit in probability of survival from treatment in a
Dow
nloa
ded
from
info
rms.
org
by [
128.
59.2
22.1
07]
on 1
2 Ju
ly 2
016,
at 1
2:23
. Fo
r pe
rson
al u
se o
nly,
all
righ
ts r
eser
ved.

Chan et al.: Prioritizing Burn-Injured Patients During a DisasterManufacturing & Service Operations Management 15(2), pp. 170–190, © 2013 INFORMS 183
Table 11 Impact of Comorbidity Information: Relative Improvement and Standard Error in Percentages
Relative improvement (std. err.)
Comorbidity category Scenario 1 Scenario 2 Scenario 3 Scenario 4
Renal disease 10534 (0.036) 10486 (0.038) 10578 (0.043) 10381 (0.040)Obesity 00332 (0.029) 00356 (0.030) 00402 (0.033) 00332 (0.033)Liver disease 00288 (0.017) 00313 (0.018) 00335 (0.020) 00277 (0.018)HIV/AIDS 00119 (0.008) 00108 (0.009) 00109 (0.010) 00090 (0.009)Pulmonary circulation disorders 00101 (0.013) 00108 (0.014) 00134 (0.016) 00117 (0.015)Alcohol abuse 00087 (0.013) 00095 (0.014) 00109 (0.016) 00082 (0.015)Congestive heart failure 00074 (0.010) 00061 (0.011) 00071 (0.012) 00047 (0.011)Metastatic cancer 00045 (0.007) 00033 (0.007) 00052 (0.008) 00047 (0.007)Peripheral vascular disorders 00028 (0.007) 00025 (0.007) 00031 (0.008) 00041 (0.007)
Figure 4 Relative Improvement of Average Increase in Number of Survivors Due to Tier 1 Treatment: Proposed-W vs. Proposed-N
250 300 350 4000.000
0.005
0.010
0.015
0.020
Number of patients
Rel
ativ
e im
prov
emen
t
Improvement in the objective, Scenario 1
Proposed-W vs. proposed-N
250 300 350 4000.000
0.005
0.010
0.015
0.020
Number of patients
Rel
ativ
e im
prov
emen
t
Improvement in the objective, Scenario 2
250 300 350 4000.000
0.005
0.010
0.015
0.020
Number of patients
Rel
ativ
e im
prov
emen
t
Improvement in the objective, Scenario 3
250 300 350 4000.000
0.005
0.010
0.015
0.020
Number of patients
Rel
ativ
e im
prov
emen
t
Improvement in the objective, Scenario 4
burn bed to their adjusted probability of completingtreatment within three days: ãPA
i e3/LAi . A patient’s
LOS and benefit are adjusted if the patient has renaldisease, but ignores all other comorbidities. In oursimulations, we assume full knowledge of renal dis-ease because this may be detected through routineblood tests.2 In more extreme cases of renal disease,such as chronic, end-stage renal disease requiring
2 We note that other insults to the renal system that may resultfrom acute burn trauma or resuscitation process can mimic thesefindings.
dialysis, a physical exam that reveals an implanteddialysis catheter can reveal such a condition. Usingour simulation model described in Appendix A, wecompare the performance in terms of average increasein number of survivors due to burn bed treatment ofthe proposed-W triage algorithm to the proposed-Nalgorithm (Figure 4) and to the original one that wasproposed in Yurt et al. (2008) (Figure 5), which do notutilize comorbidity information to adjust a patient’sprobability of survival and expected LOS. In allscenarios, the proposed-W algorithm achieves over1.5% more reward (3 additional lives saved) than the
Dow
nloa
ded
from
info
rms.
org
by [
128.
59.2
22.1
07]
on 1
2 Ju
ly 2
016,
at 1
2:23
. Fo
r pe
rson
al u
se o
nly,
all
righ
ts r
eser
ved.
Chan et al.: Prioritizing Burn-Injured Patients During a Disaster184 Manufacturing & Service Operations Management 15(2), pp. 170–190, © 2013 INFORMS
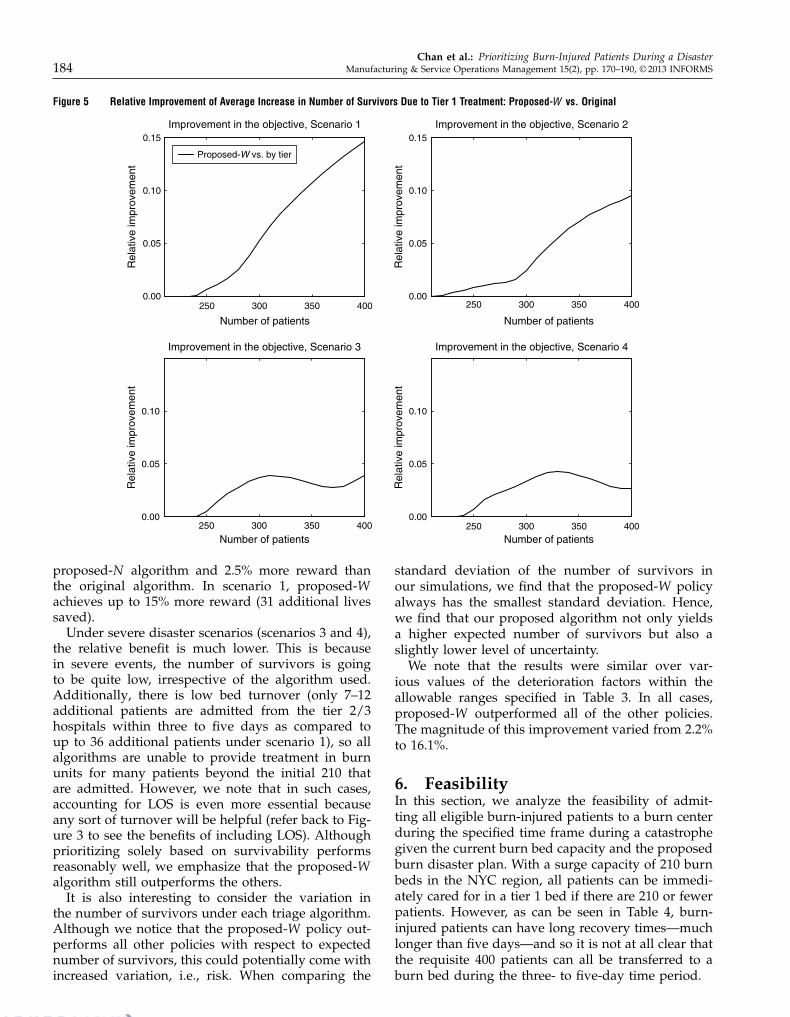
Figure 5 Relative Improvement of Average Increase in Number of Survivors Due to Tier 1 Treatment: Proposed-W vs. Original
250 300 350 4000.00
0.05
0.10
0.15
Number of patients
Rel
ativ
e im
prov
emen
tImprovement in the objective, Scenario 1
Proposed-W vs. by tier
250 300 350 4000.00
0.05
0.10
0.15
Number of patients
Rel
ativ
e im
prov
emen
t
Improvement in the objective, Scenario 2
250 300 350 4000.00
0.05
0.10
Number of patients
Rel
ativ
e im
prov
emen
t
Improvement in the objective, Scenario 3
250 300 350 4000.00
0.05
0.10
Number of patients
Rel
ativ
e im
prov
emen
t
Improvement in the objective, Scenario 4
proposed-N algorithm and 2.5% more reward thanthe original algorithm. In scenario 1, proposed-Wachieves up to 15% more reward (31 additional livessaved).
Under severe disaster scenarios (scenarios 3 and 4),the relative benefit is much lower. This is becausein severe events, the number of survivors is goingto be quite low, irrespective of the algorithm used.Additionally, there is low bed turnover (only 7–12additional patients are admitted from the tier 2/3hospitals within three to five days as compared toup to 36 additional patients under scenario 1), so allalgorithms are unable to provide treatment in burnunits for many patients beyond the initial 210 thatare admitted. However, we note that in such cases,accounting for LOS is even more essential becauseany sort of turnover will be helpful (refer back to Fig-ure 3 to see the benefits of including LOS). Althoughprioritizing solely based on survivability performsreasonably well, we emphasize that the proposed-Walgorithm still outperforms the others.
It is also interesting to consider the variation inthe number of survivors under each triage algorithm.Although we notice that the proposed-W policy out-performs all other policies with respect to expectednumber of survivors, this could potentially come withincreased variation, i.e., risk. When comparing the
standard deviation of the number of survivors inour simulations, we find that the proposed-W policyalways has the smallest standard deviation. Hence,we find that our proposed algorithm not only yieldsa higher expected number of survivors but also aslightly lower level of uncertainty.
We note that the results were similar over var-ious values of the deterioration factors within theallowable ranges specified in Table 3. In all cases,proposed-W outperformed all of the other policies.The magnitude of this improvement varied from 2.2%to 16.1%.
6. FeasibilityIn this section, we analyze the feasibility of admit-ting all eligible burn-injured patients to a burn centerduring the specified time frame during a catastrophegiven the current burn bed capacity and the proposedburn disaster plan. With a surge capacity of 210 burnbeds in the NYC region, all patients can be immedi-ately cared for in a tier 1 bed if there are 210 or fewerpatients. However, as can be seen in Table 4, burn-injured patients can have long recovery times—muchlonger than five days—and so it is not at all clear thatthe requisite 400 patients can all be transferred to aburn bed during the three- to five-day time period.
Dow
nloa
ded
from
info
rms.
org
by [
128.
59.2
22.1
07]
on 1
2 Ju
ly 2
016,
at 1
2:23
. Fo
r pe
rson
al u
se o
nly,
all
righ
ts r
eser
ved.

Chan et al.: Prioritizing Burn-Injured Patients During a DisasterManufacturing & Service Operations Management 15(2), pp. 170–190, © 2013 INFORMS 185
Figure 6 Feasibility: Number of Beds Fixed at 210
200 250 300 350 4000.5
0.6
0.7
0.8
0.9
1.0
Number of patients
Fra
ctio
n of
pat
ient
s ad
mitt
edFraction of patients admitted, Scenario 1
Proposed
200 250 300 350 4000.5
0.6
0.7
0.8
0.9
1.0
Number of patients
Fra
ctio
n of
pat
ient
s ad
mitt
ed
Fraction of patients admitted, Scenario 2
200 250 300 350 4000.5
0.6
0.7
0.8
0.9
1.0
Number of patients
Fra
ctio
n of
pat
ient
s ad
mitt
ed
Fraction of patients admitted, Scenario 3
200 250 300 350 4000.5
0.6
0.7
0.8
0.9
1.0
Number of patients
Fra
ctio
n of
pat
ient
s ad
mitt
ed
Fraction of patients admitted, Scenario 4
The feasibility of meeting the government mandatewill be highly dependent on the size of the event,i.e., the number of patients, as well as the sever-ity of the patients. If most patients have minimalburns (i.e., TBSA < 10%), they will have shorter LOS;there will be more turnover in the tier 1 burn beds;and more patients can be cared for in the first fewdays following the event. On the other hand, if mostpatients have very severe burns, they will have verylong LOS, and it is unlikely that many new patientswill be transferred within the specified time frame.
We consider the four scenarios for events assummarized in Table 9. The number of tier 1beds is fixed at 210, and we vary the number ofpatients in the event. For all of our simulations,we use the proposed-W triage algorithm, whichincludes information about renal disease and pri-oritizes patients according to their score: ãPie
3/LAi .Figure 6 shows the percentage of admitted patients.With more than 250 patients, some patients cannot betransferred within the specified three- to five-day win-dow. In events with more severe patients (scenarios 3and 4), more than 45% of the 400 patients cannot betransferred within the desired time frame.
6.1. Clearing Current PatientsIn assessing the feasibility of meeting the govern-ment mandate, we assumed that the burn centers
could be cleared of all current patients in order toaccommodate new patients from the burn disaster. OnSeptember 11, 2001, NYP was able to transfer all cur-rent patients to make room for all new burn-injuredpatients (Yurt et al. 2005). However, there were only41 burn-injured patients who were directly admittedor transferred into a burn center, which is substan-tially smaller than the 400 required by the federalgovernment.
NYP has one of the largest burn centers in the coun-try with 40 beds. We obtained data on all patientswho were treated in this center during 2009, includingpatient age, burn severity as measured by TBSA, pres-ence of inhalation injury, gender, LOS, and comorbid-ity information. Although the patient population andseverity of these 775 patients is quite different thanprior burn disasters, we can utilize this data to con-sider the likelihood of clearing all patients if a disasteroccurs.
In 2009, the average daily arrival rate was 2.12 perday, with a standard deviation of 1.56. Daily arrivalsranged from zero to seven. Figure C.1 in Appendix Cshows the monthly and day-of-week patterns of dailyarrivals. There was a peak in arrivals from Januaryto April, which is consistent with anecdotal evidencefrom the burn clinicians, because burns are muchmore common in the winter months. Differences in
Dow
nloa
ded
from
info
rms.
org
by [
128.
59.2
22.1
07]
on 1
2 Ju
ly 2
016,
at 1
2:23
. Fo
r pe
rson
al u
se o
nly,
all
righ
ts r
eser
ved.

Chan et al.: Prioritizing Burn-Injured Patients During a Disaster186 Manufacturing & Service Operations Management 15(2), pp. 170–190, © 2013 INFORMS
Figure 7 Feasibility: Number of Patients Fixed at 400
50 100 150 2000.0
0.1
0.2
0.3
0.4
0.5
0.6
0.7
Number of beds
Fra
ctio
n of
pat
ient
s ad
mitt
edFraction of patients admitted, Scenario 1
Proposed
50 100 150 2000.0
0.1
0.2
0.3
0.4
0.5
0.6
0.7
Number of beds
Fra
ctio
n of
pat
ient
s ad
mitt
ed
Fraction of patients admitted, Scenario 2
50 100 150 2000.0
0.1
0.2
0.3
0.4
0.5
0.6
0.7
Number of beds
Fra
ctio
n of
pat
ient
s ad
mitt
ed
Fraction of patients admitted, Scenario 3
50 100 150 2000.0
0.1
0.2
0.3
0.4
0.5
0.6
0.7
Number of beds
Fra
ctio
n of
pat
ient
s ad
mitt
ed
Fraction of patients admitted, Scenario 4
arrival rate across days of the week are not signif-icant, although the number of admissions on Tues-days is slightly higher. More importantly, the burnspecialists at the NYP burn center estimate that theburn center is overcrowded on the order of twicea week during winter months. Hence, the numberof beds that are available to care for burn disasterpatients is likely to vary significantly depending onwhen the event takes place. Some current patientsmay be too severely injured to move out of the burncenter, effectively removing beds from the disasterplan. The assumption of being able to clear all currentpatients is highly optimistic, making the feasibility oftransferring all patients even more unlikely.
Given the possibility of having fewer than the max-imum 210 beds, we consider how much more diffi-cult it is to satisfy the federal mandate when fewerbeds are available. Specifically, we assume there are400 burn-injured patients, as given by the federalmandate, and consider the percentage of patientswho are admitted within their deadline of three orfive days, as appropriate. As seen in Figure 7, for awide range of scenarios, it is likely that fewer than200 patients (i.e., <50%) will be able to receive tier 1care within the desired time frame.
Clearly, the NYC disaster plan cannot meet theguidelines of the Federal Health Resources andServices Administration. To treat 50 burn-injuredpatients per million in population in NYC, moreresources would be needed. Either more actual burnbeds with the corresponding surgical facilities andprofessional staff capabilities would need to be pro-vided or federal support to transport patients to burncenters in other states would be necessary to care forall 400 burn-injured patients. The amount of addi-tional resources needed would vary depending on thetype and size of event.
7. Conclusions and DiscussionHospital systems and governments must be preparedto handle potential disaster events where the numberof patients who seek care exceeds the initial availableresources. Federal guidelines specify that metropoli-tan areas be able to care for 50 burn-injured patientsper million in the three to five days following suchan event. In this paper, we presented a triage systemto maximize the expected benefit and applied it toevaluate the feasibility of meeting this standard giventhe mix of burn trauma beds and non–burn traumabeds that have been designated for use during a burn
Dow
nloa
ded
from
info
rms.
org
by [
128.
59.2
22.1
07]
on 1
2 Ju
ly 2
016,
at 1
2:23
. Fo
r pe
rson
al u
se o
nly,
all
righ
ts r
eser
ved.

Chan et al.: Prioritizing Burn-Injured Patients During a DisasterManufacturing & Service Operations Management 15(2), pp. 170–190, © 2013 INFORMS 187
disaster in New York City. This triage algorithm is thefirst to incorporate burn center LOS and comorbidi-ties to prioritize patients for transfer to burn beds.
Given the initial proposed NYC disaster plan,which utilizes burn beds in NYC and hospitals withina 60-mile radius region that have agreed to assist inan event, it is highly unlikely that all burn-injuredpatients will be able to be transferred into a tier 1 burnbed within five days. Moreover, ignoring patient LOSand some comorbidities would additionally reducethe total benefit to treated patients. These findingspersuaded the NYC Task Force to incorporate thesefactors into their proposed revised triage plan. Leahyet al. (2012) described the current burn disaster planrecommendation by the NYC Task Force, includingthe triage plan described here, in addition to otherconsiderations such as medical training for EMS andtier 2/3 personnel and provider indemnity.
Although we focus on burn disaster planning inNYC, the insights gained from this work can beapplied to other cities. Because NYC is the largestcity in the United States, it is often seen as a modelfor other metropolitan areas. In particular, it is clearthat any triage system should incorporate LOS andsome comorbidities such as renal disease. The needto explore methods to expand resources to satisfy thefederal mandate depends on the current burn cen-ter resources and population. Certainly, NYC has thelargest patient requirement, but it also has one of thelargest (if not the largest) aggregate number of burnbeds. There are only 125 burn centers in the UnitedStates (American Burn Association 2009), so althoughthere are nine burn centers within a 60-mile radius ofNYC, other cities may be more limited in the numberof beds available at nearby burn centers. In situationswhere burn centers are available, these smaller citiesare likely to be even more capacity constrained thanNYC, making it even more essential to utilize a care-fully designed triage algorithm.
One limitation of this work is that all of the avail-able LOS data is based on scenarios where there isnot a large backlog of patients waiting to be trans-ferred into the burn center. Furthermore, the LOSfrom Saffle et al. (2005) is hospital LOS, not burn cen-ter LOS. However, these can be considered equivalentbecause most burn-injured patients are dischargeddirectly from the burn center. In a catastrophic sce-nario, it may be possible to transfer burn-injuredpatients to non–burn beds before they are ready tobe discharged from the hospital. This could free burnbeds earlier, enabling additional patients to receivethe necessary skin-grafting surgeries or wound care,thereby increasing the number of patients who areable to benefit from care in tier 1 beds. There is noavailable data regarding what the minimal LOS in theburn center would be; hence, we could not accurately
account for this in our model. It may be possibleto reduce LOS—a Canadian burn center was ableto reduce patient LOS for patients with TBSA lessthan 20% and who did not require surgery (Jansenet al. 2012). However, the majority of patients in thedisaster scenario considered in this paper are likely torequire surgery and/or have TBSA greater than 20%,therefore it is not clear whether any significant reduc-tion in LOS could be achieved in this situation.
Another limitation is that we have inferred the ben-efit of receiving treatment in a burn center withinthree to five days from the existing burn triage matrix.There is currently no quantitative data on the out-comes (survival or LOS) of burn-injured patients whoare not treated in specialized burn centers, nor isthere any evidence-based model of the impact ofdelay of surgery on mortality for patients in the firstfew days after injury. The only available informationis qualitative and minimal—i.e., more sophisticatedtreatments, which are often performed in burn cen-ters, have significantly improved LOS (Curreri et al.1980)—or based on clinical judgement, as in Yurt et al.(2008). However, as more data become available, ourmethodology can be modified appropriately.
Finally, our triage model, as any other triage model,assumes accurate knowledge of the burn size andseverity of each patient. However, anecdotal evidence(e.g., Lozano 2012) suggests that non–burn physi-cians often misjudge the extent of burns, resulting inboth overestimates and underestimates. One possibleremedy is the installation of high-resolution camerasin the tier 2/3 hospitals that would enable a burnspecialist to make the assessments of TBSA for triagepurposes. Such a program was successfully institutedat Lehigh Valley Health Network, Pennsylvania.
Despite these limitations, our work has improvedupon the burn disaster plan initially developed by theNYC Task Force and described in Yurt et al. (2008).In particular, our proposed triage algorithm, whichincorporates a continuous model for survival likeli-hood, patient LOS, and comorbidities, increases thenumber of survivors due to tier 1 treatment by upto 15%. Perhaps the most practically useful insightfrom this study is that the proposed tiered systemmay be sufficient in small to moderately sized events;however, the current resources are likely to be insuf-ficient when the number of patients is large and/orthe severity of burns is high. More generally, thisdemonstrates that non–burn beds that are used to sta-bilize patients awaiting care in a burn center havelimited usefulness because of the long LOS of severelyburned patients.
Appendix A. Simulation ModelWe now describe the simulation model that is used to ana-lyze various scenarios. This simulation model is based on themathematical model described in §4 as well as discussionswith burn physicians. There are currently 140 burn beds in
Dow
nloa
ded
from
info
rms.
org
by [
128.
59.2
22.1
07]
on 1
2 Ju
ly 2
016,
at 1
2:23
. Fo
r pe
rson
al u
se o
nly,
all
righ
ts r
eser
ved.
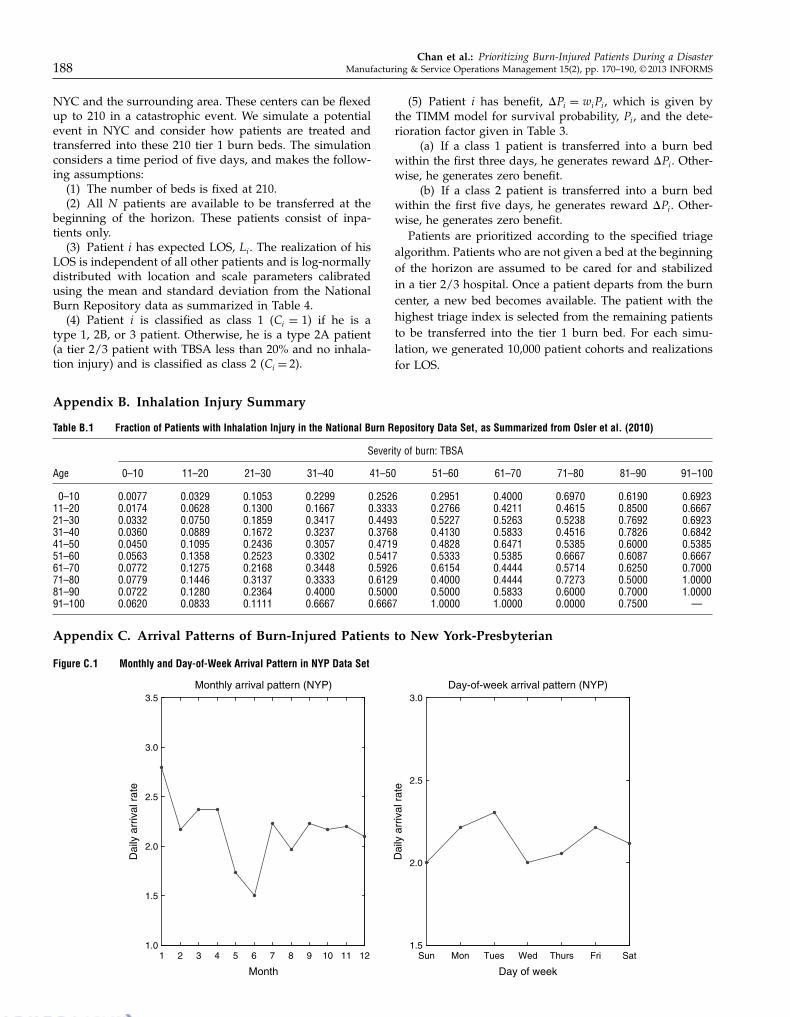
Chan et al.: Prioritizing Burn-Injured Patients During a Disaster188 Manufacturing & Service Operations Management 15(2), pp. 170–190, © 2013 INFORMS
NYC and the surrounding area. These centers can be flexedup to 210 in a catastrophic event. We simulate a potentialevent in NYC and consider how patients are treated andtransferred into these 210 tier 1 burn beds. The simulationconsiders a time period of five days, and makes the follow-ing assumptions:
(1) The number of beds is fixed at 210.(2) All N patients are available to be transferred at the
beginning of the horizon. These patients consist of inpa-tients only.
(3) Patient i has expected LOS, Li. The realization of hisLOS is independent of all other patients and is log-normallydistributed with location and scale parameters calibratedusing the mean and standard deviation from the NationalBurn Repository data as summarized in Table 4.
(4) Patient i is classified as class 1 (Ci = 1) if he is atype 1, 2B, or 3 patient. Otherwise, he is a type 2A patient(a tier 2/3 patient with TBSA less than 20% and no inhala-tion injury) and is classified as class 2 (Ci = 2).
Appendix B. Inhalation Injury Summary
Table B.1 Fraction of Patients with Inhalation Injury in the National Burn Repository Data Set, as Summarized from Osler et al. (2010)
Severity of burn: TBSA
Age 0–10 11–20 21–30 31–40 41–50 51–60 61–70 71–80 81–90 91–100
0–10 000077 000329 001053 002299 002526 002951 004000 006970 006190 00692311–20 000174 000628 001300 001667 003333 002766 004211 004615 008500 00666721–30 000332 000750 001859 003417 004493 005227 005263 005238 007692 00692331–40 000360 000889 001672 003237 003768 004130 005833 004516 007826 00684241–50 000450 001095 002436 003057 004719 004828 006471 005385 006000 00538551–60 000563 001358 002523 003302 005417 005333 005385 006667 006087 00666761–70 000772 001275 002168 003448 005926 006154 004444 005714 006250 00700071–80 000779 001446 003137 003333 006129 004000 004444 007273 005000 10000081–90 000722 001280 002364 004000 005000 005000 005833 006000 007000 10000091–100 000620 000833 001111 006667 006667 100000 100000 000000 007500 —
Appendix C. Arrival Patterns of Burn-Injured Patients to New York-Presbyterian
Figure C.1 Monthly and Day-of-Week Arrival Pattern in NYP Data Set
1 2 3 4 5 6 7 8 9 10 11 121.0
1.5
2.0
2.5
3.0
3.5Monthly arrival pattern (NYP)
Dai
ly a
rriv
al r
ate
Month
Sun Mon Tues Wed Thurs Fri Sat1.5
2.0
2.5
3.0Day-of-week arrival pattern (NYP)
Dai
ly a
rriv
al r
ate
Day of week
(5) Patient i has benefit, ãPi = wiPi, which is given bythe TIMM model for survival probability, Pi, and the dete-rioration factor given in Table 3.
(a) If a class 1 patient is transferred into a burn bedwithin the first three days, he generates reward ãPi. Other-wise, he generates zero benefit.
(b) If a class 2 patient is transferred into a burn bedwithin the first five days, he generates reward ãPi. Other-wise, he generates zero benefit.
Patients are prioritized according to the specified triagealgorithm. Patients who are not given a bed at the beginningof the horizon are assumed to be cared for and stabilizedin a tier 2/3 hospital. Once a patient departs from the burncenter, a new bed becomes available. The patient with thehighest triage index is selected from the remaining patientsto be transferred into the tier 1 burn bed. For each simu-lation, we generated 10,000 patient cohorts and realizationsfor LOS.
Dow
nloa
ded
from
info
rms.
org
by [
128.
59.2
22.1
07]
on 1
2 Ju
ly 2
016,
at 1
2:23
. Fo
r pe
rson
al u
se o
nly,
all
righ
ts r
eser
ved.
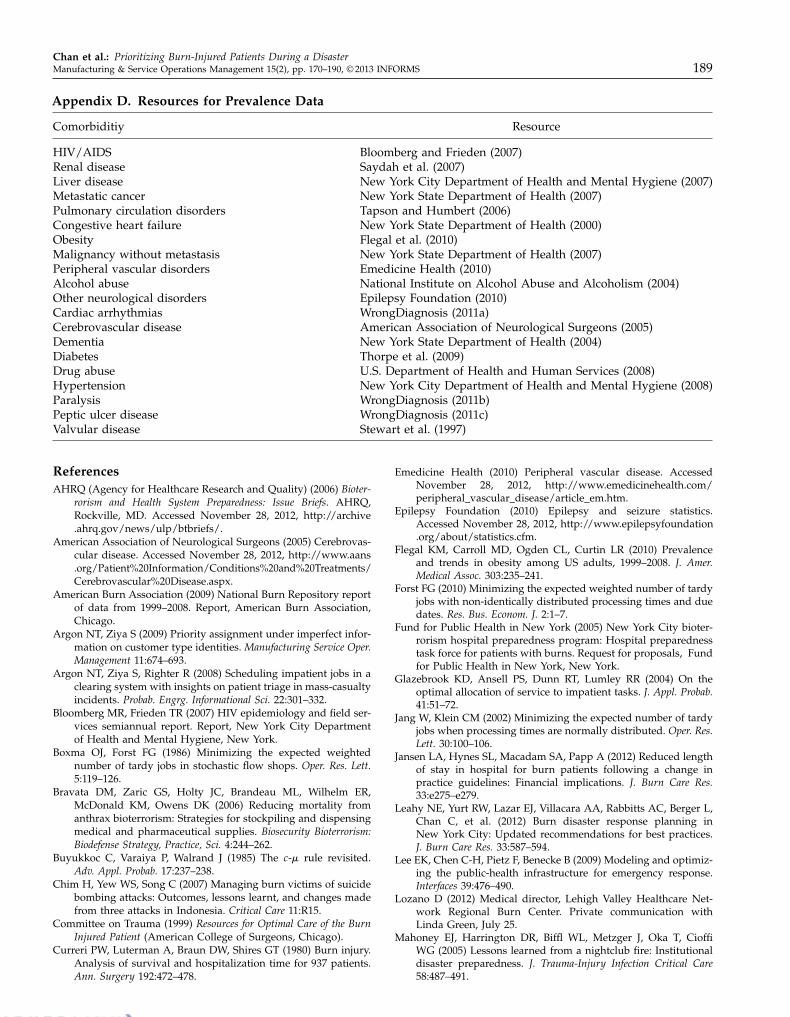
Chan et al.: Prioritizing Burn-Injured Patients During a DisasterManufacturing & Service Operations Management 15(2), pp. 170–190, © 2013 INFORMS 189
Appendix D. Resources for Prevalence Data
Comorbiditiy Resource
HIV/AIDS Bloomberg and Frieden (2007)Renal disease Saydah et al. (2007)Liver disease New York City Department of Health and Mental Hygiene (2007)Metastatic cancer New York State Department of Health (2007)Pulmonary circulation disorders Tapson and Humbert (2006)Congestive heart failure New York State Department of Health (2000)Obesity Flegal et al. (2010)Malignancy without metastasis New York State Department of Health (2007)Peripheral vascular disorders Emedicine Health (2010)Alcohol abuse National Institute on Alcohol Abuse and Alcoholism (2004)Other neurological disorders Epilepsy Foundation (2010)Cardiac arrhythmias WrongDiagnosis (2011a)Cerebrovascular disease American Association of Neurological Surgeons (2005)Dementia New York State Department of Health (2004)Diabetes Thorpe et al. (2009)Drug abuse U.S. Department of Health and Human Services (2008)Hypertension New York City Department of Health and Mental Hygiene (2008)Paralysis WrongDiagnosis (2011b)Peptic ulcer disease WrongDiagnosis (2011c)Valvular disease Stewart et al. (1997)
ReferencesAHRQ (Agency for Healthcare Research and Quality) (2006) Bioter-
rorism and Health System Preparedness: Issue Briefs. AHRQ,Rockville, MD. Accessed November 28, 2012, http://archive.ahrq.gov/news/ulp/btbriefs/.
American Association of Neurological Surgeons (2005) Cerebrovas-cular disease. Accessed November 28, 2012, http://www.aans.org/Patient%20Information/Conditions%20and%20Treatments/Cerebrovascular%20Disease.aspx.
American Burn Association (2009) National Burn Repository reportof data from 1999–2008. Report, American Burn Association,Chicago.
Argon NT, Ziya S (2009) Priority assignment under imperfect infor-mation on customer type identities. Manufacturing Service Oper.Management 11:674–693.
Argon NT, Ziya S, Righter R (2008) Scheduling impatient jobs in aclearing system with insights on patient triage in mass-casualtyincidents. Probab. Engrg. Informational Sci. 22:301–332.
Bloomberg MR, Frieden TR (2007) HIV epidemiology and field ser-vices semiannual report. Report, New York City Departmentof Health and Mental Hygiene, New York.
Boxma OJ, Forst FG (1986) Minimizing the expected weightednumber of tardy jobs in stochastic flow shops. Oper. Res. Lett.5:119–126.
Bravata DM, Zaric GS, Holty JC, Brandeau ML, Wilhelm ER,McDonald KM, Owens DK (2006) Reducing mortality fromanthrax bioterrorism: Strategies for stockpiling and dispensingmedical and pharmaceutical supplies. Biosecurity Bioterrorism:Biodefense Strategy, Practice, Sci. 4:244–262.
Buyukkoc C, Varaiya P, Walrand J (1985) The c-� rule revisited.Adv. Appl. Probab. 17:237–238.
Chim H, Yew WS, Song C (2007) Managing burn victims of suicidebombing attacks: Outcomes, lessons learnt, and changes madefrom three attacks in Indonesia. Critical Care 11:R15.
Committee on Trauma (1999) Resources for Optimal Care of the BurnInjured Patient (American College of Surgeons, Chicago).
Curreri PW, Luterman A, Braun DW, Shires GT (1980) Burn injury.Analysis of survival and hospitalization time for 937 patients.Ann. Surgery 192:472–478.
Emedicine Health (2010) Peripheral vascular disease. AccessedNovember 28, 2012, http://www.emedicinehealth.com/peripheral_vascular_disease/article_em.htm.
Epilepsy Foundation (2010) Epilepsy and seizure statistics.Accessed November 28, 2012, http://www.epilepsyfoundation.org/about/statistics.cfm.
Flegal KM, Carroll MD, Ogden CL, Curtin LR (2010) Prevalenceand trends in obesity among US adults, 1999–2008. J. Amer.Medical Assoc. 303:235–241.
Forst FG (2010) Minimizing the expected weighted number of tardyjobs with non-identically distributed processing times and duedates. Res. Bus. Econom. J. 2:1–7.
Fund for Public Health in New York (2005) New York City bioter-rorism hospital preparedness program: Hospital preparednesstask force for patients with burns. Request for proposals, Fundfor Public Health in New York, New York.
Glazebrook KD, Ansell PS, Dunn RT, Lumley RR (2004) On theoptimal allocation of service to impatient tasks. J. Appl. Probab.41:51–72.
Jang W, Klein CM (2002) Minimizing the expected number of tardyjobs when processing times are normally distributed. Oper. Res.Lett. 30:100–106.
Jansen LA, Hynes SL, Macadam SA, Papp A (2012) Reduced lengthof stay in hospital for burn patients following a change inpractice guidelines: Financial implications. J. Burn Care Res.33:e275–e279.
Leahy NE, Yurt RW, Lazar EJ, Villacara AA, Rabbitts AC, Berger L,Chan C, et al. (2012) Burn disaster response planning inNew York City: Updated recommendations for best practices.J. Burn Care Res. 33:587–594.
Lee EK, Chen C-H, Pietz F, Benecke B (2009) Modeling and optimiz-ing the public-health infrastructure for emergency response.Interfaces 39:476–490.
Lozano D (2012) Medical director, Lehigh Valley Healthcare Net-work Regional Burn Center. Private communication withLinda Green, July 25.
Mahoney EJ, Harrington DR, Biffl WL, Metzger J, Oka T, CioffiWG (2005) Lessons learned from a nightclub fire: Institutionaldisaster preparedness. J. Trauma-Injury Infection Critical Care58:487–491.
Dow
nloa
ded
from
info
rms.
org
by [
128.
59.2
22.1
07]
on 1
2 Ju
ly 2
016,
at 1
2:23
. Fo
r pe
rson
al u
se o
nly,
all
righ
ts r
eser
ved.

Chan et al.: Prioritizing Burn-Injured Patients During a Disaster190 Manufacturing & Service Operations Management 15(2), pp. 170–190, © 2013 INFORMS
National Institute on Alcohol Abuse and Alcoholism (2004)2001–2002 national epidemiologic survey on alcohol andrelated conditions. Accessed November 28, 2012, http://www.niaaa.nih.gov/publications/AA70/AA70.htm.
New York City Department of Health and Mental Hygiene (2007)Hepatitis A, B and C surveillance report: New York City, 2006and 2007. Accessed November 28, 2012, http://www.nyc.gov/html/doh/downloads/pdf/dires/dires-2008-report-semi1.pdf.
New York City Department of Health and Mental Hygiene(2008) EpiQuery: NYC interactive health data. AccessedNovember 28, 2012, http://a816-healthpsi.nyc.gov/epiquery/EpiQuery/index.html.
New York State Department of Health (2000) The burden of car-diovascular disease in New York: Mortality, prevalence, riskfactors, costs and selected populations. Accessed November28, 2012, http://www.health.ny.gov/diseases/cardiovascular/heart_disease/docs/burden_of_cvd_in_nys.pdf.
New York State Department of Health (2004) Dementias reportedin hospitalizations among New York State residents. AccessedNovember 28, 2012, http://www.health.state.ny.us/diseases/conditions/dementia/alzheimer/dementia_registry.htm.
New York State Department of Health (2007) New York StateCancer Registry estimated cancer prevalence by site of can-cer and gender, 2007. Accessed November 28, 2012, http://www.health.ny.gov/statistics/cancer/registry/pdf/table8.pdf.
Osler T, Glance LG, Hosmer DW (2010) Simplified estimates of theprobability of death after burn injuries: Extending and updat-ing the baux score. J Trauma 68:690–697.
Osler T, Glance LG, Hosmer DW (2011) Comparison of hospitalmortality rates after burn injury in New York state: A risk-adjusted population-based observational study. J. Trauma71:1040–1047.
Pinedo M (2008) Scheduling Theory, Algorithms, and Systems(Springer, New York).
Saffle JR, Gibran N, Jordan M (2005) Defining the ratio of out-comes to resources for triage of burn patients in mass casual-ties. J. Burn Care Rehabil. 26:478–482.
Saghafian S, Hopp W, Oyen MV, Desmond J, Kronick S (2011)Complexity-based triage: A tool for improving patient safetyand operational efficiency. Working paper, University ofMichigan, Ann Arbor.
Saydah, S, Eberhardt M, Rios-Burrows N, Williams D, Geiss L(2007) Prevalence of chronic kidney disease and associated riskfactors—United States 1999–2004. J. Burn Care Res. 56:161–165.
Sheridan R, Wber J, Prelack K, Petras L, Lydon M, Tompkins R(1999) Early burn center transfer shortens the length of hospi-tilization and reduces complications in children with seriousburn injuries. J. Burn Care Rehabil. 20:347–50.
Stewart BF, Siscovick D, Lind BK, Gardin JM, Gottdiener JS, SmithVE, Kitzman DW, Otto CM (1997) Clinical factors associatedwith calcific aortic valve disease. Cardiovascular health study.J. Amer. College Cardiology 29:630–634.
Tapson VF, Humbert M (2006) Incidence and prevalence of chronicthromboembolic pulmonary hypertension. Proc. Amer. ThoracicSoc. 3(7):564–567.
Thombs BD, Singh VA, Halonen J, Diallo A, Milner SM (2007) Theeffects of preexisting medical comorbidities on mortality andlength of hospital stay in acute burn injury: Evidence froma national sample of 31,338 adult patients. Ann. Surgery 245:629–634.
Thorpe LE, Upadhyay UD, Chamany S, Garg R, Mandel-Ricci J,Kellerman S, Berger DK, Frieden TR, Gwynn C (2009) Preva-lence and control of diabetes and impaired fasting glucose inNew York City. Diabetes Care 32:57–62.
U.S. Department of Health and Human Services (2008) Nationalsurvey on drug use and health. Accessed November 28, 2012,http://www.oas.samhsa.gov/nhsda.htm.
van Mieghem JA (1995) Dynamic scheduling with convex delaycosts: The generalized c � � rule. Ann. Appl. Probab. 5:809–833.
Wang SC (2010) Michigans plan for burn mass-casualty inci-dents. Report, State of Michigan Burn Coordinating Center,Ann Arbor. Accessed November 28, 2012, http://www.advocatehealth.com/documents/trauma/Regional%20Burn%20Response_Wang.pdf.
Wein LM, Choi Y, Denuit S (2010) Analyzing evacuation versusshelter-in-place strategies after a terrorist nuclear detonation.Risk Anal. 30:1315–1327.
WrongDiagnosis (2011a) Prevalence and incidence of arrhythmias.Accessed November 28, 2012, http://www.wrongdiagnosis.com/a/arrhythmias/prevalence.htm.
WrongDiagnosis (2011b) Prevalence and incidence of paralysis.Accessed November 28, 2012, http://www.wrongdiagnosis.com/p/paralysis/prevalence.htm.
WrongDiagnosis (2011c) Prevalence and incidence of peptic ulcer.Accessed November 28, 2012, http://www.wrongdiagnosis.com/p/peptic_ulcer/prevalence.htm.
Yurt RW, Bessey PQ, Bauer GJ, Dembicki R, Laznick H, Alden N,Rabbits A (2005) A regional burn centers response to a disaster:September 11, 2001, and the days beyond. J. Burn Care Rehabil.26:117–124.
Yurt RW, Lazar EJ, Leahy NE, Cagliuso NV, Rabbits AC,Akkapeddi V, Cooper A, Dajer A, Delaney J, Mineo F, Silber S,Soloff L, Magbitang K, Mozingo DW (2008) Burn disasterresponse planning: An urban region’s approach. J. Burn CareRehabil. 29:158–165.
Dow
nloa
ded
from
info
rms.
org
by [
128.
59.2
22.1
07]
on 1
2 Ju
ly 2
016,
at 1
2:23
. Fo
r pe
rson
al u
se o
nly,
all
righ
ts r
eser
ved.