method for prioritizing intersection improvements · method for prioritizing intersection...
TRANSCRIPT
Research Report
Research Project T9903, Task 50Intersection Improvement
January 1997
METHOD FOR PRIORITIZING INTERSECTIONIMPROVEMENTS
by
Larry LarsonTransportation Engineer
Fred L. ManneringProfessor of Civil Engineering
University of Washington
Washington State Transportation Center (TRAC)University of Washington, 354802
University District Building1107 N.E. 45th St., Suite 535Seattle, Washington 98105
Washington State Department of TransportationTechnical MonitorLester Rubstello
Traffic Operations Engineer
Prepared for
Washington State Transportation CommissionDepartment of Transportation
and in cooperation withU.S. Department of Transportation
Federal Highway Administration
TECHNICAL REPORT STANDARD TITLE PAGE1. REPORT NO. 2. GOVERNMENT ACCESSION NO. 3. RECIPIENT'S CATALOG NO.
WA-RD 413.1
4. TITLE AND SUBTITLE 5. REPORT DATE
Method for Prioritizing Intersection Improvements January 19976. PERFORMING ORGANIZATION CODE
7. AUTHOR(S) 8. PERFORMING ORGANIZATION REPORT NO.
Larry Larson and Fred L. Mannering
9. PERFORMING ORGANIZATION NAME AND ADDRESS 10. WORK UNIT NO.
Washington State Transportation Center (TRAC)University of Washington, 354802 11. CONTRACT OR GRANT NO.
University District Building; 1107 NE 45th Street, Suite 535 Agreement T9903, Task 50Seattle, Washington 98105-463112. SPONSORING AGENCY NAME AND ADDRESS 13. TYPE OF REPORT AND PERIOD COVERED
Washington State Department of TransportationTransportation Building, MS 7370
Research Report
Olympia, Washington 98504-7370 14. SPONSORING AGENCY CODE
15. SUPPLEMENTARY NOTES
This study was conducted in cooperation with the U.S. Department of Transportation, Federal HighwayAdministration.16. ABSTRACT
The most common type of intersection improvement considered by many state DOTs issignalization. The Washington State Department of Transportation (WSDOT) uses a system called theIntersection Priority Array, which was originally developed by Ching. This system provides a tool forobjectively considering numerous intersections. Although the system is useful, it only addresses theneed for and relative priority of a signal. It does not address other actions that may improve the safetyand efficiency of the intersection. The goal of this research project was to develop a system foranalyzing the need for left- and/or right-turn lane improvements to an intersection and prioritizing theseverity of that need.
Development of the system was based on two questions it would have to answer about theintersection:
1. Is a left- or right-turn lane recommended for a particular intersection? This question isanswered on the basis of traffic conditions and accident history. Threshold values for volume andaccident history are determined from published engineering studies.
2. How severe is the need for a turn lane compared to other intersections being considered? Toanswer this question, the system assigns dollar values to delay conditions and accident history specificto the intersection. Dollar values are assigned to accidents over the worst 12-month period in a 3-yearaccident history. The system then calculates the reduction in delay that would result from installing theleft- or right-turn lanes by using regression equations from published engineering studies or standardssuch as the Highway Capacity Manual.
The scaled sum of the accident and delay costs is the severity score for the specific intersectionimprovement.
The benefits of this system are that it is an objective method of ranking intersections againstothers and it is easy to use. It requires data that are easily obtainable from resources available at mosttraffic offices.17. KEY WORDS 18. DISTRIBUTION STATEMENT
Key words: channelization, left-turn lanes, right-turn lanes, prioritization
No restrictions. This document is available to thepublic through the National Technical InformationService, Springfield, VA 22616
19. SECURITY CLASSIF. (of this report) 20. SECURITY CLASSIF. (of this page) 21. NO. OF PAGES 22. PRICE
None None
DISCLAIMER
The contents of this report reflect the views of the authors, who are responsible for
the facts and the accuracy of the data presented herein. The contents do not necessarily
reflect the official views or policies of the Washington State Transportation Commission,
Department of Transportation, or the Federal Highway Administration. This report does
not constitute a standard, specification, or regulation.
TABLE OF CONTENTS
Section Page
EXECUTIVE SUMMARY........................................................................................ v
CHAPTER ONE. INTRODUCTION ...................................................................... 1
Problem ........................................................................................................................ 1Objectives..................................................................................................................... 2Development Strategy.................................................................................................. 2
Notes on Development Strategy ...................................................................... 3
CHAPTER TWO. STATE OF THE ART............................................................... 5
Literature Review......................................................................................................... 5Left-Turn Lanes ............................................................................................... 5Right-Turn Lanes ............................................................................................. 8
DOT Survey ................................................................................................................. 9
CHAPTER THREE. RESULTS............................................................................... 15
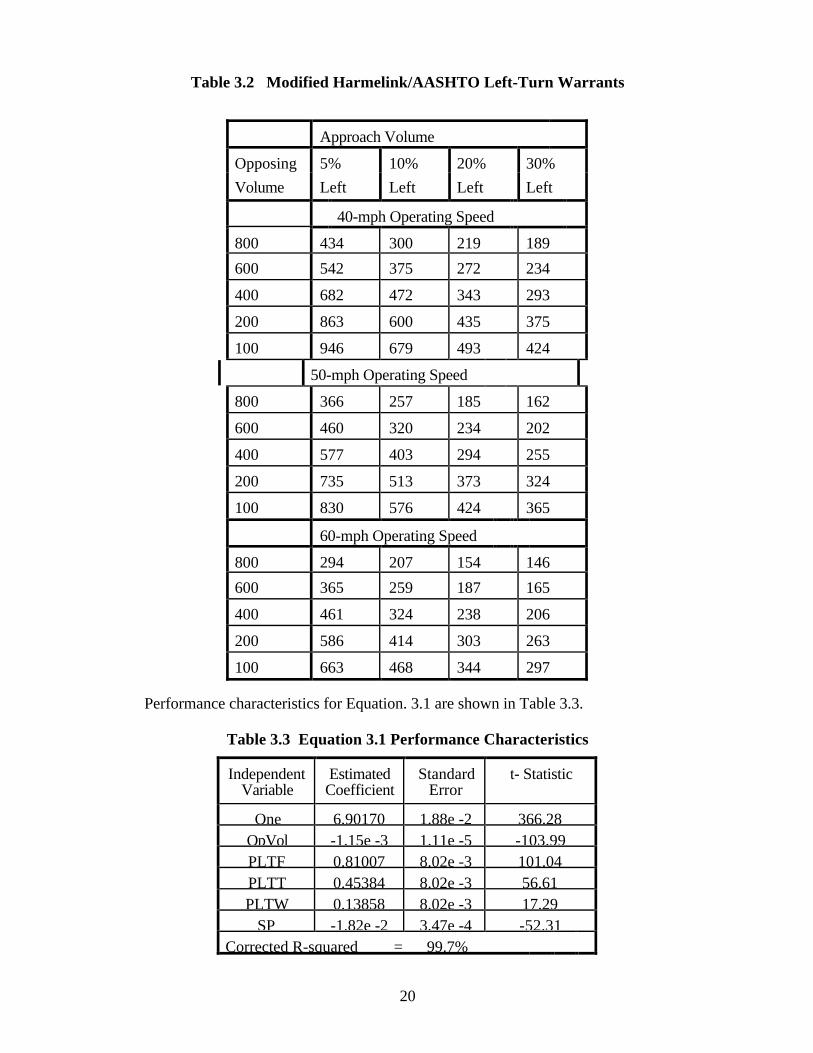
Methodology ................................................................................................................ 15Left-Turn Accident Guideline...................................................................................... 17Left-Turn Lane Volume Guideline .............................................................................. 18
Two-Lane Highways........................................................................................ 18Four-Lane Highways........................................................................................ 22
Left-Turn Lane Severity Score .................................................................................... 25Accident Severity Score................................................................................... 25
Accident Analysis Period Modifications ............................................. 27Accident Threshold Modifications....................................................... 28
Delay Severity Score........................................................................................ 28Right-Turn Lane Accident Guideline .......................................................................... 35Right-Turn Lane Volume Guideline ............................................................................ 35Right-Turn Lane Severity Score .................................................................................. 38
Accident Severity Score................................................................................... 38Delay Severity Score........................................................................................ 38
CHAPTER FOUR. DATA COMPILATION AND FIELD STUDIES................. 40
Locational and Characteristic Information .................................................................. 41Peak Hour Volume Information................................................................................... 41Accident Information .................................................................................................. 41Relevant Information ................................................................................................... 42
CHAPTER FIVE. RECOMMENDATIONS AND CONCLUSIONS................... 43
Future Research Needed .............................................................................................. 43Conclusions.................................................................................................................. 43
iii

REFERENCES........................................................................................................... 45
APPENDIX ................................................................................................................. A-1
LIST OF FIGURES
Figure Page
3.1 Edit Form .......................................................................................... 163.2 Left-Turn Individual Intersection Report.......................................... 17
LIST OF TABLES
Table Page
2.1 FHWA Collision Cost Factors .......................................................... 72.2 WSDOT Collision Cost Factors........................................................ 82.3 Right-Turn Lane Survey Results....................................................... 112.4 Left-Turn Lane Survey Results......................................................... 133.1 Harmelink/AASHTO Left-Turn Warrants........................................ 193.2 Modified Harmelink/AASHTO Left-Turn Warrants........................ 203.3 Equation 3.1 Performance Characteristics ........................................ 203.4 Equation 3.2 Performance Characteristics ........................................ 213.5 Equation 3.4 Performance Characteristics ........................................ 223.6 Equation 3.5 Performance Characteristics ........................................ 233.7 Equation 3.6 Performance Characteristics ........................................ 233.8 Equation 3.7 Performance Characteristics ........................................ 243.9 Severity Percentages for Rural Accidents......................................... 27
3.10 Severity Percentages for Urban Accidents........................................ 27
iv
EXECUTIVE SUMMARY
The most common type of intersection improvement considered by many state DOTs is
signalization. The Washington State Department of Transportation (WSDOT) uses a system called
the Intersection Priority Array, which was originally developed by Ching (Ching, 1979). This
system provides a tool for objectively considering numerous intersections. Although the system is
useful, it only addresses the need for and relative priority of a signal. It does not address other
actions that may improve the safety and efficiency of the intersection.
The goal of this research project was to develop a system for analyzing the need for left-
and/or right-turn lane improvements to an intersection and prioritizing the severity of that need. To
be effective the system needed to be
• based on engineering studies
• objective and logical
• easy to use
• able to use easily obtainable data
• able to adapt to changing standards
• accepted by operation engineers, management, and planners.
RESEARCH APPROACH
To accomplish the objectives an extensive literature search was undertaken. A survey was
also sent to each state department of transportation in the United States. From these sources,
methods of analysis were chosen that could be programmed into a computer database program. A
database program was developed to accomplish the goals listed above.
The results of the original project were implemented by WSDOT’s Northwest Region.
After a six-month implementation and testing period, the performance of the system was reviewed,
and some changes were made to the methodology.
PRIORITIZATION STRATEGY
Development of the system was based on two questions it would have to answer about the
intersection:
vi
1. Is a left- or right-turn lane recommended for a particular intersection?
2. How severe is the need for a turn lane compared to other intersections being
considered?
The first question is answered on the basis of traffic conditions and accident history.
Threshold values for volume and accident history are determined from published engineering
studies. The volume threshold for left-turn lanes is based on a modified AASHTO table (Kikuchi
and Chakroborty 1991). The accident threshold for left-turn lanes is four preventable accidents in
a 12-month period (Agent 1983). The volume threshold for right-turn lanes is based on warrant
graphs developed by Cottrell (Cottrell 1981). The accident guideline for right-turn lanes is five
preventable accidents in a 12-month period. This number is a based on other warrant guidelines
for traffic control devices and has no statistical basis.
To answer the second question, the system assigns dollar values to delay conditions and
accident history specific to the intersection. Dollar values are assigned to accidents over the worst
12-month period in a 3-year accident history. The dollar values are taken from the Federal
Highway Administration (FHWA 1991) and WSDOT (Wessels and Limotti 1992) guidelines for
the Most Severe Injury (MSVJ) of an accident. The system then calculates the reduction in delay
that would result from installing the left- or right-turn lanes by using regression equations from
published engineering studies or standards such as the Highway Capacity Manual (HCM).
The scaled sum of the accident and delay costs is the severity score for the specific
intersection improvement.
NEED FOR A LEFT-TURN LANE
Left-Turn Lane Accident Guideline
The left-turn accident guideline is the threshold number of accidents that would justify
installation of a left-turn lane. Agent’s proposal (Agent 1983) of four preventable accidents during
a 12-month period was originally adopted for this guideline. As implemented, the 12-month
period was taken from a three-year history. A preventable accident is assumed to be any accident
vii
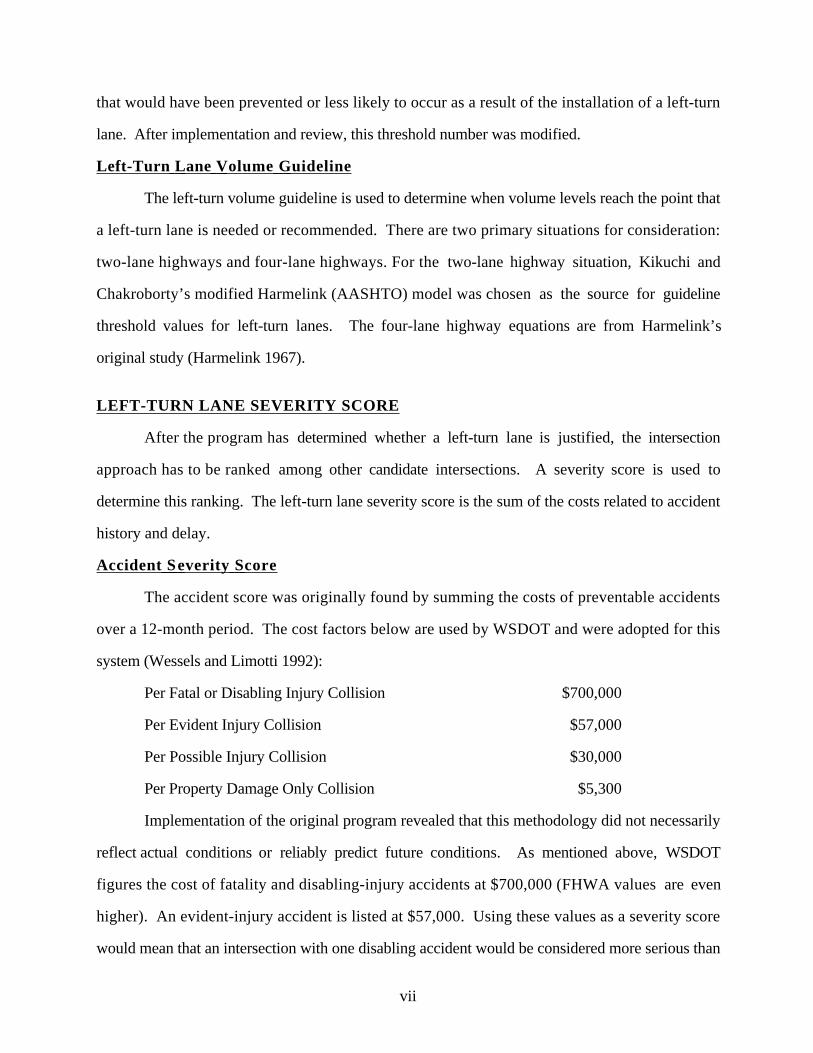
that would have been prevented or less likely to occur as a result of the installation of a left-turn
lane. After implementation and review, this threshold number was modified.
Left-Turn Lane Volume Guideline
The left-turn volume guideline is used to determine when volume levels reach the point that
a left-turn lane is needed or recommended. There are two primary situations for consideration:
two-lane highways and four-lane highways. For the two-lane highway situation, Kikuchi and
Chakroborty’s modified Harmelink (AASHTO) model was chosen as the source for guideline
threshold values for left-turn lanes. The four-lane highway equations are from Harmelink’s
original study (Harmelink 1967).
LEFT-TURN LANE SEVERITY SCORE
After the program has determined whether a left-turn lane is justified, the intersection
approach has to be ranked among other candidate intersections. A severity score is used to
determine this ranking. The left-turn lane severity score is the sum of the costs related to accident
history and delay.
Accident S everity Score
The accident score was originally found by summing the costs of preventable accidents
over a 12-month period. The cost factors below are used by WSDOT and were adopted for this
system (Wessels and Limotti 1992):
Per Fatal or Disabling Injury Collision $700,000
Per Evident Injury Collision $57,000
Per Possible Injury Collision $30,000
Per Property Damage Only Collision $5,300
Implementation of the original program revealed that this methodology did not necessarily
reflect actual conditions or reliably predict future conditions. As mentioned above, WSDOT
figures the cost of fatality and disabling-injury accidents at $700,000 (FHWA values are even
higher). An evident-injury accident is listed at $57,000. Using these values as a severity score
would mean that an intersection with one disabling accident would be considered more serious than
viii
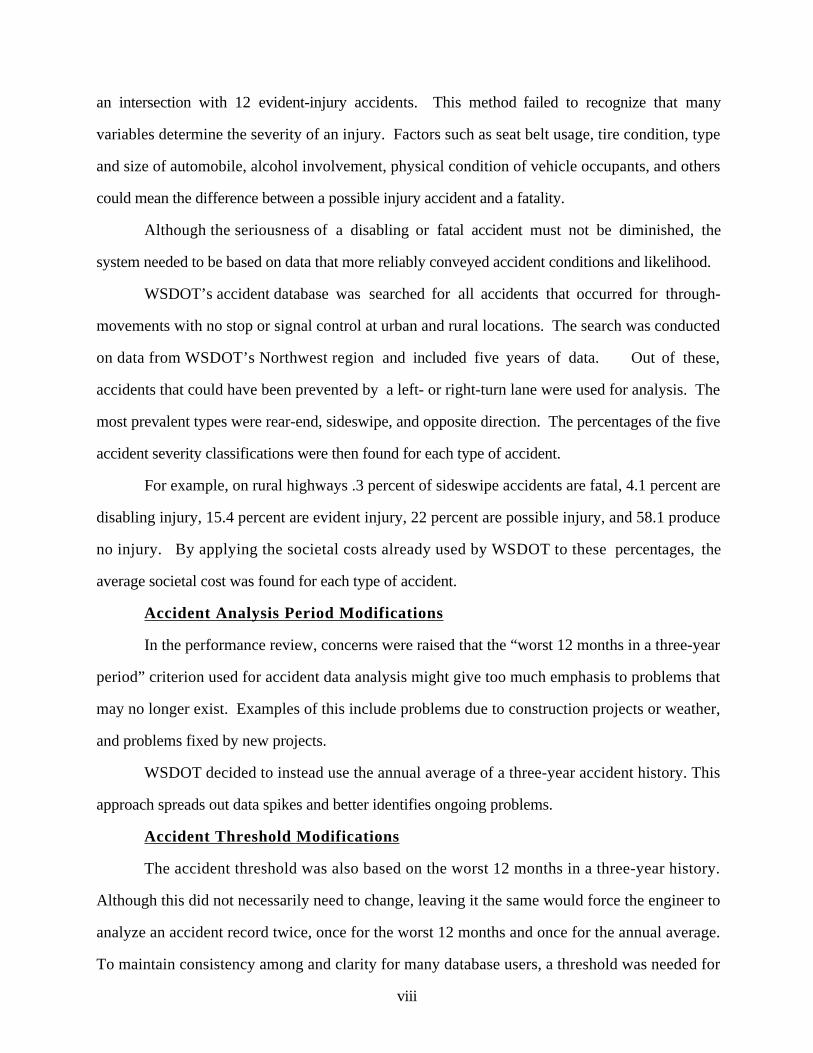
an intersection with 12 evident-injury accidents. This method failed to recognize that many
variables determine the severity of an injury. Factors such as seat belt usage, tire condition, type
and size of automobile, alcohol involvement, physical condition of vehicle occupants, and others
could mean the difference between a possible injury accident and a fatality.
Although the seriousness of a disabling or fatal accident must not be diminished, the
system needed to be based on data that more reliably conveyed accident conditions and likelihood.
WSDOT’s accident database was searched for all accidents that occurred for through-
movements with no stop or signal control at urban and rural locations. The search was conducted
on data from WSDOT’s Northwest region and included five years of data. Out of these,
accidents that could have been prevented by a left- or right-turn lane were used for analysis. The
most prevalent types were rear-end, sideswipe, and opposite direction. The percentages of the five
accident severity classifications were then found for each type of accident.
For example, on rural highways .3 percent of sideswipe accidents are fatal, 4.1 percent are
disabling injury, 15.4 percent are evident injury, 22 percent are possible injury, and 58.1 produce
no injury. By applying the societal costs already used by WSDOT to these percentages, the
average societal cost was found for each type of accident.
Accident Analysis Period Modifications
In the performance review, concerns were raised that the “worst 12 months in a three-year
period” criterion used for accident data analysis might give too much emphasis to problems that
may no longer exist. Examples of this include problems due to construction projects or weather,
and problems fixed by new projects.
WSDOT decided to instead use the annual average of a three-year accident history. This
approach spreads out data spikes and better identifies ongoing problems.
Accident Threshold Modifications
The accident threshold was also based on the worst 12 months in a three-year history.
Although this did not necessarily need to change, leaving it the same would force the engineer to
analyze an accident record twice, once for the worst 12 months and once for the annual average.
To maintain consistency among and clarity for many database users, a threshold was needed for
ix
the annual average. Using 58 accident records in the database the mean and standard deviation of
the average number of accidents per intersection approach were determined. There were .86
accidents per year, with a standard deviation of .60. Reviewers decided that approaches with an
average of more than one standard deviation above the mean (1.46 accidents per year) would
justify a left-turn lane. Eight (14 percent) of the intersections were above this range. A critical
accident rate based on more in-depth analysis is needed.
Delay Severity Score
The system calculates the delay severity score for left-turn lanes with equations from
chapter 10 of the Highway Capacity Manual (HCM) (TRB 1994).
The basic procedure is to first assume that a left-turn lane has already been installed and
then to figure the delay for that movement. Next, subtract the left-turn traffic delay (from the
assumed condition) from the delay in the existing condition (shared lane use). This is the estimated
delay reduction that would result from the installation of a left-turn lane. The delay reduction is
then annualized and assigned a cost based on truck and passenger vehicle volumes. Cost factors
for these volumes are $50 per hour for trucks and $10 per hour for automobiles.
NEED FOR A RIGHT-TURN LANE
Right-Turn Lane Accident Guideline
The Literature Review found no published studies that recommend a threshold value for the
number of accidents that would justify a right-turn lane. This is primarily because of the lack of
sufficient data for statistical analysis.
After six months of operation, the database for right-turn lane prioritization had
accumulated 22 entries. Similarly to the left-turn threshold, these 22 entries were analyzed. The
mean accident rate was .54 accidents per year, the standard deviation was .28. Intersections with
average accident rates of greater than one standard deviation above the mean (.82 accidents per
year) are said to need a right-turn lane. Research is needed to determine the critical accident rate that
would justify a right-turn lane.
x
Right-Turn Lane Volume Guideline
Cottrell’s guidelines for right-turn lanes (Cottrell 1981) were chosen for this system.
Included in Cottrell’s study are guidelines to determine whether right-turn lanes or tapers are
recommended. In this system only right-turn lanes are included in the priority ranking.
RIGHT-TURN LANE SEVERITY SCORE
The Right-Turn Lane Severity Score is calculated by summing costs associated with delay
and accident history.
Accident Severity Score
The right-turn lane accident severity score is figured in the same manner as the left-turn lane
accident severity score.
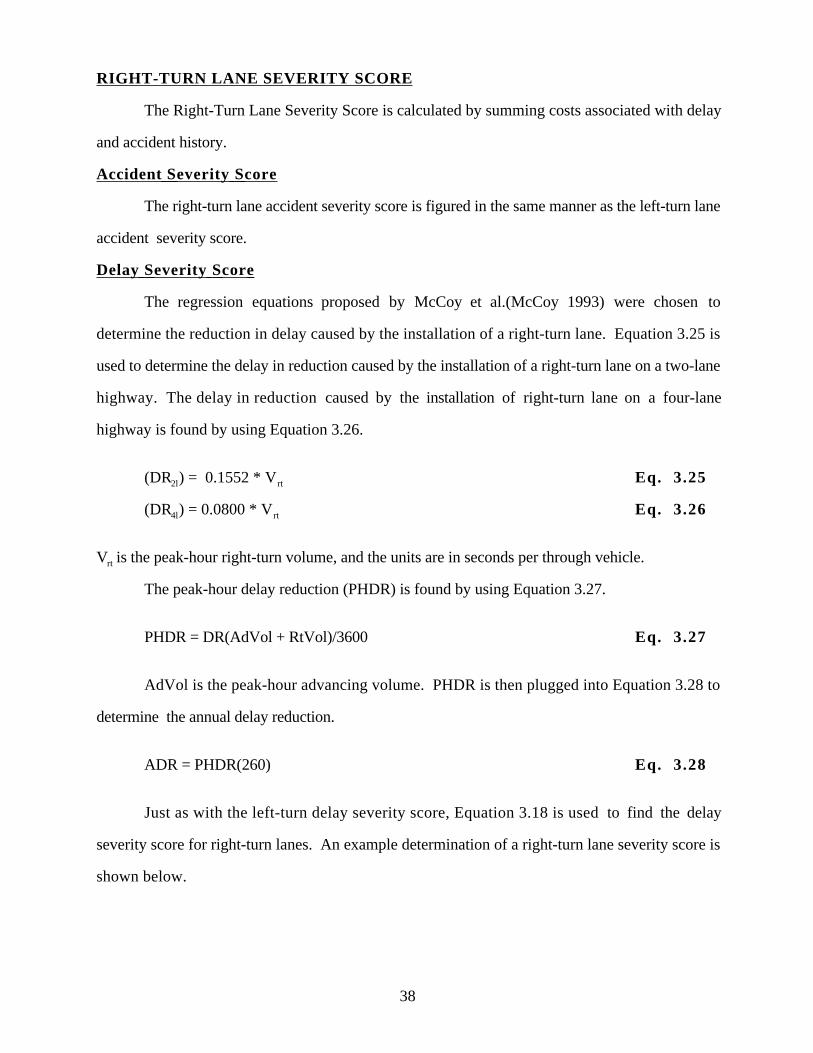
Delay Severity Score
The regression equations proposed by McCoy et al. (McCoy 1993) were chosen to
determine the reduction in delay caused by the installation of a right-turn lane.
CONCLUSIONS
Along with signalization, other improvements should be considered that will increase the
safety and efficiency of an intersection. Left- and right-turn lanes can significantly improve the
operations of an intersection. This project developed a computer program based on published
standards and engineering studies that enables the engineer to maintain a prioritized list of
intersections being considered for such improvements.
The benefits of this system are that it is an objective method of ranking intersections against
others and it is easy to use. It requires data that are easily obtainable from resources available at
most traffic offices.
CHAPTER ONEINTRODUCTION
PROBLEM
The most common type of intersection improvement considered by many state DOTs is
signalization. The Washington State Department of Transportation (WSDOT) uses a system called
the Intersection Priority Array, which was originally developed by Ching (Ching, 1979). This
system provides a tool for objectively considering numerous intersections. Although the system is
useful, it only addresses the need for and relative priority of a signal. It does not address other
actions that may improve the safety and efficiency of the intersection.
Other potential improvements include left-turn lanes, right-turn lanes, acceleration tapers,
illumination, and sight-distance improvements. If these improvements are considered in
conjunction with a signal warrant analysis, the intersection may be analyzed more
comprehensively. Many times, implementing one of the other improvements will increase safety
and efficiency to such a degree that the intersection will no longer warrant signalization. Currently,
WSDOT lacks a program or system similar to the Signal Priority Array for other intersection
improvements. The most significant need is for a system that will rank unsignalized intersections
being considered for left- and right-turn lanes.
Left- and right-turn lanes can significantly improve operations and safety at many
intersections. Left-turning vehicles conflict with opposing through-traffic, crossing traffic, and
advancing through-traffic. Accidents at an intersection are reduced an estimated 35 percent by the
installation of a left-turn lane at an unsignalized intersection (TRB 1985). Right-turning vehicles
conflict with fewer movements but can still reduce the overall operation of an intersection.
One benefit of a system that determines the need for left- and right-turn lanes and compares
and prioritizes that need among intersections is objectivity. Sometimes decisions about whether to
improve a highway are influenced by politics or public outcry. A system based on engineering
factors such as delay and safety would help alleviate this problem.
2
Another benefit of such a system is that it would provide a mechanism for planners to
allocate public monies in a more diversified manner. The specific needs of an intersection would
be met more easily when additional options were considered.
OBJECTIVES
The goal of this research project was to develop a system for analyzing the need for left-
and/or right-turn lane improvements to an intersection and prioritizing the severity of that need. To
be effective the system needed to be
• based on engineering studies
• objective and logical
• easy to use
• able to use easily obtainable data
• able to adapt to changing standards
• accepted by operation engineers, management, and planners.
To accomplish these objectives an extensive literature search was undertaken. A survey
was also sent to each state department of transportation in the United States. From these sources,
methods of analysis were chosen that could be programmed into a computer database program. A
database program was developed that accomplishes the goals listed above. Although this database
is described herein, the purpose of the report is to present the methodology selected. Any standard
database structure could be used with standard programming techniques.
The results of the original project were implemented by WSDOT’s Northwest Region.
After a six-month implementation and testing period, the performance of the system was reviewed.
This report describes the results of the original research, as well as changes that were made to the
methodology.
DEVELOPMENT STRATEGY
Development of the system was based on two questions it would have to answer about the
intersection:
1. Is a left- or right-turn lane recommended for a particular intersection?
3
2. How severe is the need for a turn lane compared to other intersections being
considered?
The basic strategy for answering these questions is described below and then in detail in the
appropriate sections.
The first question is answered on the basis of traffic conditions and accident history.
Threshold values for volume and accident history are determined from published engineering
studies (described in Chapter 2).
To answer the second question, the system assigns dollar values to delay conditions and
accident history specific to the intersection. Dollar values are assigned to accidents over the worst
12-month period in a 3-year accident history. The dollar values are taken from the Federal
Highway Administration (FHWA 1991) and WSDOT (Wessels and Limotti 1992) guidelines for
the Most Severe Injury (MSVJ) of an accident. The system then calculates the reduction in delay
that would result from installing the left- or right-turn lanes by using regression equations from
published engineering studies or standards such as the Highway Capacity Manual (HCM).
The scaled sum of the accident and delay costs is the severity score for the specific
intersection improvement.
Notes on Development Strategy
This report and the software developed are intended to be used as a planning tool, not a
design tool. They provide a starting point and an aid for analyzing intersections being considered
for left- or right-turn lanes. Although the warrant guidelines, cost of delay, and cost of accidents
are based on current engineering studies and practices, they are also intended to be simplified so
that engineers can use the system with readily available data. If a particular intersection is chosen
for further development, it should be subjected to the normal process of design and thorough cost-
benefit analysis. Furthermore, this project is not intended to provide warrants for left-turn lanes or
right-turn lanes. Instead, it provides guidelines and/or recommendations for left- and right-turn
lanes.
Each intersection is considered for individual improvements specific to its movement and
approach. For example, the northbound and southbound approaches of a given intersection would

4
be considered separately for left-turn lanes and could be ranked against each other. In reality, a
left-turn lane would probably be added to both approaches because of alignment reasons, even if
only one approach warranted the improvement.
5
CHAPTER TWOSTATE OF THE ART
LITERATURE REVIEW
An extensive literature review was conducted using the Transportation Research
Information Service database. Studies were needed to provide threshold values for volume and
delay in the following nonsignalized intersection scenarios:
• left-turn lanes for two-lane highways
• left-turn lanes for four-lane highways
• right-turn lanes for two-lane highways
• right-turn lanes for four-lane highways.
All relevant studies found are described below. The equations and values chosen from
these articles are described in Chapter 3.
Left-Turn Lanes
Intersections on two-lane roads are most often considered for left-turn lanes. The first
parameter considered in determining the need for a left-turn lane is based on volume. In 1967,
Harmelink proposed a model for determining volume warrants for left-turn lanes at unsignalized
intersections (Harmelink 1967). The report states that left-turning vehicles blocking through-lane
traffic are the main cause of safety and efficiency breakdowns at unsignalized intersections.
Harmelink proposed a set of maximum probabilities for this occurrence as warrants for left-turn
lanes. This methodology was adopted by the American Association of State Highway And
Transportation Officials (AASHTO) (AASHTO 1964) and subsequently by many departments of
transportation across the nation. The National Cooperative Highway Research Program (NCHRP)
Report #279 also recommends Harmelink’s model (TRB 1985).
In 1991, Kikuchi and Chakroborty published a comparative analysis of level-of-service
(LOS), delay, and the Harmelink models (Kikuchi and Chakroborty 1991). Included in the article
was a critical analysis of the Harmelink model that revealed some errors in the model’s application
of queuing theory. Kikuchi and Chakroborty modified the model to use queuing theory correctly.
6
A comparison of the three methods revealed that if conditions warranted a left-turn lane in the
modified Harmelink model, it was also warranted in the LOS model and most of the delay model.
Only when traffic volumes were high did the delay model warrant a left-turn lane before the
Harmelink model.
Harmelink’s original report also introduced a model for left-turn lanes on four-lane
highways, which was also based on the probability of a queue being formed behind a left-turning
vehicle (Harmelink 1967). The model uses different values for divided four-lane highways and
undivided highways, but the rationale is the same. No table of values was available in the original
study. Rather, a graph is offered with left-turning volume and opposing volume on the x-axis and
y-axis, respectively. When conditions plotted on the graph are above a threshold line, the left-turn
lane is warranted.
Interestingly, AASHTO never adopted this model. In fact, AASHTO does not mention
warrants or guidelines for left-turn lanes on four-lane highways. WSDOT makes the same
omission in its Design Manual, except that it does reference Harmelink’s original work if left-turn
warrants are sought for four-lane highways. This is probably because left-turning traffic on four-
lane highways is less of a safety and operational problem than on two-lane highways.
Harmelink’s four-lane model has not been critically analyzed in the same manner as the
two-lane model. However, the queuing problems of the two-lane model were related to its
inability to clear queues waiting for a left-turning vehicle, and thus a steady state was never
achieved. This problem would not be as prevalent on a four-lane highway (in normal conditions)
because traffic waiting for left-turning vehicles can move into the outside lane. The NCHRP
Report #279 also recommends Harmelink’s model for left-turn lanes on four-lane highways (TRB
1985).
The other parameter for determining the need for a left-turn lane is based on accident
history. Only one source contained accident guidelines for left-turn lanes (Agent 1983). This
article proposes that the warranting number of preventable accidents be four in a 12-month period.
This criterion is the result of an “average critical accident rate” formula developed for the Kentucky
7
Department of Transportation. This guideline is recommended by the ITE Committee 4A-22 article
Guidelines for Left-Turn Lanes (ITE 1990).
Once the need has been established for a particular intersection approach, a severity score is
necessary to rank the approach. The first part of the severity score is based on delay. The 1994
HCM, Chapter 10, equations for capacity, shared-lane capacity, and delay are used to figure the
reduction in delay that would be produced by the installation of a left-turn lane (TRB 1994). Delay
is first figured for the approach by assuming that a left-turn lane has already been installed. Overall
delay is then figured using the shared lane equation. The difference between the two is the
reduction in delay.
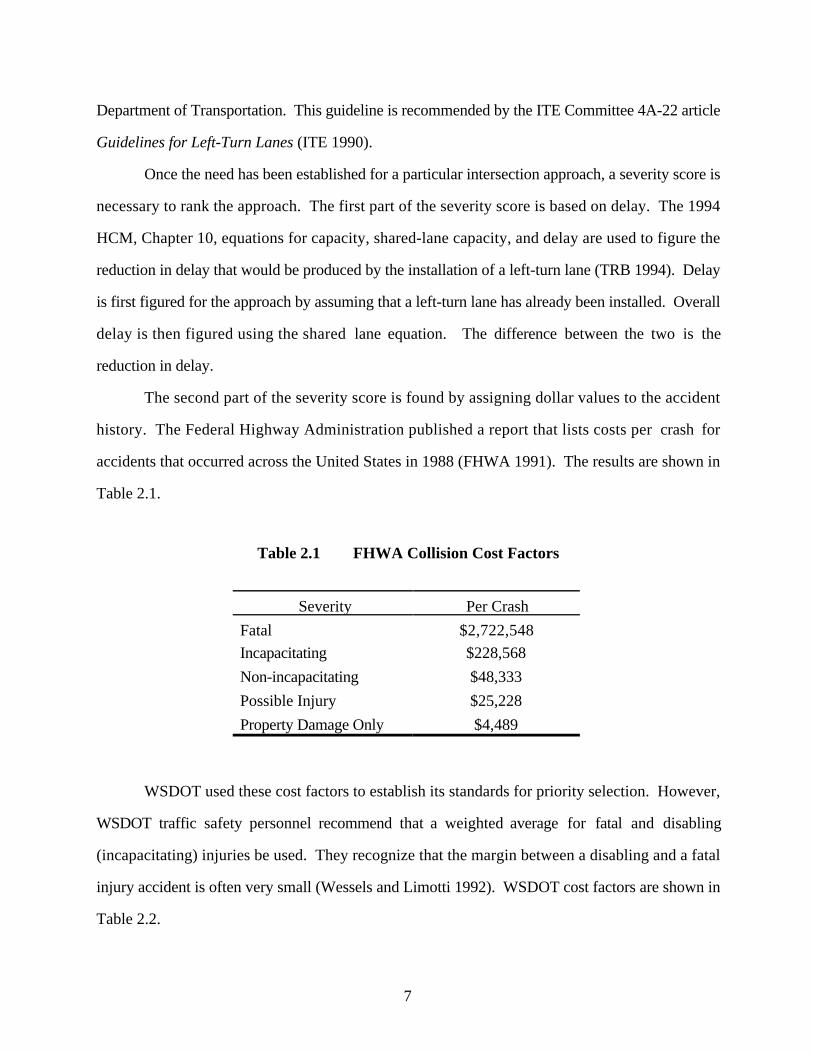
The second part of the severity score is found by assigning dollar values to the accident
history. The Federal Highway Administration published a report that lists costs per crash for
accidents that occurred across the United States in 1988 (FHWA 1991). The results are shown in
Table 2.1.
Table 2.1 FHWA Collision Cost Factors
Severity Per Crash
Fatal $2,722,548
Incapacitating $228,568
Non-incapacitating $48,333
Possible Injury $25,228
Property Damage Only $4,489
WSDOT used these cost factors to establish its standards for priority selection. However,
WSDOT traffic safety personnel recommend that a weighted average for fatal and disabling
(incapacitating) injuries be used. They recognize that the margin between a disabling and a fatal
injury accident is often very small (Wessels and Limotti 1992). WSDOT cost factors are shown in
Table 2.2.
8
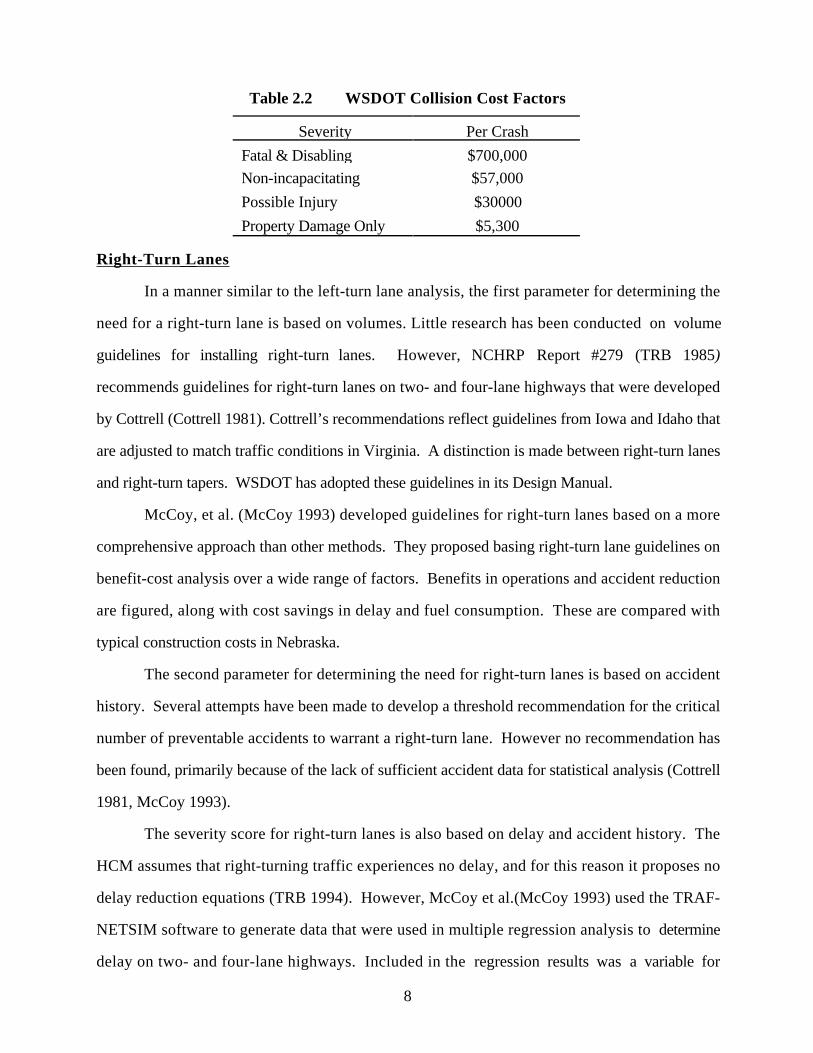
Table 2.2 WSDOT Collision Cost Factors
Severity Per Crash
Fatal & Disabling $700,000
Non-incapacitating $57,000
Possible Injury $30000
Property Damage Only $5,300
Right-Turn Lanes
In a manner similar to the left-turn lane analysis, the first parameter for determining the
need for a right-turn lane is based on volumes. Little research has been conducted on volume
guidelines for installing right-turn lanes. However, NCHRP Report #279 (TRB 1985)
recommends guidelines for right-turn lanes on two- and four-lane highways that were developed
by Cottrell (Cottrell 1981). Cottrell’s recommendations reflect guidelines from Iowa and Idaho that
are adjusted to match traffic conditions in Virginia. A distinction is made between right-turn lanes
and right-turn tapers. WSDOT has adopted these guidelines in its Design Manual.
McCoy, et al. (McCoy 1993) developed guidelines for right-turn lanes based on a more
comprehensive approach than other methods. They proposed basing right-turn lane guidelines on
benefit-cost analysis over a wide range of factors. Benefits in operations and accident reduction
are figured, along with cost savings in delay and fuel consumption. These are compared with
typical construction costs in Nebraska.
The second parameter for determining the need for right-turn lanes is based on accident
history. Several attempts have been made to develop a threshold recommendation for the critical
number of preventable accidents to warrant a right-turn lane. However no recommendation has
been found, primarily because of the lack of sufficient accident data for statistical analysis (Cottrell
1981, McCoy 1993).
The severity score for right-turn lanes is also based on delay and accident history. The
HCM assumes that right-turning traffic experiences no delay, and for this reason it proposes no
delay reduction equations (TRB 1994). However, McCoy et al.(McCoy 1993) used the TRAF-
NETSIM software to generate data that were used in multiple regression analysis to determine
delay on two- and four-lane highways. Included in the regression results was a variable for
9
intersections with right-turn lanes already installed. Using this variable and its coefficient, the
reduction in delay for a right-turn lane is easily found.
DOT SURVEY
In an effort to determine the state of the art and other standards for left- and right-turn
lanes, a survey was sent to state traffic engineers across the United States (including Puerto Rico).
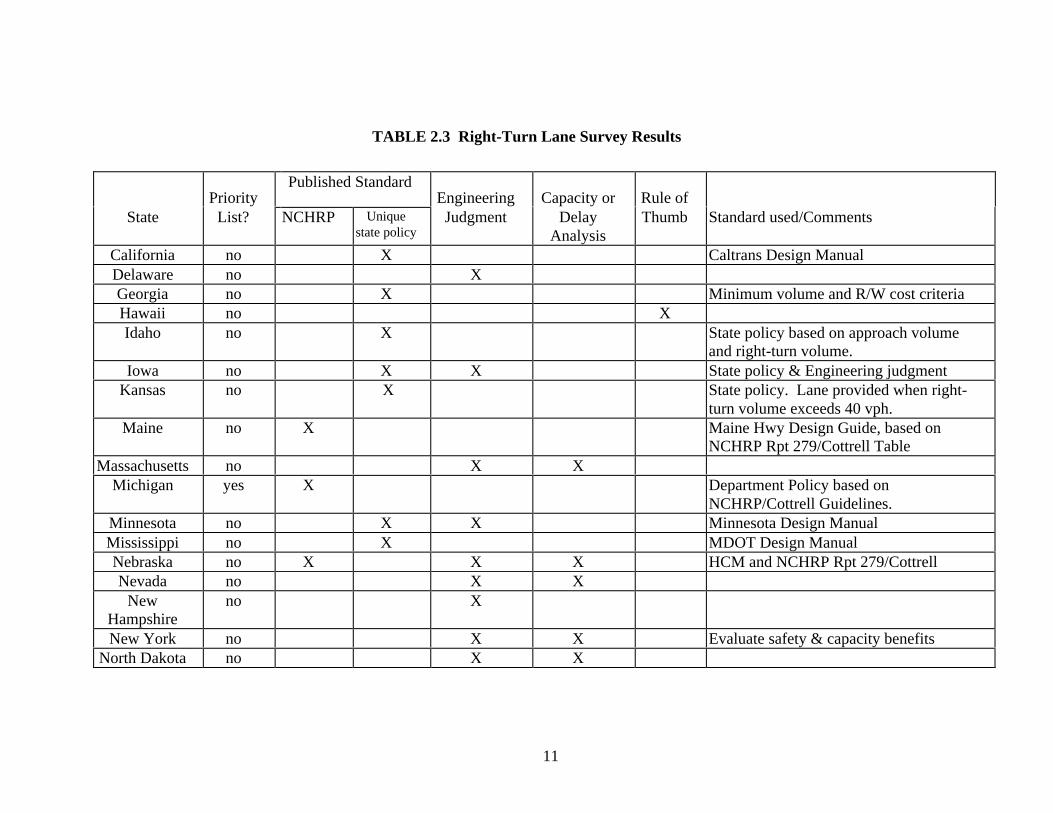
Out of 51 surveys sent, 29 were returned. The results of the surveys are shown in tables 2.3 and
2.4. A copy of the survey is in Appendix 1.
Of the 25 states that responded, none maintain priority lists for right-turn lanes exclusively.
Michigan maintains a priority list of “high accident intersections” being considered for future
improvements. Fifty-five percent (16 of 29) of the responding states use no set standard or
guideline for right-turn lanes. Rather, they apply engineering judgment and/or a delay or capacity
analysis. Fourteen percent (4 of 29) use the NCHRP report #279/Cottrell model to warrant a right-
turn lane.
The remaining states use standards that are relatively unique to their DOTs. Georgia uses a
rule of thumb guideline that recommends right-turn lanes when side road volume is greater than
300 vpd, mainline right-turn volume is greater than 30 vph, and mainline volume exceeds 6000
vpd on multi-lane highways or 2000 vpd on two-lane highways.
Idaho’s DOT uses a standard that is similar to the NCHRP report #279/Cottrell standard.
However Idaho’s standard is more conservative from a safety standpoint (warranting conditions
are much lower than the NCHRP standard). For instance, the NCHRP report would not warrant a
right-turn lane when the right-turn volume is below 40 vph. Idaho’s standard will warrant a right-
turn lane for right-turning volumes as low as 5 vph, depending on other conditions.
Kansas provides right-turn lanes when the right-turn volume exceeds 40 vph. Tennessee
uses the HCM recommendation for right-turn lanes at signalized intersections for unsignalized
intersections. This recommendation states that right-turn lanes should be considered when the
through-volume of an approach exceeds 300 vehicles per hour per lane (vphpl), and the right-
turning volume exceeds 300 vehicles per hour (vph).
10
Similarly to the right-turn results, no states maintain a database for intersections being
considered for left-turn lanes exclusively. Fifty-two percent (15 of 29) of responding states use
the AASHTO/Harmelink standard for their left-turn warrants. Thirty-one percent ( 9 of 29) use no
set standard but install left-turn lanes as a result of engineering judgment, accident analysis, delay
analysis, and/or political pressure.
The remaining states use unique standards. For example, Georgia attempts to install left-
turn lanes at all divided highway median openings. Idaho uses a warrant curve similar to its right-
turn guideline. In this model, a left-turn lane is recommended when the left-turning volume is as
low as 12 vph, and the through-volume is 100 vph. By contrast, the AASHTO model would only
recommend a left-turn lane with a left-turning volume of 12 when the through volume is 230 vph.
11
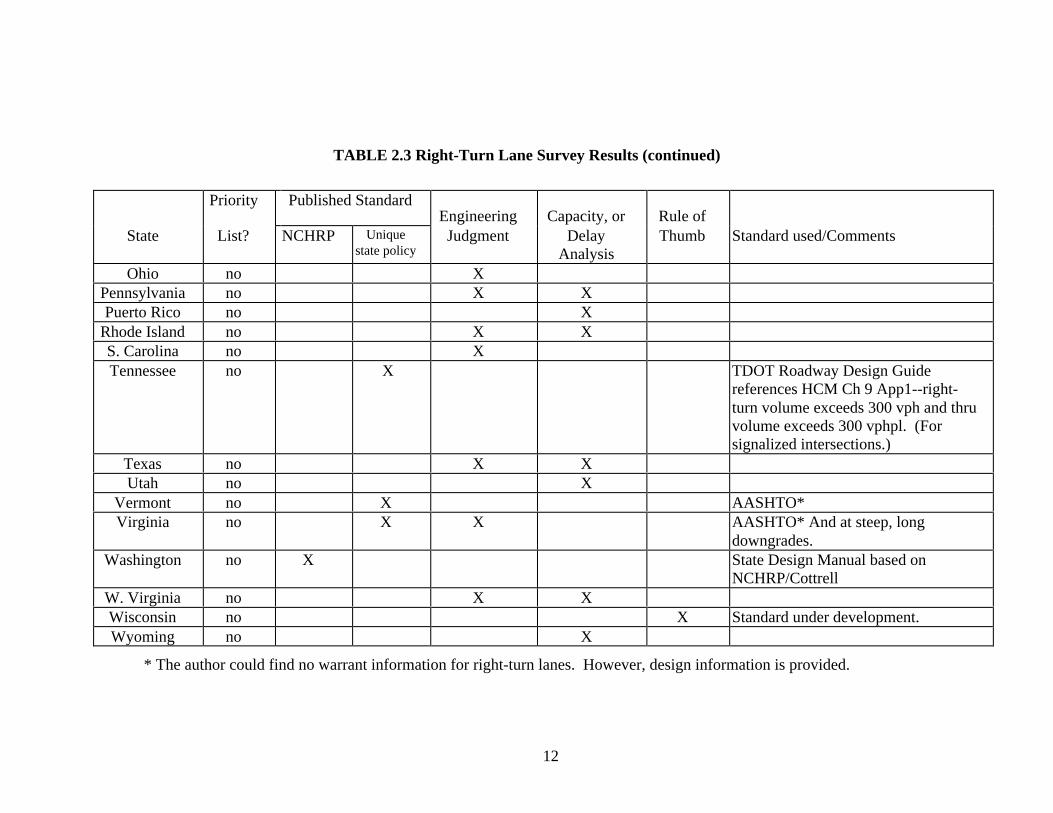
TABLE 2.3 Right-Turn Lane Survey Results
PriorityPublished Standard
Engineering Capacity or Rule ofState List? NCHRP Unique
state policyJudgment Delay
AnalysisThumb Standard used/Comments
California no X Caltrans Design ManualDelaware no XGeorgia no X Minimum volume and R/W cost criteriaHawaii no XIdaho no X State policy based on approach volume
and right-turn volume.Iowa no X X State policy & Engineering judgment
Kansas no X State policy. Lane provided when right-turn volume exceeds 40 vph.
Maine no X Maine Hwy Design Guide, based onNCHRP Rpt 279/Cottrell Table
Massachusetts no X XMichigan yes X Department Policy based on
NCHRP/Cottrell Guidelines.Minnesota no X X Minnesota Design ManualMississippi no X MDOT Design ManualNebraska no X X X HCM and NCHRP Rpt 279/CottrellNevada no X X
NewHampshire
no X
New York no X X Evaluate safety & capacity benefitsNorth Dakota no X X
12
TABLE 2.3 Right-Turn Lane Survey Results (continued)
Priority Published StandardEngineering Capacity, or Rule of
State List? NCHRP Uniquestate policy
Judgment DelayAnalysis
Thumb Standard used/Comments
Ohio no XPennsylvania no X XPuerto Rico no X
Rhode Island no X XS. Carolina no XTennessee no X TDOT Roadway Design Guide
references HCM Ch 9 App1--right-turn volume exceeds 300 vph and thruvolume exceeds 300 vphpl. (Forsignalized intersections.)
Texas no X XUtah no X
Vermont no X AASHTO*Virginia no X X AASHTO* And at steep, long
downgrades.Washington no X State Design Manual based on
NCHRP/CottrellW. Virginia no X XWisconsin no X Standard under development.Wyoming no X
* The author could find no warrant information for right-turn lanes. However, design information is provided.
13
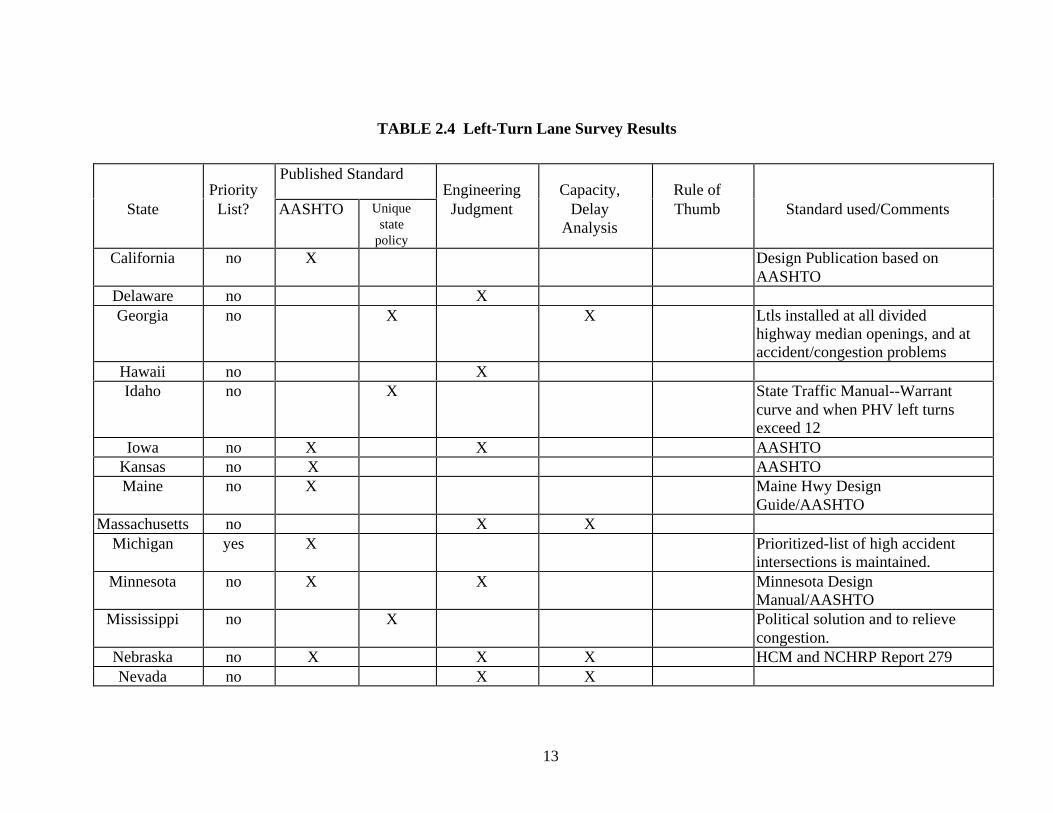
TABLE 2.4 Left-Turn Lane Survey Results
PriorityPublished Standard
Engineering Capacity, Rule ofState List? AASHTO Unique
statepolicy
Judgment DelayAnalysis
Thumb Standard used/Comments
California no X Design Publication based onAASHTO
Delaware no XGeorgia no X X Ltls installed at all divided
highway median openings, and ataccident/congestion problems
Hawaii no XIdaho no X State Traffic Manual--Warrant
curve and when PHV left turnsexceed 12
Iowa no X X AASHTOKansas no X AASHTOMaine no X Maine Hwy Design
Guide/AASHTOMassachusetts no X X
Michigan yes X Prioritized-list of high accidentintersections is maintained.
Minnesota no X X Minnesota DesignManual/AASHTO
Mississippi no X Political solution and to relievecongestion.
Nebraska no X X X HCM and NCHRP Report 279Nevada no X X
14
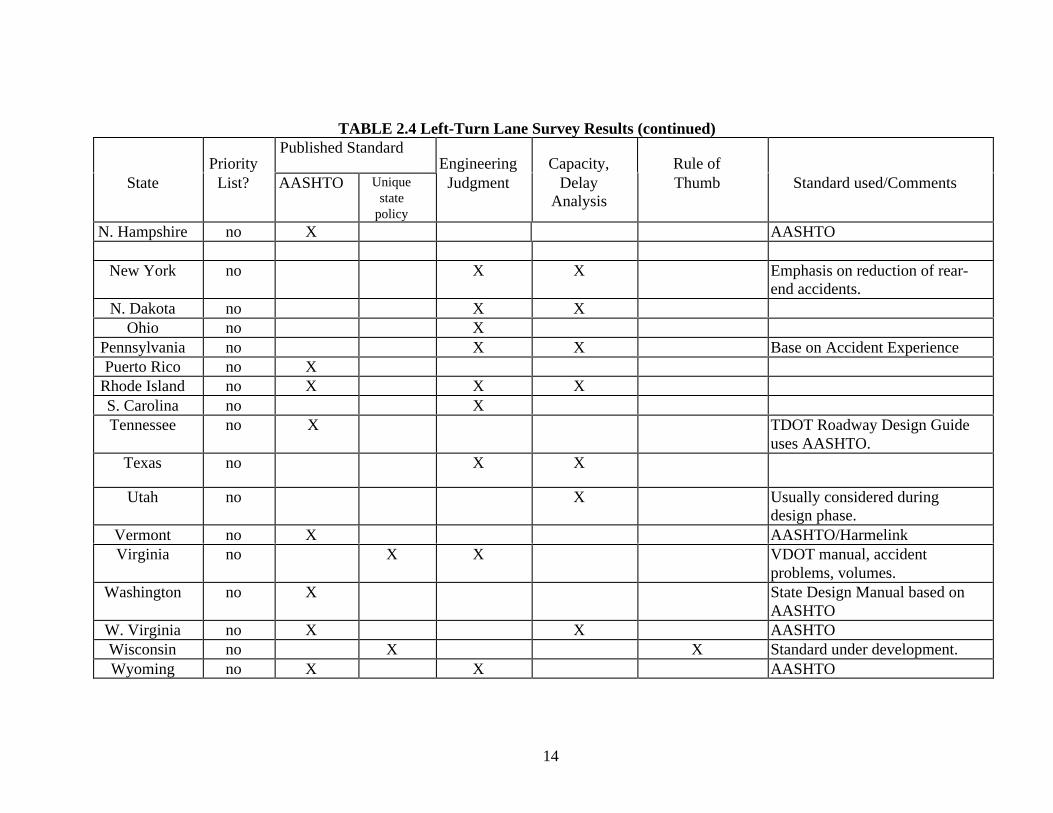
TABLE 2.4 Left-Turn Lane Survey Results (continued)
PriorityPublished Standard
Engineering Capacity, Rule ofState List? AASHTO Unique
statepolicy
Judgment DelayAnalysis
Thumb Standard used/Comments
N. Hampshire no X AASHTO
New York no X X Emphasis on reduction of rear-end accidents.
N. Dakota no X XOhio no X
Pennsylvania no X X Base on Accident ExperiencePuerto Rico no X
Rhode Island no X X XS. Carolina no XTennessee no X TDOT Roadway Design Guide
uses AASHTO.Texas no X X
Utah no X Usually considered duringdesign phase.
Vermont no X AASHTO/HarmelinkVirginia no X X VDOT manual, accident
problems, volumes.Washington no X State Design Manual based on
AASHTOW. Virginia no X X AASHTOWisconsin no X X Standard under development.Wyoming no X X AASHTO
15
CHAPTER THREERESULTS
METHODOLOGY
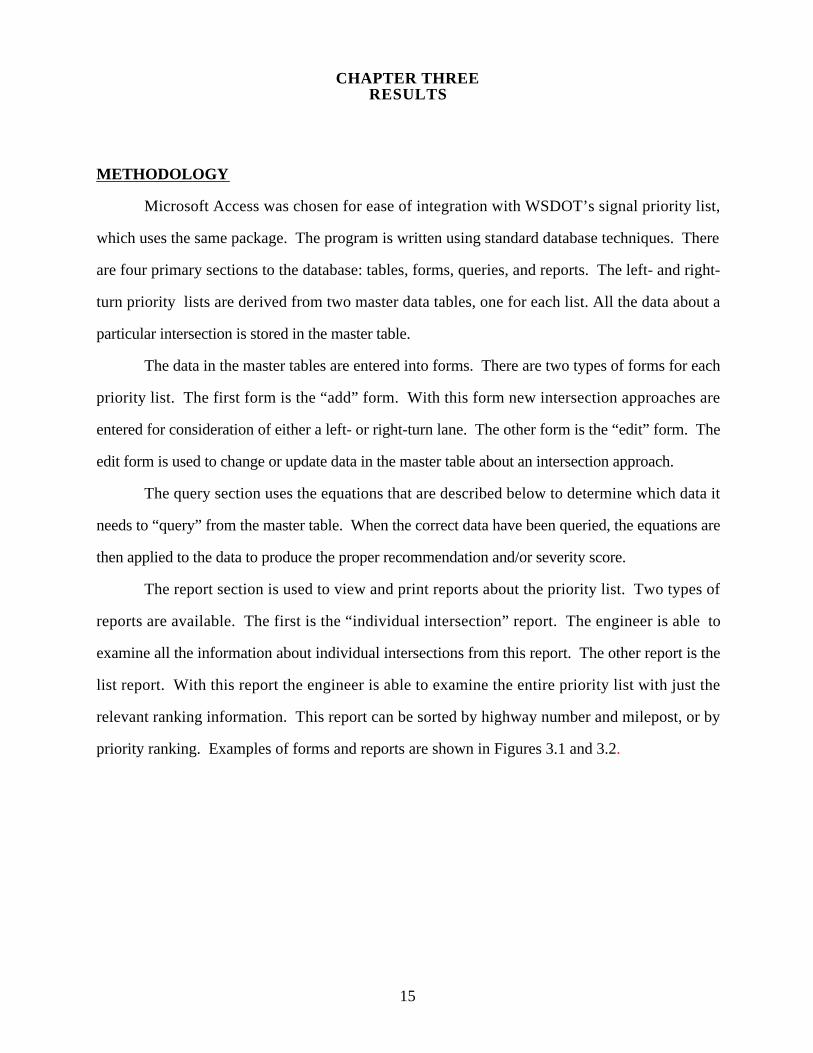
Microsoft Access was chosen for ease of integration with WSDOT’s signal priority list,
which uses the same package. The program is written using standard database techniques. There
are four primary sections to the database: tables, forms, queries, and reports. The left- and right-
turn priority lists are derived from two master data tables, one for each list. All the data about a
particular intersection is stored in the master table.
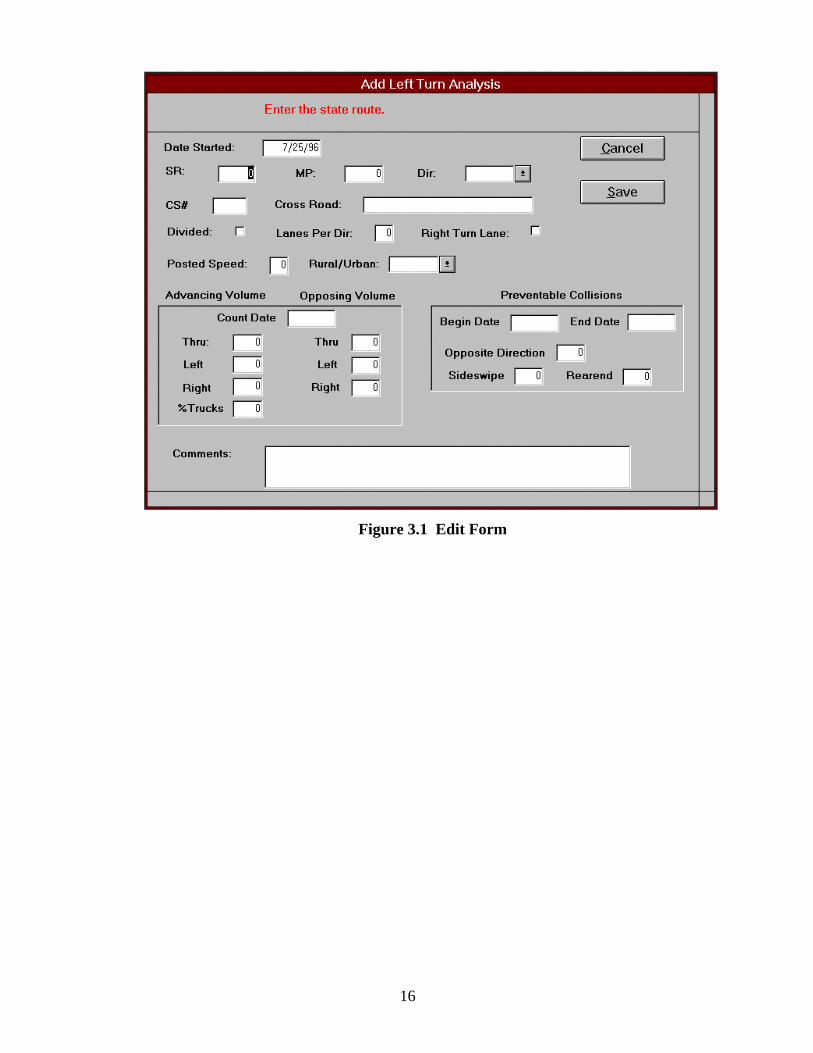
The data in the master tables are entered into forms. There are two types of forms for each
priority list. The first form is the “add” form. With this form new intersection approaches are
entered for consideration of either a left- or right-turn lane. The other form is the “edit” form. The
edit form is used to change or update data in the master table about an intersection approach.
The query section uses the equations that are described below to determine which data it
needs to “query” from the master table. When the correct data have been queried, the equations are
then applied to the data to produce the proper recommendation and/or severity score.
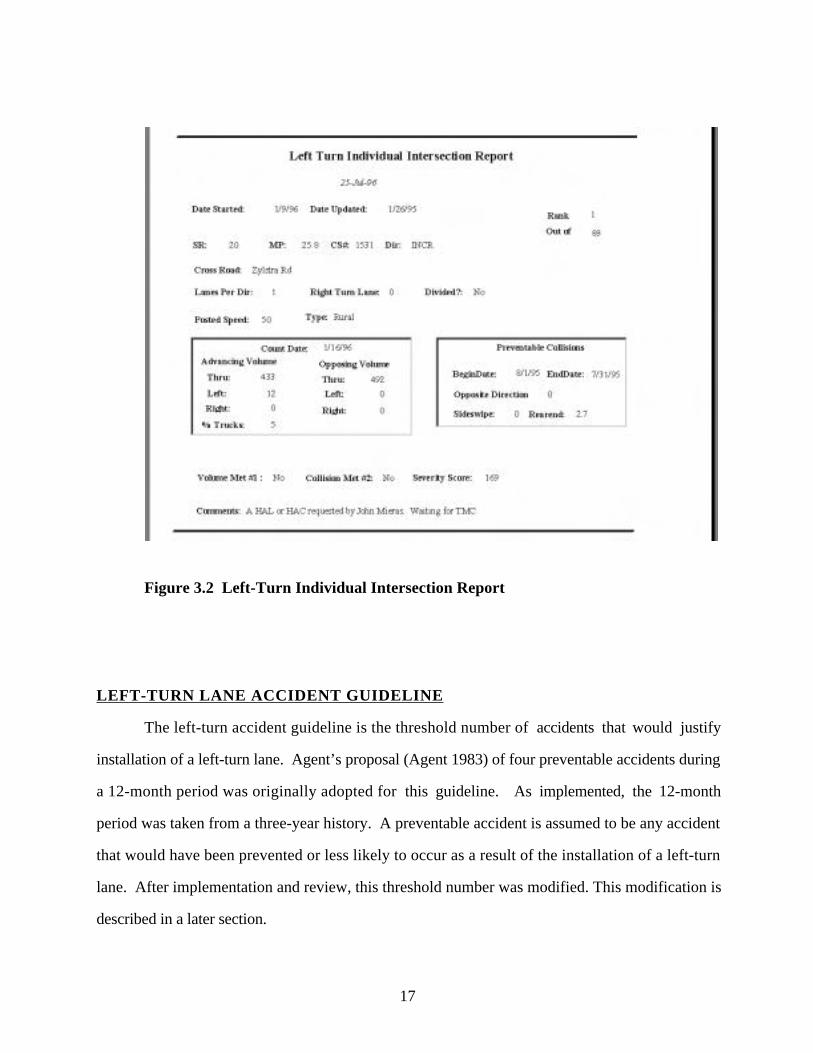
The report section is used to view and print reports about the priority list. Two types of
reports are available. The first is the “individual intersection” report. The engineer is able to
examine all the information about individual intersections from this report. The other report is the
list report. With this report the engineer is able to examine the entire priority list with just the
relevant ranking information. This report can be sorted by highway number and milepost, or by
priority ranking. Examples of forms and reports are shown in Figures 3.1 and 3.2.
16
Figure 3.1 Edit Form
17
Figure 3.2 Left-Turn Individual Intersection Report
LEFT-TURN LANE ACCIDENT GUIDELINE
The left-turn accident guideline is the threshold number of accidents that would justify
installation of a left-turn lane. Agent’s proposal (Agent 1983) of four preventable accidents during
a 12-month period was originally adopted for this guideline. As implemented, the 12-month
period was taken from a three-year history. A preventable accident is assumed to be any accident
that would have been prevented or less likely to occur as a result of the installation of a left-turn
lane. After implementation and review, this threshold number was modified. This modification is
described in a later section.
18
LEFT-TURN LANE VOLUME GUIDELINE
The left-turn volume guideline is used to determine when volume levels reach the point that
a left-turn lane is needed or recommended. There are two primary situations for consideration:
two-lane highways and four-lane highways. The four-lane situation can be further categorized
into divided and undivided highways.
Two-Lane Highways
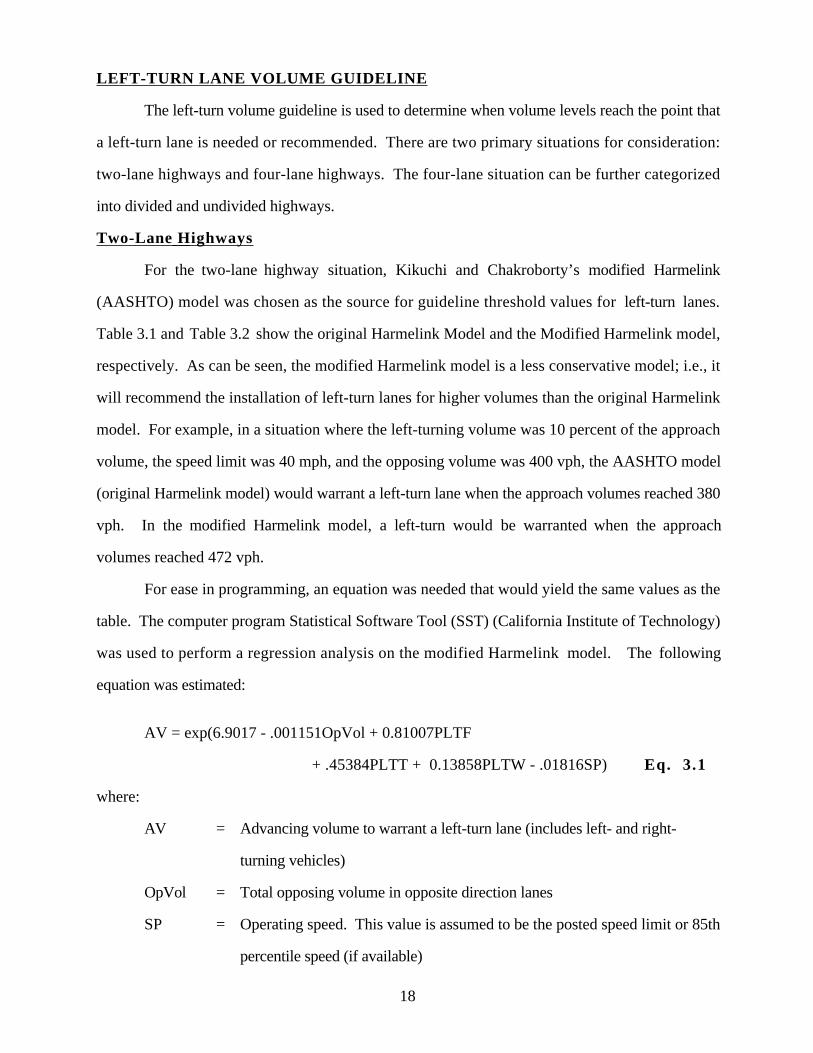
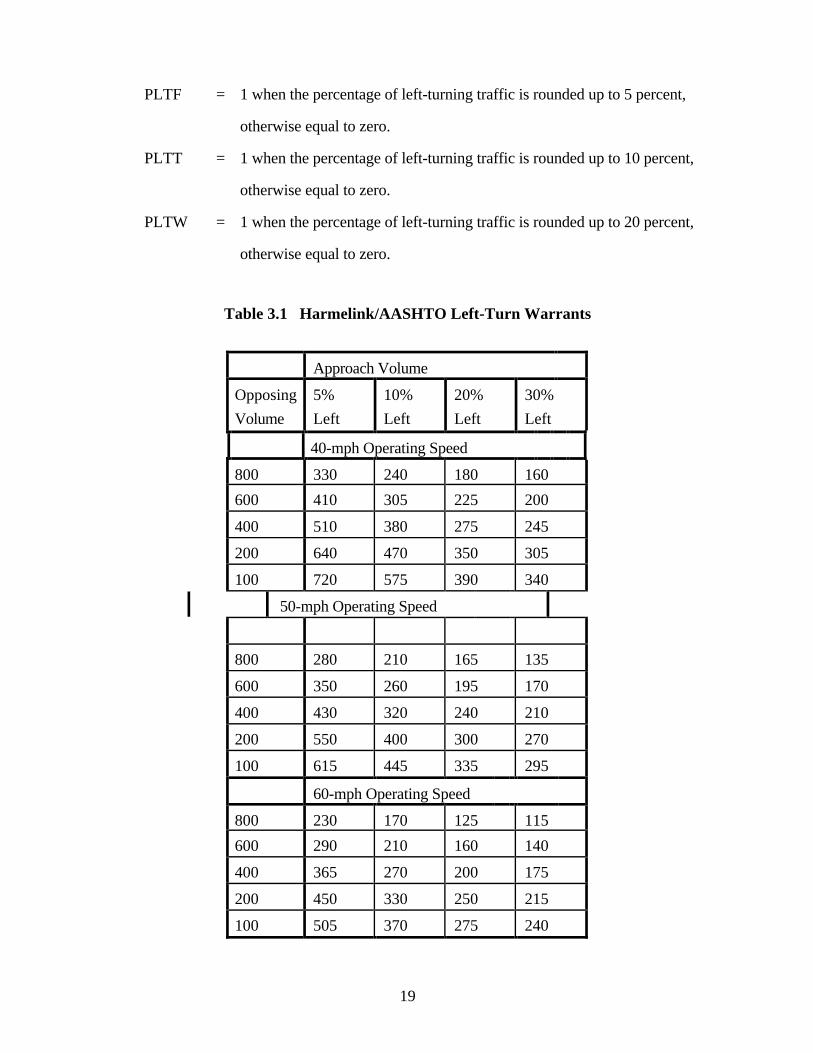
For the two-lane highway situation, Kikuchi and Chakroborty’s modified Harmelink
(AASHTO) model was chosen as the source for guideline threshold values for left-turn lanes.
Table 3.1 and Table 3.2 show the original Harmelink Model and the Modified Harmelink model,
respectively. As can be seen, the modified Harmelink model is a less conservative model; i.e., it
will recommend the installation of left-turn lanes for higher volumes than the original Harmelink
model. For example, in a situation where the left-turning volume was 10 percent of the approach
volume, the speed limit was 40 mph, and the opposing volume was 400 vph, the AASHTO model
(original Harmelink model) would warrant a left-turn lane when the approach volumes reached 380
vph. In the modified Harmelink model, a left-turn would be warranted when the approach
volumes reached 472 vph.
For ease in programming, an equation was needed that would yield the same values as the
table. The computer program Statistical Software Tool (SST) (California Institute of Technology)
was used to perform a regression analysis on the modified Harmelink model. The following
equation was estimated:
AV = exp(6.9017 - .001151OpVol + 0.81007PLTF
+ .45384PLTT + 0.13858PLTW - .01816SP) Eq. 3.1
where:
AV = Advancing volume to warrant a left-turn lane (includes left- and right-
turning vehicles)
OpVol = Total opposing volume in opposite direction lanes
SP = Operating speed. This value is assumed to be the posted speed limit or 85th
percentile speed (if available)
19
PLTF = 1 when the percentage of left-turning traffic is rounded up to 5 percent,
otherwise equal to zero.
PLTT = 1 when the percentage of left-turning traffic is rounded up to 10 percent,
otherwise equal to zero.
PLTW = 1 when the percentage of left-turning traffic is rounded up to 20 percent,
otherwise equal to zero.
Table 3.1 Harmelink/AASHTO Left-Turn Warrants
Approach Volume
Opposing 5% 10% 20% 30%
Volume Left Left Left Left
40-mph Operating Speed
800 330 240 180 160
600 410 305 225 200
400 510 380 275 245
200 640 470 350 305
100 720 575 390 340
50-mph Operating Speed
800 280 210 165 135
600 350 260 195 170
400 430 320 240 210
200 550 400 300 270
100 615 445 335 295
60-mph Operating Speed
800 230 170 125 115
600 290 210 160 140
400 365 270 200 175
200 450 330 250 215
100 505 370 275 240
20
Table 3.2 Modified Harmelink/AASHTO Left-Turn Warrants
Approach Volume
Opposing 5% 10% 20% 30%
Volume Left Left Left Left
40-mph Operating Speed
800 434 300 219 189
600 542 375 272 234
400 682 472 343 293
200 863 600 435 375
100 946 679 493 424
50-mph Operating Speed
800 366 257 185 162
600 460 320 234 202
400 577 403 294 255
200 735 513 373 324
100 830 576 424 365
60-mph Operating Speed
800 294 207 154 146
600 365 259 187 165
400 461 324 238 206
200 586 414 303 263
100 663 468 344 297
Performance characteristics for Equation. 3.1 are shown in Table 3.3.
Table 3.3 Equation 3.1 Performance Characteristics
IndependentVariable
EstimatedCoefficient
StandardError
t- Statistic
One 6.90170 1.88e -2 366.28OpVol -1.15e -3 1.11e -5 -103.99PLTF 0.81007 8.02e -3 101.04PLTT 0.45384 8.02e -3 56.61PLTW 0.13858 8.02e -3 17.29
SP -1.82e -2 3.47e -4 -52.31Corrected R-squared = 99.7%
21
Equation 3.1 required the left-turn percentage to be rounded up to the nearest 5 percent. To
make it easier to use, a regression analysis was performed on the left-turn coefficients only. This
yielded the following equation estimate and the corresponding performance characteristics in Table
3.4:
LtCoef .383 .118lt%= − Eq. 3.2
where lt% is the percentage of left-turning traffic.
Table 3.4 Equation 3.2 Performance Characteristics
Independent Estimated Standard t- Statistic
One .38251 .009 42.42lt% -.118 .0007 -172.90
Corrected R2 = 99%
Substituting Equation 3.1 into Equation 3.2 yields the following final equation for left-turn
lanes at two-lane nonsignalized intersections:
AV = exp(6.9017 - .001151OpVol + (exp(.383 - .118lt%) - .01816SP)) Eq. 3.3
An example problem using this equation is shown below:
Example 3.1
Assume the following peak-hour conditions exist on an intersection approach to a two-lane
highway:
Total Advancing Volume = 1321Advancing Left-Turning Volume = 111Opposing Volume = 533Operating Speed = 45 mph
Determine whether a left-turn lane is recommended using the equation for the modified
Harmelink model.

22
Solution:
lt% = (111/1321)100 = 8.403 Eq. 3.2
AV = exp(6.9017 - .001151*533 + (exp(.382 - .118*8.403) - .01816*45)) Eq. 3.3
= 409
Because the advancing volume at this location is greater than 409 cars, a left-turn lane is
recommended.
Four-Lane Highways
The four-lane highway equations are from Harmelink’s original study (Harmelink 1967).
The plotted line described earlier on Harmelink’s curves represents threshold values for left-turn
warrants on four-lane highways. For the four-lane divided highway, the curve was best fit by
doing a regression on three segments of the curve. Points on the curve were tabulated with their
corresponding coordinate values (left-turning volume, opposing volume). MINITAB for
Windows was used to estimate the following regression equations for the three curve segments:
• For Opposing Volume < 800 veh/hour
LtVol = exp(4.3 - .00116 OpVol) Eq. 3.4
where:
LtVol = Threshold value for peak-hour left-turn volume
OpVol = Opposing peak-hour volume
Table 3.5 Equation 3.4 Performance Characteristics
Independent Estimated Standard t- Statistic
One 4.3 .014 297.57OpVol -.00116 .00002 -49.26
Corrected R2 = 99.7%
23
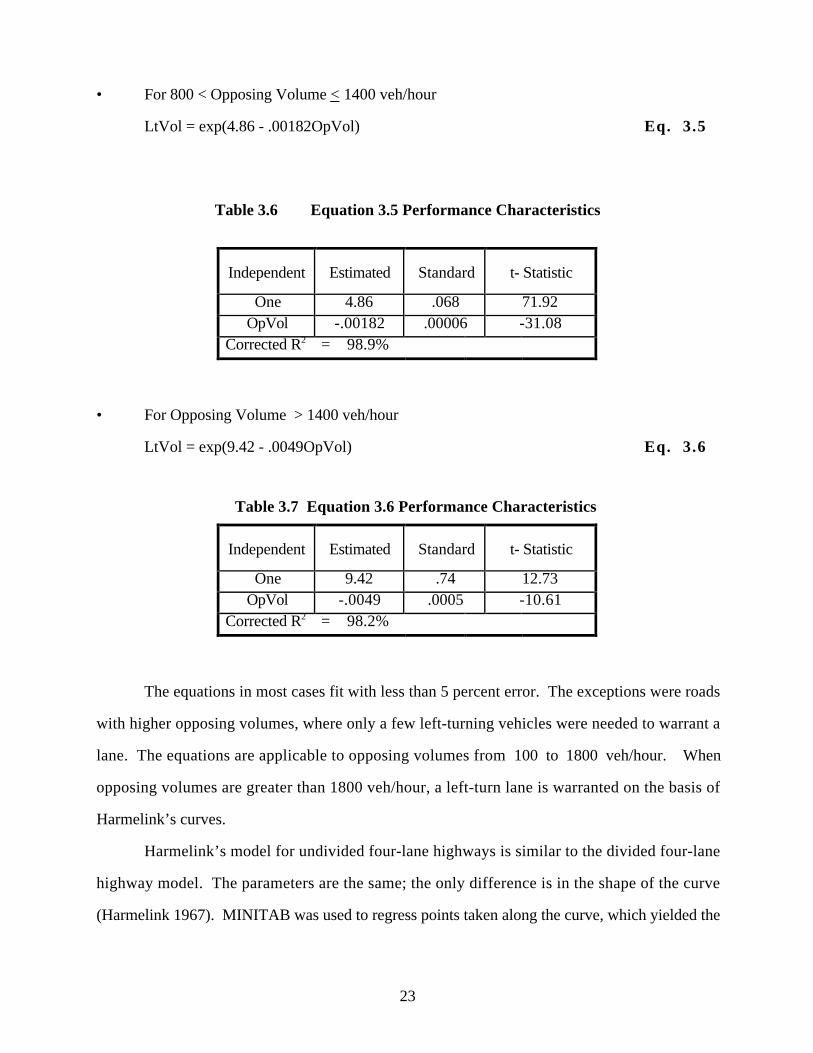
• For 800 < Opposing Volume < 1400 veh/hour
LtVol = exp(4.86 - .00182OpVol) Eq. 3.5
Table 3.6 Equation 3.5 Performance Characteristics
Independent Estimated Standard t- Statistic
One 4.86 .068 71.92OpVol -.00182 .00006 -31.08
Corrected R2 = 98.9%
• For Opposing Volume > 1400 veh/hour
LtVol = exp(9.42 - .0049OpVol) Eq. 3.6
Table 3.7 Equation 3.6 Performance Characteristics
Independent Estimated Standard t- Statistic
One 9.42 .74 12.73OpVol -.0049 .0005 -10.61
Corrected R2 = 98.2%
The equations in most cases fit with less than 5 percent error. The exceptions were roads
with higher opposing volumes, where only a few left-turning vehicles were needed to warrant a
lane. The equations are applicable to opposing volumes from 100 to 1800 veh/hour. When
opposing volumes are greater than 1800 veh/hour, a left-turn lane is warranted on the basis of
Harmelink’s curves.
Harmelink’s model for undivided four-lane highways is similar to the divided four-lane
highway model. The parameters are the same; the only difference is in the shape of the curve
(Harmelink 1967). MINITAB was used to regress points taken along the curve, which yielded the
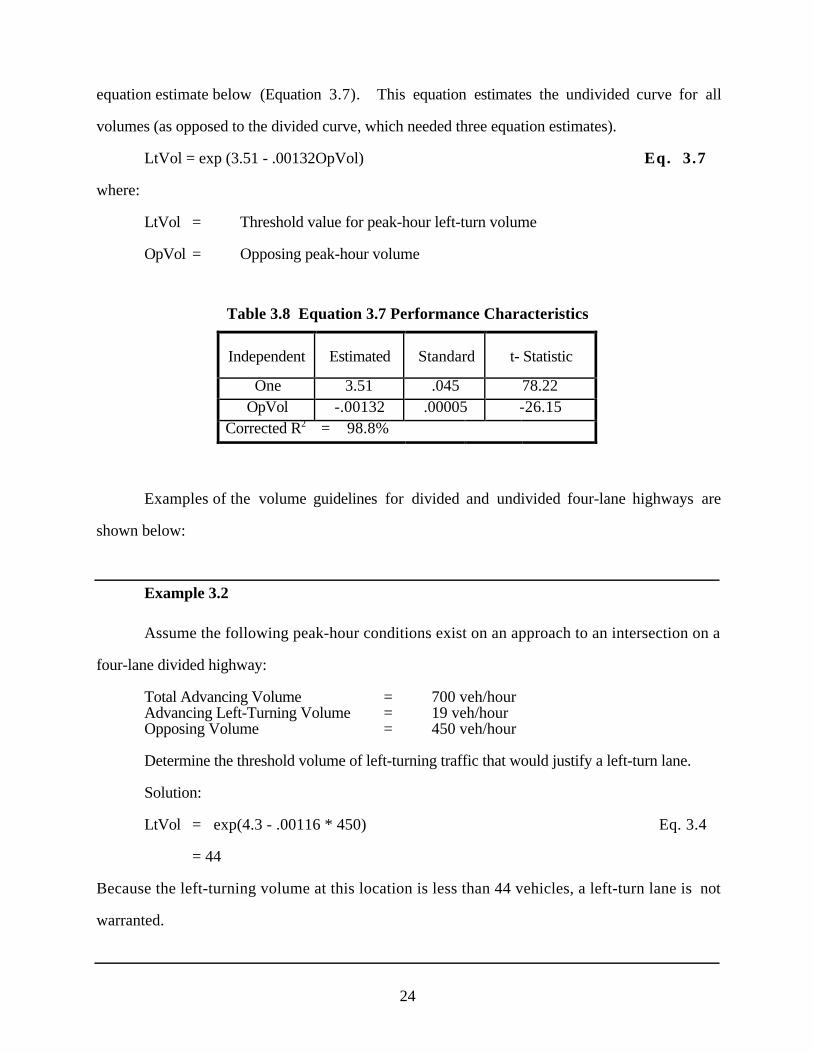
24
equation estimate below (Equation 3.7). This equation estimates the undivided curve for all
volumes (as opposed to the divided curve, which needed three equation estimates).
LtVol = exp (3.51 - .00132OpVol) Eq. 3.7
where:
LtVol = Threshold value for peak-hour left-turn volume
OpVol = Opposing peak-hour volume
Table 3.8 Equation 3.7 Performance Characteristics
Independent Estimated Standard t- Statistic
One 3.51 .045 78.22OpVol -.00132 .00005 -26.15
Corrected R2 = 98.8%
Examples of the volume guidelines for divided and undivided four-lane highways are
shown below:
Example 3.2
Assume the following peak-hour conditions exist on an approach to an intersection on a
four-lane divided highway:
Total Advancing Volume = 700 veh/hourAdvancing Left-Turning Volume = 19 veh/hourOpposing Volume = 450 veh/hour
Determine the threshold volume of left-turning traffic that would justify a left-turn lane.
Solution:
LtVol = exp(4.3 - .00116 * 450) Eq. 3.4
= 44
Because the left-turning volume at this location is less than 44 vehicles, a left-turn lane is not
warranted.
25
Example 3.3
Assume the same conditions as in Example 3.2 for an undivided four-lane highway.
Determine the threshold value of left-turning volume to justify a left-turn lane.
Solution:
LtVol = exp (3.51 - .00132 * 450) Eq. 3.7
= 18
Because the left-turning volume at this location is greater than 18, a left-turn lane is warranted.
LEFT-TURN LANE SEVERITY SCORE
After the program has determined whether a left-turn lane is justified, the intersection
approach has to be ranked among other candidate intersections. A severity score is used to
determine this ranking. The left-turn lane severity score is the sum of the costs related to accident
history and delay.
Accident Severity Score
The accident score was originally found by summing the costs of preventable accidents
over a 12-month period. The cost factors below are used by WSDOT and were adopted for this
system (Wessels and Limotti 1992):
Per Fatal or Disabling Injury Collision $700,000
Per Evident Injury Collision $57,000
Per Possible Injury Collision $30,000
Per Property Damage Only Collision $5,300
The 12-month period was taken from a three-year accident record if possible. Severity
codes for accidents are readily available from the WSDOT accident database. Preventable accidents
are defined as any accident that would have been prevented or less likely to occur as direct result of
the installation of a left-turn lane. Accidents are classified by the most severe injury. For example,
one accident may involve two disabling injuries but would only be classified as a disabling injury
accident; costs for other injuries would not be factored.

26
Implementation of the original program revealed that this methodology did not necessarily
reflect actual conditions or reliably predict future conditions. As mentioned above, WSDOT
figures the cost of fatality and disabling-injury accidents at $700,000 (FHWA values are even
higher). An evident-injury accident is listed at $57,000. Using these values as a severity score
would mean that an intersection with one disabling accident would be considered more serious than
an intersection with 12 evident-injury accidents. This method failed to recognize that many
variables determine the severity of an injury. Factors such as seat belt usage, tire condition, type
and size of automobile, alcohol involvement, physical condition of vehicle occupants, and others
could mean the difference between a possible injury accident and a fatality.
Another problem is the subjective nature of accident severity classifications. The
classifications are taken from accident records filled out by state patrol officers on the scene. An
officer might interpret the precautionary actions taken by a paramedic (such as taking a passenger
to the hospital for observation) as evidence of an injury when in actuality no injury had occurred.
Although the seriousness of a disabling or fatal accident must not be diminished, the
system needed to be based on data that more reliably conveyed accident conditions and likelihood.
WSDOT engineers examined a variety of possible solutions to this problem. Below is a
description of the proposed (and currently adopted) solution.
WSDOT’s accident database was searched for all accidents that occurred for through-
movements with no stop or signal control at urban and rural locations. The search was conducted
on data from WSDOT’s Northwest region and included five years of data. Out of these,
accidents that could have been prevented by a left- or right-turn lane were used for analysis. The
most prevalent types were rear-end, sideswipe, and opposite direction. The percentages of the five
accident severity classifications were then found for each type of accident. For example, on rural
highways .3 percent of sideswipe accidents are fatal, 4.1 percent are disabling injury, 15.4 percent
are evident injury, 22 percent are possible injury, and 58.1 produce no injury. By applying the
societal costs already used by WSDOT to these percentages, the average societal cost is found for
each type of accident. Tables 3.9 and 3.10 show the severity percentages for each type of the three
types of accidents, as well as the average societal costs.
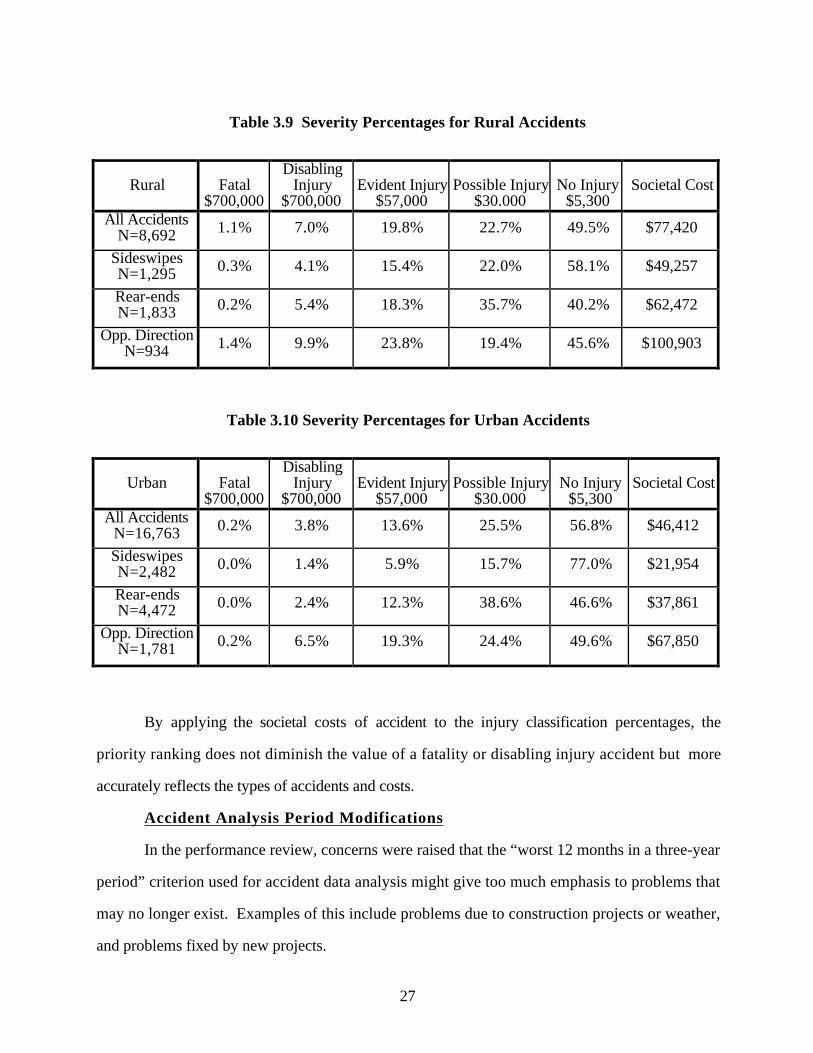
27
Table 3.9 Severity Percentages for Rural Accidents
Rural Fatal$700,000
DisablingInjury
$700,000Evident Injury
$57,000Possible Injury
$30.000No Injury
$5,300Societal Cost
All AccidentsN=8,692 1.1% 7.0% 19.8% 22.7% 49.5% $77,420
SideswipesN=1,295 0.3% 4.1% 15.4% 22.0% 58.1% $49,257
Rear-endsN=1,833 0.2% 5.4% 18.3% 35.7% 40.2% $62,472
Opp. DirectionN=934 1.4% 9.9% 23.8% 19.4% 45.6% $100,903
Table 3.10 Severity Percentages for Urban Accidents
Urban Fatal$700,000
DisablingInjury
$700,000Evident Injury
$57,000Possible Injury
$30.000No Injury
$5,300Societal Cost
All AccidentsN=16,763 0.2% 3.8% 13.6% 25.5% 56.8% $46,412
SideswipesN=2,482 0.0% 1.4% 5.9% 15.7% 77.0% $21,954
Rear-endsN=4,472 0.0% 2.4% 12.3% 38.6% 46.6% $37,861
Opp. DirectionN=1,781 0.2% 6.5% 19.3% 24.4% 49.6% $67,850
By applying the societal costs of accident to the injury classification percentages, the
priority ranking does not diminish the value of a fatality or disabling injury accident but more
accurately reflects the types of accidents and costs.
Accident Analysis Period Modifications
In the performance review, concerns were raised that the “worst 12 months in a three-year
period” criterion used for accident data analysis might give too much emphasis to problems that
may no longer exist. Examples of this include problems due to construction projects or weather,
and problems fixed by new projects.
28
WSDOT decided to instead use the annual average of a three-year accident history. This
approach spreads out data spikes and better identifies ongoing problems.
Accident Threshold Modifications
The accident threshold as also based on the worst 12 months in a three-year history.
Although this did not necessarily need to change, leaving it the same would force the engineer to
analyze an accident record twice, once for the worst 12 months and once for the annual average.
To maintain consistency among and clarity for many database users, a threshold was needed for
the annual average. Using 58 accident records in the database, a Microsoft Excel-Data Analysis
Pack run was used to determine the mean and standard deviation of the average number of
accidents per intersection approach. There were .86 accidents per year, with a standard deviation
of .60. Reviewers decided that approaches with an average of more than one standard deviation
above the mean (1.46 accidents per year) would justify a left-turn lane. Eight (14 percent) of the
intersections were above this range. A critical accident rate based on more in-depth analysis is
needed and is discussed in later in this report.
Delay Severity Score
The system calculates the delay severity score for left-turn lanes with equations from
chapter 10 of the Highway Capacity Manual (HCM) (TRB 1994). The equations can be used for
both two- and four-lane highways. A few assumptions must be made to use the equations. They
are as follows:
• Through-traffic is split 50/50 between the two through-lanes on four-lane highways.
• On four-lane highways, only the inside lane is affected by a left-turn queue. (The outside
lane is neglected in the analysis.)
• Right-turning traffic is added to the through-lane traffic on two-lane highways if no right-
turn lane has been installed. On four-lane highways the right-turning traffic is added to the
outside though-lane (and therefore neglected).
The basic procedure is to first assume that a left-turn lane has already been installed and
then to figure the delay for that movement. Next, subtract the left-turn traffic delay (from the
assumed condition) from the delay in the existing condition (shared lane use). This is the estimated
29
delay reduction that would result from the installation of a left-turn lane. The delay reduction is
then annualized and assigned a cost based on truck and passenger vehicle volumes. Cost factors
for these volumes are $50 per hour for trucks and $10 per hour for automobiles. This is described
in more detail below.
Some of the HCM equations are cumbersome and have been reduced and simplified if
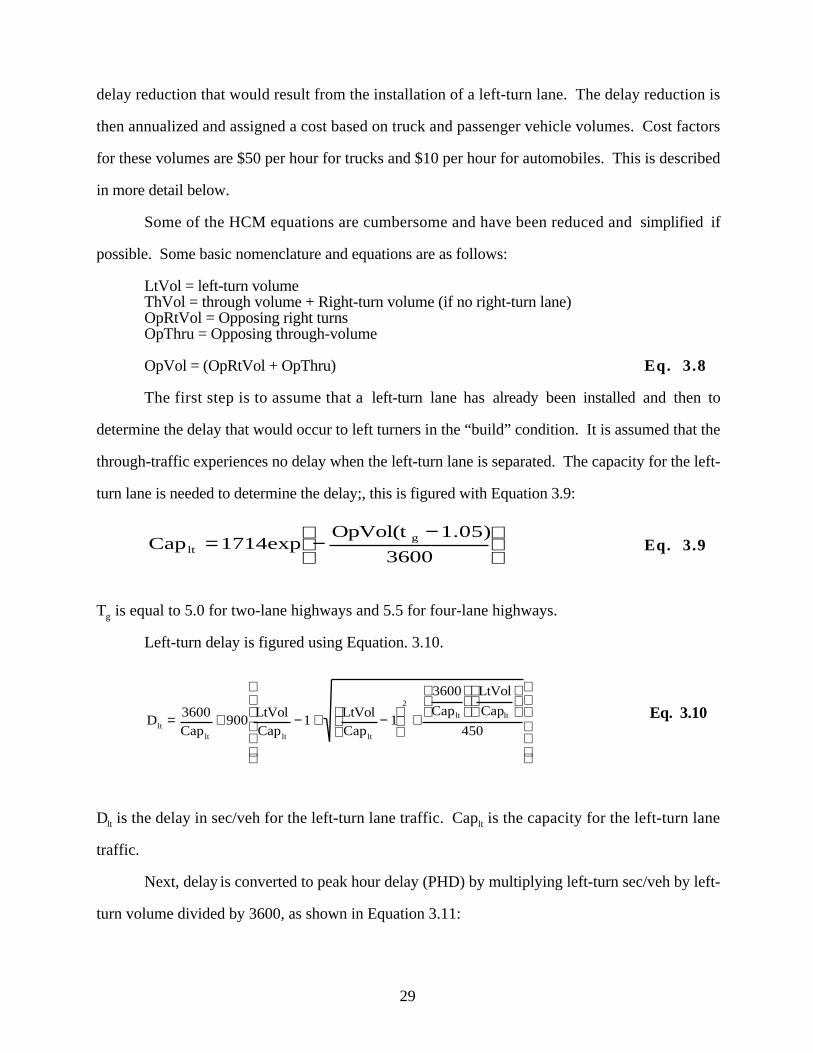
possible. Some basic nomenclature and equations are as follows:
LtVol = left-turn volumeThVol = through volume + Right-turn volume (if no right-turn lane)OpRtVol = Opposing right turns OpThru = Opposing through-volume
OpVol = (OpRtVol + OpThru) Eq. 3.8
The first step is to assume that a left-turn lane has already been installed and then to
determine the delay that would occur to left turners in the “build” condition. It is assumed that the
through-traffic experiences no delay when the left-turn lane is separated. The capacity for the left-
turn lane is needed to determine the delay;, this is figured with Equation 3.9:
Cap 1714expOpVol(t 1.05)
3600ltg= −
−
Eq. 3.9
Tg is equal to 5.0 for two-lane highways and 5.5 for four-lane highways.
Left-turn delay is figured using Equation. 3.10.
D3600Cap
900LtVolCap
1LtVolCap
1
3600
Cap
LtVol
Cap
450ltlt lt lt
2
lt lt= + − + −
+
Eq. 3.10
Dlt is the delay in sec/veh for the left-turn lane traffic. Caplt is the capacity for the left-turn lane
traffic.
Next, delay is converted to peak hour delay (PHD) by multiplying left-turn sec/veh by left-
turn volume divided by 3600, as shown in Equation 3.11:
30
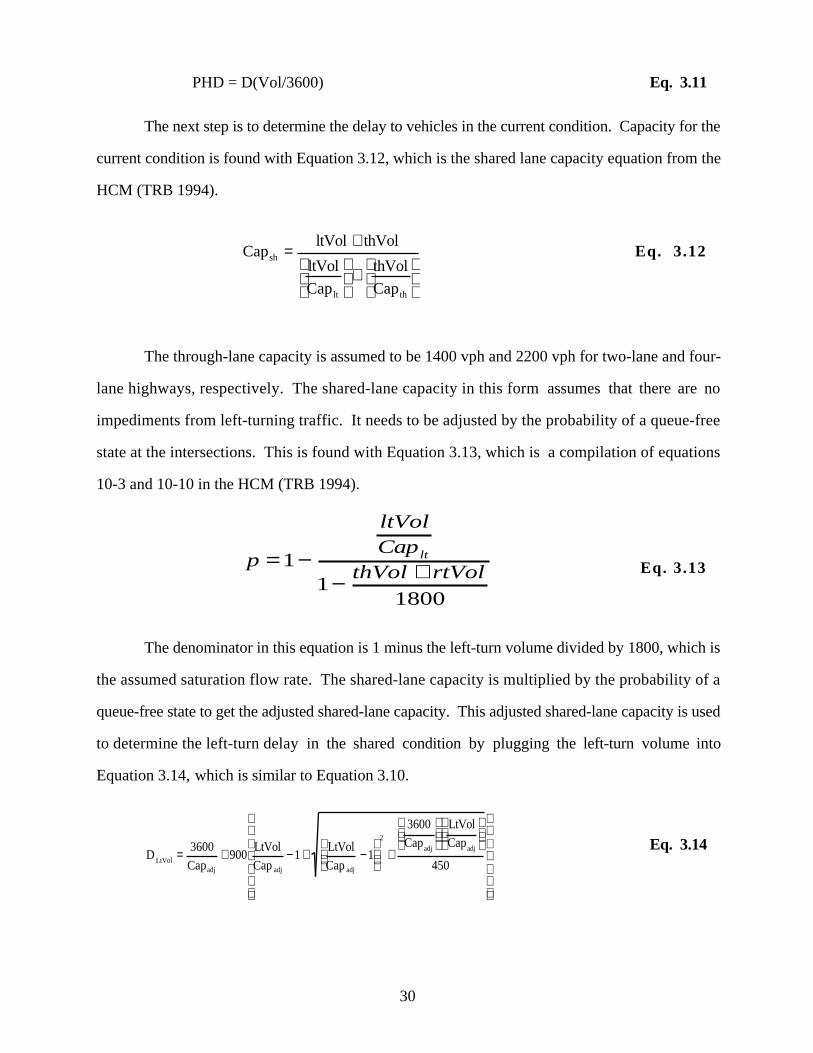
PHD = D(Vol/3600) Eq. 3.11
The next step is to determine the delay to vehicles in the current condition. Capacity for the
current condition is found with Equation 3.12, which is the shared lane capacity equation from the
HCM (TRB 1994).
CapltVol thVol
ltVol
Cap
thVol
Cap
sh
lt th
=+
+
Eq. 3.12
The through-lane capacity is assumed to be 1400 vph and 2200 vph for two-lane and four-
lane highways, respectively. The shared-lane capacity in this form assumes that there are no
impediments from left-turning traffic. It needs to be adjusted by the probability of a queue-free
state at the intersections. This is found with Equation 3.13, which is a compilation of equations
10-3 and 10-10 in the HCM (TRB 1994).
p
ltVolCap
thVol rtVollt= −
− +11
1800
Eq. 3.13
The denominator in this equation is 1 minus the left-turn volume divided by 1800, which is
the assumed saturation flow rate. The shared-lane capacity is multiplied by the probability of a
queue-free state to get the adjusted shared-lane capacity. This adjusted shared-lane capacity is used
to determine the left-turn delay in the shared condition by plugging the left-turn volume into
Equation 3.14, which is similar to Equation 3.10.
D3600
Cap900
LtVol
Cap1
LtVol
Cap1
3600
Cap
LtVol
Cap
450LtVoladj adj adj
2
adj adj= + − + −
+
Eq. 3.14
31
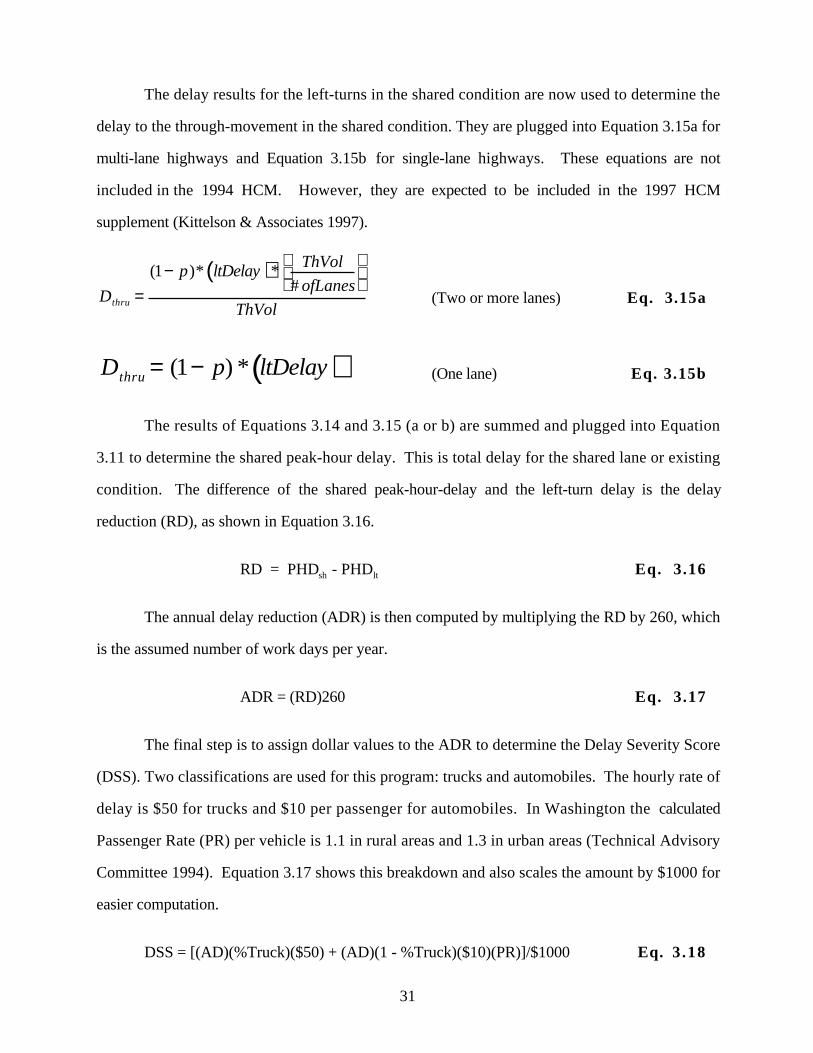
The delay results for the left-turns in the shared condition are now used to determine the
delay to the through-movement in the shared condition. They are plugged into Equation 3.15a for
multi-lane highways and Equation 3.15b for single-lane highways. These equations are not
included in the 1994 HCM. However, they are expected to be included in the 1997 HCM
supplement (Kittelson & Associates 1997).
( )D
p ltDelayThVol
ofLanes
ThVolthru =
−
( )* *
#1
(Two or more lanes) Eq. 3.15a
( )D p ltDelaythru = −( ) *1 (One lane) Eq. 3.15b
The results of Equations 3.14 and 3.15 (a or b) are summed and plugged into Equation
3.11 to determine the shared peak-hour delay. This is total delay for the shared lane or existing
condition. The difference of the shared peak-hour-delay and the left-turn delay is the delay
reduction (RD), as shown in Equation 3.16.
RD = PHDsh - PHDlt Eq. 3.16
The annual delay reduction (ADR) is then computed by multiplying the RD by 260, which
is the assumed number of work days per year.
ADR = (RD)260 Eq. 3.17
The final step is to assign dollar values to the ADR to determine the Delay Severity Score
(DSS). Two classifications are used for this program: trucks and automobiles. The hourly rate of
delay is $50 for trucks and $10 per passenger for automobiles. In Washington the calculated
Passenger Rate (PR) per vehicle is 1.1 in rural areas and 1.3 in urban areas (Technical Advisory
Committee 1994). Equation 3.17 shows this breakdown and also scales the amount by $1000 for
easier computation.
DSS = [(AD)(%Truck)($50) + (AD)(1 - %Truck)($10)(PR)]/$1000 Eq. 3.18
32
“%Truck” is the percentage of trucks in highway traffic and is expressed in decimal form.
These equations and methodology are programmed into the database. An example of this
methodology is shown below:
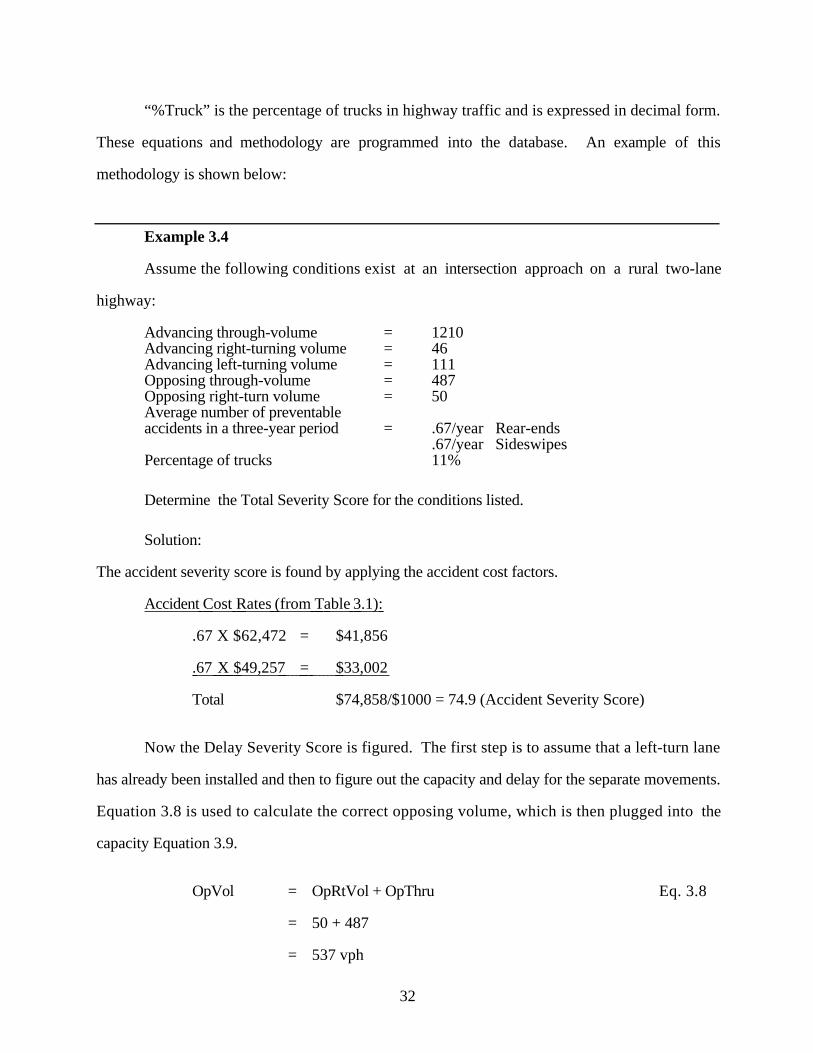
Example 3.4
Assume the following conditions exist at an intersection approach on a rural two-lane
highway:
Advancing through-volume = 1210Advancing right-turning volume = 46Advancing left-turning volume = 111Opposing through-volume = 487Opposing right-turn volume = 50Average number of preventableaccidents in a three-year period = .67/year Rear-ends
.67/year SideswipesPercentage of trucks 11%
Determine the Total Severity Score for the conditions listed.
Solution:
The accident severity score is found by applying the accident cost factors.
Accident Cost Rates (from T able 3.1):
.67 X $62,472 = $41,856
.67 X $49,257 = $33,002
Total $74,858/$1000 = 74.9 (Accident Severity Score)
Now the Delay Severity Score is figured. The first step is to assume that a left-turn lane
has already been installed and then to figure out the capacity and delay for the separate movements.
Equation 3.8 is used to calculate the correct opposing volume, which is then plugged into the
capacity Equation 3.9.
OpVol = OpRtVol + OpThru Eq. 3.8
= 50 + 487
= 537 vph
33
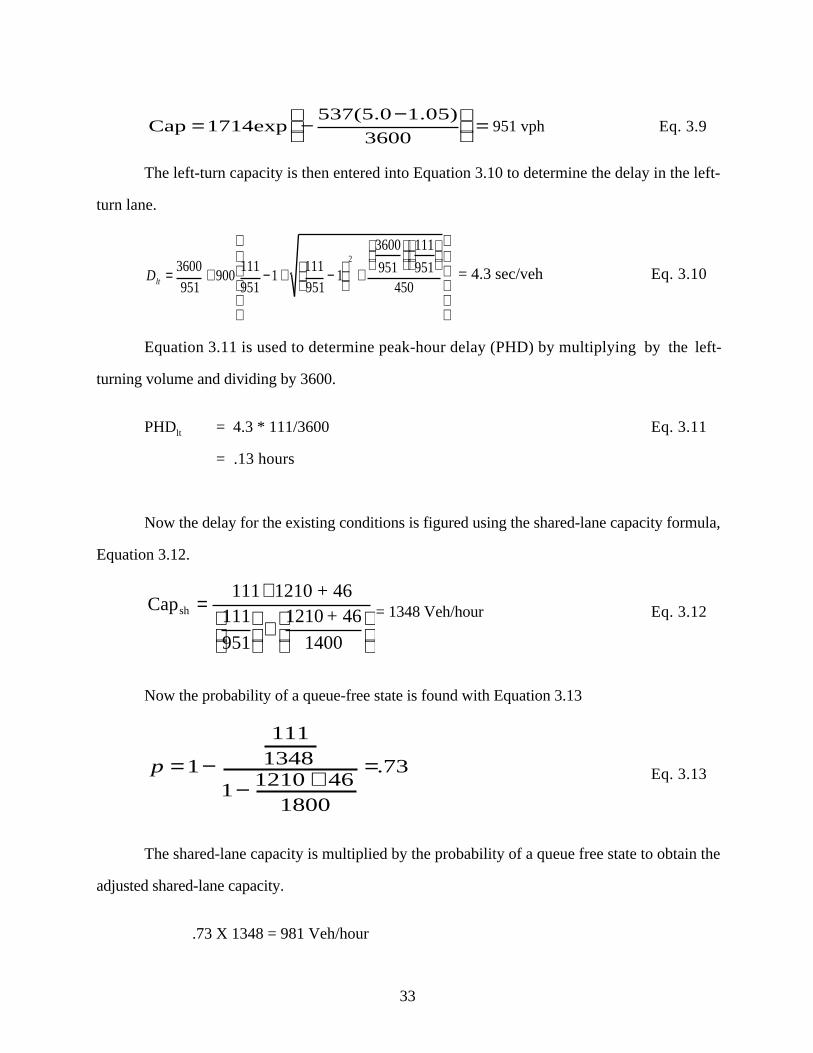
Cap 1714exp537(5.0 1.05)
3600= −
−
= 951 vph Eq. 3.9
The left-turn capacity is then entered into Equation 3.10 to determine the delay in the left-
turn lane.
Dlt = + − + −
+
3600951
900111951
1111951
1
3600
951
111
951450
2
= 4.3 sec/veh Eq. 3.10
Equation 3.11 is used to determine peak-hour delay (PHD) by multiplying by the left-
turning volume and dividing by 3600.
PHDlt = 4.3 * 111/3600 Eq. 3.11
= .13 hours
Now the delay for the existing conditions is figured using the shared-lane capacity formula,
Equation 3.12.
Cap111 1210 + 46
111
951
1210 + 46
1400
sh =+
+
= 1348 Veh/hour Eq. 3.12
Now the probability of a queue-free state is found with Equation 3.13
p = −− +
=1
1111348
11210 46
1800
73. Eq. 3.13
The shared-lane capacity is multiplied by the probability of a queue free state to obtain the
adjusted shared-lane capacity.
.73 X 1348 = 981 Veh/hour
34
Delay for the left-turn movement is found by entering the volume and adjusted capacity into
Equation 3.14.
D3600981
900111981
1111981
1
3600
981
111
981450LtVol
2
= + − + −
+
= 4.14 sec/veh Eq. 3.14
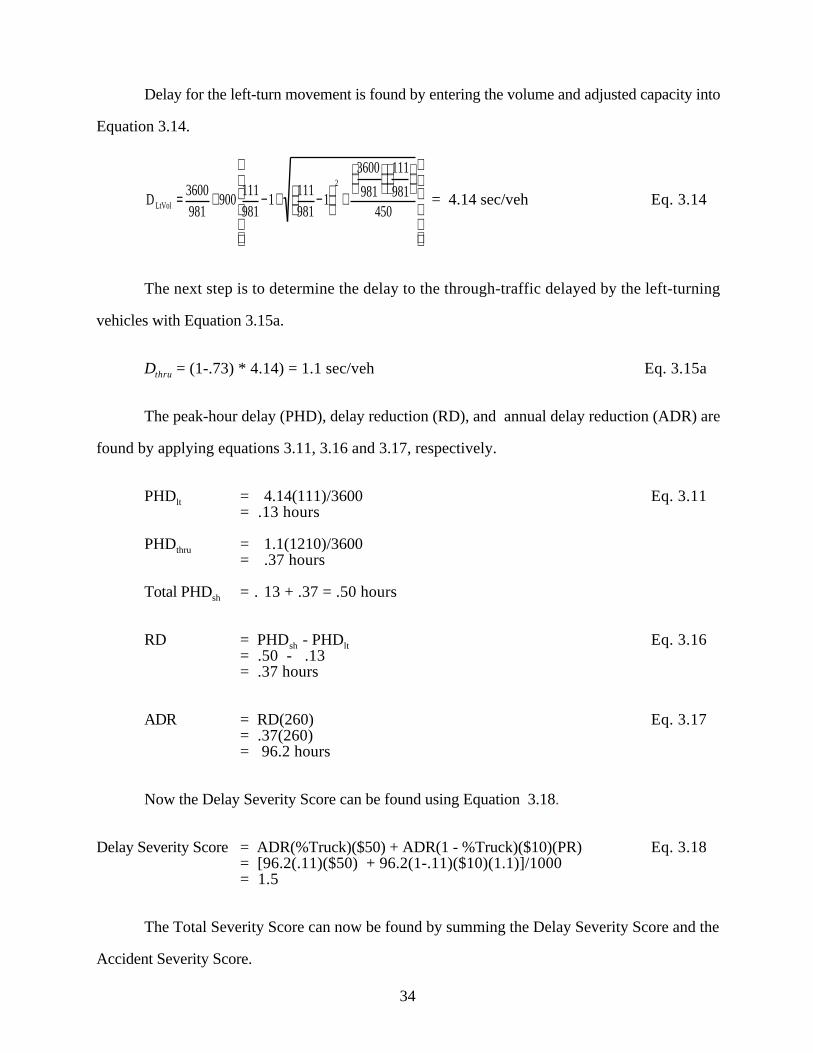
The next step is to determine the delay to the through-traffic delayed by the left-turning
vehicles with Equation 3.15a.
Dthru = (1-.73) * 4.14) = 1.1 sec/veh Eq. 3.15a
The peak-hour delay (PHD), delay reduction (RD), and annual delay reduction (ADR) are
found by applying equations 3.11, 3.16 and 3.17, respectively.
PHDlt = 4.14(111)/3600 Eq. 3.11= .13 hours
PHDthru = 1.1(1210)/3600= .37 hours
Total PHDsh = . 13 + .37 = .50 hours
RD = PHDsh - PHDlt Eq. 3.16= .50 - .13= .37 hours
ADR = RD(260) Eq. 3.17= .37(260)= 96.2 hours
Now the Delay Severity Score can be found using Equation 3.18.
Delay Severity Score = ADR(%Truck)($50) + ADR(1 - %Truck)($10)(PR) Eq. 3.18= [96.2(.11)($50) + 96.2(1-.11)($10)(1.1)]/1000= 1.5
The Total Severity Score can now be found by summing the Delay Severity Score and the
Accident Severity Score.
35
Total Severity Score = 1.5 + 74.9= 76.4
RIGHT-TURN LANE ACCIDENT GUIDELINE
As mentioned in the Literature Review, no published studies have recommended a
threshold value for the number of accidents that would justify a right-turn lane. This is primarily
because of the lack of sufficient data for statistical analysis.
As an example of the lack of sufficient data, in WSDOT’s Northwest Region, where there
are approximately 4,325 intersections, the average right-turn accident rate for all 4,325
intersections is only 244 per year.
After six months of operation, the database for right-turn lane prioritization had
accumulated 22 entries. Similarly to the left-turn threshold, these 22 entries were analyzed with
Microsoft Excels Analysis Pack. The mean accident rate was .54 accidents per year, the standard
deviation was .28. Intersections with average accident rates of greater than one standard deviation
above the mean (.82 accidents per year) are said to need a right-turn lane. Research is needed to
determine the critical accident rate that would justify a right-turn lane. (See Future Research.)
RIGHT-TURN LANE VOLUME GUIDELINE
Cottrell’s guidelines for right-turn lanes (Cottrell 1981) were chosen for this system.
Included in Cottrell’s study are guidelines to determine whether right-turn lanes or tapers are
recommended. In this system only right-turn lanes are included in the priority ranking. However,
the report section of the program includes a recommendation for tapers for informational purposes.
Line equations for Cottrell’s graphs were derived algebraically by the author.
Right-turn lanes are recommended on two-lane highways when the advancing volume
exceeds the result of Equation 3.18 and the speed limit is equal to or greater than 45 mph.
V 600V 40
0.1333ART= − −
Eq. 3.19
36
where VA is the advancing volume, which includes all advancing peak-hour flow, including left-
and right-turning vehicles. VRT is the peak-hour right-turning volume. The upper and lower
bounds of this equation are 120 and 40 vph turning right. If the right-turning volume is higher
than 120 vph, the right-turn lane is always recommended. If the right-turning volume is lower
than 40, a right-turn lane is not recommended and right-turn taper criteria should be checked.
Depending on the conditions, Equation 3.19 and all of the other right-turn lane and taper equations
could yield a negative result. In this case, the right-turn lane (or taper) is still recommended.
An adjustment factor is used in Cottrell’s guidelines when the speed limit is less than 45 mph. In
this case, if the right-turning volume is greater than 40 vph, and if the advancing volume is less
than 300 vph, Equation 3.20 is used.
V VA
RT= − −600 6001333.
Eq. 3.20
If the results for a right-turn lane are not met, the taper criteria should be checked.
Equation 3.21 is used to determine whether a right-turn taper is warranted when the speed limit is
45 mph or greater.
VV
ART= −
−500
20
01.Eq. 3.21
The upper and lower bounds of Equation 3.21 are 70 and 20 vph vehicles turning right. If
the right-turning volume is greater than 70, the taper is always recommended. If the right-turning
volume is less than 20, the taper is never recommended.
An adjustment factor is also applied to Equation 3.21 when the speed limit is less than 45
mph. In this case, if the right-turning volume is greater than 40 vph, and the advancing volume is
less than 300 vph, Equation 3.22 is used.
VV
ART= − −
50040
01.Eq. 3.22
Right-turn lanes on four-lane highways are recommended when the advancing volume
exceeds the result of Equation 3.23.
37
VV
ART= − −
120040
0 0714.Eq. 3.23
The upper and lower bounds for this equation are 90 and 40 vph of right-turning vehicles.
If the right-turning volume is greater than 90 vph, a right-turn lane is always recommended. If the
right-turning volume is less than 40 vph, the lane is not recommended and right-turn taper criteria
should be checked. There is no speed adjustment to the right-turn lane or taper recommendations
on four-lane highways.
The right-turn taper is recommended when the advancing volume exceeds the result of
Equation 3.24.
VV
ART= − −
100010
003.Eq. 3.24
All of the right-turn lane and taper equations are programmed into the priority database. An
example of their application is given below.
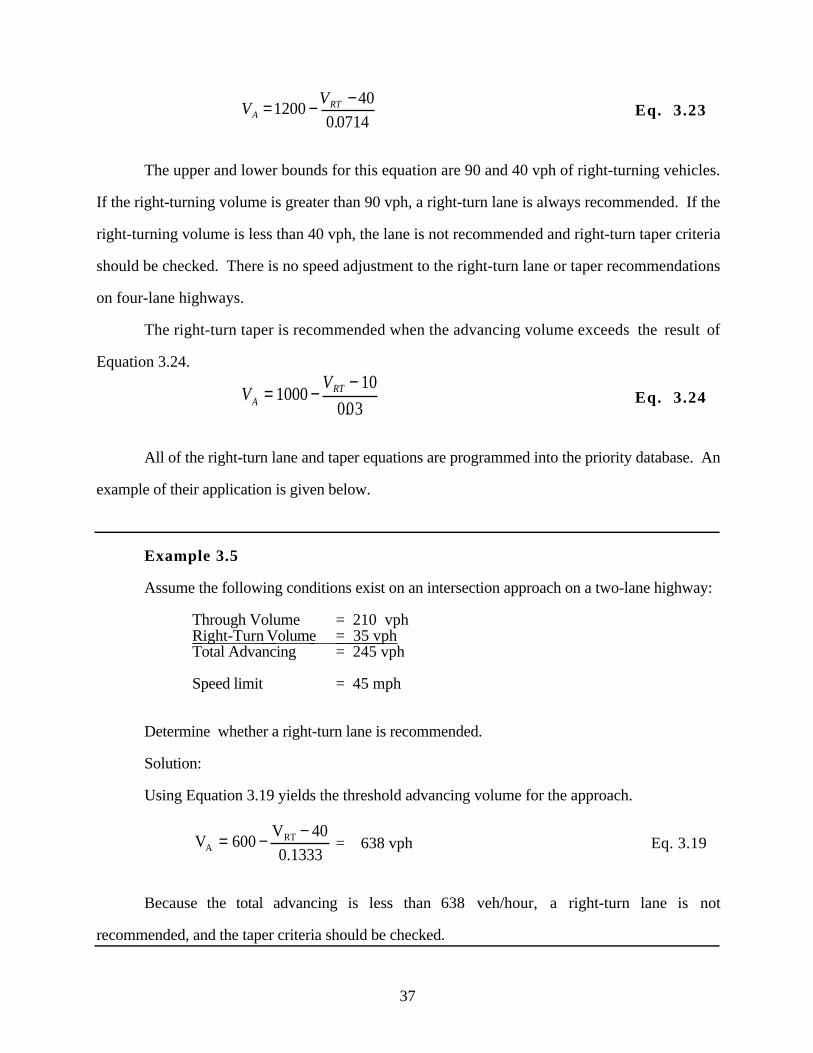
Example 3.5
Assume the following conditions exist on an intersection approach on a two-lane highway:
Through Volume = 210 vph Right-Turn Volume = 35 vphTotal Advancing = 245 vph
Speed limit = 45 mph
Determine whether a right-turn lane is recommended.
Solution:
Using Equation 3.19 yields the threshold advancing volume for the approach.
V 600V 40
0.1333ART= − −
= 638 vph Eq. 3.19
Because the total advancing is less than 638 veh/hour, a right-turn lane is not
recommended, and the taper criteria should be checked.
38
RIGHT-TURN LANE SEVERITY SCORE
The Right-Turn Lane Severity Score is calculated by summing costs associated with delay
and accident history.
Accident Severity Score
The right-turn lane accident severity score is figured in the same manner as the left-turn lane
accident severity score.
Delay Severity Score
The regression equations proposed by McCoy et al.(McCoy 1993) were chosen to
determine the reduction in delay caused by the installation of a right-turn lane. Equation 3.25 is
used to determine the delay in reduction caused by the installation of a right-turn lane on a two-lane
highway. The delay in reduction caused by the installation of right-turn lane on a four-lane
highway is found by using Equation 3.26.
(DR2l) = 0.1552 * Vrt Eq. 3.25
(DR4l) = 0.0800 * Vrt Eq. 3.26
Vrt is the peak-hour right-turn volume, and the units are in seconds per through vehicle.
The peak-hour delay reduction (PHDR) is found by using Equation 3.27.
PHDR = DR(AdVol + RtVol)/3600 Eq. 3.27
AdVol is the peak-hour advancing volume. PHDR is then plugged into Equation 3.28 to
determine the annual delay reduction.
ADR = PHDR(260) Eq. 3.28
Just as with the left-turn delay severity score, Equation 3.18 is used to find the delay
severity score for right-turn lanes. An example determination of a right-turn lane severity score is
shown below.
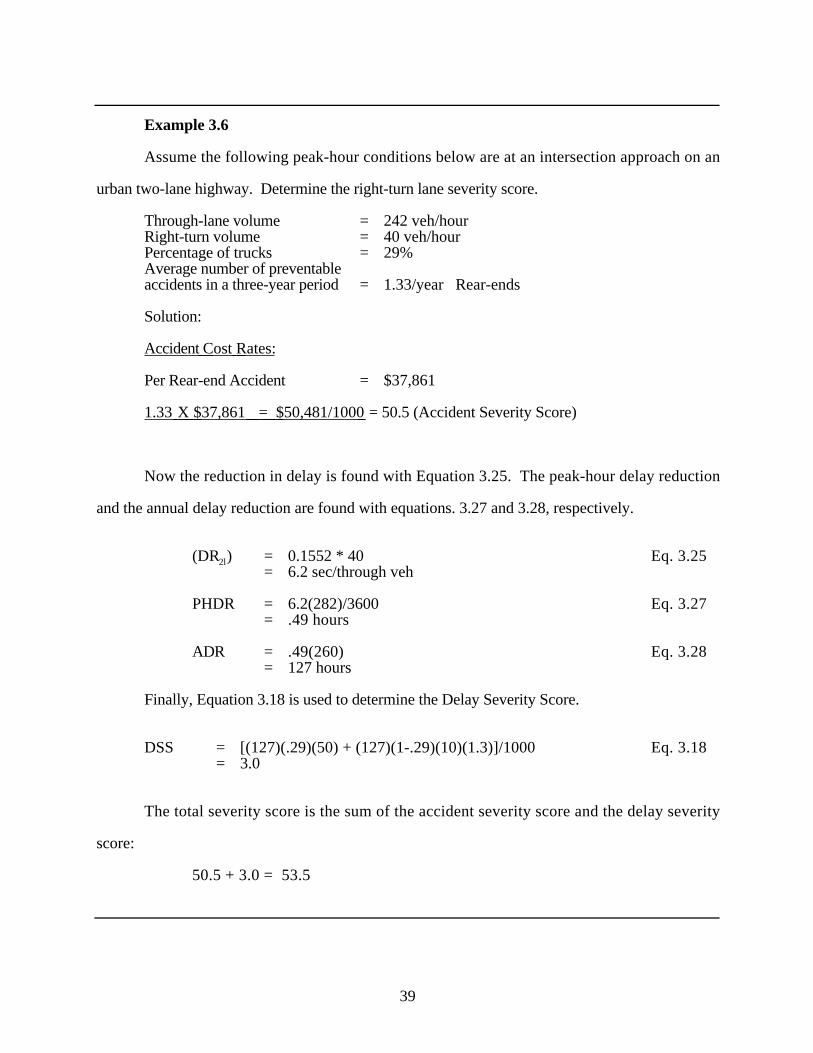
39
Example 3.6
Assume the following peak-hour conditions below are at an intersection approach on an
urban two-lane highway. Determine the right-turn lane severity score.
Through-lane volume = 242 veh/hourRight-turn volume = 40 veh/hourPercentage of trucks = 29%Average number of preventableaccidents in a three-year period = 1.33/year Rear-ends
Solution:
Accident Cost Rates:
Per Rear-end Accident = $37,861
1.33 X $37,861 = $50,481/1000 = 50.5 (Accident Severity Score)
Now the reduction in delay is found with Equation 3.25. The peak-hour delay reduction
and the annual delay reduction are found with equations. 3.27 and 3.28, respectively.
(DR2l) = 0.1552 * 40 Eq. 3.25= 6.2 sec/through veh
PHDR = 6.2(282)/3600 Eq. 3.27= .49 hours
ADR = .49(260) Eq. 3.28= 127 hours
Finally, Equation 3.18 is used to determine the Delay Severity Score.
DSS = [(127)(.29)(50) + (127)(1-.29)(10)(1.3)]/1000 Eq. 3.18= 3.0
The total severity score is the sum of the accident severity score and the delay severity
score:
50.5 + 3.0 = 53.5
40
CHAPTER FOURDATA COMPILATION AND FIELD STUDIES
The data needed for this program are easily obtained by ordering turning movement counts
and accident records. However, the engineer should make every effort to visit the site in question
to determine other factors that might affect the decision to install a turn lane. For example, sight
distance limitations, vertical curves, and horizontal curves could significantly affect the decision to
install a turn-lane.
Included in the field study should be a discussion with local residents and officials who
might be able to offer information on conditions that are not readily apparent. The engineer
should be aware of conditions under which the installation of a left- or right-turn lane might cause
the intersection to be more dangerous. For example, adding a left-turn lane significantly increases
the width of a roadway and therefore increases the required gap time needed to cross or enter the
roadway. If the gap time available during the peak hour is short or marginal, the additional gap
time could create a more dangerous situation, as well as increase sidestreet delay. Additionally, the
sidestreet traffic’s sight distance could be reduced by the widening necessary to install a left- or
right-turn lane. These conditions can be addressed in preliminary analysis and should be
addressed if the intersection is chosen for a left- or right-turn lane installation.
Another issue to be considered is access control. It is entirely possible that the presence of
left-turning traffic, whether in through-lanes or left-turn lanes hinders, operations to such a degree
that the movement should be prevented by access control. For example, if two intersections are
very close together, the queue from left-turning traffic at one (whether in the through-lane or left-
turn lane) could hinder operations at the other. In this situation, the engineer should consider
restricting the movement through access control.
The software program developed includes a comment section where these considerations
and field study information may be addressed. Below is a list of the data required and/or
recommended for the database program:
41
LOCATIONAL AND CHARACTERISTIC INFORMATION
• Highway number
• Mile post
• Cross road name
• Approach direction (increasing or decreasing milepost)
• Control section number
• Divided or undivided
• Number of lanes
• Existing right turn
• Speed limit
PEAK HOUR VOLUME INFORMATION
• Advancing turning movement counts
Through-volume
Left-turning volume
Right-turning volume
• Opposing turning movement counts
Through-volume
Left-turning volume
Right-turning volume
ACCIDENT INFORMATION
Number of preventable:
• Fatality accidents
• Disabling accidents
• Evident injury accidents
• Possible injury accidents
• Property damage only accidents
42
RELEVANT INFORMATION
This information is not required for the priority array to function; however, if the items are
relevant to the installation of a left- or right-turn lane, they should be addressed by the engineer in
the comments section of the database entry form.
• Horizontal and vertical curves
• Grade information
• Intersection skew angles
• Sight distance
• Roadway width
• Possible obstructions to widening
• Community comments
43
CHAPTER FIVERECOMMENDATIONS AND CONCLUSIONS
FUTURE RESEARCH NEEDED
Harmelink’s original model for left-turn lanes was based on the probability of a
queue waiting for a left-turning vehicle. The maximum probabilities allowable before a
left-turn lane is recommended are based in part on the opinions of a panel of transportation
engineers assembled in the late 1960s. Although the model has been effective, changing
conditions and technologies could warrant a study on the appropriateness of the maximum
probabilities chosen. Methods derived from risk analysis studies may be used to derive
more accurate and objective probabilities based on the geometrics of the intersection (Poch
and Mannering ).
Only one study recommended a threshold value of accidents for left-turn lane
installation. No studies provided a threshold value of accidents to justify a right-turn lane.
It is appropriate to question the value of a warrant or guideline based solely on accident
history. Although accident history can certainly alert the engineer to existing trouble spots,
this approach is reactive. Recent risk analysis studies are attempting to allow the engineer
to pro-actively address potential problems (Poch and Mannering). Unfortunately, no
research has been done that would apply to the individual intersection with regard to left-
and right-turn lanes.
A risk analysis based on intersection conditions such as roadway width, vertical
and horizontal curves, sight distance, and volumes, used in conjunction with an accident
history, may be the most appropriate method of “warranting” left- and right-turn lanes.
CONCLUSIONS
Along with signalization, other improvements should be considered that will
increase the safety and efficiency of an intersection. Left- and right-turn lanes can
significantly improve the operations of an intersection. This project developed a computer
44
program based on published standards and engineering studies that enables the engineer to
maintain a prioritized list of intersections being considered for such improvements.
Each intersection is analyzed by first determining whether a left- or right-turn lane is
recommended. This is done with threshold values for traffic volumes and accident history.
The volume threshold for left-turn lanes is based on a modified AASHTO table (Kikuchi
and Chakroborty 1991). The accident threshold for left-turn lanes is four preventable
accidents in a 12-month period (Agent 1983).
The volume threshold for right-turn lanes is based on warrant graphs developed by
Cottrell (Cottrell 1981). The accident guideline for right-turn lanes is five preventable
accidents in a 12-month period. This number is a based on other warrant guidelines for
traffic control devices and has no statistical basis.
Once it has been determined that a left- or right-turn lane is recommended, the
intersection has to be ranked among other intersections being considered. This is done by
assigning dollar values to delay analysis and accident history reports.
The benefits of this system are that it is an objective method of ranking intersections
against others and it is easy to use. It requires data that are easily obtainable from resources
available at most traffic offices.
The system and methodology presented in this report are not considered warrants;
rather, they serve as logical starting points for left- and right-turn lane guidelines. The
system and methodology’s primary function is to serve as an analysis and planning tool for
operation engineers. As intersection operation problems become evident through public
outcry, analysis, and other means, the engineer is able to analyze the intersection and
compare it to others objectively.