print 2009 am slides - kellogg'sinvestor.kelloggs.com/.../2009/print-2009-am-slides.pdf ·...
TRANSCRIPT

Gifted Hands: The Ben Carson StoryGifted Hands: The Ben Carson Story
Joel Allmandinger
Lortoni Butler
Joseph Franklin
Efren Gonzalez
Andrew Herzog
Joel Allmandinger
Lortoni Butler
Joseph Franklin
Efren Gonzalez
Andrew Herzog
We honor our employees on active duty
We honor our employees on active duty
Gregory Lindsay
Rhet Ponchinlan
Jesse Schweikhart
John Spelman
Gregory Lindsay
Rhet Ponchinlan
Jesse Schweikhart
John Spelman
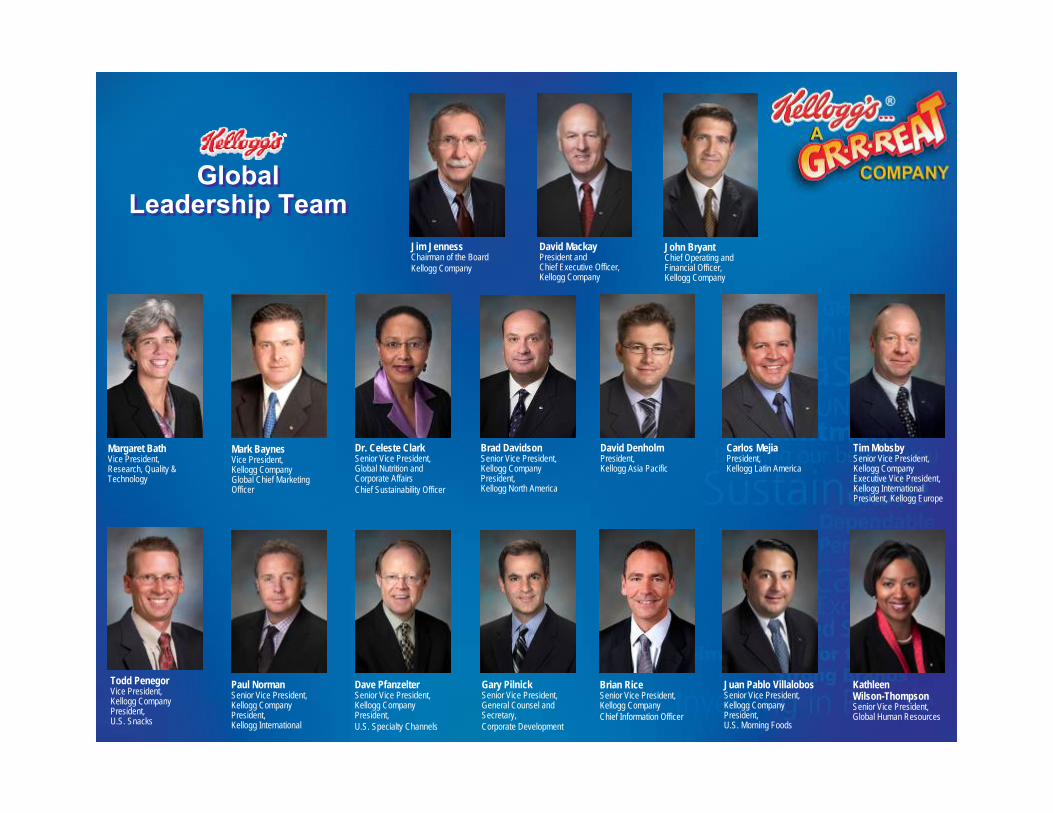
Kathleen Wilson-ThompsonSenior Vice President, Global Human Resources
Jim JennessChairman of the Board Kellogg Company
David MackayPresident and Chief Executive Officer,Kellogg Company
Brian RiceSenior Vice President, Kellogg CompanyChief Information Officer
John BryantChief Operating andFinancial Officer,Kellogg Company
Brad DavidsonSenior Vice President, Kellogg CompanyPresident,Kellogg North America
Tim MobsbySenior Vice President, Kellogg CompanyExecutive Vice President, Kellogg InternationalPresident, Kellogg Europe
Paul NormanSenior Vice President, Kellogg CompanyPresident,Kellogg International
Dave PfanzelterSenior Vice President, Kellogg CompanyPresident, U.S. Specialty Channels
Gary PilnickSenior Vice President, General Counsel and Secretary, Corporate Development
Juan Pablo VillalobosSenior Vice President, Kellogg CompanyPresident, U.S. Morning Foods
Dr. Celeste ClarkSenior Vice President, Global Nutrition and Corporate AffairsChief Sustainability Officer
Margaret BathVice President,Research, Quality & Technology
Todd PenegorVice President,Kellogg CompanyPresident,U.S. Snacks
Mark BaynesVice President,Kellogg CompanyGlobal Chief MarketingOfficer
GlobalLeadership Team
GlobalLeadership Team
Carlos MejiaPresident,Kellogg Latin America
David DenholmPresident,Kellogg Asia Pacific
Forward-Looking StatementsForward-Looking Statements
This presentation contains, or incorporates by reference, “forward-looking statements” withprojections concerning, among other things, the Company’s strategy, and the Company’s sales, earnings, margin, operating profit, costs and expenditures, interest expense, tax rate, capital expenditure, dividends, cash flow, debt reduction, share repurchases, costs, brand building, ROIC, working capital, growth, new products, innovation, cost reduction projects, and competitive pressures. Forward-looking statements include predictions of future results or activities and may contain the words “expects,” “believes,” “should,” “will,” “will deliver,”“anticipates,” “projects,” “estimates,” or words or phrases of similar meaning.
The Company’s actual results or activities may differ materially from these predictions. The Company’s future results could also be affected by a variety of other factors, including competitive conditions and their impact; the effectiveness of pricing, advertising, and promotional spending programs; the success of productivity improvements and business transitions; the success of innovation and new product introductions; the recoverability of carrying amounts of goodwill and other intangibles; the availability of and interest rates on short-term financing; changes in consumer behavior and preferences; commodity and energy prices and labor costs; actual market performance of benefit plan trust investments; the levels of spending on systems initiatives, properties, business opportunities, integration of acquired businesses, and other general and administrative costs; U.S. and foreign economic conditions including interest rates, taxes and tariffs, and currency rate translations or unavailability; legal and regulatory factors; the ultimate impact of product recalls; the underlying price and volatility of the Company’s common stock and the impact of equity-based employee awards; business disruption or other losses from terrorist acts or political unrest; and other items.
Forward-looking statements speak only as of the date they were made, and the Company undertakes no obligation to publicly update them.
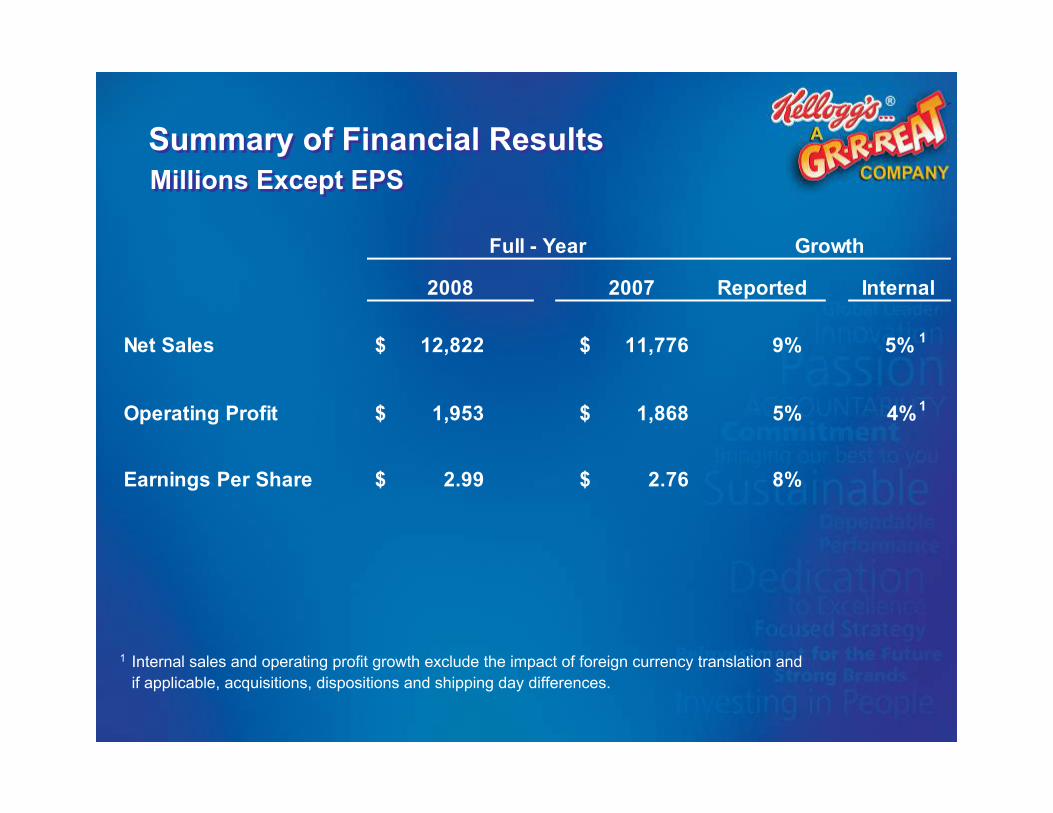
Summary of Financial ResultsSummary of Financial ResultsMillions Except EPSMillions Except EPS
Reported Internal
Net Sales $ 12,822 $ 11,776 9% 5% 1
Operating Profit $ 1,953 $ 1,868 5% 4% 1
Earnings Per Share $ 2.99 $ 2.76 8%
Full - Year Growth
2008 2007
1 Internal sales and operating profit growth exclude the impact of foreign currency translation and if applicable, acquisitions, dispositions and shipping day differences.
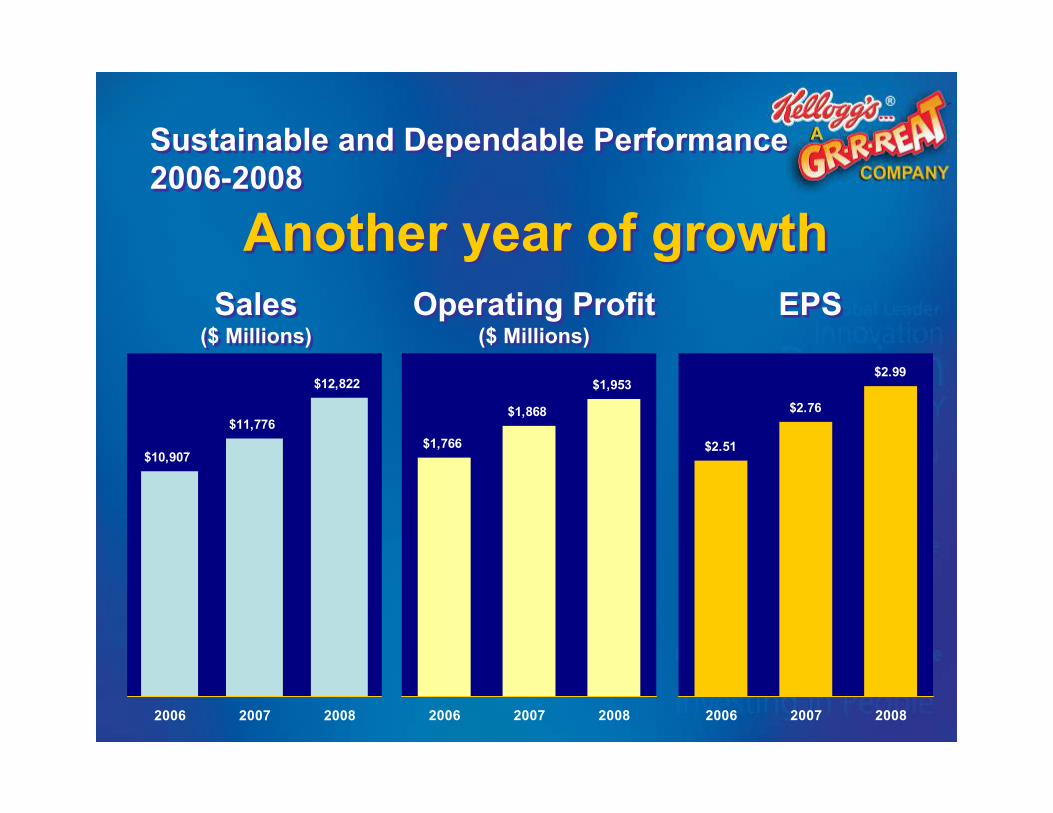
Sustainable and Dependable Performance2006-2008Sustainable and Dependable Performance2006-2008
$10,907
$11,776
$12,822
2006 2007 2008
Sales($ Millions)Sales
($ Millions)
$1,766
$1,868
$1,953
2006 2007 2008
$2.51
$2.76
$2.99
2006 2007 2008
Operating Profit($ Millions)
Operating Profit($ Millions)
EPSEPS
Another year of growthAnother year of growth
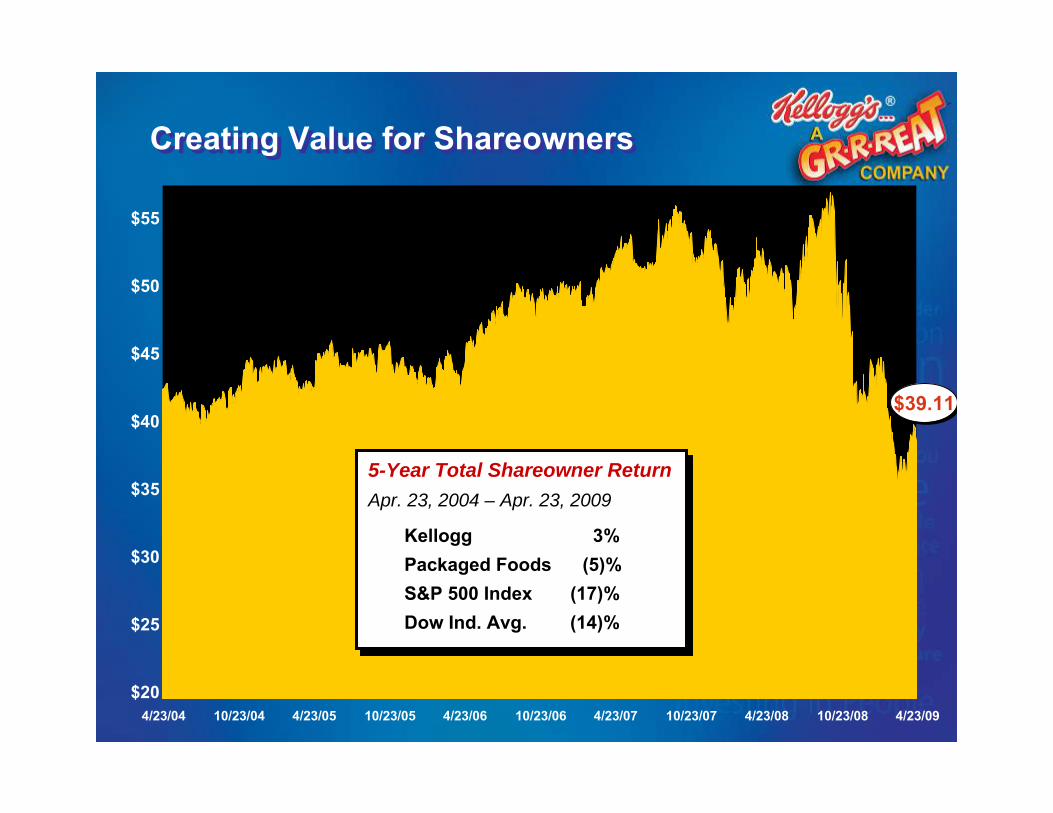
Creating Value for ShareownersCreating Value for Shareowners
5-Year Total Shareowner ReturnApr. 23, 2004 – Apr. 23, 2009
Kellogg 3%Packaged Foods (5)%S&P 500 Index (17)%Dow Ind. Avg. (14)%
5-Year Total Shareowner ReturnApr. 23, 2004 – Apr. 23, 2009
Kellogg 3%Packaged Foods (5)%S&P 500 Index (17)%Dow Ind. Avg. (14)%
$20
$25
$30
$35
$40
$45
$50
$55
4/23/04 10/23/04 4/23/05 10/23/05 4/23/06 10/23/06 4/23/07 10/23/07 4/23/08 10/23/08 4/23/09
$39.11$39.11
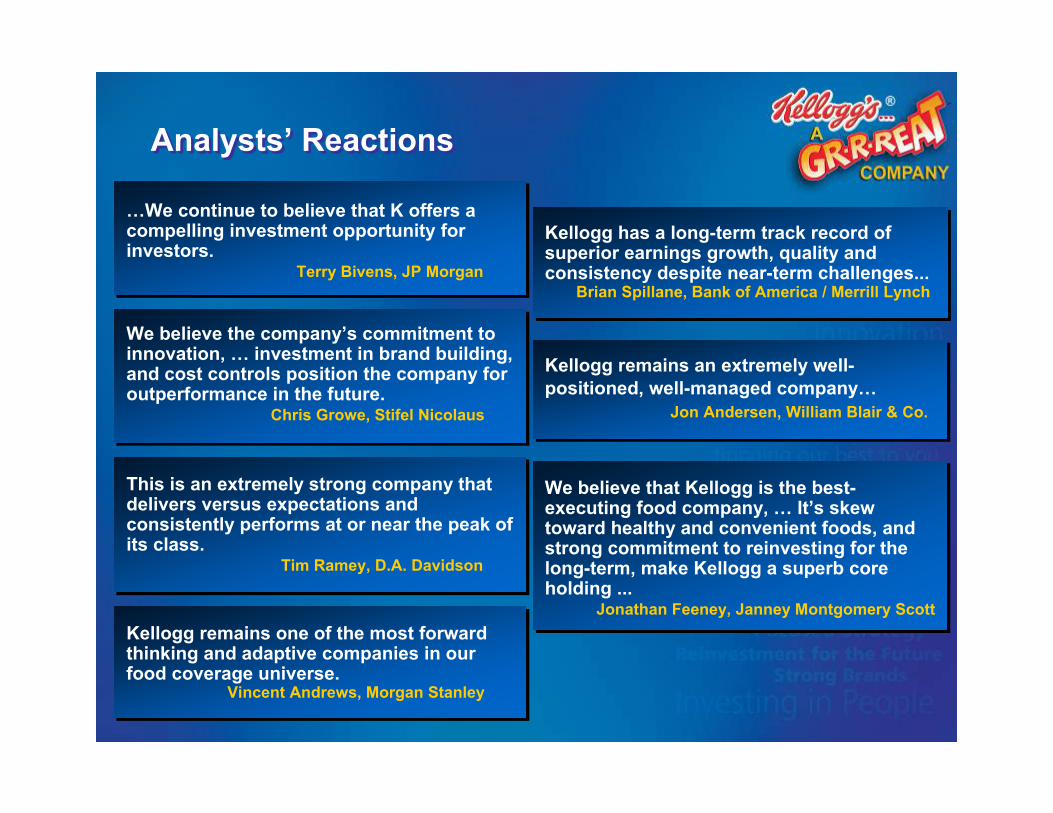
We believe that Kellogg is the best-executing food company, … It’s skew toward healthy and convenient foods, and strong commitment to reinvesting for the long-term, make Kellogg a superb core holding ...
Jonathan Feeney, Janney Montgomery Scott
This is an extremely strong company that delivers versus expectations and consistently performs at or near the peak of its class.
Tim Ramey, D.A. Davidson
We believe the company’s commitment to innovation, … investment in brand building, and cost controls position the company for outperformance in the future.
Chris Growe, Stifel Nicolaus
…We continue to believe that K offers a compelling investment opportunity for investors.
Terry Bivens, JP Morgan
Kellogg remains an extremely well-positioned, well-managed company…
Jon Andersen, William Blair & Co.
Kellogg has a long-term track record of superior earnings growth, quality and consistency despite near-term challenges...
Brian Spillane, Bank of America / Merrill Lynch
Kellogg remains one of the most forward thinking and adaptive companies in our food coverage universe.
Vincent Andrews, Morgan Stanley
Analysts’ ReactionsAnalysts’ Reactions
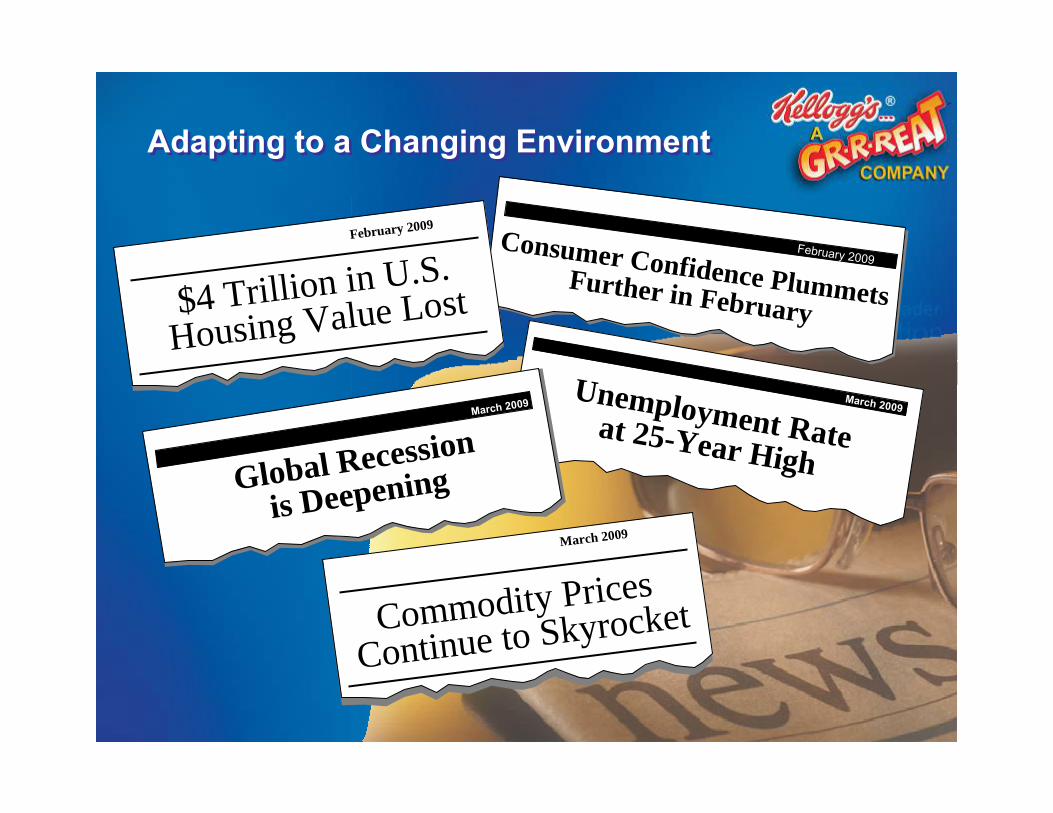
Adapting to a Changing EnvironmentAdapting to a Changing Environment
Unemployment Rateat 25-Year High
March 2009
Consumer Confidence PlummetsFurther in February
February 2009
February 2009
$4 Trillion in U.S.
Housing Value Lost
March 2009
Commodity Prices
Continue to Skyrocket
Global Recession
is Deepening
March 2009
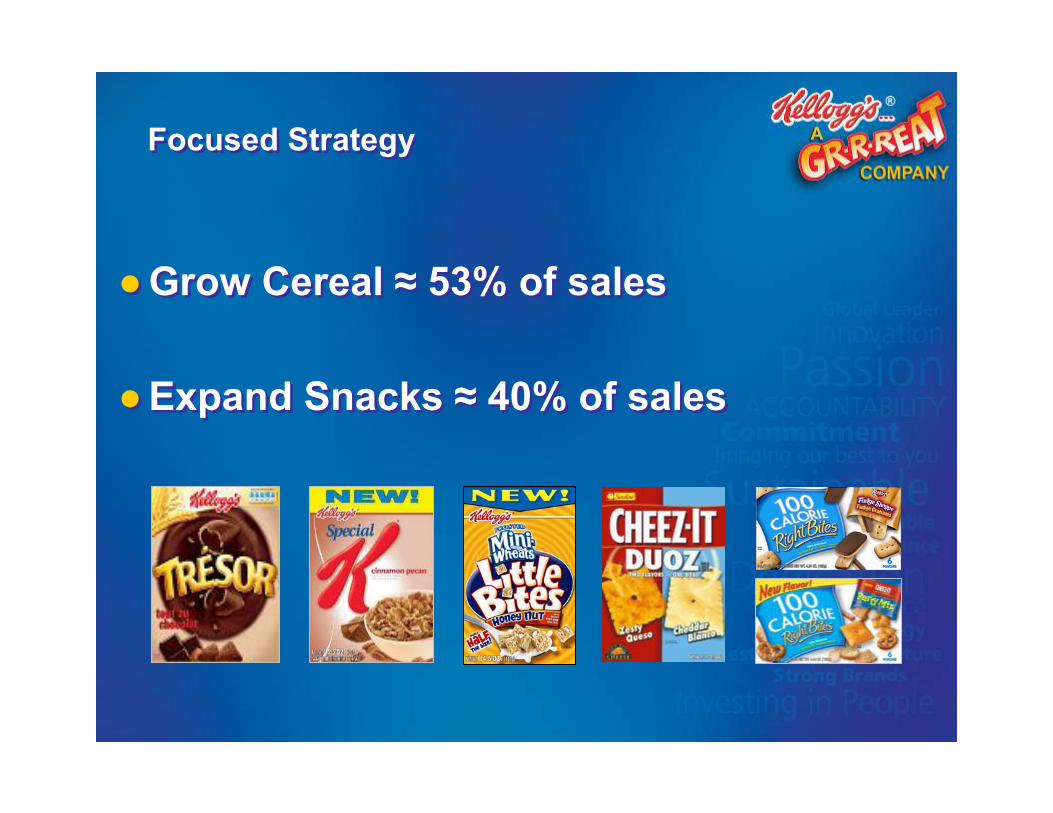
Focused StrategyFocused Strategy
●Grow Cereal ≈ 53% of sales
●Expand Snacks ≈ 40% of sales
●Grow Cereal ≈ 53% of sales
●Expand Snacks ≈ 40% of sales
$0
$2
$4
$6
$8
$10
$12
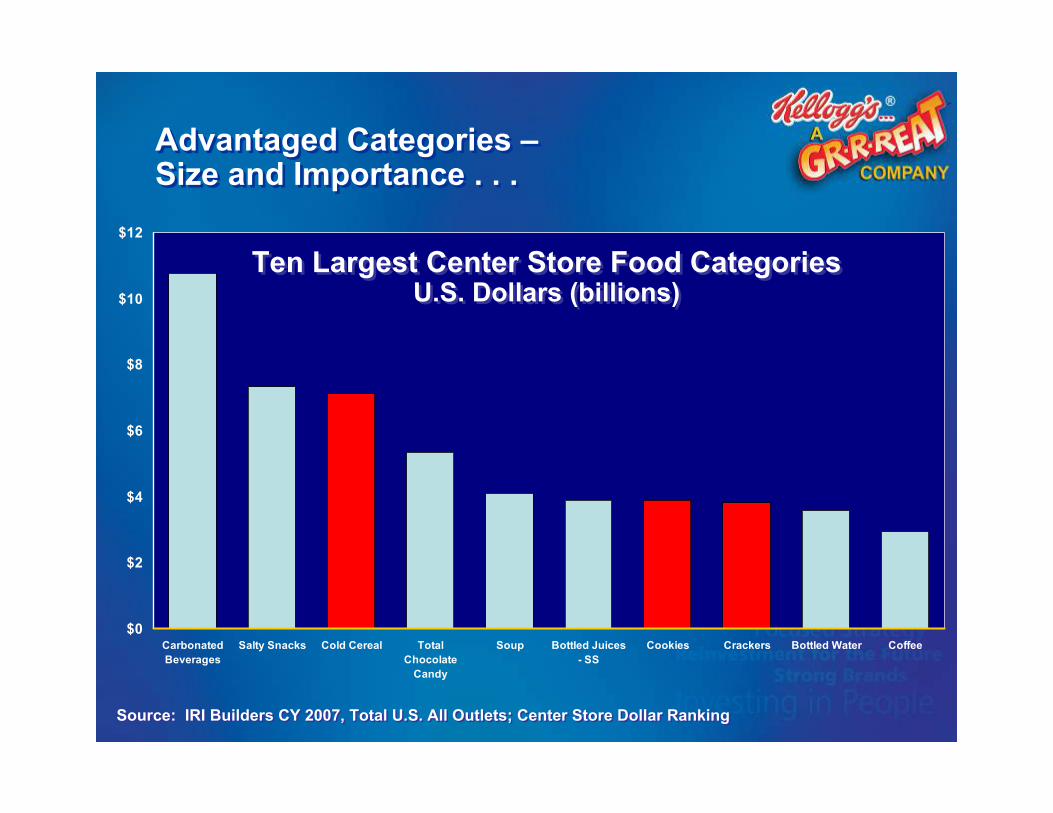
CarbonatedBeverages
Salty Snacks Cold Cereal TotalChocolate
Candy
Soup Bottled Juices- SS
Cookies Crackers Bottled Water Coffee
Ten Largest Center Store Food CategoriesU.S. Dollars (billions)
Ten Largest Center Store Food CategoriesU.S. Dollars (billions)
Advantaged Categories –Size and Importance . . . Advantaged Categories –Size and Importance . . .
Source: IRI Builders CY 2007, Total U.S. All Outlets; Center Store Dollar Ranking Source: IRI Builders CY 2007, Total U.S. All Outlets; Center Store Dollar Ranking
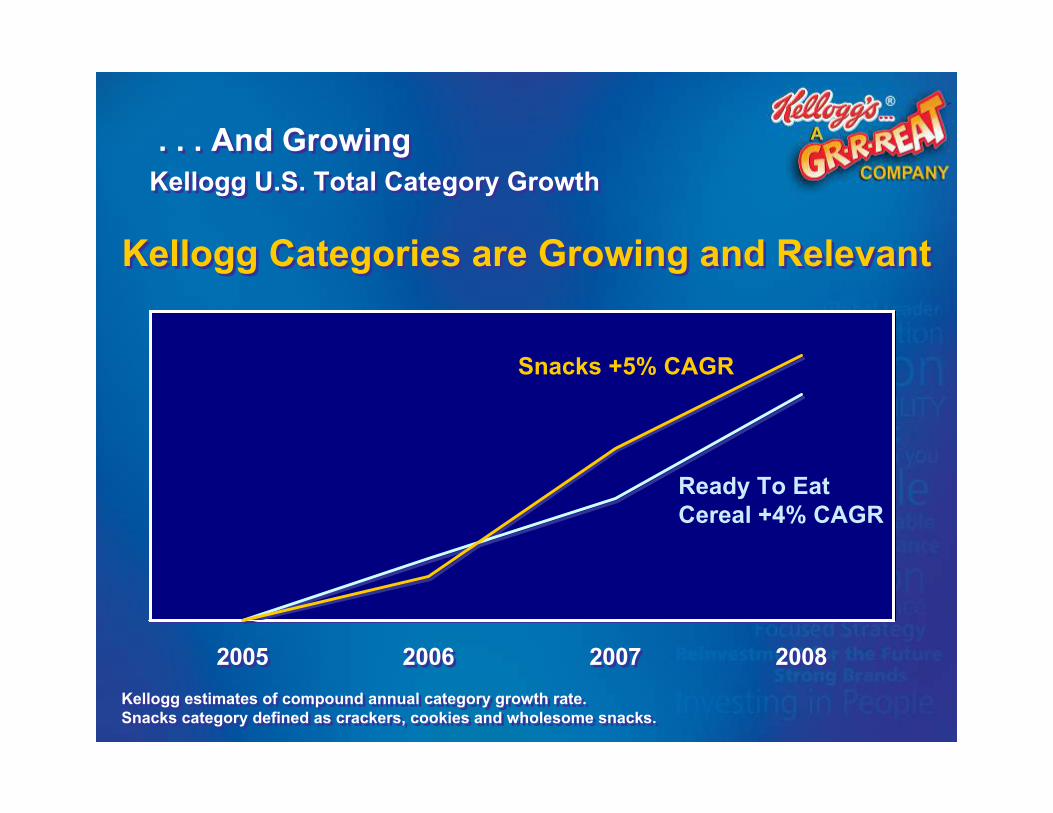
2005 2006 2007 20082005 2006 2007 2008
. . . And Growing Kellogg U.S. Total Category Growth. . . And Growing
Kellogg U.S. Total Category Growth
Kellogg Categories are Growing and RelevantKellogg Categories are Growing and Relevant
Kellogg estimates of compound annual category growth rate.Snacks category defined as crackers, cookies and wholesome snacks.Kellogg estimates of compound annual category growth rate.Snacks category defined as crackers, cookies and wholesome snacks.
Ready To Eat Cereal +4% CAGR
Snacks +5% CAGR
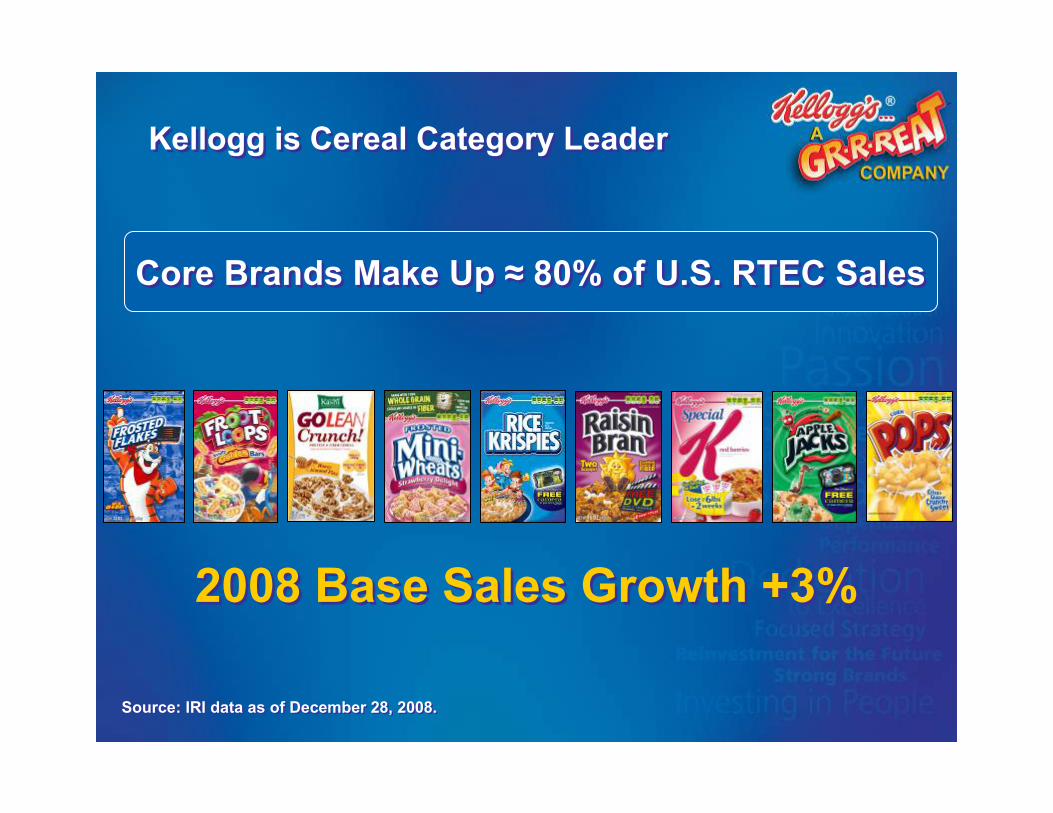
Kellogg is Cereal Category LeaderKellogg is Cereal Category Leader
Core Brands Make Up ≈ 80% of U.S. RTEC Sales Core Brands Make Up ≈ 80% of U.S. RTEC Sales
Source: IRI data as of December 28, 2008. Source: IRI data as of December 28, 2008.
2008 Base Sales Growth +3%2008 Base Sales Growth +3%
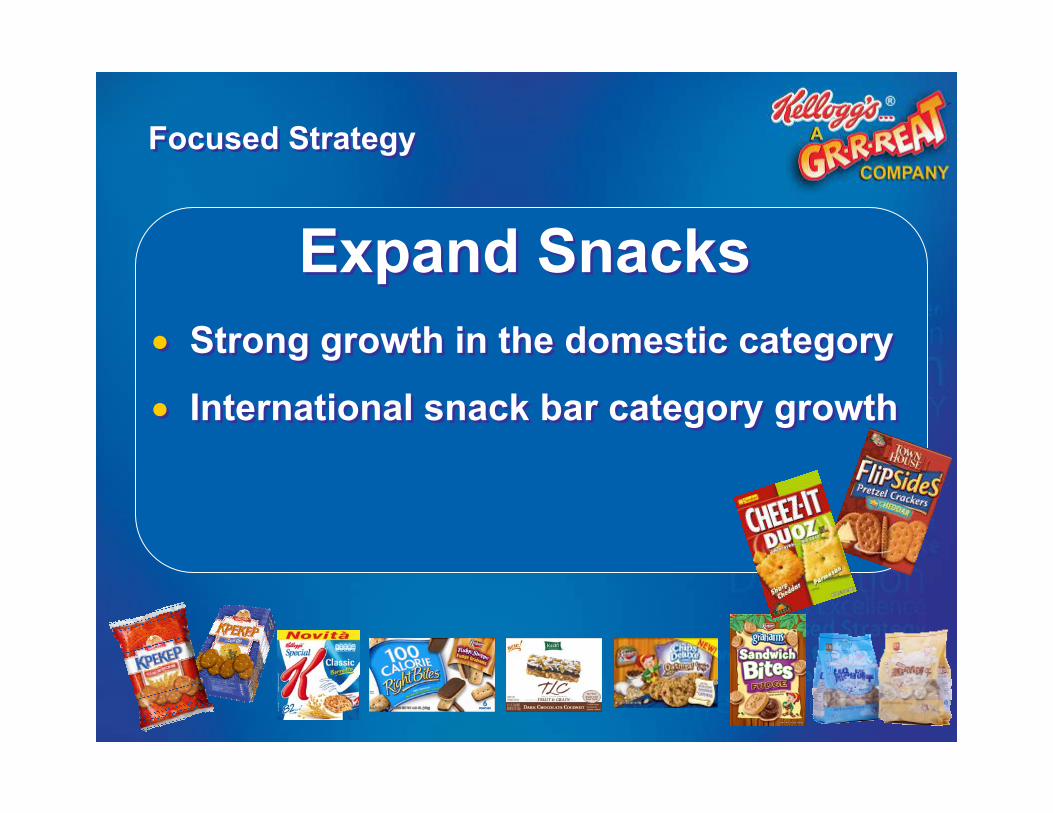
Focused StrategyFocused Strategy
Strong growth in the domestic category
International snack bar category growth
Strong growth in the domestic category
International snack bar category growth
Expand SnacksExpand Snacks
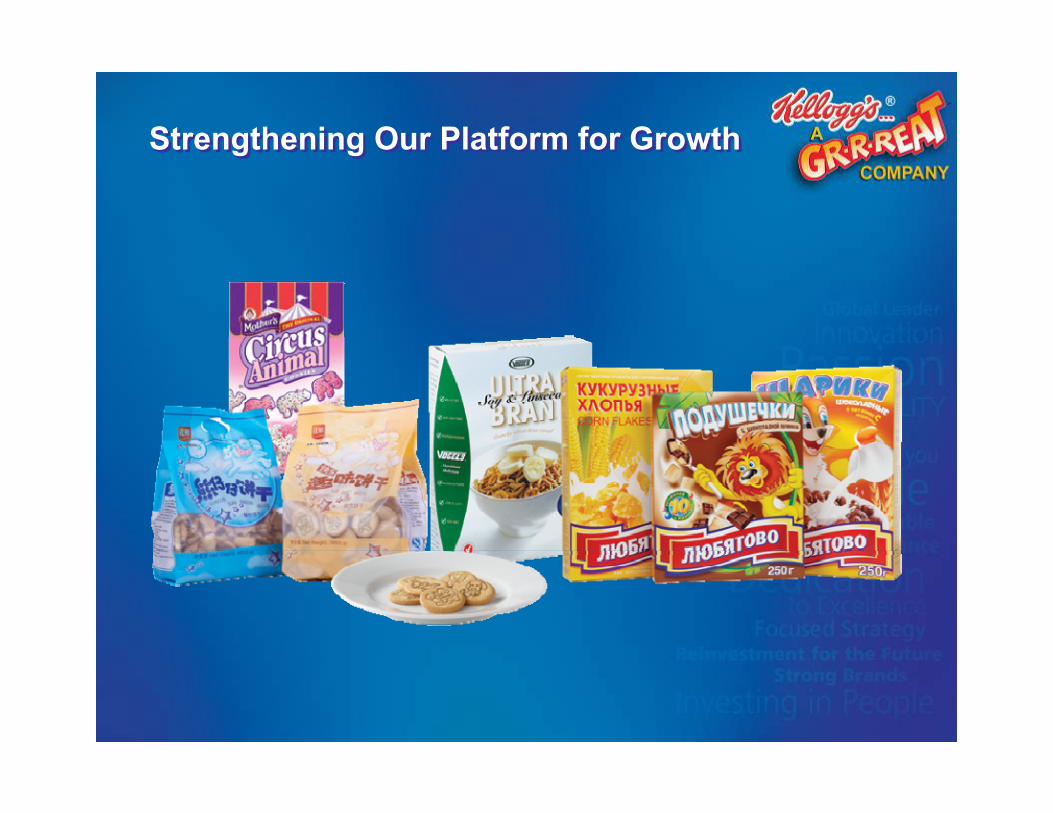
Strengthening Our Platform for GrowthStrengthening Our Platform for Growth
Consistent and Relevant Business ModelConsistent and Relevant Business Model
●Strong innovation / renovation
● Invest in brand building
●Cost control
●Strong innovation / renovation
● Invest in brand building
●Cost control
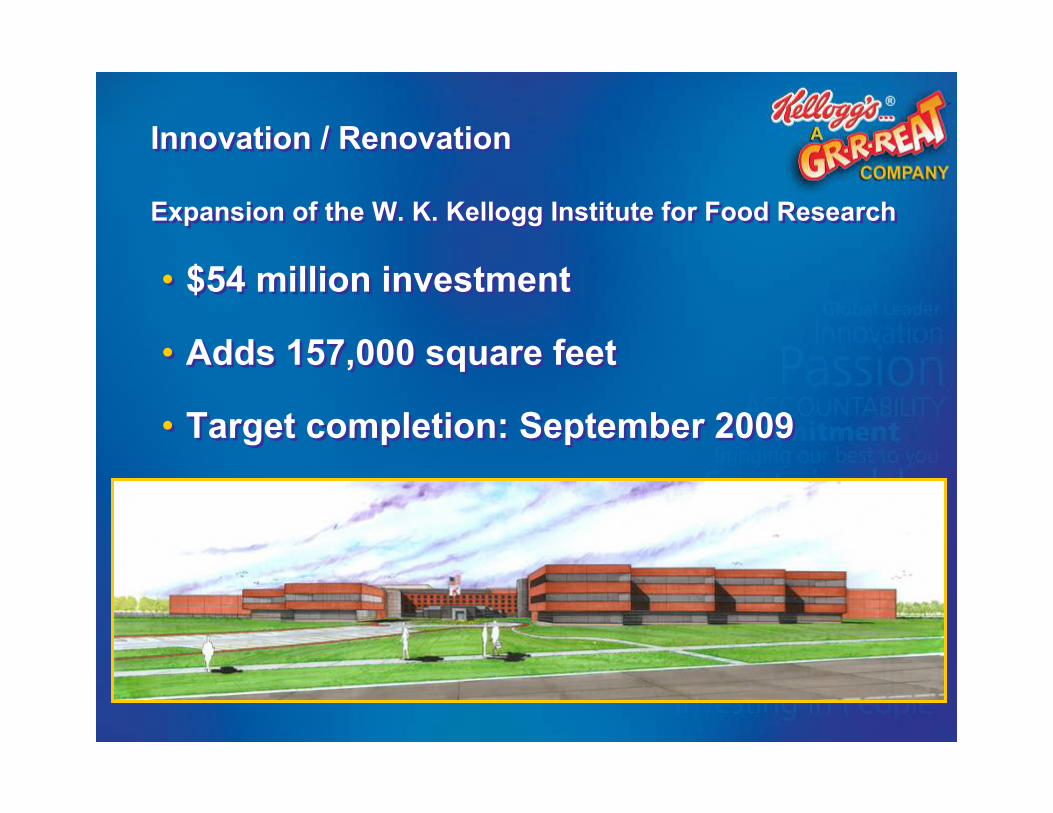
Innovation / Renovation Innovation / Renovation
• $54 million investment
• Adds 157,000 square feet
• Target completion: September 2009
• $54 million investment
• Adds 157,000 square feet
• Target completion: September 2009
Expansion of the W. K. Kellogg Institute for Food ResearchExpansion of the W. K. Kellogg Institute for Food Research
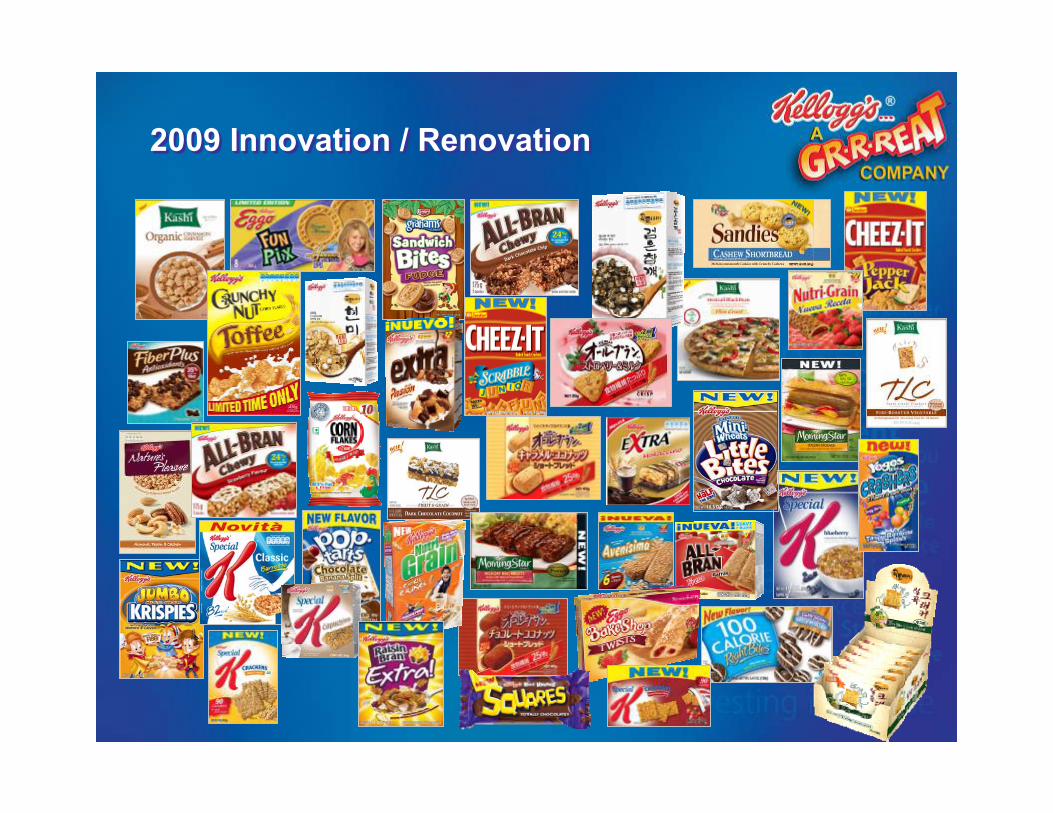
2009 Innovation / Renovation2009 Innovation / Renovation
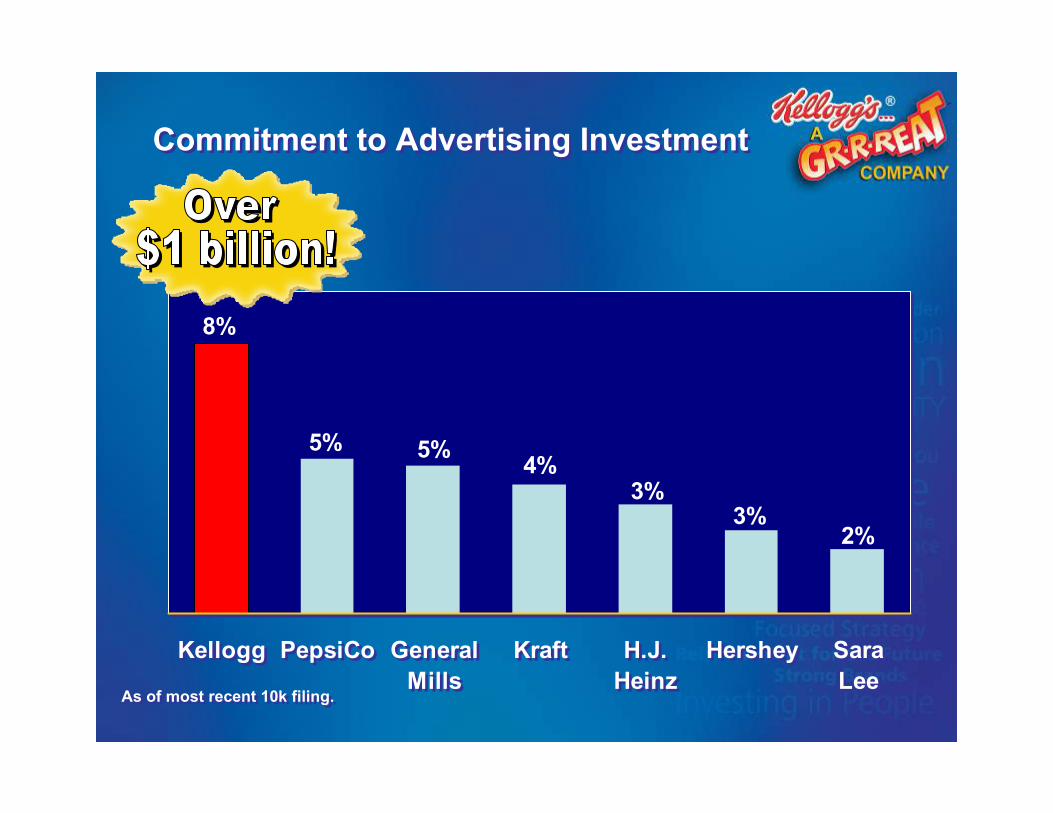
2%3%
3%4%5%5%
8%
Kellogg PepsiCo GeneralMills
Kraft H.J.Heinz
Hershey SaraLee
2%3%
3%4%5%5%
8%
Kellogg PepsiCo GeneralMills
Kraft H.J.Heinz
Hershey SaraLee
Commitment to Advertising InvestmentCommitment to Advertising Investment
As of most recent 10k filing.As of most recent 10k filing.
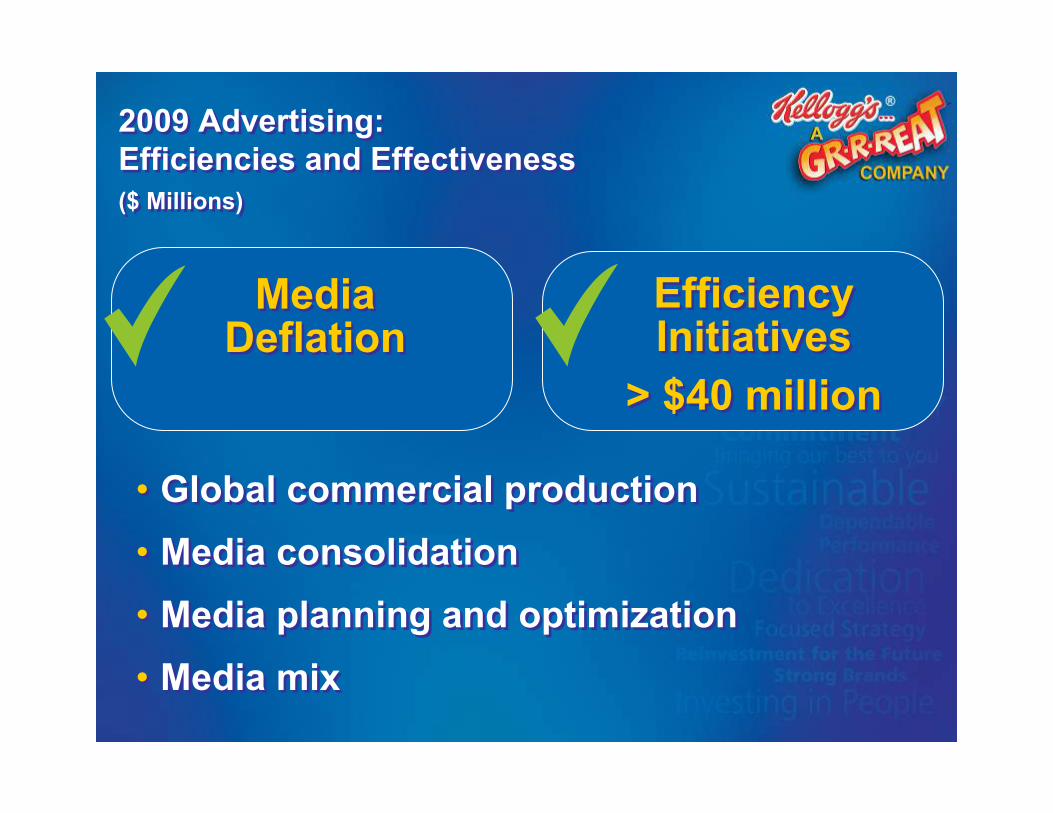
2009 Advertising: Efficiencies and Effectiveness2009 Advertising: Efficiencies and Effectiveness($ Millions)($ Millions)
Media Deflation
Media Deflation
Efficiency Initiatives
> $40 million
Efficiency Initiatives
> $40 million
• Global commercial production• Media consolidation• Media planning and optimization• Media mix
• Global commercial production• Media consolidation• Media planning and optimization• Media mix
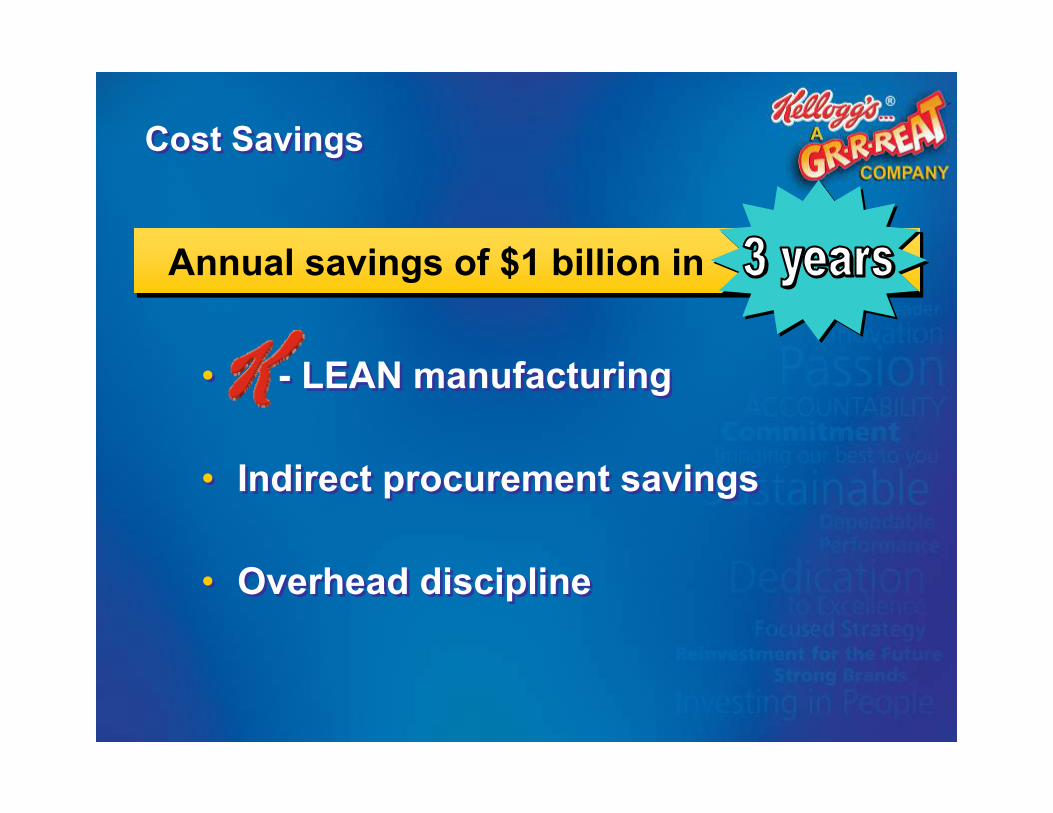
Cost SavingsCost Savings
• - LEAN manufacturing
• Indirect procurement savings
• Overhead discipline
• - LEAN manufacturing
• Indirect procurement savings
• Overhead discipline
Annual savings of $1 billion in
Confidence and visibility for another year of sustainable,
dependable growth
Confidence and visibility for another year of sustainable,
dependable growth
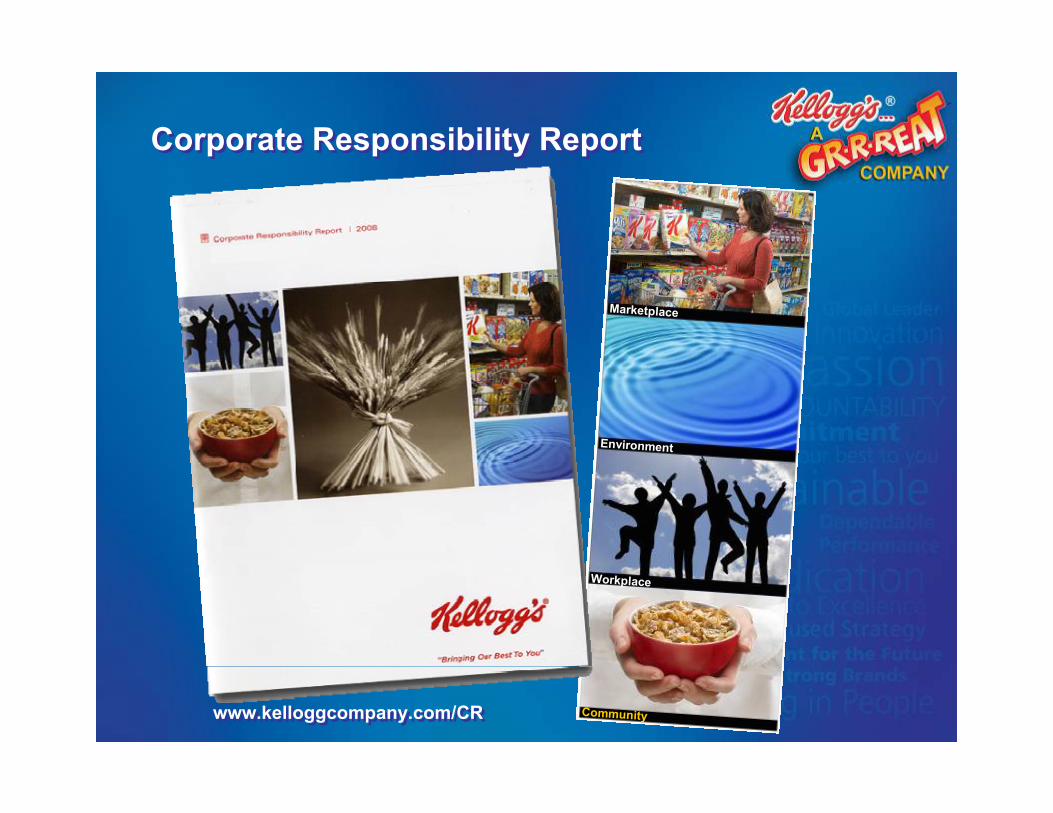
Corporate Responsibility ReportCorporate Responsibility Report
www.kelloggcompany.com/CRwww.kelloggcompany.com/CR
Workplace
Marketplace
Environment
Community
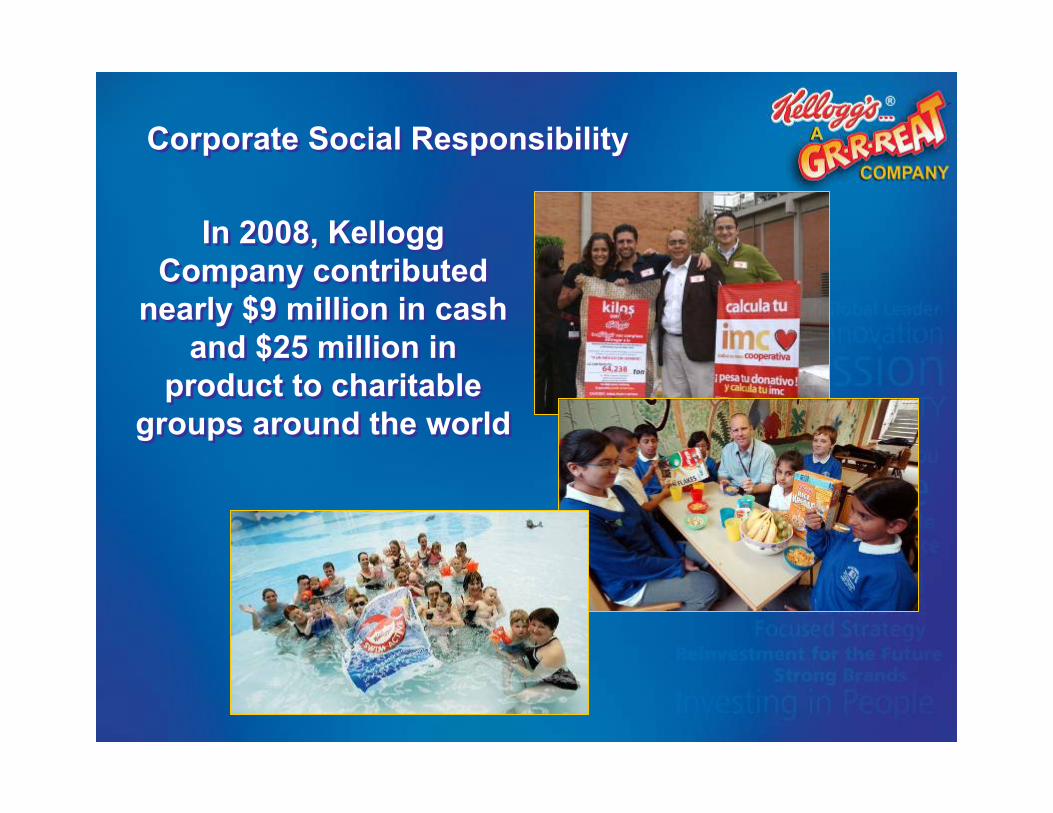
In 2008, Kellogg Company contributed
nearly $9 million in cash and $25 million in
product to charitable groups around the world
In 2008, Kellogg Company contributed
nearly $9 million in cash and $25 million in
product to charitable groups around the world
Corporate Social ResponsibilityCorporate Social Responsibility
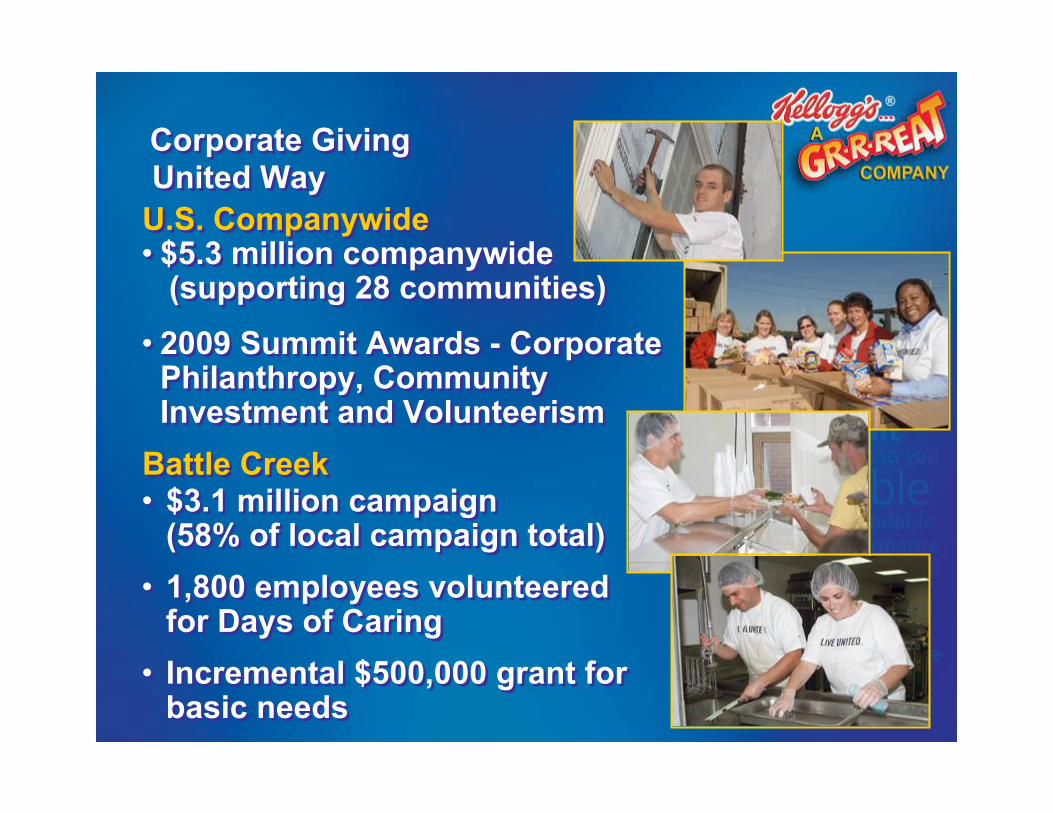
Corporate GivingCorporate GivingUnited WayUnited Way
• $3.1 million campaign (58% of local campaign total)
• 1,800 employees volunteered for Days of Caring
• Incremental $500,000 grant for basic needs
• $3.1 million campaign (58% of local campaign total)
• 1,800 employees volunteered for Days of Caring
• Incremental $500,000 grant for basic needs
Battle CreekBattle Creek
U.S. CompanywideU.S. Companywide• $5.3 million companywide
(supporting 28 communities)
• 2009 Summit Awards - Corporate Philanthropy, CommunityInvestment and Volunteerism
• $5.3 million companywide (supporting 28 communities)
• 2009 Summit Awards - Corporate Philanthropy, CommunityInvestment and Volunteerism
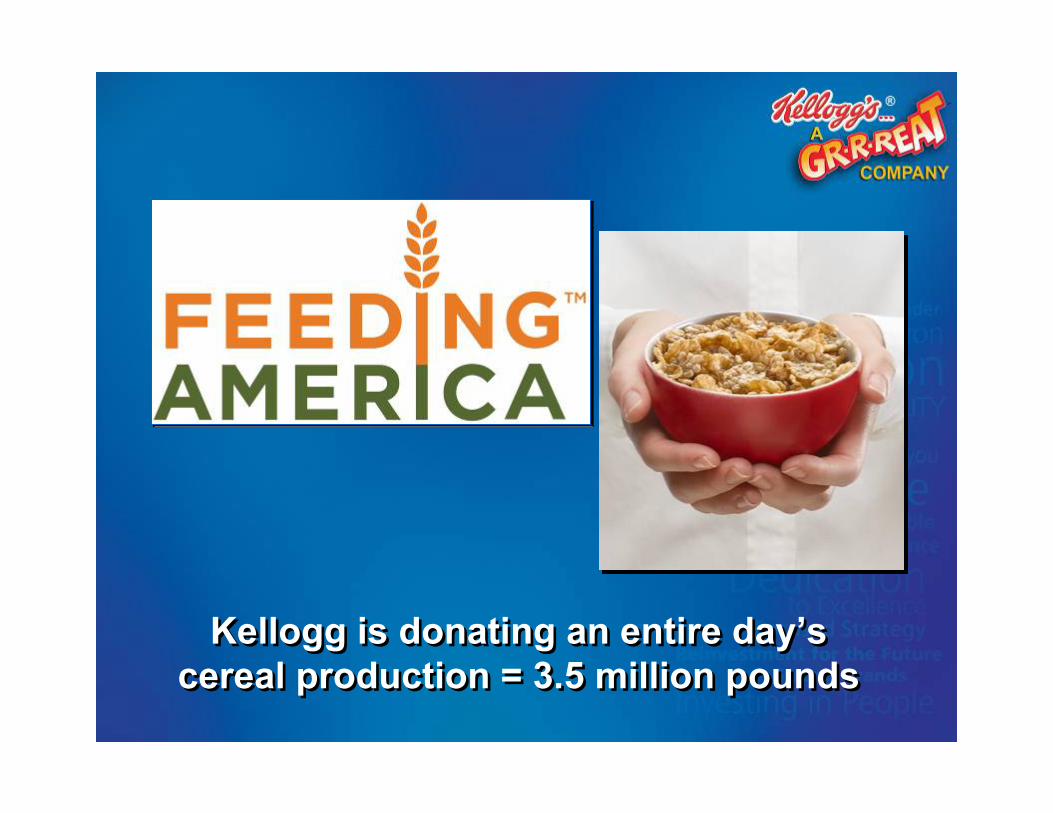
Kellogg is donating an entire day’s cereal production = 3.5 million pounds
Kellogg is donating an entire day’s cereal production = 3.5 million pounds
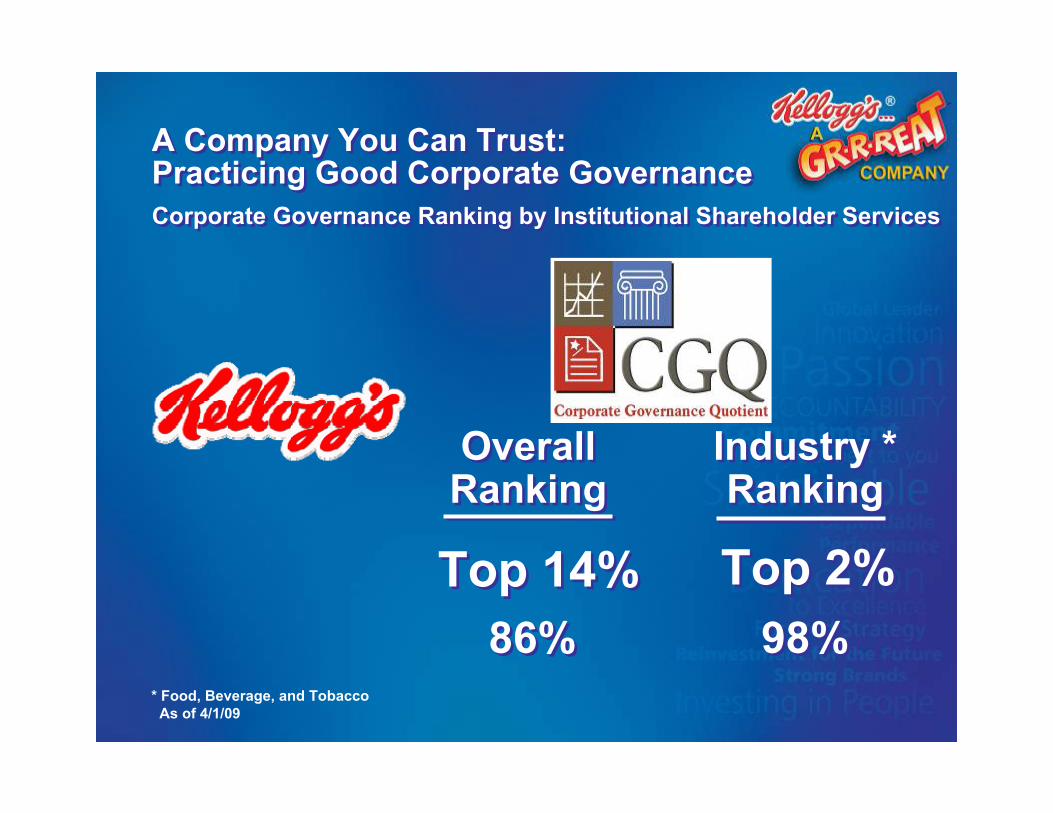
OverallRankingOverall
RankingIndustry *Ranking
Industry *Ranking
Top 14%Top 14%
A Company You Can Trust:Practicing Good Corporate GovernanceA Company You Can Trust:Practicing Good Corporate GovernanceCorporate Governance Ranking by Institutional Shareholder ServicesCorporate Governance Ranking by Institutional Shareholder Services
Top 2%Top 2%86%86% 98%98%
* Food, Beverage, and TobaccoAs of 4/1/09
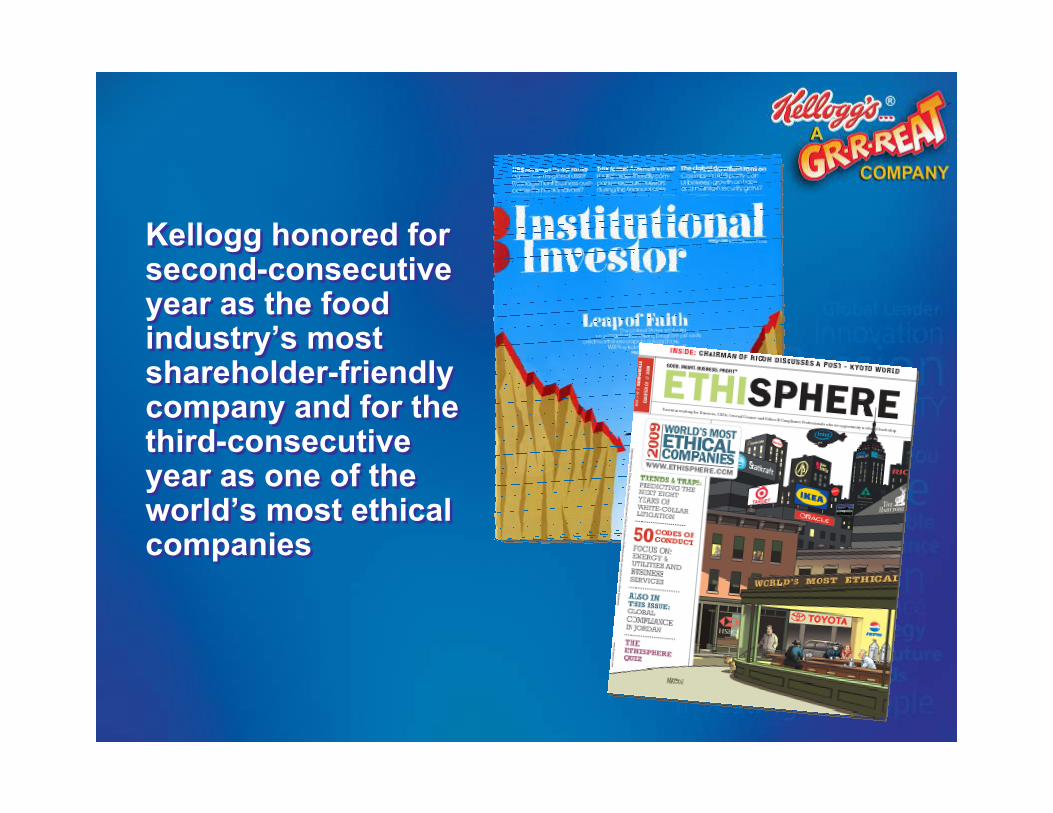
Kellogg honored for second-consecutive year as the food industry’s most shareholder-friendly company and for the third-consecutive year as one of the world’s most ethical companies
Kellogg honored for second-consecutive year as the food industry’s most shareholder-friendly company and for the third-consecutive year as one of the world’s most ethical companies