deploy for growth -...
TRANSCRIPT

Kellogg Company February 21, 2018
1 of 24
Deploy For Growth
Boca RatonFebruary 21, 2018
CAGNY 2018 I DEPLOY FOR GROWTH
Forward-Looking Statements
This presentation contains, or incorporates by reference, “forward-looking statements” with projections concerning, among other things, the Company’s global growth and efficiency program (Project K), the integration of acquired businesses, the Company’s strategy, zero-based budgeting, and the Company’s sales, earnings, margin, operating profit, costs and expenditures, interest expense, tax rate, capital expenditure, dividends, cash flow, debt reduction, share repurchases, costs, charges, rates of return, brand building, ROIC, working capital, growth, new products, innovation, cost reduction projects, workforce reductions, savings, and competitive pressures. Forward-looking statements include predictions of future results or activities and may contain the words “expects,” “believes,” “should,” “will,” “anticipates,” “projects,” “estimates,” “implies,” “can,” or words or phrases of similar meaning.
The Company’s actual results or activities may differ materially from these predictions. The Company’s future results could also be affected by a variety of factors, including the ability to implement Project K (including the exit from its Direct Story Delivery system) as planned, whether the expected amount of costs associated with Project K will differ from forecasts, whether the Company will be able to realize the anticipated benefits from Project K in the amounts and times expected, the ability to realize the benefits from our implementation of a more formal Revenue Growth Management discipline, the ability to realize the anticipated benefits and synergies from the acquisitions in the amounts and at the times expected, the impact of competitive conditions; the effectiveness of pricing, advertising, and promotional programs; the success of innovation, renovation and new product introductions; the recoverability of the carrying value of goodwill and other intangibles; the success of productivity improvements and business transitions; commodity and energy prices; labor costs; disruptions or inefficiencies in supply chain; the availability of and interest rates on short-term and long-term financing; actual market performance of benefit plan trust investments; the levels of spending on systems initiatives, properties, business opportunities, integration of acquired businesses, and other general and administrative costs; changes in consumer behavior and preferences; the effect of U.S. and foreign economic conditions on items such as interest rates, statutory tax rates, currency conversion and availability; legal and regulatory factors including changes in food safety, advertising and labeling laws and regulations; the ultimate impact of product recalls; business disruption or other losses from war, terrorist acts or political unrest; and other items.
Forward-looking statements speak only as of the date they were made, and the Company undertakes no obligation to update them publicly.
This presentation includes non‐GAAP financial measures. Please refer to the Appendices for a reconciliation of these non‐GAAP financial measures to the most directly comparable GAAP financial measures. Management believes that the use of such non-GAAP measures assists investors in understanding the underlying operating performance of the company and its segments.
2

Kellogg Company February 21, 2018
2 of 24
Reasons to Believe
Special Food, Brands,
& Culture
Sound Financial Footing
Commitment and Ideas for Growth
• Health & Wellness heritage
• In most households
• Taste, convenience, nutrition, affordability
• Weighted toward snacking
• Will to win
• Reduced cost structure
• Improving top-line performance
• Durable cash flow
• Better commercial plans
• Increased investment
• New growth platforms
CAGNY 2018 I DEPLOY FOR GROWTH 3
Agenda
• Foundation for Growth
• Current Trajectory for Growth
• Deploy for More Growth
• A Realistic Algorithm for Growth
CAGNY 2018 I DEPLOY FOR GROWTH 4

Kellogg Company February 21, 2018
3 of 24
Big, Strong, Relevant Brands2017 Net Sales, $ in Billions, Global >$1 billion
$0.5-1.0 billion
$0.3-0.5 billion
CAGNY 2018 I DEPLOY FOR GROWTH 5
A Health & Wellness Company
CAGNY 2018 I DEPLOY FOR GROWTH 6

Kellogg Company February 21, 2018
4 of 24
A Snacking CompanyComposition of Net Sales, Total Company
CAGNY 2018 I DEPLOY FOR GROWTH 7
A Global CompanyComposition of Kilos, Total Company
CAGNY 2018 I DEPLOY FOR GROWTH 8* Shaded area represents percentage of volume associated with Joint Ventures, if we were to include our share of their kilos.

Kellogg Company February 21, 2018
5 of 24
Increasing Emerging Markets Scale & PortfolioKellogg Emerging Markets, Volume in Kilos
6.8%CAGR
2013-2017x-JVs
Joint Ventures
CAGNY 2018 I DEPLOY FOR GROWTH
Snacks:19% of Volume
Snacks:43% of Volume
x-JVs
9
Agenda
• Foundation for Growth
• Current Trajectory for Growth
• Deploy for Growth
• A Realistic Algorithm for Growth
CAGNY 2018 I DEPLOY FOR GROWTH 10

Kellogg Company February 21, 2018
6 of 24
Assessing Growth – Portfolio Segments
Developed Markets –
Snacks
Developed Markets –
Cereal
Emerging Markets
Developed Markets – Frozen
Stabilizing
Returning to growth
Already growing
Growing, larger scale
CAGNY 2018 I DEPLOY FOR GROWTH 11
* Excludes joint ventures
*
Net Sales, 2017
Developed Markets Cereal
• Stabilized Canada, U.K., Australia
• Stabilizing Special K• Expanding granola
• Expanding occasions• Influencing food beliefs• New pack formats• Executing playbook• Channels expansion
Recent Past Current Progress Path Forward
• Consumers to protein • Special K decline
CAGNY 2018 I DEPLOY FOR GROWTH 12

Kellogg Company February 21, 2018
7 of 24
Developed Markets Snacks
• Pringles global growth• Transition from DSD• Rationalizing tail SKUs
• Increased Brand Building • New pack formats• RXBAR growth platform
Recent Past Current Progress Path Forward
• Special K decline• DSD declining ROI
CAGNY 2018 I DEPLOY FOR GROWTH 13
Developed Markets Frozen
Recent Past Current Progress Path Forward
• Portfolio trimmed for focus
• Strong growth • Innovation/renovation
• On-trend categories• Focus on core
CAGNY 2018 I DEPLOY FOR GROWTH 14

Kellogg Company February 21, 2018
8 of 24
Emerging Markets
Recent Past Current Progress Path Forward
* Excludes joint ventures
• Lacked scale• Limited portfolio• Challenging macro
environment
• Organic growth• Pringles expansion• Brazil & Egypt acquisitions• Joint Ventures growth
• Pringles expansion• Granola & wholesome snacks• New pack formats• M&A
*
CAGNY 2018 I DEPLOY FOR GROWTH 15
Path to Low Single-Digit Sales Growth
Current Trajectory ~+1%
“DeployFor
Growth”+1-3%
CAGNY 2018 I DEPLOY FOR GROWTH
Net Sales Growth, Currency-Neutral
16
Stable+MSD
+LSD
+LSD

Kellogg Company February 21, 2018
9 of 24
Agenda
• Foundation for Growth
• Current Trajectory for Growth
• Deploy for More Growth
• A Realistic Algorithm for Growth
CAGNY 2018 I DEPLOY FOR GROWTH 17
Deploy For Growth
CAGNY 2018 I DEPLOY FOR GROWTH 18

Kellogg Company February 21, 2018
10 of 24
Getting the Food Right
• Removing “negatives”
• Adding “positives”
• Taste is still king
CAGNY 2018 I DEPLOY FOR GROWTH 19
Win Through Occasions
Getting the Packaging Right
7.2%
12.4%
Single-Serve, Share of Category, Across All Kellogg U.S. Categories
Source: Nielsen AOD – xAOC + Convenience – Calendar Years
2016 20162017 2017
CAGNY 2018 I DEPLOY FOR GROWTH 20
Win Through Occasions

Kellogg Company February 21, 2018
11 of 24
Building a Stronger Innovation Pipeline
CAGNY 2018 I DEPLOY FOR GROWTH 21
Win Through Occasions
Investing Where the Growth Is
CAGNY 2018 I DEPLOY FOR GROWTH
Global Expansion 20+ Years of Growth
Accelerated Growth in ‘17
+DD Consumption
Growthin ‘17
+DD Consumption Growth in ‘17 +DD Consumption
Growth in ‘17 22
Shape a Growth Portfolio
Kellogg Company February 21, 2018
12 of 24
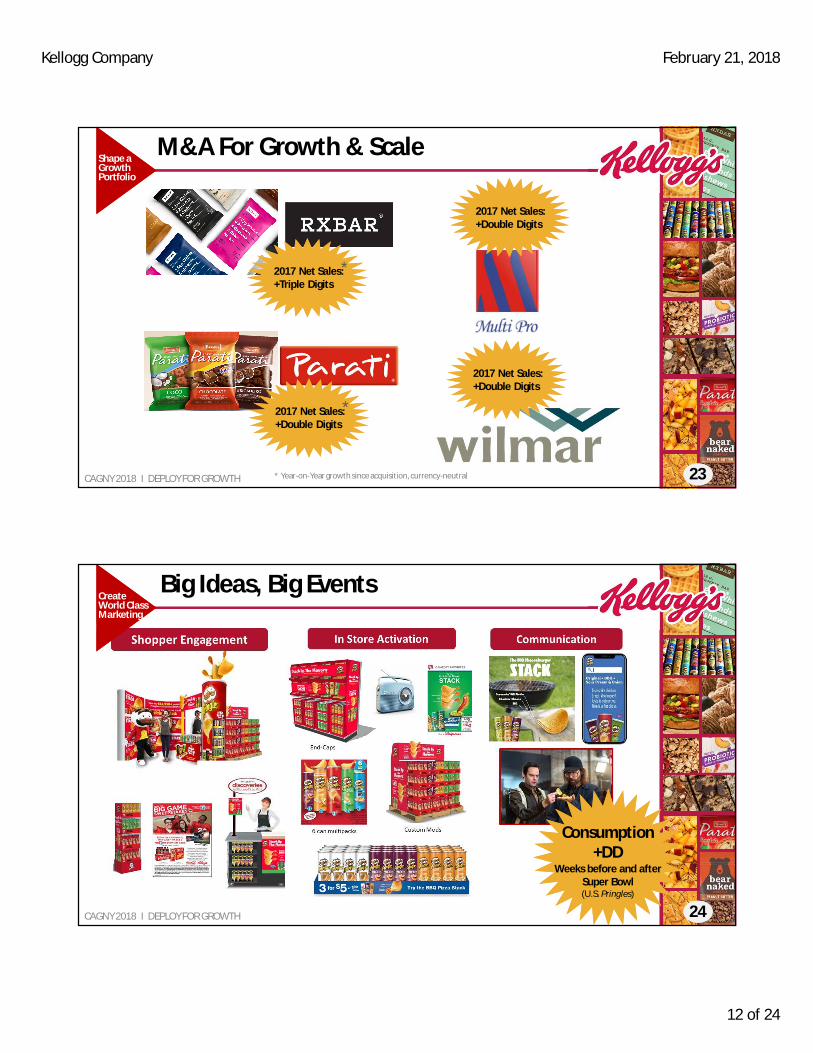
M&A For Growth & Scale
2017 Net Sales:+Triple Digits
2017 Net Sales:+Double Digits
2017 Net Sales:+Double Digits
2017 Net Sales:+Double Digits
CAGNY 2018 I DEPLOY FOR GROWTH 23
Shape a Growth Portfolio
*
*
* Year-on-Year growth since acquisition, currency-neutral
Big Ideas, Big Events
CAGNY 2018 I DEPLOY FOR GROWTH 24
Create World Class Marketing
Consumption +DD
Weeks before and after Super Bowl(U.S. Pringles)

Kellogg Company February 21, 2018
13 of 24
Customized Messaging
CAGNY 2018 I DEPLOY FOR GROWTH 25
Consumption +10%
Latest 13 weeks(U.S. Rice Krispies Treats)
Create World Class Marketing
When you watch avideo about how to cook aturkeyWhen you watch videosabout the latest new
techgadgets
When you watch avideo about kid friendlycrafts When you watch a video about kid friendlymeals
Brand Experience & Conversation
CAGNY 2018 I DEPLOY FOR GROWTH 26
Consumption +12%
in 2017(U.K. Corn Flakes)
Create World Class Marketing

Kellogg Company February 21, 2018
14 of 24
Cultural Relevance
CAGNY 2018 I DEPLOY FOR GROWTH 27
Create World Class Marketing
• October 2017: Most-ever Eggosocial mentions in a single month
• Q4 2017: Eggoconsumption +14% year-on-year
Aiming for Perfect Service
CAGNY 2018 I DEPLOY FOR GROWTH 28
Deliver Perfect Service & Store

Kellogg Company February 21, 2018
15 of 24
Aisle Reinvention
CAGNY 2018 I DEPLOY FOR GROWTH
In Test;Strong Lift
29
Deliver Perfect Service & Store
Early in Roll-Out;
Strong Lift
In-Store Theater
CAGNY 2018 I DEPLOY FOR GROWTH 30
SpainAustralia
Deliver Perfect Service & Store

Kellogg Company February 21, 2018
16 of 24
E-Commerce
CAGNY 2018 I DEPLOY FOR GROWTH 31
Deliver Perfect Service & Store
E-CommerceSales
approx. +40%in 2017
Talent, Tools, Technology
• Differentiating performance and rewards
• Realigning compensation to drive growth behaviors
• Focusing on leadership and commercial capabilities
• Leveraging new technologies
CAGNY 2018 I DEPLOY FOR GROWTH 32
People Must Be Competitive Advantage

Kellogg Company February 21, 2018
17 of 24
Change Is Already Visible – Including in Q4 ‘17!
• Targeted areas of growth
• Increased Brand Building
• More differentiated Innovation
• Faster expansion in Emerging Markets
• M&A for scale or white-spaceNew cereal plant in Nigeria
CAGNY 2018 I DEPLOY FOR GROWTH 33
Agenda
• Foundation for Growth
• Current Trajectory for Growth
• Deploy for More Growth
• A Realistic Algorithm for Growth
CAGNY 2018 I DEPLOY FOR GROWTH 34

Kellogg Company February 21, 2018
18 of 24
Financial Approach – Balance
Financial Delivery: Capital Allocation:
Dividend
Bolt-On Acquisitions
Share Repurchases
Investment-Grade Debt
CAGNY 2018 I DEPLOY FOR GROWTH 35
Sound Financial FootingAdjusted EPS Growth, Currency-Neutral Basis; Cash Flow in Billions
• Reduced cost structure• Stabilized price/mix• Restructuring-related cash outlays• Pringles capacity expansion
• Reduced cost structure• Stabilized price/mix• Restructuring-related cash outlays• Pringles capacity expansion
* Please refer to appendices for reconciliation of non-GAAP measures to the most directly comparable GAAP measure.** Cash Flow defined as cash from operating activities, less capital expenditure. Please refer to appendices for reconciliation of non-GAAP measures to the most directly comparable GAAP measure.
CAGNY 2018 I DEPLOY FOR GROWTH 36
2016 2017 2018
Adjusted EPS +23% +9% +9-11%
Cash FlowRestructuring Outlays:
$1.1 $1.1 $1.2-1.3
Guidance
$0.1 $0.2 $0.2
*
**
Cash Flow x-Restructuring Outlays: $1.2 $1.4 $1.4-1.5
Kellogg Company February 21, 2018
19 of 24
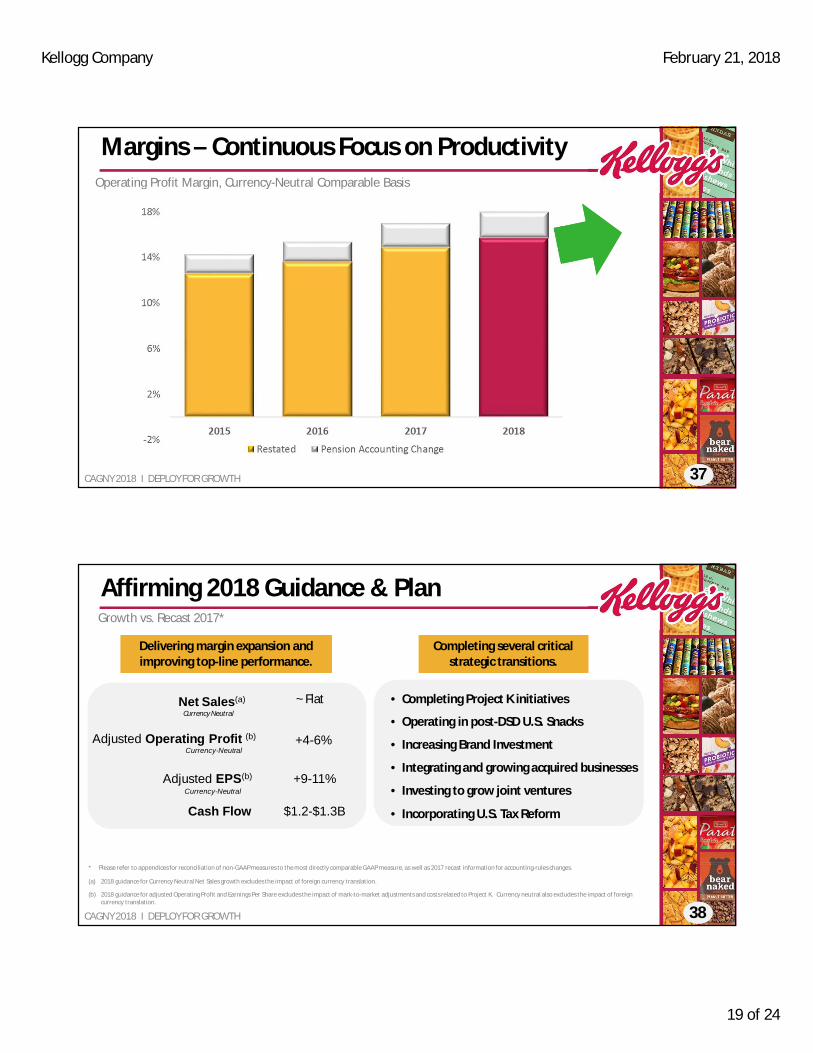
Margins – Continuous Focus on ProductivityOperating Profit Margin, Currency-Neutral Comparable Basis
CAGNY 2018 I DEPLOY FOR GROWTH 37
Affirming 2018 Guidance & Plan
• Completing Project K initiatives
• Operating in post-DSD U.S. Snacks
• Increasing Brand Investment
• Integrating and growing acquired businesses
• Investing to grow joint ventures
• Incorporating U.S. Tax Reform
Adjusted EPS(b)
Currency-Neutral
Adjusted Operating Profit (b)Currency-Neutral
+4-6%
+9-11%
Cash Flow $1.2-$1.3B
Net Sales(a)
Currency Neutral
~ Flat
Growth vs. Recast 2017*
(a) 2018 guidance for Currency Neutral Net Sales growth excludes the impact of foreign currency translation.
(b) 2018 guidance for adjusted Operating Profit and Earnings Per Share excludes the impact of mark-to-market adjustments and costs related to Project K. Currency neutral also excludes the impact of foreign currency translation.
* Please refer to appendices for reconciliation of non-GAAP measures to the most directly comparable GAAP measure, as well as 2017 recast information for accounting-rules changes.
Delivering margin expansion and improving top-line performance.Delivering margin expansion and improving top-line performance.
Completing several critical strategic transitions.
Completing several critical strategic transitions.
CAGNY 2018 I DEPLOY FOR GROWTH 38

Kellogg Company February 21, 2018
20 of 24
Targeting Long-Term Sustainable Growth
Net Sales
Adjusted Operating Profit
Adjusted EPS
1-3%
4-6%
6-8%
Dependable growth, augmented by M&A, complemented by dividend yield.Dependable growth, augmented by M&A, complemented by dividend yield.
CAGNY 2018 I DEPLOY FOR GROWTH
Dividend Yield 2-3%
Total Shareowner Return 8-11%
*
*
* Independent of changes in valuation multiple and market fluctuations 39
All Growth Rates are Currency-Neutral
Values
CAGNY 2018 I DEPLOY FOR GROWTH 40

Kellogg Company February 21, 2018
21 of 24
In Summary…
• Strong foundation for growth
• Visible progress
• Deploying for growth
• Seeking balanced financial delivery
CAGNY 2018 I DEPLOY FOR GROWTH 41
APPENDIX
CAGNY 2018 I DEPLOY FOR GROWTH

Kellogg Company February 21, 2018
22 of 24
EPS – Reconciliation to non-GAAP Measure
Note: These figures are not yet recast for the accounting-standards changes effective in 2018.
2017 2016Growth
Rate 2016 2015Growth
RateReported EPS 3.62$ 1.96$ 1.96$ 1.72$
Mark-to-market (pre-tax) 0.13 (0.74) (0.74) (1.25) Project K and cost reduction activities (pre-tax) (0.75) (0.92) (0.92) (0.91) Debt redemption (pre-tax) - (0.43) (0.43) - VIE deconsolidation (pre-tax) - - - 0.13 Venezuela deconsolidation (pre-tax) - (0.20) (0.20) - Venezuela remeasurement (pre-tax) - (0.03) (0.03) (0.47) Income tax impact applicable to adjustments, net 0.22 0.56 0.56 0.74 U.S. Tax Reform adoption impact (0.01) - - - Foreign currency impact (0.01) - (0.57) -
Currency-neutral Adjusted EPS 4.04$ 3.72$ 8.6% 4.29$ 3.48$ 23.3%
43
Cash Flow – Reconciliation to non-GAAP MeasureKellogg Company and Subsidiaries
Years ended 2015-2017 Exhibit 2
2015 2016 2017Operating ActivitiesNet Income 614$ 695$ 1,269$ Adjustments to reconcile net income to operating cash flows:
Depreciation and amortization 534 517 481 Postretirement benefit plan expense 320 198 (427) Deferred income taxes (169) (26) (56) Stock compensation 51 63 66 Venezuela deconsolidation 72 Venezuela remeasurement 169 11 VIE deconsolidation (49) Non current income taxes payable (21) (12) 144 Other 8 (62) 27
Postretirement benefit plan contributions (33) (33) (44) Changes in operating assets and liabilities, net of acquisitions 267 205 186 Net cash provided by (used in) operating activities 1,691 1,628 1,646 Less:Additions to properties (553) (507) (501) Cash flow (operating cash flow less property additions) (a) 1,138$ 1,121$ 1,145$
(a) Cash flow is defined as net cash provided by operating activities less capital expenditures. We use this non-GAAP financial measure to focus management and investors on the amount of cash available for debt repayment, dividend distributions, acquisition opportunities and share repurchase.
Reconciliation of Non-GAAP amounts - Reported Cash Flow to Kellogg-Defined Cash Flow
44

Kellogg Company February 21, 2018
23 of 24
Financial Guidance – Reconciliation to non-GAAP Measures
45
Kellogg Company and SubsidiariesReconciliation of Non-GAAP amounts - 2018 Full Year Guidance*
Exhibit 3
Impact of certain items excluded from non-GAAP guidance: Net SalesOperating
ProfitEffective Tax Rate
Earnings Per Share
Project K and cost restructuring activities $90-110M $0.27-0.32Income Tax benefit applicable to adjustments, net** $0.05-0.06Adjusted, currency-neutral guidance Flat 4-6% 20-21% 9-11%
Reconciliation of Non-GAAP amounts - Cash Flow Guidance(billions)
ApproximateFull Year 2018
Net cash provided by (used in) operating activities $1.7 - $1.8Additions to properties ~($.5)Cash Flow $1.2 - $1.3
* 2018 full year guidance for net sales, operating profit, and earnings per share are provided on a non-GAAP basis only because certain information necessary to calculate such measures on a GAAP basis is unavailable, dependent on future events outside of our control and cannot be predicted without unreasonable efforts by the Company. The Company is providing quantification of known adjustment items where available.
** Represents the estimated income tax effect on the reconciling items, using weighted-average statutory tax rates, depending upon the applicable jurisdiction.
2017 Recast Items – Accounting Standard Change
Reported Basis
Comparable Basis
46

Kellogg Company February 21, 2018
24 of 24
2017 Recast Items – Product Transfers
47