mondelez cagny 2015
TRANSCRIPT
Mondelēz International CAGNY Conference
February 17, 2015

Irene Rosenfeld Chairman and CEO

3
This presentation contains a number of forward-looking statements. Words, and variations of words, such as “will,” “expect,”
“would,” “plan,” “likely,” “estimate,” “believe,” “hope,” “anticipate,” “look to,” “drive,” “positioned,” “target,” “commitment,” “objective,”
“outlook” and similar expressions are intended to identify our forward-looking statements, including, but not limited to, statements
about: our future performance, including our future revenue growth, operating income growth, earnings per share, margins,
interest expense, taxes and cash flow; category growth; growth in emerging markets; focusing our portfolio; consumer demand
and consumption; cost-reduction actions; productivity and productivity savings and improvement; supply chain and overhead
costs; our transformation agenda; innovation; our investments and the results of those investments; our operating model; currency
and the effect of foreign exchange translation on our results of operations; the costs of, cost savings generated by, timing of
expenditures under and completion of our restructuring program; the cash proceeds and ownership interest to be received in and
timeframe for completing the coffee transactions; acquisitions; achievement of our strategic objectives; capital expenditures;
share repurchases; dividends; shareholder value and returns to shareholders; and our Outlook, including 2015 Organic Net
Revenue growth, Adjusted Operating Income margin, Adjusted EPS and Free Cash Flow. These forward-looking statements are
subject to a number of risks and uncertainties, many of which are beyond our control, which could cause our actual results to
differ materially from those indicated in our forward-looking statements. Such factors include, but are not limited to, risks from
operating globally and in emerging markets, changes in currency exchange rates, continued volatility of commodity and other
input costs, pricing actions, weakness in economic conditions, weakness in consumer spending, unanticipated disruptions to our
business, competition, the restructuring program and our other transformation initiatives not yielding the anticipated benefits,
changes in the assumptions on which the restructuring program is based, failing to successfully complete the coffee transactions
or other acquisitions on the anticipated time frames and tax law changes. Please also see our risk factors, as they may be
amended from time to time, set forth in our filings with the SEC, including our most recently filed Annual Report on Form 10-K.
Mondelēz International disclaims and does not undertake any obligation to update or revise any forward-looking statement in this
presentation, except as required by applicable law or regulation.
.
Forward-looking statements

Well-positioned to deliver strong shareholder returns
● Leveraging our unique assets
● Delivering on cost-reduction initiatives
● Generating strong cash flow
4
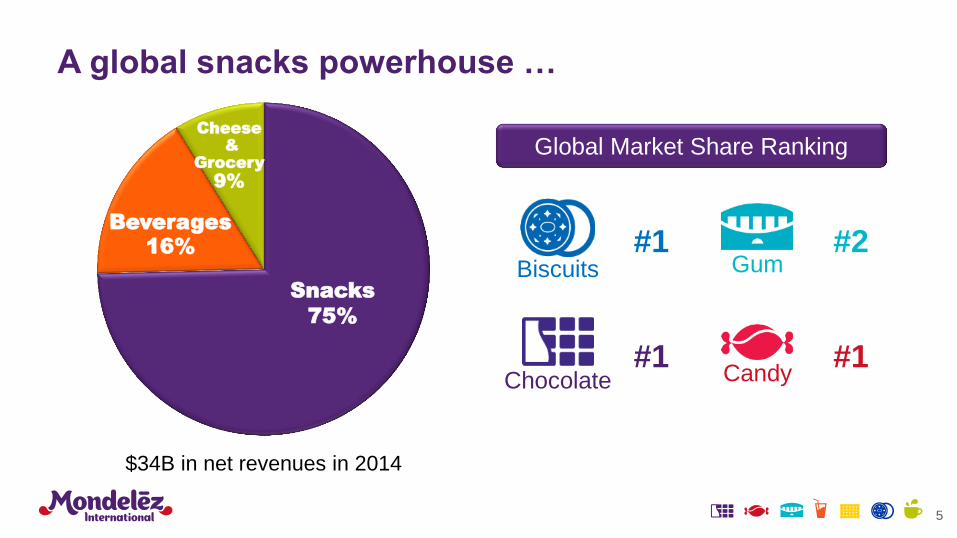
A global snacks powerhouse …
5
Snacks
75%
Beverages
16%
$34B in net revenues in 2014
Cheese
&
Grocery
9%
Biscuits #1
Chocolate #1
Gum #2
Candy #1
Global Market Share Ranking
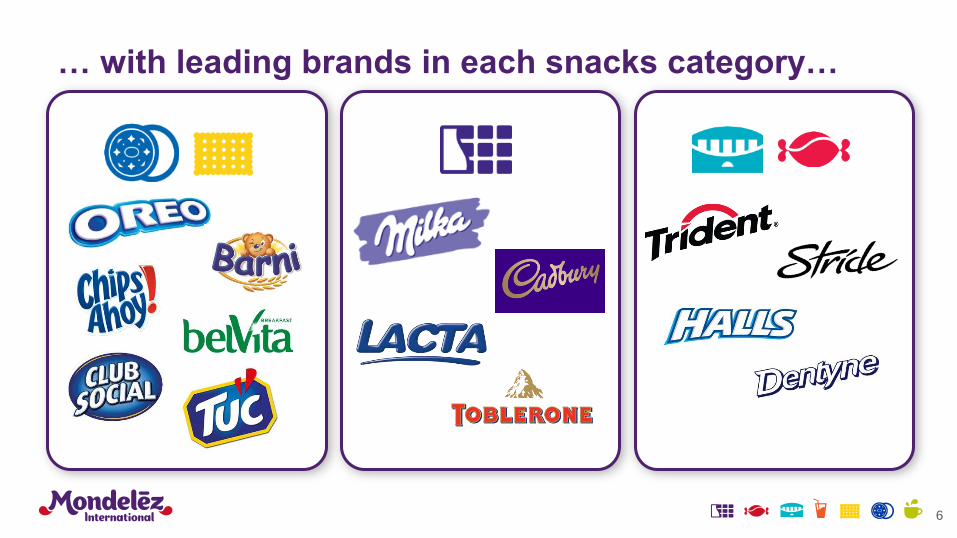
… with leading brands in each snacks category…
6

… and an advantaged global footprint
7
● Emerging markets Organic Net Revenue +7% in 2014
● Significant white space opportunities
Emerging
Markets
38%
Developed
Markets
62%
$34B in net revenues in 2014
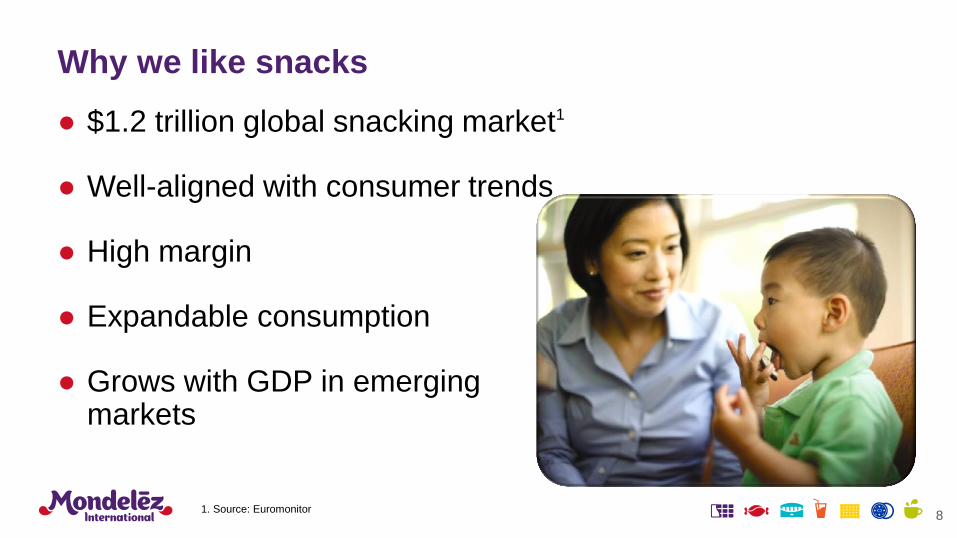
Why we like snacks
● $1.2 trillion global snacking market1
● Well-aligned with consumer trends
● High margin
● Expandable consumption
● Grows with GDP in emerging markets
8 1. Source: Euromonitor
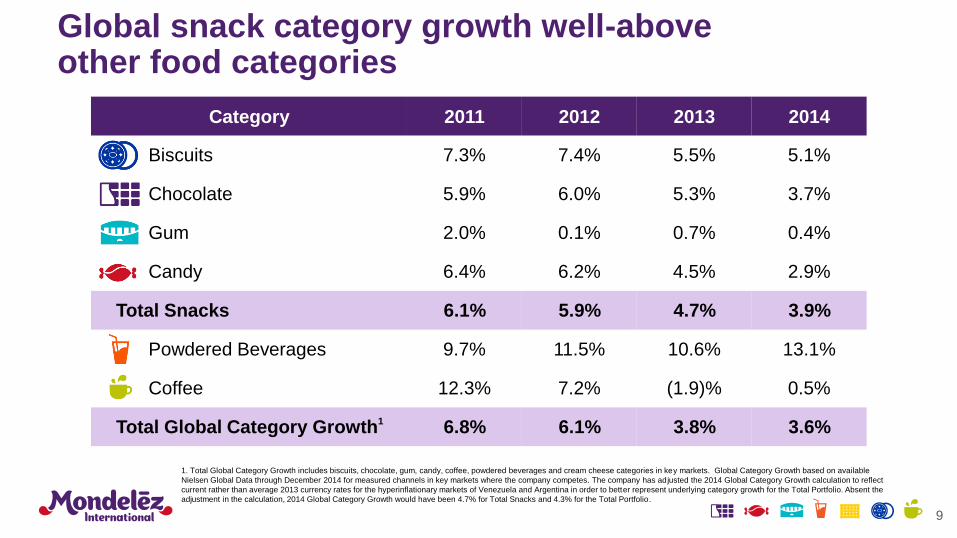
Global snack category growth well-above other food categories
Category 2011 2012 2013 2014
Biscuits 7.3% 7.4% 5.5% 5.1%
Chocolate 5.9% 6.0% 5.3% 3.7%
Gum 2.0% 0.1% 0.7% 0.4%
Candy 6.4% 6.2% 4.5% 2.9%
Total Snacks 6.1% 5.9% 4.7% 3.9%
Powdered Beverages 9.7% 11.5% 10.6% 13.1%
Coffee 12.3% 7.2% (1.9)% 0.5%
Total Global Category Growth1 6.8% 6.1% 3.8% 3.6%
9
1. Total Global Category Growth includes biscuits, chocolate, gum, candy, coffee, powdered beverages and cream cheese categories in key markets. Global Category Growth based on available
Nielsen Global Data through December 2014 for measured channels in key markets where the company competes. The company has adjusted the 2014 Global Category Growth calculation to reflect
current rather than average 2013 currency rates for the hyperinflationary markets of Venezuela and Argentina in order to better represent underlying category growth for the Total Portfolio. Absent the
adjustment in the calculation, 2014 Global Category Growth would have been 4.7% for Total Snacks and 4.3% for the Total Portfolio.

Long-term strategies and targets unchanged
Organic Net Revenue Growth:
At or Above Category Growth
Adjusted Operating Income
Growth: High Single Digit
Adjusted EPS Growth:
Double Digit
Long-Term Targets
10
● Focus portfolio on snacks
● Reduce supply chain and overhead costs
● Invest in advantaged brands, innovation platforms and routes to market
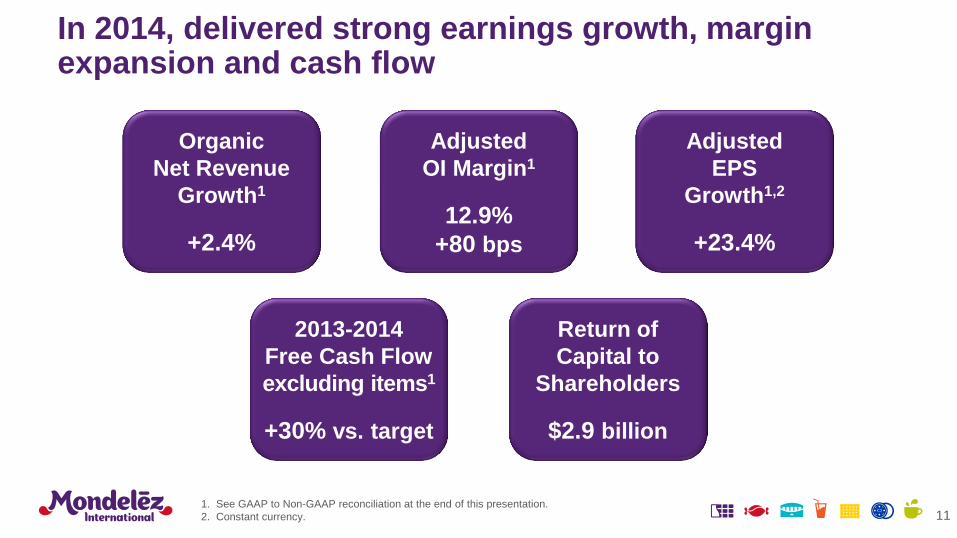
In 2014, delivered strong earnings growth, margin expansion and cash flow
11 1. See GAAP to Non-GAAP reconciliation at the end of this presentation.
2. Constant currency.
Organic
Net Revenue
Growth1
+2.4%
Adjusted
OI Margin1
12.9%
+80 bps
Adjusted
EPS
Growth1,2
+23.4%
2013-2014
Free Cash Flow
excluding items1
+30% vs. target
Return of
Capital to
Shareholders
$2.9 billion

Long-term strategy drives 2015 transformation agenda
focus
our
portfolio
● Complete coffee JV transactions
● Integrate bolt-on acquisitions
● Improve revenue mix
reduce
costs
● Deliver strong net productivity
● Move Power Brands to advantaged assets
● Drive down overheads via ZBB
invest
for
growth
● Invest in Power Brands, innovation platforms and RTM
● Leverage operating model to drive speed and scale
12

Creating the world’s leading pure-play coffee company
13
focus
our
portfolio
$3.4B in 2013 Net Revenue1
Jacobs Douwe Egberts
$3.8B in 2014 Net Revenue
~$7B Net Revenue
1. As provided by D.E Master Blenders 1753

84% of revenue from snacks after JV formed
● Optimizes capital allocation to core snacks
● JV structure enables MDLZ to participate in future coffee growth
● €4B expected cash proceeds
14
focus
our
portfolio
Reported ExcludingCoffee
Snacks
Beverages
Cheese &
Grocery
75%
16%
9%
84%
6%
10%
Based on 2014 Revenue

Kinh Do strengthens portfolio in Vietnam
● Advantaged Portfolio: Biscuits
and mooncakes leader
● Local Scale: ~$175MM in sales
● Growing Market: 90MM people,
50%+ under 30 years old
● Distribution Platform: Network
covers 130,000 outlets
15
focus
our
portfolio
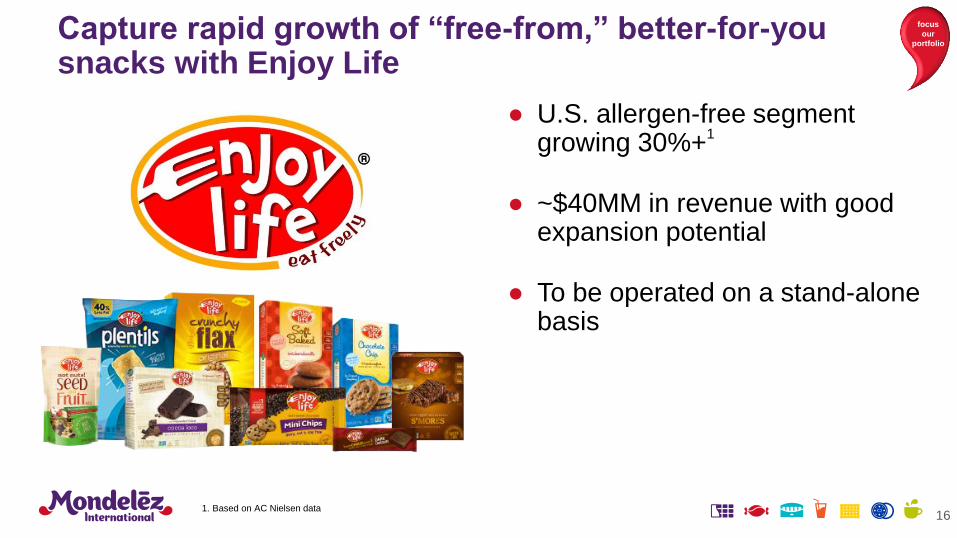
Capture rapid growth of “free-from,” better-for-you snacks with Enjoy Life
● U.S. allergen-free segment growing 30%+
1
● ~$40MM in revenue with good expansion potential
● To be operated on a stand-alone basis
16
focus
our
portfolio
1. Based on AC Nielsen data

Strategic decisions to improve revenue mix in 2015
17
focus
our
portfolio
~1 pp headwind to Organic Net Revenue growth in 2015
Discontinue low-margin, customer-
specific product lines
Exit low-margin
products from spin-off
Ongoing SKU
simplification

Power Brands and innovation platforms driving growth
18
● Grow ~2x company rate
● Carry significantly higher margins
● ~80% of A&C support
● Accounts for nearly all incremental A&C spending in 2015
Power
Brands
62%
Other
Brands
38%
Power Brands
$34B in net revenues in 2014
Invest for
Growth
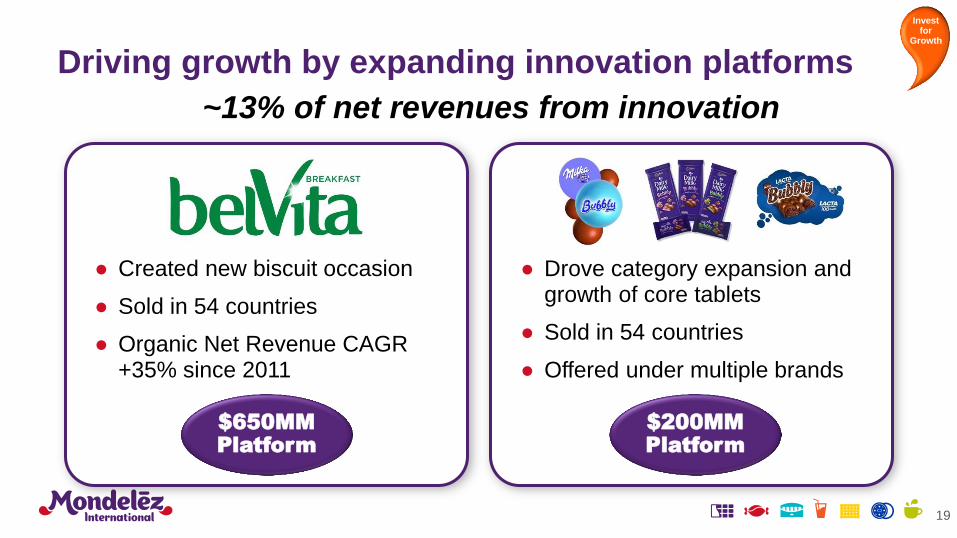
Driving growth by expanding innovation platforms
● Created new biscuit occasion
● Sold in 54 countries
● Organic Net Revenue CAGR +35% since 2011
19
● Drove category expansion and growth of core tablets
● Sold in 54 countries
● Offered under multiple brands
$200MM
Platform
$650MM
Platform
~13% of net revenues from innovation
Invest for
Growth
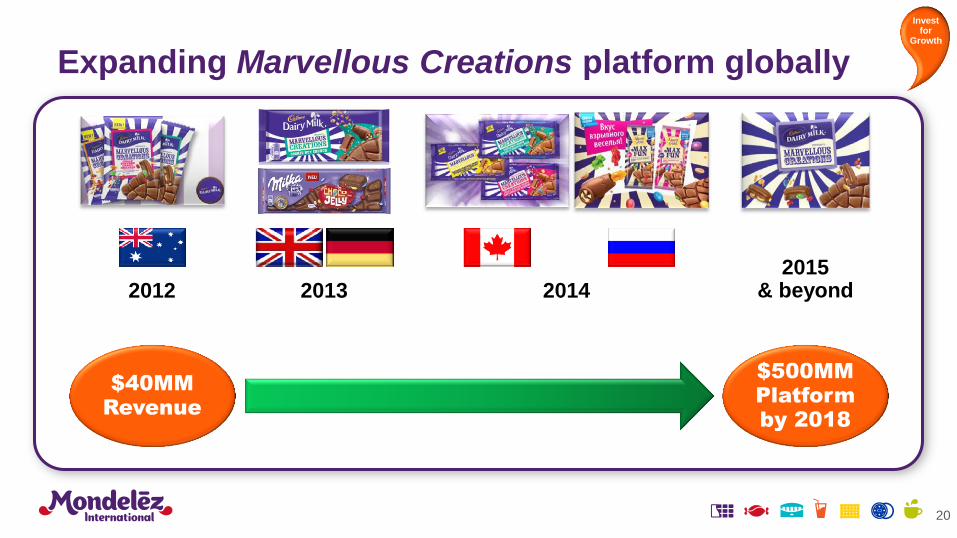
Expanding Marvellous Creations platform globally
20
2014 2015
& beyond 2013 2012
$40MM
Revenue
$500MM
Platform
by 2018
Invest for
Growth

Investing in routes to market, especially traditional trade
21
MDLZ Coverage of Traditional Trade Outlets
2015E
Increase
’15E vs. ’13
% Outlets
Covered ’15E
Increase
’15E vs. ’13
347,000 +37,000 36% +3 pp
1,250,000 +233,000 16% +2 pp
507,000 +24,000 23% +1 pp
Invest for
Growth
Leverage operating model to drive focus, scale and speed
● Consistent region-based, category-led operating model
– Improves ability to accelerate growth platforms and best practices
– Simplifies and standardizes processes to drive speed/reduce costs
● Chief Growth Officer at center of new operating model
22
Invest for
Growth

Long-term strategies and targets unchanged
Organic Net Revenue Growth:
At or Above Category Growth
Adjusted Operating Income
Growth: High Single Digit
Adjusted EPS Growth:
Double Digit
Long-Term Targets
23
● Focus portfolio on snacks
● Reduce supply chain and overhead costs
● Invest in advantaged brands, innovation platforms and routes to market

Daniel Myers EVP Integrated Supply Chain
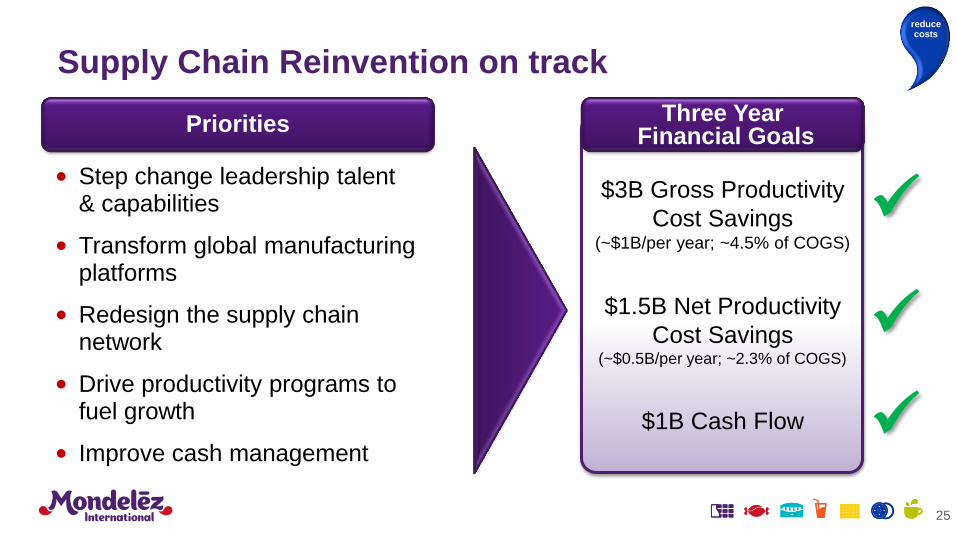
Priorities Three Year Financial Goals
$3B Gross Productivity
Cost Savings (~$1B/per year; ~4.5% of COGS)
$1.5B Net Productivity
Cost Savings (~$0.5B/per year; ~2.3% of COGS)
$1B Cash Flow
• Step change leadership talent & capabilities
• Transform global manufacturing platforms
• Redesign the supply chain network
• Drive productivity programs to fuel growth
• Improve cash management
25
Supply Chain Reinvention on track
reduce costs
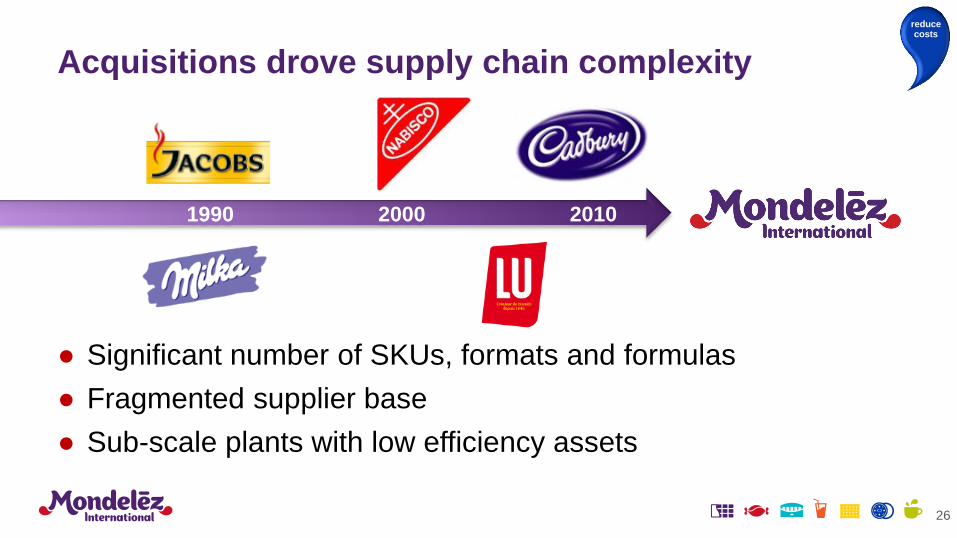
Acquisitions drove supply chain complexity
● Significant number of SKUs, formats and formulas
● Fragmented supplier base
● Sub-scale plants with low efficiency assets
1990 2000 2010
26
reduce costs
27
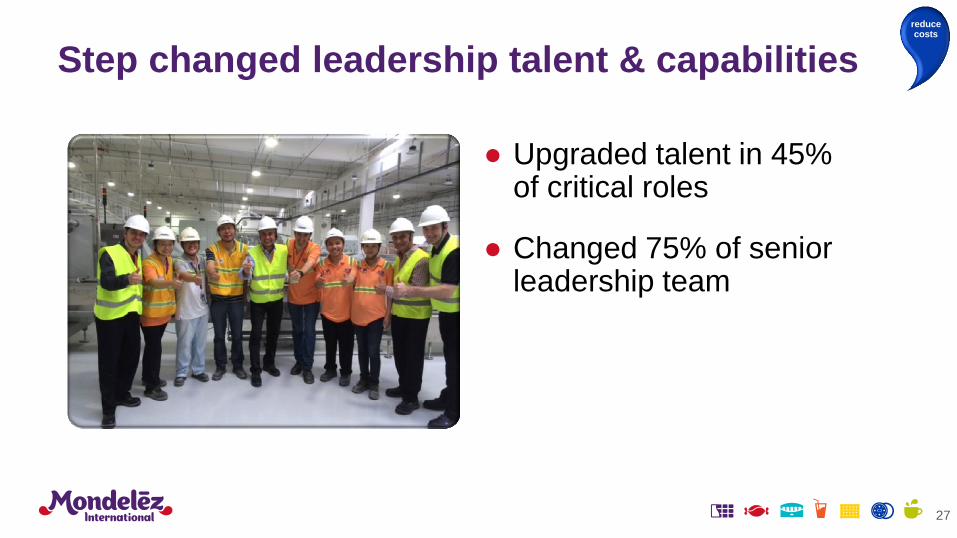
● Upgraded talent in 45% of critical roles
● Changed 75% of senior leadership team
Step changed leadership talent & capabilities
reduce costs

Global platform transformation process
Document best
practices
Develop modular design
Develop break-
through processes
Leverage low-cost suppliers
Pilot new integrated
design
Qualify and
roll out globally
28
reduce costs
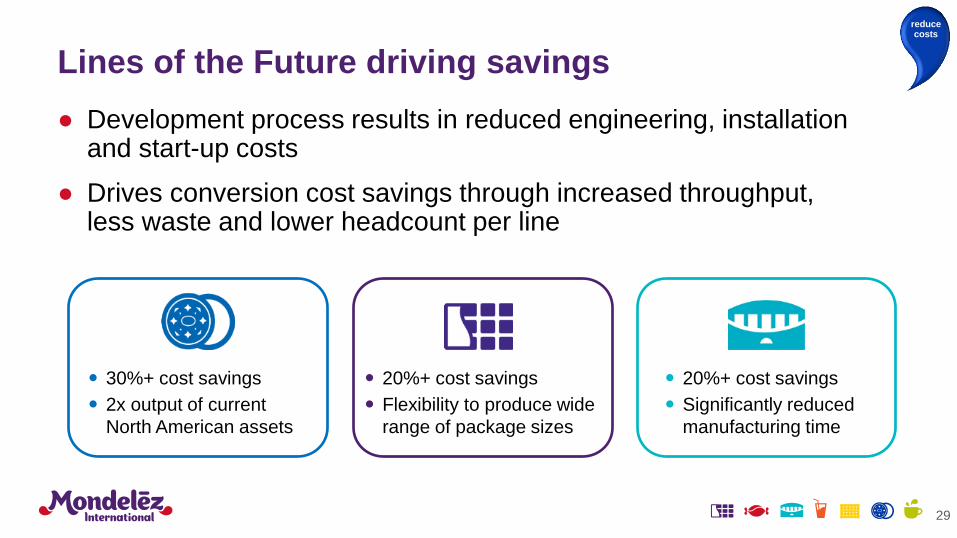
30%+ cost savings
2x output of current
North American assets
20%+ cost savings
Flexibility to produce wide
range of package sizes
20%+ cost savings
Significantly reduced
manufacturing time
Lines of the Future driving savings
● Development process results in reduced engineering, installation and start-up costs
● Drives conversion cost savings through increased throughput, less waste and lower headcount per line
29
reduce costs

New Brownfield &
Greenfield Sites 11 5
Power Brands on
Advantaged
Assets
~15% ~25% ~70% by ’18
Advantaged Lines
Installed 40+ 35
Net Revenue
per Plant ~$200MM ~$230MM > $300MM by ’18
2012 2013 – 2015E 2016E – 2018E
30
Redesigning supply chain to deliver world-class efficiency
reduce costs
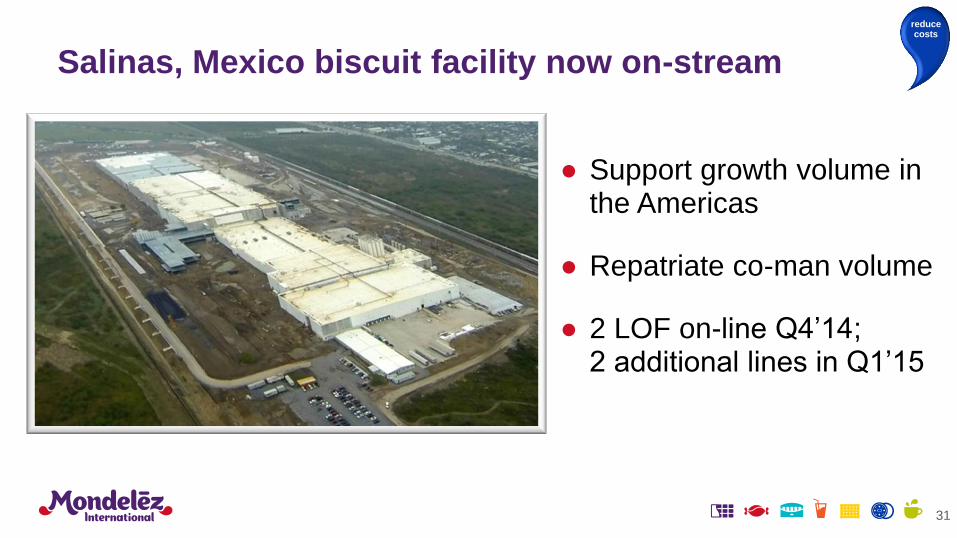
● Support growth volume in the Americas
● Repatriate co-man volume
● 2 LOF on-line Q4’14; 2 additional lines in Q1’15
31
Salinas, Mexico biscuit facility now on-stream
reduce costs
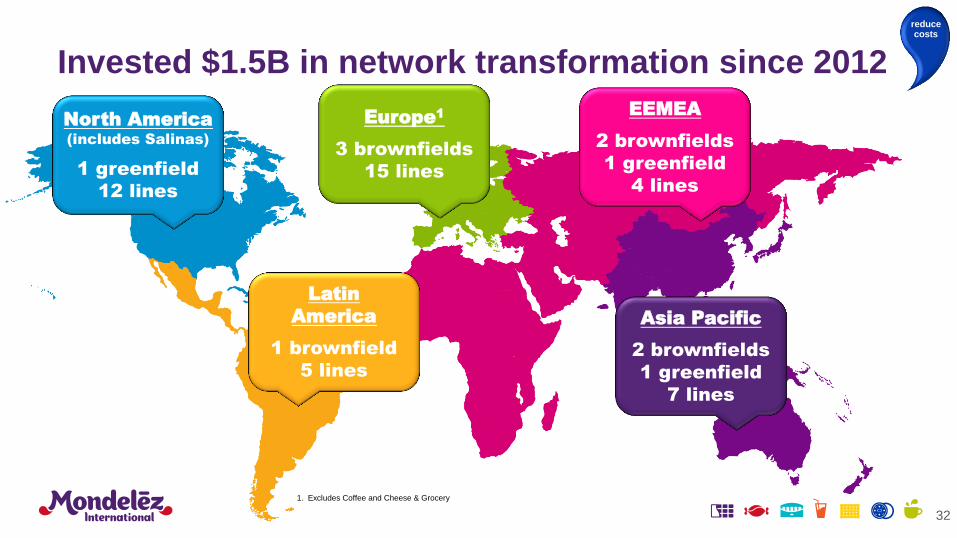
North America
(includes Salinas)
1 greenfield
12 lines
Europe1
3 brownfields
15 lines
EEMEA
2 brownfields
1 greenfield
4 lines
Latin
America
1 brownfield
5 lines
Asia Pacific
2 brownfields
1 greenfield
7 lines
1. Excludes Coffee and Cheese & Grocery
32
Invested $1.5B in network transformation since 2012
reduce costs
33
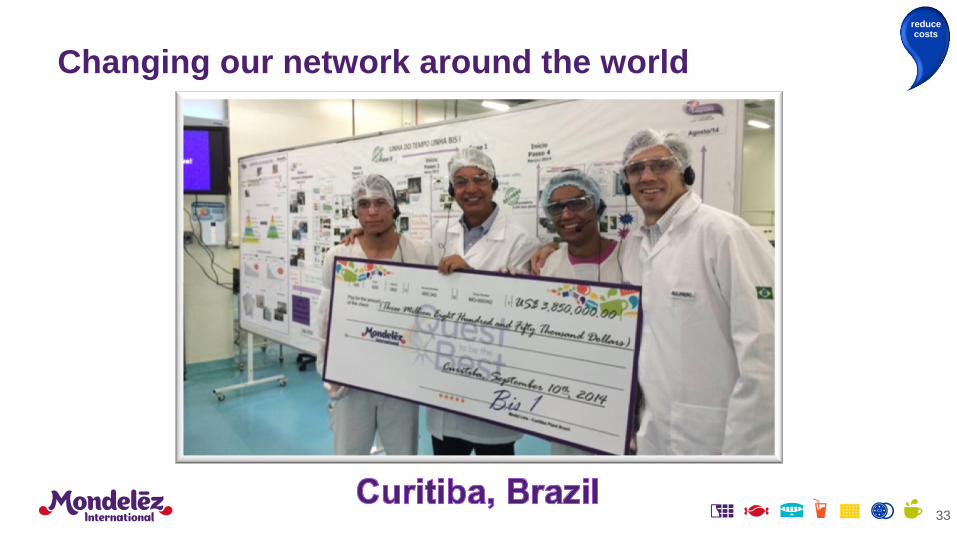
Changing our network around the world
reduce costs

34
Changing our network around the world
reduce costs

35
Changing our network around the world
reduce costs
36
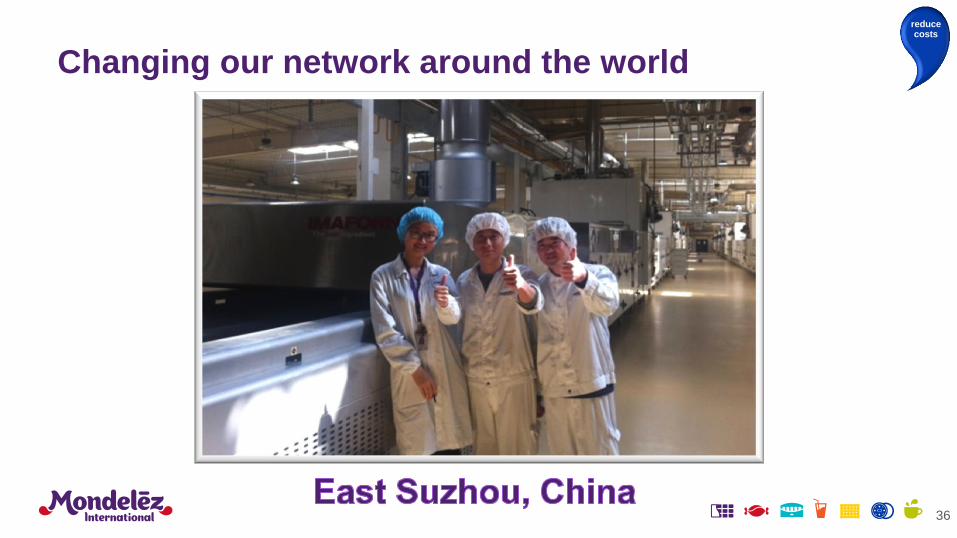
Changing our network around the world
reduce costs

37
Changing our network around the world
reduce costs

38
Changing our network around the world
reduce costs

39
Changing our network around the world
reduce costs
40
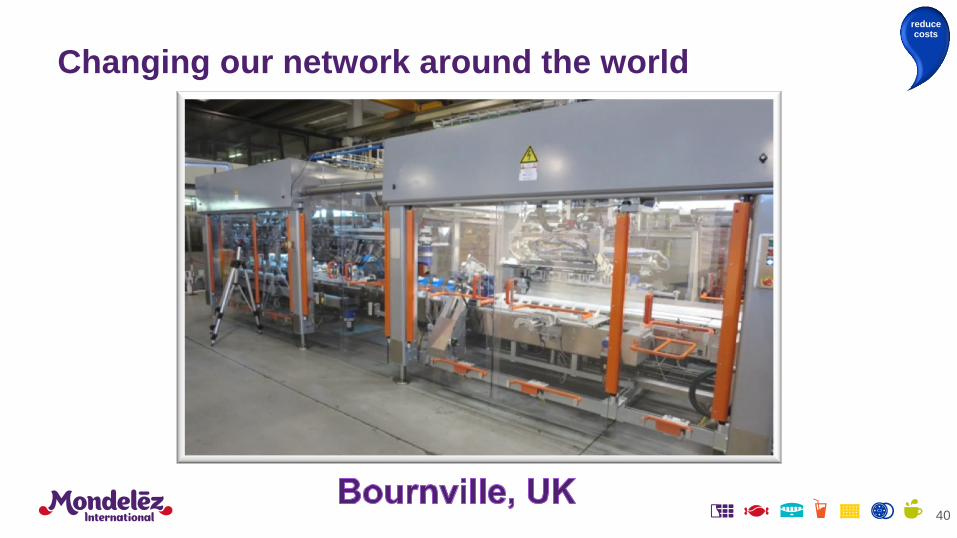
Changing our network around the world
reduce costs

Integrated
Lean Six Sigma
Procurement
Transformation Simplicity
41
Stepping up productivity delivery
reduce costs
42
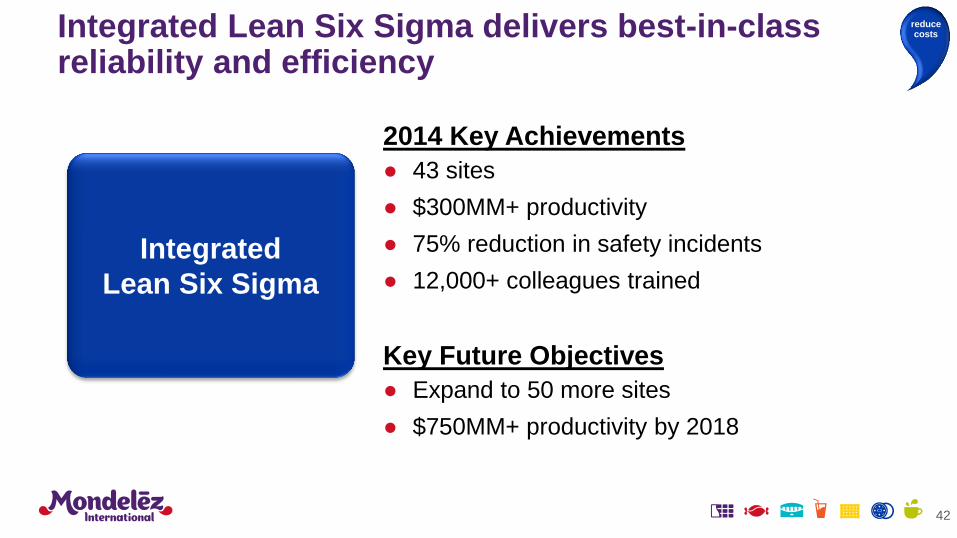
Integrated
Lean Six Sigma
2014 Key Achievements
● 43 sites
● $300MM+ productivity
● 75% reduction in safety incidents
● 12,000+ colleagues trained
Key Future Objectives
● Expand to 50 more sites
● $750MM+ productivity by 2018
Integrated Lean Six Sigma delivers best-in-class reliability and efficiency
reduce costs
43
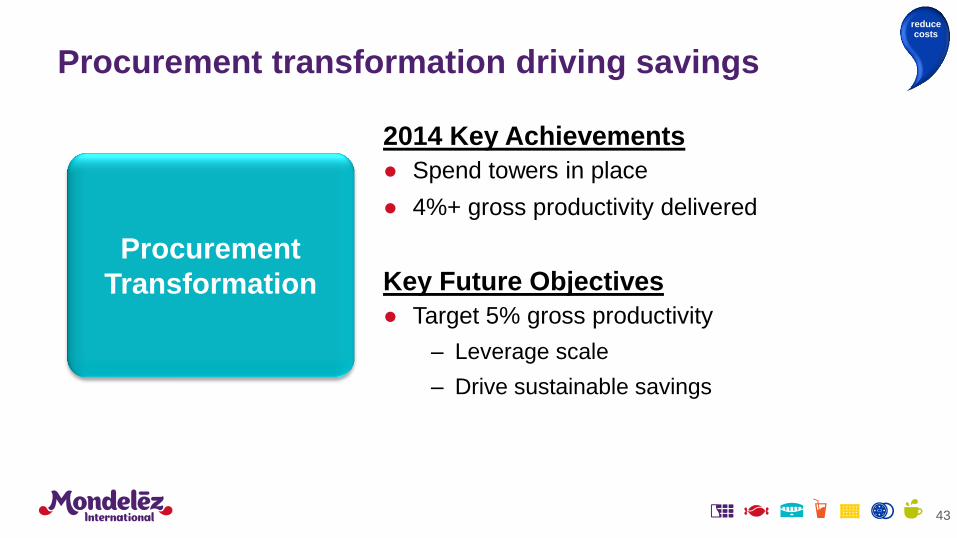
Procurement
Transformation
2014 Key Achievements
● Spend towers in place
● 4%+ gross productivity delivered
Key Future Objectives
● Target 5% gross productivity
– Leverage scale
– Drive sustainable savings
Procurement transformation driving savings
reduce costs
44
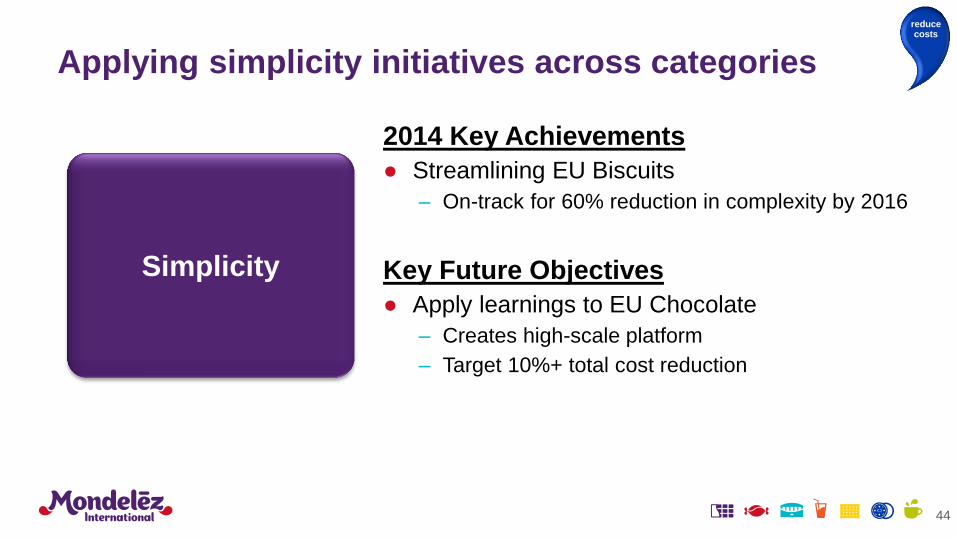
Simplicity
2014 Key Achievements
● Streamlining EU Biscuits
– On-track for 60% reduction in complexity by 2016
Key Future Objectives
● Apply learnings to EU Chocolate
– Creates high-scale platform
– Target 10%+ total cost reduction
Applying simplicity initiatives across categories
reduce costs
45
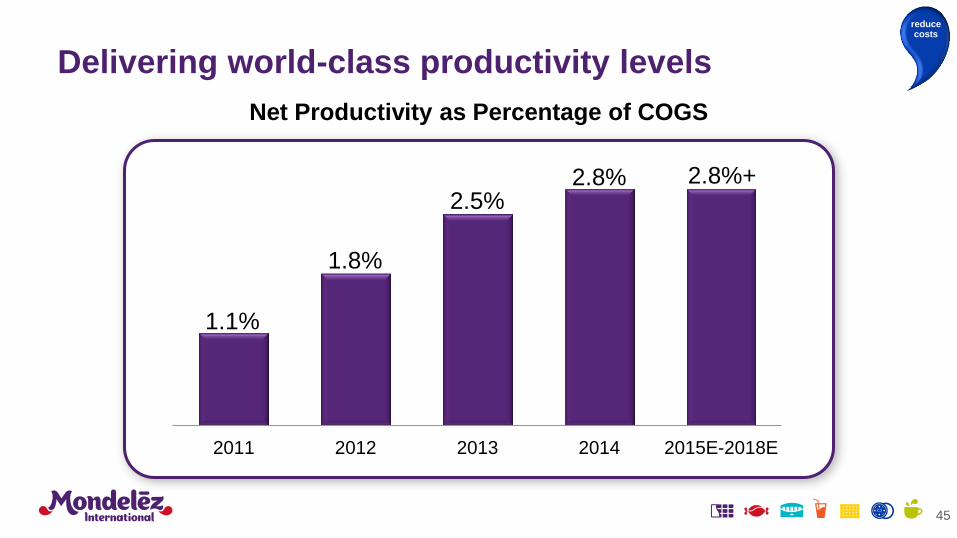
2011 2012 2013 2014 2015E-2018E
1.1%
1.8%
2.5% 2.8% 2.8%+
Net Productivity as Percentage of COGS
Delivering world-class productivity levels
reduce costs
46
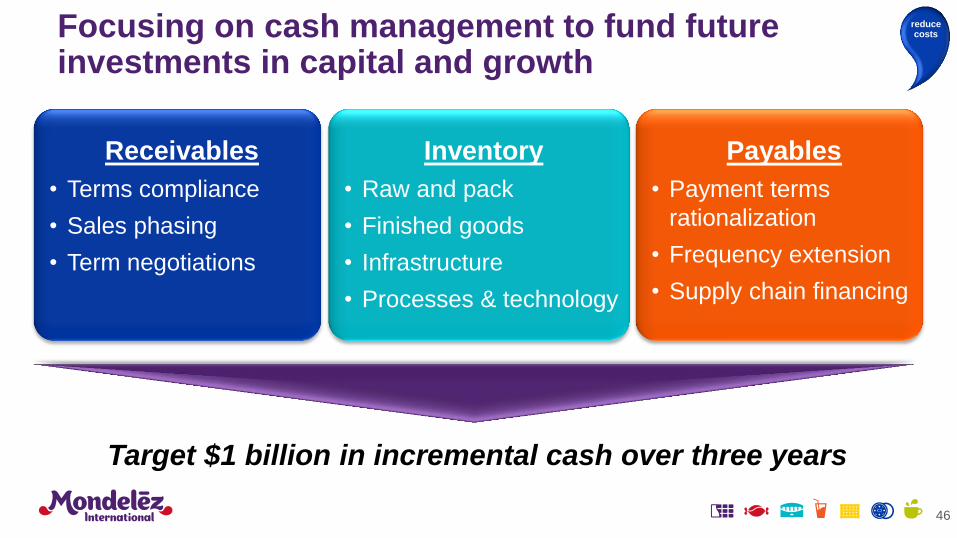
Receivables
• Terms compliance
• Sales phasing
• Term negotiations
Inventory
• Raw and pack
• Finished goods
• Infrastructure
• Processes & technology
Payables
• Payment terms
rationalization
• Frequency extension
• Supply chain financing
Target $1 billion in incremental cash over three years
Focusing on cash management to fund future investments in capital and growth
reduce costs

47
33
20
10
2012 2013 2014
Cash Conversion Cycle (in days)
● Generated ~$600MM incremental
cash in 2014
– Reduced CCC 23 days in 2 years
● Further working capital opportunity
Based on balances as of year-end
On track to generate $1B incremental cash
reduce costs

Successfully executing on SCR initiative
48
Talent & Capabilities
Upgraded talent and core leadership
Delivered 2.8% net productivity in 2014
Targeting 2.8%+ net productivity with strong project pipeline
Productivity
Generated incremental $600 million of cash in 2014
Further working capital opportunity
Cash Management
Manufacturing Platforms
Qualified biscuit, chocolate and gum Lines of the Future
Installing lines to drive conversion cost savings
Network Redesign
Opened Salinas, Mexico greenfield facility in Q4’14
Greenfield and brownfield sites under construction
reduce costs

Brian Gladden EVP and Chief Financial Officer

Overheads as % of Net Revenue
2013
2016E
Significantly reducing overhead costs
● Identify and capture sustainable cost
reductions with zero-based approach (ZBB)
● Three key initiatives:
– Indirect Costs
– People Costs & Org Model
– Shared Services
● Savings driving margin improvement
and fueling growth investments
reduce costs
50

Early success with ZBB approach to indirect costs
51
1. Information Systems
2. Travel
3. Facilities
4. Contractors & Consultants
5. Perquisites
6. Company Vehicles
7. Events & Sponsorships
8. Recruitment & Development
9. Legal Services
10. Financial Services
11. Outsourced Business Support
12. Sales Support
13. Marketing Support
~50% of overhead savings opportunity
● Benchmarking best-in-class spending levels / policies
● All categories over benchmark spending levels
● New policies introduced during 2014
● Bottoms-up budgets locked for 2015
● Executive ownership for each cost package
reduce costs
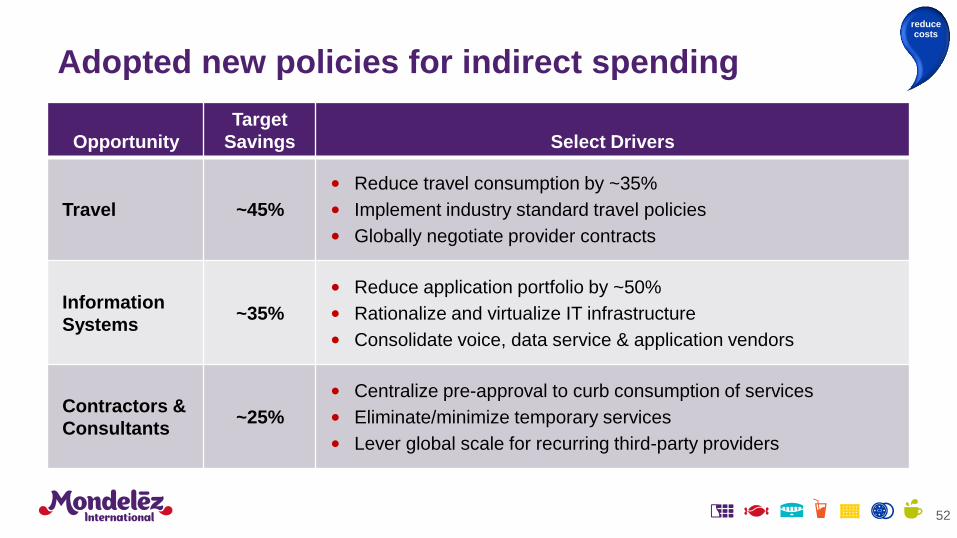
Adopted new policies for indirect spending
Opportunity
Target
Savings Select Drivers
Travel ~45%
• Reduce travel consumption by ~35%
• Implement industry standard travel policies
• Globally negotiate provider contracts
Information
Systems ~35%
• Reduce application portfolio by ~50%
• Rationalize and virtualize IT infrastructure
• Consolidate voice, data service & application vendors
Contractors &
Consultants ~25%
• Centralize pre-approval to curb consumption of services
• Eliminate/minimize temporary services
• Lever global scale for recurring third-party providers
52
reduce costs

Streamlining how we work
53
Organization Shared Services
• Eliminate redundancies by adopting region-based, category-led model
Key driver +300bps OI margin in Europe
Implemented in NA in 2014
• Greater centralization of certain functions (e.g., Procurement)
• Simplify and standardize processes
• Focus on scalable, transactional processes in Finance, HR, Receivables and Payables
• Leverage outsourced partner and captive models
~50% of overhead savings opportunity
reduce costs

2014-2018 Restructuring Program enables $1.5B of expected incremental savings
• $3.5B total P&L cost
− $2.5B cash
− $1B non-cash
• $2B capex included in total short-term target of ~5% of revenue
Costs Benefits
• Drives margin expansion
• Provides fuel for growth
Indirect
Costs
Supply
Chain
People Costs
& Org Model
$1.5B
~25%
~25%
~50%
2018 Exit Run-Rate
Ove
rhe
ad
s
54
reduce costs
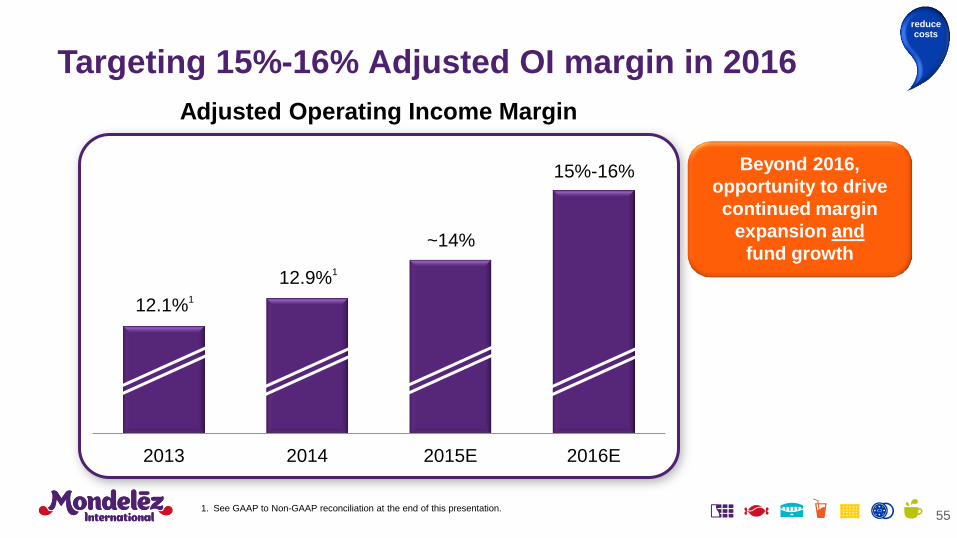
Targeting 15%-16% Adjusted OI margin in 2016
55
2013 2014 2015E 2016E
12.1%1
12.9%1
~14%
15%-16% Beyond 2016,
opportunity to drive
continued margin
expansion and
fund growth
Adjusted Operating Income Margin
1. See GAAP to Non-GAAP reconciliation at the end of this presentation.
reduce costs

2015 Outlook – Income Statement
56
Target
Organic Net Revenue Growth 2%+
Estimated FX Impact on Net Revenue Growth1 ~(11)pp
Adjusted Operating Income Margin ~14%
Interest Expense ~$825MM
Effective Tax Rate High Teens
Adjusted Earnings Per Share Growth (constant FX) Double-Digit %
Estimated FX Impact on EPS1 ~$(0.30)
1. Based on January 30, 2015 spot rates.
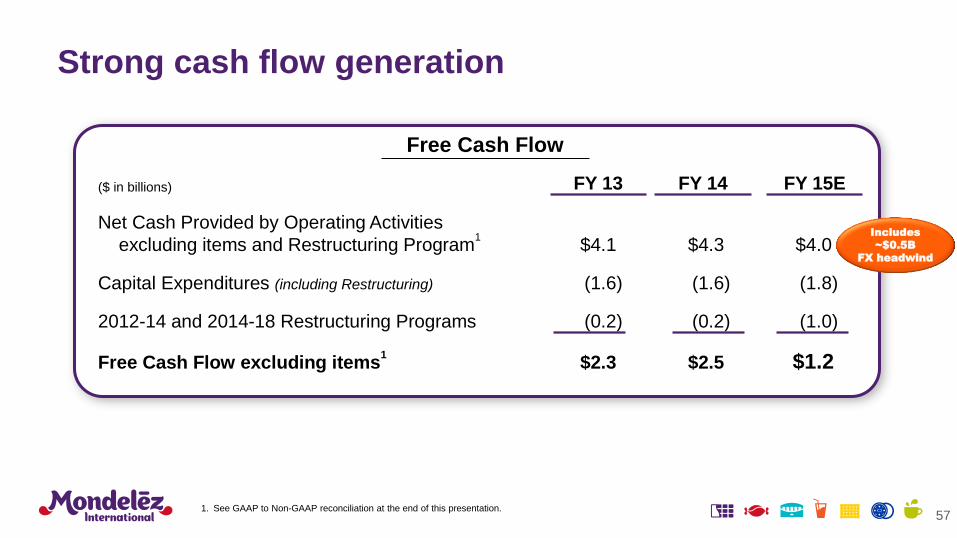
Strong cash flow generation
57
($ in billions)
Net Cash Provided by Operating Activities
excluding items and Restructuring Program1 $4.1
$4.3 $4.0
Capital Expenditures (including Restructuring) (1.6) (1.6) (1.8)
2012-14 and 2014-18 Restructuring Programs (0.2) (0.2) (1.0)
Free Cash Flow excluding items1 $2.3 $2.5 $1.2
FY 13 FY 14 FY 15E
Free Cash Flow
Includes
~$0.5B
FX headwind
1. See GAAP to Non-GAAP reconciliation at the end of this presentation.
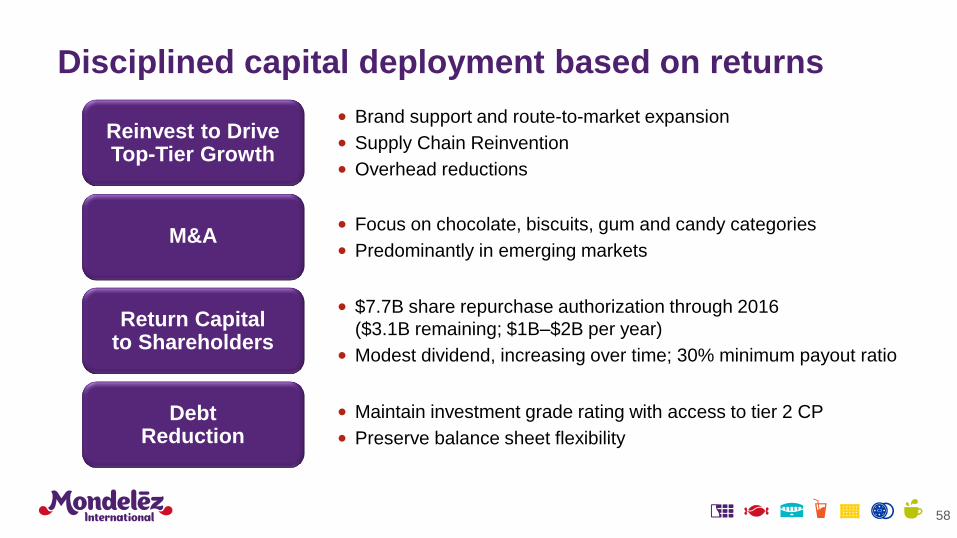
Disciplined capital deployment based on returns
58
Reinvest to Drive Top-Tier Growth
M&A
Return Capital to Shareholders
Debt Reduction
• Focus on chocolate, biscuits, gum and candy categories
• Predominantly in emerging markets
• Brand support and route-to-market expansion
• Supply Chain Reinvention
• Overhead reductions
• $7.7B share repurchase authorization through 2016
($3.1B remaining; $1B–$2B per year)
• Modest dividend, increasing over time; 30% minimum payout ratio
• Maintain investment grade rating with access to tier 2 CP
• Preserve balance sheet flexibility

Long-term strategies and targets unchanged
Organic Net Revenue Growth:
At or Above Category Growth
Adjusted Operating Income
Growth: High Single Digit
Adjusted EPS Growth:
Double Digit
Long-Term Targets
59
● Focus portfolio on snacks
● Reduce supply chain and overhead costs
● Invest in advantaged brands, innovation platforms and routes to market

60
DEFINITIONS OF THE COMPANY’S NON-GAAP FINANCIAL MEASURES The company’s non-GAAP financial measures and corresponding metrics reflect how the company evaluates its operating results currently and provide improved comparability of operating results. As new events or circumstances arise, these definitions could change over time:
● “Organic Net Revenue” is defined as net revenues excluding the impact of acquisitions, divestitures (including businesses under sales agreements and exits of major product lines under a sale or licensing agreement), Integration Program costs, accounting calendar changes and currency rate fluctuations.
● “Adjusted Gross Profit” is defined as gross profit excluding the impacts of pension costs related to obligations transferred in the Spin-Off, the 2012-2014 Restructuring Program, the Integration Program and other acquisition integration costs and the operating results of divestitures (including businesses under sales agreements and exits of major product lines under a sale or licensing agreement). The company also evaluates growth in the company’s Adjusted Gross Profit on a constant currency basis.
● “Adjusted Operating Income” and “Adjusted Segment Operating Income” are defined as operating income (or segment operating income) excluding the impacts of Spin-Off Costs, pension costs related to the obligations transferred in the Spin-Off, the 2012-2014 Restructuring Program, the 2014-2018 Restructuring Program, the Integration Program and other acquisition integration costs, the remeasurement of net monetary assets in Venezuela, the benefit from the Cadbury acquisition-related indemnification resolution, incremental costs associated with the JDE coffee transactions, impairment charges related to goodwill and intangible assets, gains / losses from divestitures or acquisitions, acquisition-related costs and the operating results of divestitures (including businesses under sales agreements and exits of major product lines under a sale or licensing agreement). The company also evaluates growth in the company’s Adjusted Operating Income and Adjusted Segment Operating Income on a constant currency basis.
● “Adjusted EPS” is defined as diluted EPS attributable to Mondelēz International from continuing operations excluding the impacts of Spin-Off Costs, pension costs related to the obligations transferred in the Spin-Off, the 2012-2014 Restructuring Program, the 2014-2018 Restructuring Program, the Integration Program and other acquisition integration costs, the remeasurement of net monetary assets in Venezuela, the net benefit from the Cadbury acquisition-related indemnification resolution, the loss on debt extinguishment and related expenses, the residual tax benefit impact from the resolution of the Starbucks arbitration, hedging gains / losses and incremental costs associated with the JDE coffee transactions, impairment charges related to goodwill and intangible assets, gains / losses from divestitures or acquisitions, acquisition-related costs and net earnings from divestitures (including businesses under sales agreements and exits of major product lines under a sale or licensing agreement), and including an interest expense adjustment related to the Spin-Off transaction. The company also evaluates growth in the company’s Adjusted EPS on a constant currency basis.
● “Free Cash Flow excluding items” is defined as Free Cash Flow (net cash provided by operating activities less capital expenditures) excluding taxes paid on the Starbucks arbitration award and cash payments associated with accrued interest and other related fees due to the company’s completion of a $1.6 billion cash tender offer on February 6, 2014 and a $3.4 billion cash tender offer on December 18, 2013 for some of its outstanding high-coupon long-term debt.
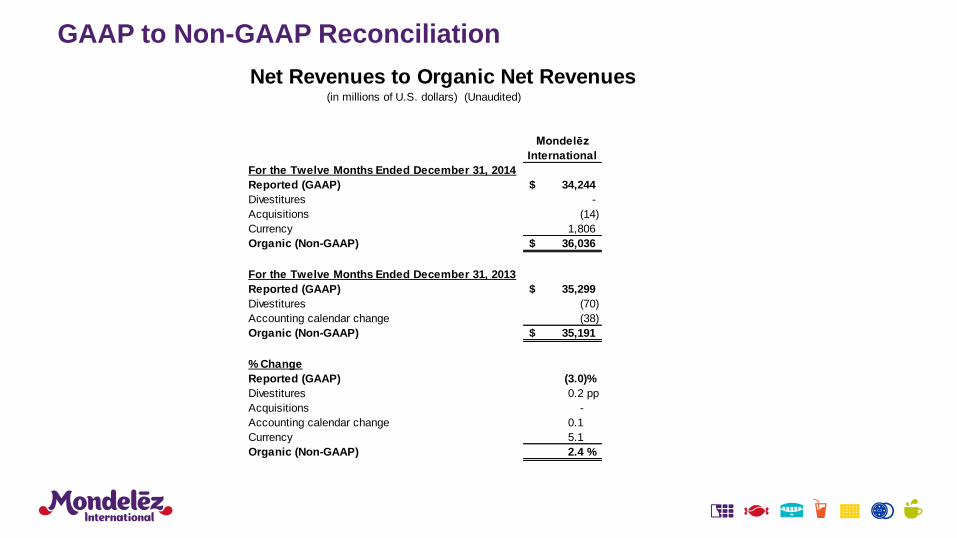
Net Revenues to Organic Net Revenues
Mondelēz
International
For the Twelve Months Ended December 31, 2014
Reported (GAAP) 34,244$
Divestitures -
Acquisitions (14)
Currency 1,806
Organic (Non-GAAP) 36,036$
For the Twelve Months Ended December 31, 2013
Reported (GAAP) 35,299$
Divestitures (70)
Accounting calendar change (38)
Organic (Non-GAAP) 35,191$
% Change
Reported (GAAP) (3.0)%
Divestitures 0.2 pp
Acquisitions -
Accounting calendar change 0.1
Currency 5.1
Organic (Non-GAAP) 2.4 %
(in millions of U.S. dollars) (Unaudited)
GAAP to Non-GAAP Reconciliation
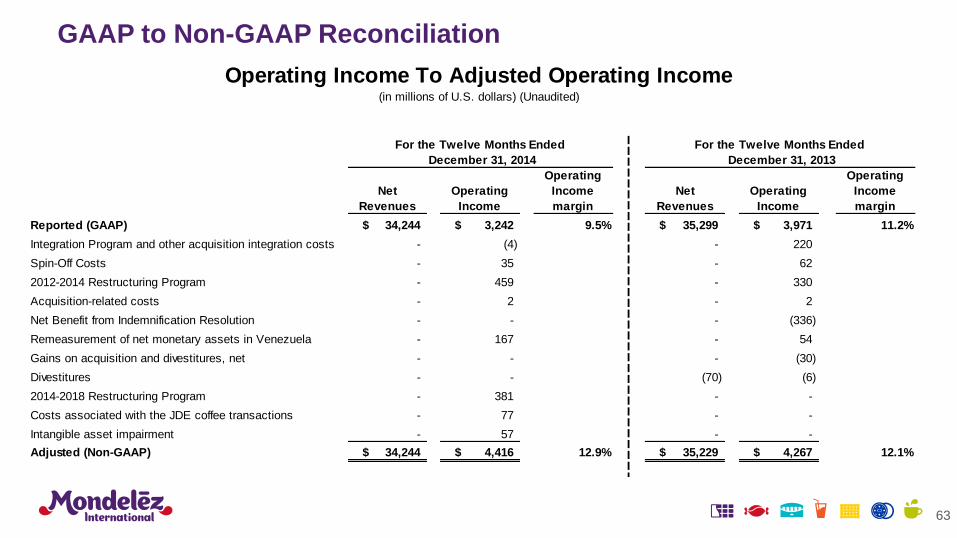
GAAP to Non-GAAP Reconciliation
63
Net
Revenues
Operating
Income
Operating
Income
margin
Net
Revenues
Operating
Income
Operating
Income
margin
Reported (GAAP) 34,244$ 3,242$ 9.5% 35,299$ 3,971$ 11.2%
Integration Program and other acquisition integration costs - (4) - 220
Spin-Off Costs - 35 - 62
2012-2014 Restructuring Program - 459 - 330
Acquisition-related costs - 2 - 2
Net Benefit from Indemnification Resolution - - - (336)
Remeasurement of net monetary assets in Venezuela - 167 - 54
Gains on acquisition and divestitures, net - - - (30)
Divestitures - - (70) (6)
2014-2018 Restructuring Program - 381 - -
Costs associated with the JDE coffee transactions - 77 - -
Intangible asset impairment - 57 - -
Adjusted (Non-GAAP) 34,244$ 4,416$ 12.9% 35,229$ 4,267$ 12.1%
For the Twelve Months Ended
December 31, 2014
For the Twelve Months Ended
December 31, 2013
Operating Income To Adjusted Operating Income(in millions of U.S. dollars) (Unaudited)

Diluted EPS % Growth
2013 Diluted EPS Attributable to Mondelēz International (GAAP) 2.19$
Discontinued Operations 0.90
2013 Diluted EPS Attributable to Mondelēz International from
Continuing Operations 1.29
Integration Program and other acquisition integration costs 0.10
Spin-Off Costs 0.02
2012-2014 Restructuring Program costs 0.14
Net benefit from indemnification resolution (0.20)
Loss on debt extinguishment and related expenses 0.22
Residual tax impact associated with starbucks arbitration resolution (0.02)
Remeasurement of net monetary assets in Venezuela 0.03
Gains on acquisition and divestitures, net (0.04)
2013 Adjusted EPS (Non-GAAP) 1.54
Increase in operations 0.25
Gain on sale of property in 2013 (0.03)
VAT related benefits 0.04
Unrealized gains/(losses) on hedging activities (0.07)
Lower interest and other expense, net 0.08
Changes in shares outstanding 0.08
Changes in income taxes 0.01
2014 Adjusted EPS (Constant Currency) (Non-GAAP) 1.90 23.4%
Unfavorable foreign currency - translation (0.14)
2014 Adjusted EPS (Non-GAAP) 1.76 14.3%
Spin-Off Costs (0.01)
2012-2014 Restructuring Program costs (0.21)
Remeasurement of net monetary assets in Venezuela (0.09)
Loss on debt extinguishment and related expenses (0.18)
Intangible asset impairment charges (0.02)
2014-2018 Restructuring Program costs (0.16)
Income / (costs) associated with the JDE coffee transactions 0.19
2014 Diluted EPS Attributable to Mondelēz International (GAAP) 1.28$ (41.6)%
Diluted EPS to Adjusted EPS(Unaudited)
For the Twelve Months
Ended December 31,
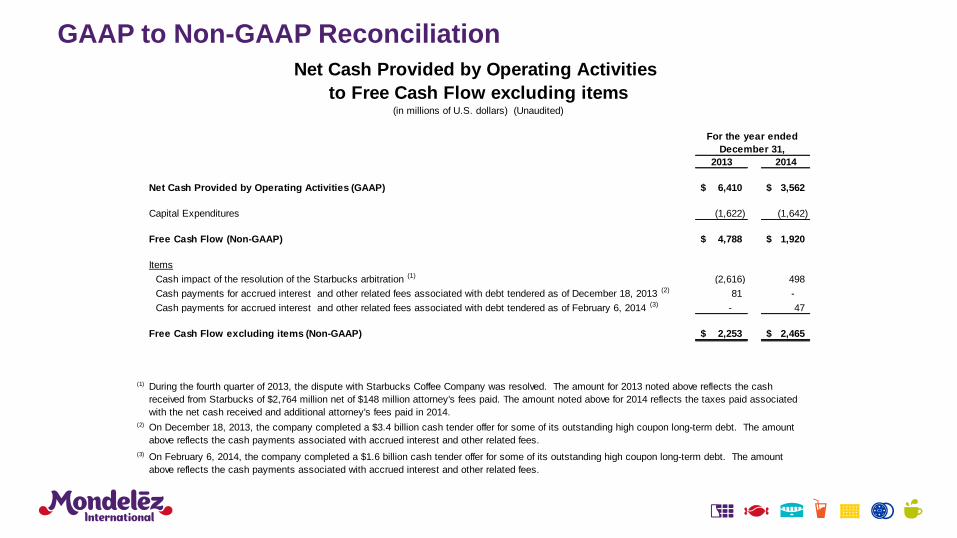
GAAP to Non-GAAP Reconciliation
GAAP to Non-GAAP Reconciliation
2013 2014
Net Cash Provided by Operating Activities (GAAP) 6,410$ 3,562$
Capital Expenditures (1,622) (1,642)
Free Cash Flow (Non-GAAP) 4,788$ 1,920$
Items
Cash impact of the resolution of the Starbucks arbitration (1) (2,616) 498
Cash payments for accrued interest and other related fees associated with debt tendered as of December 18, 2013 (2) 81 -
Cash payments for accrued interest and other related fees associated with debt tendered as of February 6, 2014 (3) - 47
Free Cash Flow excluding items (Non-GAAP) 2,253$ 2,465$
(1)
(2)
(3)
On December 18, 2013, the company completed a $3.4 billion cash tender offer for some of its outstanding high coupon long-term debt. The amount
above reflects the cash payments associated with accrued interest and other related fees.
On February 6, 2014, the company completed a $1.6 billion cash tender offer for some of its outstanding high coupon long-term debt. The amount
above reflects the cash payments associated with accrued interest and other related fees.
Net Cash Provided by Operating Activities
to Free Cash Flow excluding items(in millions of U.S. dollars) (Unaudited)
For the year ended
December 31,
During the fourth quarter of 2013, the dispute with Starbucks Coffee Company was resolved. The amount for 2013 noted above reflects the cash
received from Starbucks of $2,764 million net of $148 million attorney's fees paid. The amount noted above for 2014 reflects the taxes paid associated
with the net cash received and additional attorney's fees paid in 2014.
66
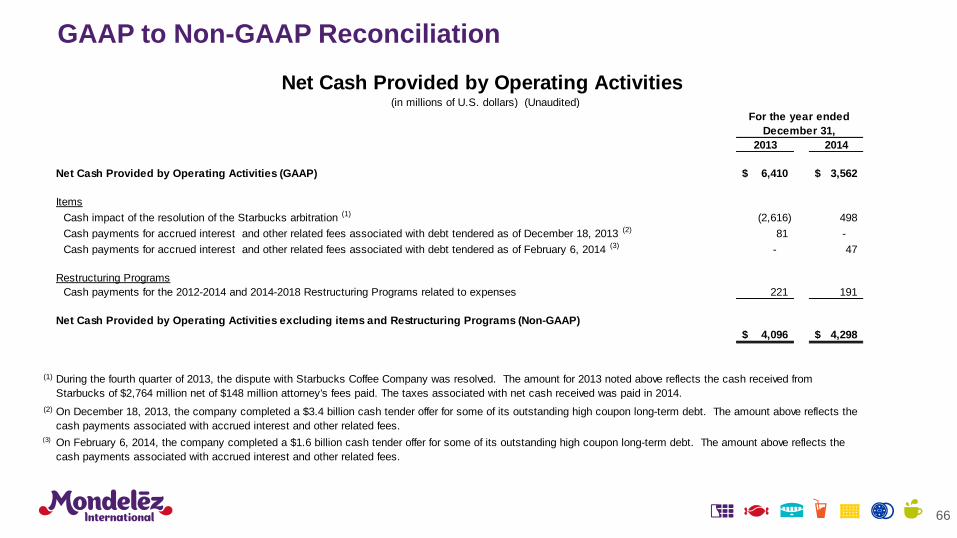
GAAP to Non-GAAP Reconciliation
2013 2014
Net Cash Provided by Operating Activities (GAAP) 6,410$ 3,562$
Items
Cash impact of the resolution of the Starbucks arbitration (1) (2,616) 498
Cash payments for accrued interest and other related fees associated with debt tendered as of December 18, 2013 (2) 81 -
Cash payments for accrued interest and other related fees associated with debt tendered as of February 6, 2014 (3) - 47
Restructuring Programs
Cash payments for the 2012-2014 and 2014-2018 Restructuring Programs related to expenses 221 191
Net Cash Provided by Operating Activities excluding items and Restructuring Programs (Non-GAAP)
4,096$ 4,298$
(1)
(2)
(3)
On December 18, 2013, the company completed a $3.4 billion cash tender offer for some of its outstanding high coupon long-term debt. The amount above reflects the
cash payments associated with accrued interest and other related fees.
On February 6, 2014, the company completed a $1.6 billion cash tender offer for some of its outstanding high coupon long-term debt. The amount above reflects the
cash payments associated with accrued interest and other related fees.
Net Cash Provided by Operating Activities (in millions of U.S. dollars) (Unaudited)
For the year ended
December 31,
During the fourth quarter of 2013, the dispute with Starbucks Coffee Company was resolved. The amount for 2013 noted above reflects the cash received from
Starbucks of $2,764 million net of $148 million attorney's fees paid. The taxes associated with net cash received was paid in 2014.