principles of design for rigid pavement · pdf filerigid pavements. there are no fundamental...
TRANSCRIPT

Colorado Department of Transportation
2017 Pavement Design Manual
244
PRINCIPLES OF DESIGN FOR RIGID PAVEMENT
7.1 Introduction
Rigid pavement design is based on the mechanistic-empirical (M-E) design concepts. The design
procedure utilizes distress and smoothness prediction models developed and calibrated locally.
The MEPDG Design Guide and the AASHTO Interim MEPDG Manual of Practice documents
provide a detailed description of the M-E concepts for rigid pavement designs.
The design procedures described in this chapter can be used for design of new or reconstructed
rigid pavements. There are no fundamental differences in the pavement design procedure for new
alignment and reconstruction, however, the potential reuse of the materials from the existing
pavement structure can be an important issue. Refer to CHAPTER 9: Principles of Design for
Pavement Rehabilitation with Rigid Overlay when rehabilitation designs are necessary with
rigid overlays or restoration projects.
The design life for typical thin white topping should be 10 to 20 years for rehabilitations and
30 years for reconstruction. An overview of the proven concrete pavement practices the
Colorado Department of Transportation (CDOT) has implemented over the last several years is
documented in the Final Research Report CDOT-DTD-R-2006-9, Implementation of Proven
PCCP Practices in Colorado, dated April 2006 (8).
7.2 M-E Design Methodology for Rigid Pavement
The M-E Design of rigid pavements is an iterative process. The key steps in the design process
include the following:
Select a Trial Design Strategy
Select the Appropriate Performance Indicator Criteria for the Project: Establish
criteria for acceptable pavement performance (i.e. distress/IRI) at the end of the design
period. CDOT criteria for acceptable performance is based on highway functional class
and location. The performance criteria is established to reflect magnitudes of key
pavement distresses and smoothness that trigger major rehabilitation or reconstruction.
Select the Appropriate Reliability Level for the Project: The reliability is a factor
of safety to account for inherent variations in construction, materials, traffic, climate,
and other design inputs. The level of reliability selected should be based on the
criticality of the design. CDOT criteria for desired reliability is based on highway
functional class and location. The desired level of reliability is selected for each
individual performance indicator.
Colorado Department of Transportation
2017 Pavement Design Manual
245
Assemble All Inputs for the Pavement Trial Design Under Consideration: Define
subgrade support, PCC and other paving material properties, traffic loads, climate,
pavement type, and design/construction features. The inputs required to run M-E
Design may be obtained using one of three hierarchical levels of effort and need not be
consistent for all of the inputs in a given design. A hierarchical level for a given input
is selected based on the importance of the project and input, and the resources at the
disposal of the designer.
Run the M-E Design Software: The software calculates changes in layer properties,
damage, key distresses, and IRI over the design life. The key steps include:
Processing Input to obtain monthly values of traffic inputs and seasonal
variations of material and climatic inputs needed in the design evaluations for
the entire design period.
Computing Structural Responses (stresses and strains) using finite element
based pavement response models for each axle type and load and damage-
calculation increment throughout the design period.
Calculating Accumulated Distress and/or damage at the end of each analysis
period for the entire design period.
Predicting Key Distresses (JPCP transverse cracking and joint faulting) at the
end of each analysis period throughout the design life using the calibrated
mechanistic-empirical performance models.
Predicting Smoothness as a function of initial IRI, distresses that accumulate
over time, and site factors at the end of each analysis increment.
Evaluate the Adequacy of the Trial Design: The trial design is considered
“adequate” if none of the predicted distresses/IRI exceed the performance indicator
criteria at the design reliability level chosen for the project. If any of the criteria has
been exceeded, determine how this deficiency can be remedied by altering material
types and properties, layer thicknesses, or other design features.
Revise the Trial Design, as Needed: If the trial design is deemed “inadequate”, revise
the inputs/trial design and re-run the program. Iterate until all the performance criteria
have been met. Once they have been met, the trial design becomes a feasible design
alternative.
The design alternatives that satisfy all performance criteria are considered feasible from a
structural and functional viewpoint and can be further considered for other evaluations, such as
life cycle cost analysis. A detailed description of the design process is presented in the interim
edition of the AASHTO Mechanistic-Empirical Pavement Design Guide Manual of Practice,
AASHTO, 2008.
Colorado Department of Transportation
2017 Pavement Design Manual
246
7.3 Select Trial Design Strategy
7.3.1 Rigid Pavement Layers
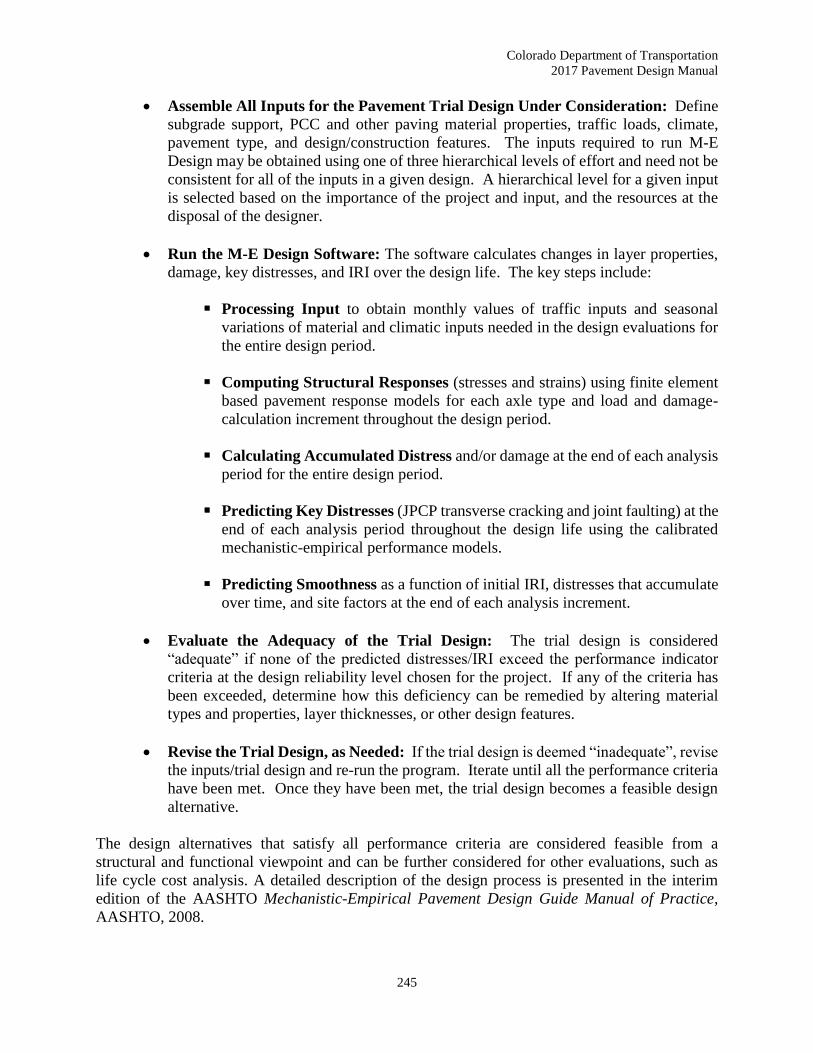
Figure 7.1 Rigid Pavement Layers shows a conventional rigid layered system. The PCC slab
may be placed over base, subbase, or directly on a prepared subgrade. The base (layer directly
beneath the PCC slab) and subbase layers (layer placed below the base layer) may include unbound
aggregates, asphalt stabilized granular, cement stabilized, lean concrete, crushed concrete, lime
stabilized, recycled asphalt pavement (RAP), and other materials. Base/subbase layers may be
dense graded or permeable drainage layers.
Transverse joints are closely spaced in JPCP, typically between 10 and 20 feet, to minimize
transverse cracking from temperature and moisture gradients. JPCP may have tied or untied
longitudinal joints.
Figure 7.1 Rigid Pavement Layers
7.3.2 Establish Trial Design Structure
The designer must establish a trial design structure (combination of material types and
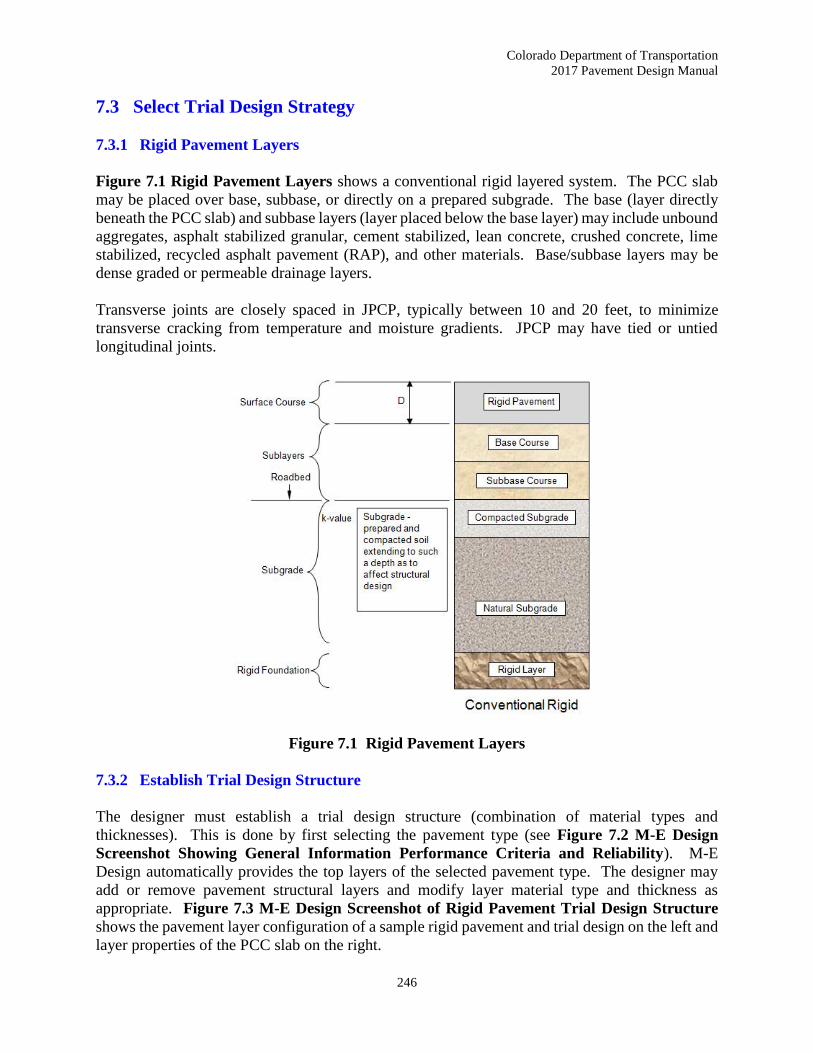
thicknesses). This is done by first selecting the pavement type (see Figure 7.2 M-E Design
Screenshot Showing General Information Performance Criteria and Reliability). M-E
Design automatically provides the top layers of the selected pavement type. The designer may
add or remove pavement structural layers and modify layer material type and thickness as
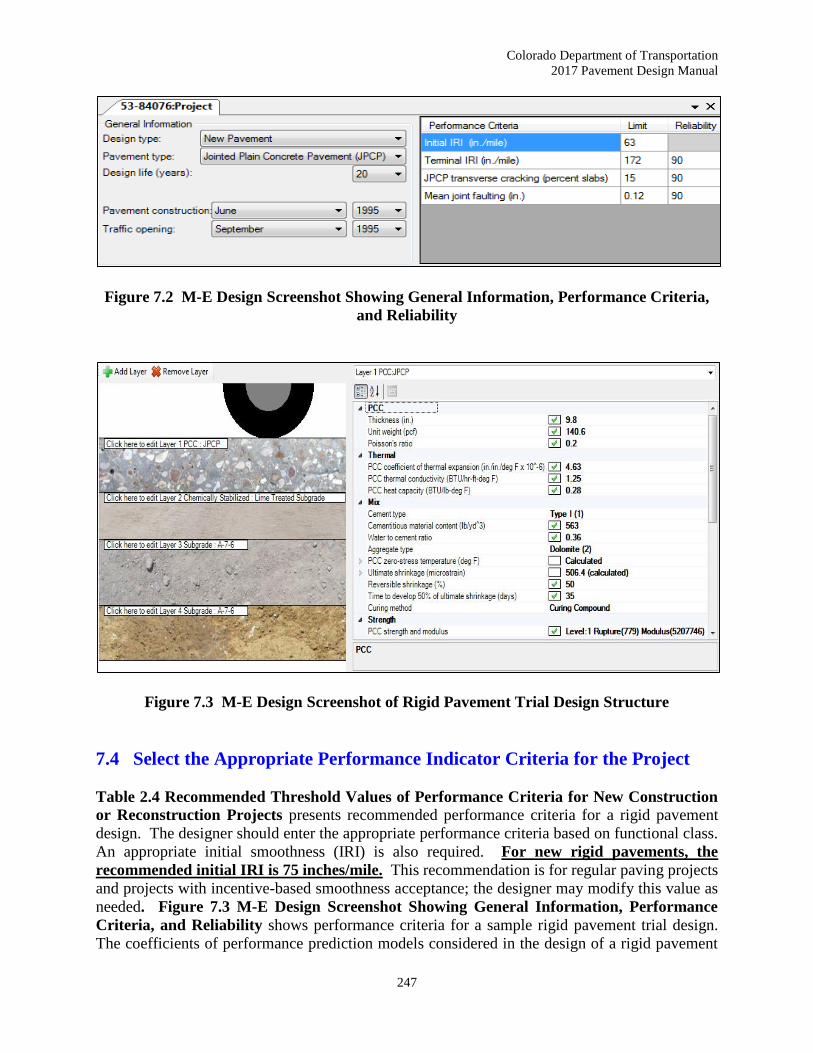
appropriate. Figure 7.3 M-E Design Screenshot of Rigid Pavement Trial Design Structure
shows the pavement layer configuration of a sample rigid pavement and trial design on the left and
layer properties of the PCC slab on the right.
Colorado Department of Transportation
2017 Pavement Design Manual
247
Figure 7.2 M-E Design Screenshot Showing General Information, Performance Criteria,
and Reliability
Figure 7.3 M-E Design Screenshot of Rigid Pavement Trial Design Structure
7.4 Select the Appropriate Performance Indicator Criteria for the Project
Table 2.4 Recommended Threshold Values of Performance Criteria for New Construction
or Reconstruction Projects presents recommended performance criteria for a rigid pavement
design. The designer should enter the appropriate performance criteria based on functional class.
An appropriate initial smoothness (IRI) is also required. For new rigid pavements, the
recommended initial IRI is 75 inches/mile. This recommendation is for regular paving projects
and projects with incentive-based smoothness acceptance; the designer may modify this value as
needed. Figure 7.3 M-E Design Screenshot Showing General Information, Performance
Criteria, and Reliability shows performance criteria for a sample rigid pavement trial design.
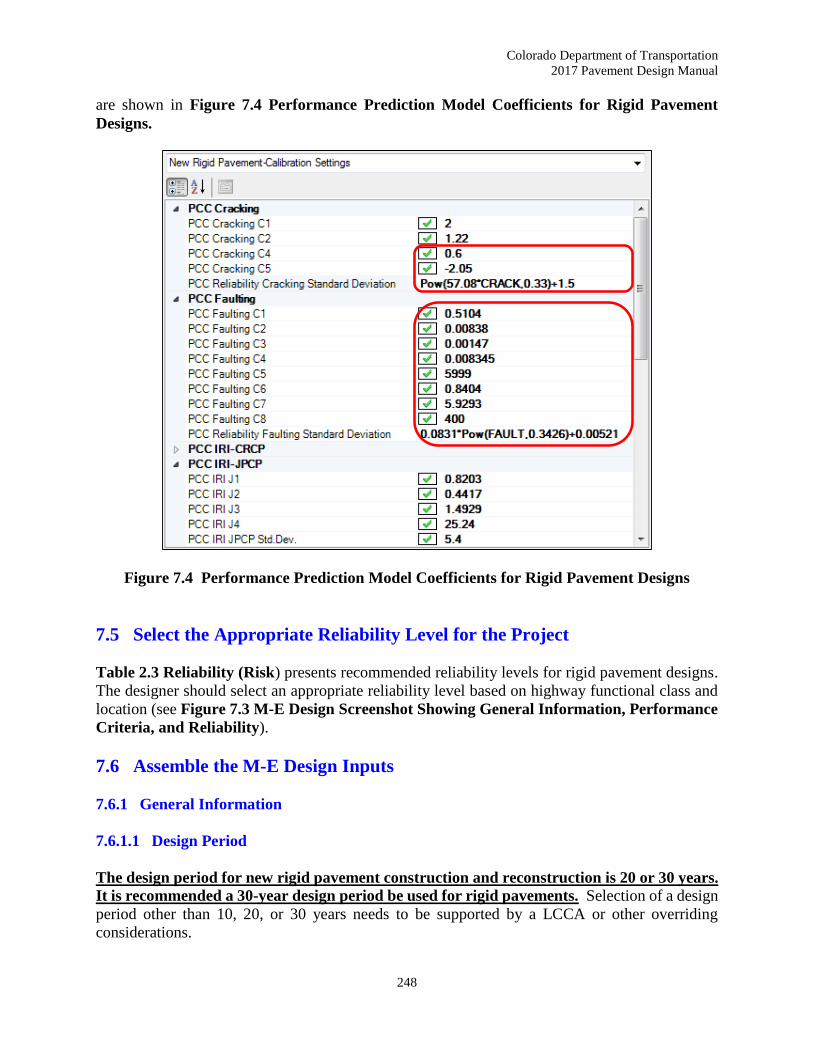
The coefficients of performance prediction models considered in the design of a rigid pavement
Colorado Department of Transportation
2017 Pavement Design Manual
248
are shown in Figure 7.4 Performance Prediction Model Coefficients for Rigid Pavement
Designs.
Figure 7.4 Performance Prediction Model Coefficients for Rigid Pavement Designs
7.5 Select the Appropriate Reliability Level for the Project
Table 2.3 Reliability (Risk) presents recommended reliability levels for rigid pavement designs.
The designer should select an appropriate reliability level based on highway functional class and
location (see Figure 7.3 M-E Design Screenshot Showing General Information, Performance
Criteria, and Reliability).
7.6 Assemble the M-E Design Inputs
7.6.1 General Information
7.6.1.1 Design Period
The design period for new rigid pavement construction and reconstruction is 20 or 30 years. It is recommended a 30-year design period be used for rigid pavements. Selection of a design
period other than 10, 20, or 30 years needs to be supported by a LCCA or other overriding
considerations.
Colorado Department of Transportation
2017 Pavement Design Manual
249
7.6.1.2 Project Timeline
The following inputs are required to specify the project timeline in the design (see Figure 7.3 M-
E Design Screenshot Showing General Information, Performance Criteria and Reliability).
Pavement construction month and year
Traffic open month and year
The designer may select the most likely month and year when the PCC surface layer is scheduled
to be placed, and when the pavement section is scheduled to be opened to traffic. Changes to the
surface layer material properties due to time and environmental conditions are considered
beginning from the construction date. Due to warping, curling and other factors, if the actual
month(s) of construction is unknown then the month of August should be used.
7.6.1.3 Identifiers
Identifiers are helpful in documenting the project location and recordkeeping. M-E Design allows
designers to enter site or project identification information, such as the location of the project
(route signage, jurisdiction, etc.), identification numbers, beginning and ending milepost, direction
of traffic, and date.
7.6.1.4 Traffic
Several inputs are required for characterizing traffic for M-E Design and are described in detail in
Section 3.1 Traffic.
7.6.1.5 Climate
The climate input requirements for M-E design are described in detail in Section 3.2 Climate.
7.6.1.6 Pavement Layer Characterization
As shown in Figure 7.1 Rigid Pavement Layers, a typical rigid pavement design comprises of
the following pavement layers: PCC, treated and/or unbound aggregate base, and subgrade. The
inputs required by the M-E Design software for characterizing these layers are described in the
following sections.
7.6.1.7 Portland Cement Concrete
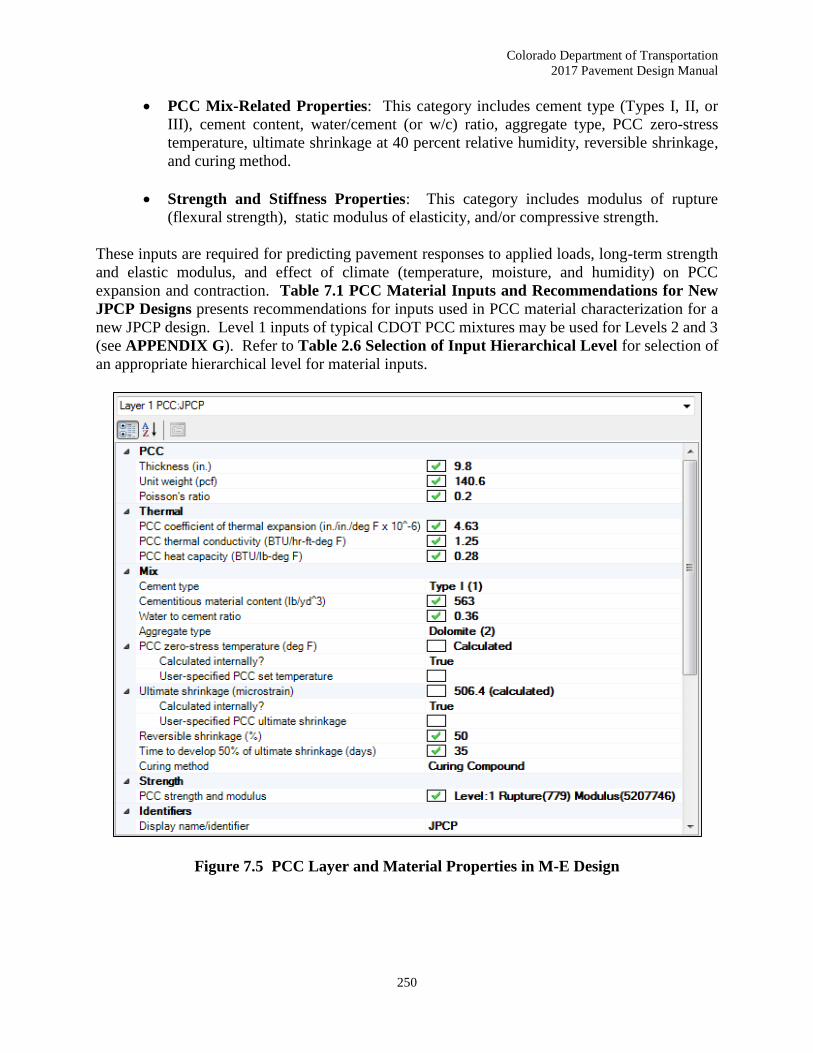
The inputs required for PCC layer characterization are divided into three categories (see Figure
7.5 PCC Layer and Material Properties in M-E Design).
General and Thermal Properties: This category includes layer thickness, Poisson's
ratio, Coefficient of Thermal Expansion (CTE), thermal conductivity, and heat
capacity.
Colorado Department of Transportation
2017 Pavement Design Manual
250
PCC Mix-Related Properties: This category includes cement type (Types I, II, or
III), cement content, water/cement (or w/c) ratio, aggregate type, PCC zero-stress
temperature, ultimate shrinkage at 40 percent relative humidity, reversible shrinkage,
and curing method.
Strength and Stiffness Properties: This category includes modulus of rupture
(flexural strength), static modulus of elasticity, and/or compressive strength.
These inputs are required for predicting pavement responses to applied loads, long-term strength
and elastic modulus, and effect of climate (temperature, moisture, and humidity) on PCC
expansion and contraction. Table 7.1 PCC Material Inputs and Recommendations for New
JPCP Designs presents recommendations for inputs used in PCC material characterization for a
new JPCP design. Level 1 inputs of typical CDOT PCC mixtures may be used for Levels 2 and 3
(see APPENDIX G). Refer to Table 2.6 Selection of Input Hierarchical Level for selection of
an appropriate hierarchical level for material inputs.
Figure 7.5 PCC Layer and Material Properties in M-E Design

Colorado Department of Transportation
2017 Pavement Design Manual
251
Table 7.1 PCC Material Inputs and Recommendations for New JPCP Design
Input Property
(Strength)
Input Hierarchy
Level 1 Level 2 Level 3
Elastic Modulus Mix specific values
(ASTM C 469)
Use typical values from
APPENDIX G. Select a
mix that is closest to the
project. Use a default
ratio of 1.20 for 20-year /
28-day strength gain of
elastic modulus and
flexural strength.
Flexural Strength Mix specific values
(AASHTO T 97)
Compressive Strength Mix specific values
(AASHTO T 22)
Unit Weight Mix specific values
(AASHTO T 121) APPENDIX G
Poisson’s Ratio Mix specific values
(ASTM C 469) APPENDIX G
Coefficient of Thermal
Expansion
Mix specific values
(AASHTO TP 60) APPENDIX G
Surface Shortwave
Absorptivity 0.85
Thermal Conductivity 1.25
Heat Capacity 0.28
Cement Type Mix specific values
Typical values from the CDOT PCC input library.
Select a mix that is closest to the project.
Cementitious Material
Content
Mix specific values
Typical values from the CDOT PCC input library.
Select a mix that is closest to the project.
Water to Cement Ratio Mix specific values
Typical values from the CDOT PCC input library.
Select a mix that is closest to the project.
Curing Method Select an appropriate method based on Section 412.14 of CDOT Standard
Specifications for Road and Bridge Construction
PCC Zero-stress
Temperature Internally calculated
Ultimate Shrinkage Internally calculated
Reversible Shrinkage 50 percent
Time to Develop 50
Percent of Ultimate
Shrinkage
35 days
7.6.1.8 Asphalt Treated Base Characterization
The asphalt treated base layer is modeled as a HMA layer. The material input requirements are
identical to those of a conventional HMA layer as described in Section 6.6.4.1 Asphalt Concrete
Colorado Department of Transportation
2017 Pavement Design Manual
252
Characterization, with an exception to indirect tensile strength and creep compliance values. For
JPCP designs, no sub-layering is done within the asphalt treated base layer.
7.6.1.9 Chemically Stabilized Base Characterization
Refer to Section 5.4.1 Characterization of Treated Base in M-E Design for treated base
characterization.
7.6.1.10 Unbound Material Layers and Subgrade Characterization
Refer to Section 5.3.1 Unbound Layer Characterization in M-E Design for unbound aggregate
base layer characterization; and refer to Section 4.4 Subgrade Characterization for M-E Design
for subgrade characterization.
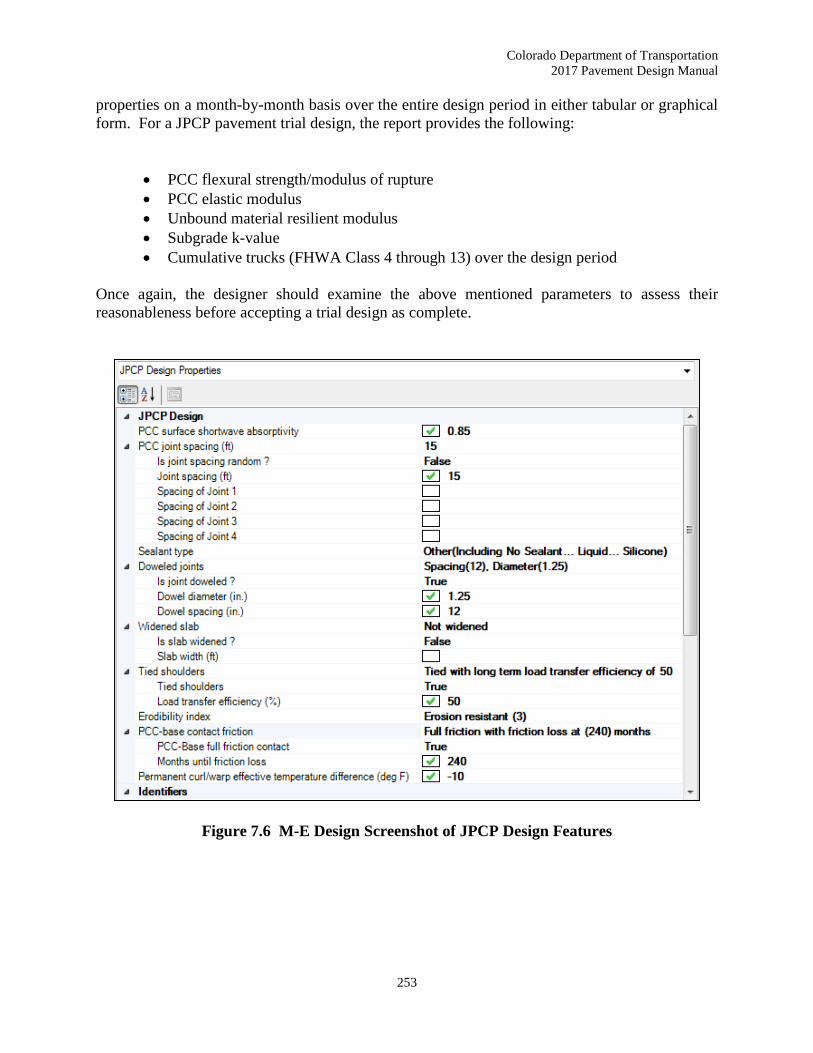
7.6.2 JPCP Design Features
JPCP design features and construction practices influence long-term performance. The common
design features considered in M-E Design (see Figure 7.6 M-E Design Screenshot of JPCP
Design Features) include the following:
Surface shortwave absorptivity: Refer to Table 7.1 PCC Material Inputs and
Recommendations for New JPCP Design
Joint spacing: Refer to Section 7.10 Joint Spacing (L)
PCC-base contact friction: Refer to Section 7.11 Slab/Base Friction
Permanent curl/warp effective temperature difference: Refer to Section 7.12 Effective
Temperature Differential (°F)
Widened slab: Refer to Section 7.14 Lane Edge Support Condition
Dowel bars: Refer to Section 7.13 Dowel Bars (Load Transfer Devices) and Tie
Bars
Tied shoulders: Refer to Section 7.13 Dowel Bars (Load Transfer Devices) and Tie
Bars and Section 7.14 Lane Edge Support Condition
Base type and erodibility index: Refer to Section 7.15 Base Erodibility
Sealant type: Refer to Section 7.16 Sealant Type
7.7 Run M-E Design
Designers should examine all inputs for accuracy and reasonableness prior to running M-E Design.
The designer will run the software to obtain outputs required for evaluating whether the trial design
is adequate. After a trial run has been successfully completed, M-E Design will generate a report
in form of a PDF and/or Microsoft Excel file, see Figure 7.7 Sample Rigid Pavement Design
PDF Output Report. The report contains the following information: inputs, reliability of design,
materials and other properties, and predicted performance.
After the trial run is complete, the designer should examine all inputs and outputs for accuracy and
reasonableness. The output report also includes the estimates of material properties and other
Colorado Department of Transportation
2017 Pavement Design Manual
253
properties on a month-by-month basis over the entire design period in either tabular or graphical
form. For a JPCP pavement trial design, the report provides the following:
PCC flexural strength/modulus of rupture
PCC elastic modulus
Unbound material resilient modulus
Subgrade k-value
Cumulative trucks (FHWA Class 4 through 13) over the design period
Once again, the designer should examine the above mentioned parameters to assess their
reasonableness before accepting a trial design as complete.
Figure 7.6 M-E Design Screenshot of JPCP Design Features
Colorado Department of Transportation
2017 Pavement Design Manual
254
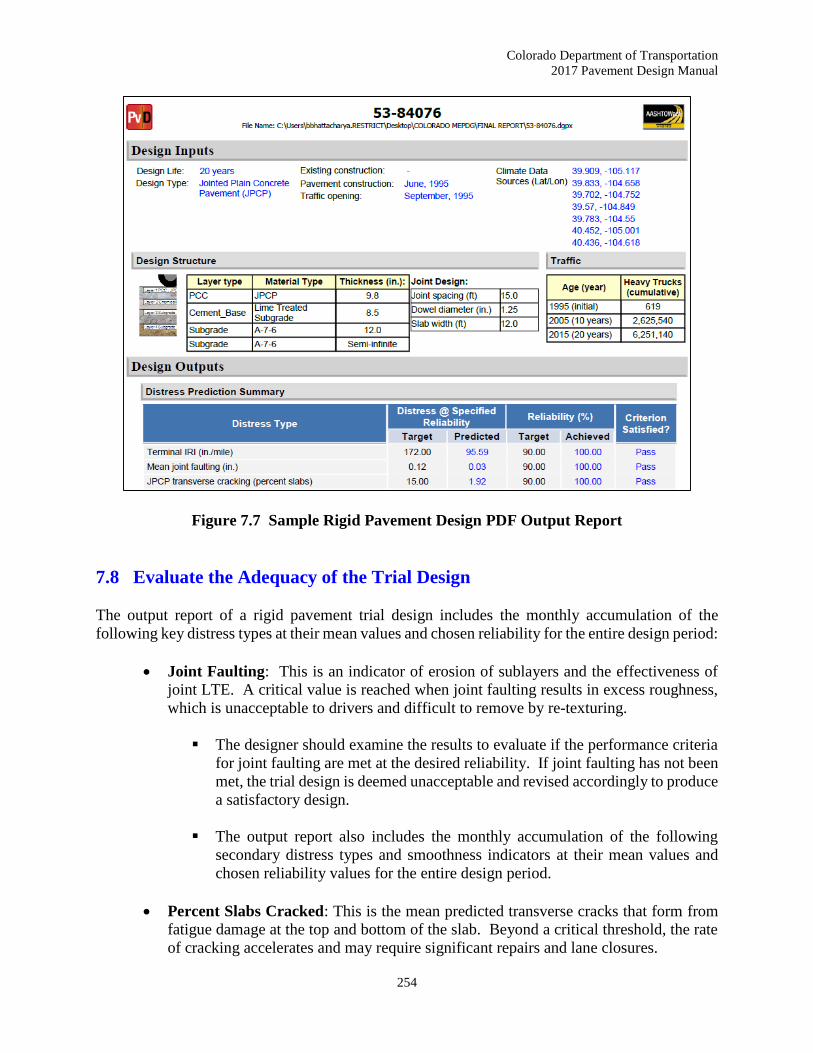
Figure 7.7 Sample Rigid Pavement Design PDF Output Report
7.8 Evaluate the Adequacy of the Trial Design
The output report of a rigid pavement trial design includes the monthly accumulation of the
following key distress types at their mean values and chosen reliability for the entire design period:
Joint Faulting: This is an indicator of erosion of sublayers and the effectiveness of
joint LTE. A critical value is reached when joint faulting results in excess roughness,
which is unacceptable to drivers and difficult to remove by re-texturing.
The designer should examine the results to evaluate if the performance criteria
for joint faulting are met at the desired reliability. If joint faulting has not been
met, the trial design is deemed unacceptable and revised accordingly to produce
a satisfactory design.
The output report also includes the monthly accumulation of the following
secondary distress types and smoothness indicators at their mean values and
chosen reliability values for the entire design period.
Percent Slabs Cracked: This is the mean predicted transverse cracks that form from
fatigue damage at the top and bottom of the slab. Beyond a critical threshold, the rate
of cracking accelerates and may require significant repairs and lane closures.

Colorado Department of Transportation
2017 Pavement Design Manual
255
IRI: This is a function of joint faulting and slab cracking along with climate and
subgrade factors. A high IRI indicates unacceptable ride quality.
The designer should examine the results to evaluate if the performance criteria
for percent slabs cracked and IRI meet the minimum of 27 years at the desired
reliability.
If any of the criteria have not been met, the trial design is deemed unacceptable
and revised accordingly to produce a satisfactory design.
Another important output is the reliability levels of each performance indicator at the end of the
design period. If the reliability value predicted for the given performance indicator is greater than
the target/desired value, the trial design passes for that indicator. If the reverse is true, then the
trial design fails to provide the desired confidence and performance indicator will not reach the
critical value during the pavement’s design life. In such an event, the designer needs to alter the
trial design to correct the problem.
The strategies for modifying a trial design are discussed in Section 7.9 Modifying Trial Designs.
The designer can use a range of thicknesses to optimize the trial design and make it more
acceptable. Additionally, the software allows the designer to perform a sensitivity analysis for key
inputs. The results of the sensitivity analysis can be used to further optimize the trial design if
modifying PCC thickness alone does not produce a feasible design alternative. A detail description
of the thickness optimization procedure and sensitivity analysis is provided in the Software HELP
Manual.
7.9 Modifying Trial Designs
An unsuccessful trial design may require revisions to ensure all performance criteria are satisfied.
The trial design is revised by systematically modifying the design inputs. The design acceptance
in M-E Design is distress-specific; in other words, the designer needs to first identify the
performance indicator that failed to meet the performance targets and modify one or more design
inputs that has a significant impact on a given performance indicator accordingly. The impact of
design inputs on performance indicators is typically obtained by performing a sensitivity analysis.
The strategies to produce a satisfactory design by modifying design inputs can be broadly
categorized into:
Pavement layer considerations:
Increasing layer thickness
Modifying layer type and layer arrangement
Foundation improvements
Pavement material improvements:
Use of higher quality materials
Material design modifications
Construction quality

Colorado Department of Transportation
2017 Pavement Design Manual
256
Remember, when modifying the design inputs, the designer needs to be aware of input sensitivity
to various distress types. Changing a single input to reduce one distress may result in an increase
in another distress. Table 7.2 Modifying Rigid Pavement Trial Designs presents a summary of
inputs that may be modified to optimize trial designs and produce a feasible design alternative.
Table 7.2 Modifying Rigid Pavement Trial Designs
Distress/IRI Design Inputs that Impact
Transverse
Cracking
Increase slab thickness
Increase PCC strength
Minimize permanent curl/warp through curing procedures that eliminate
built-in temperature gradient
PCC tied shoulder (separate placement or monolithic placement).
Widened slab (1 to 2 feet)
Use PCC with a lower coefficient of thermal expansion
Joint Faulting
Increase slab thickness
Reduce joint width over analysis period
Increase erosion resistance of base (specific recommendations for each
type of base)
Minimize permanent curl/warp through curing procedures that eliminate
built-in temperature gradient
PCC tied shoulder
Widened slab (1 to 2 feet)
IRI
Require more stringent smoothness criteria and greater incentives
Increase slab thickness
Ensure PCC has proper entrained air content
Decrease joint spacing
Widen the traffic lane slab by 2 feet
Use a treated base (if nonstabilized dense graded aggregate was
specified)
Increase diameter of dowels
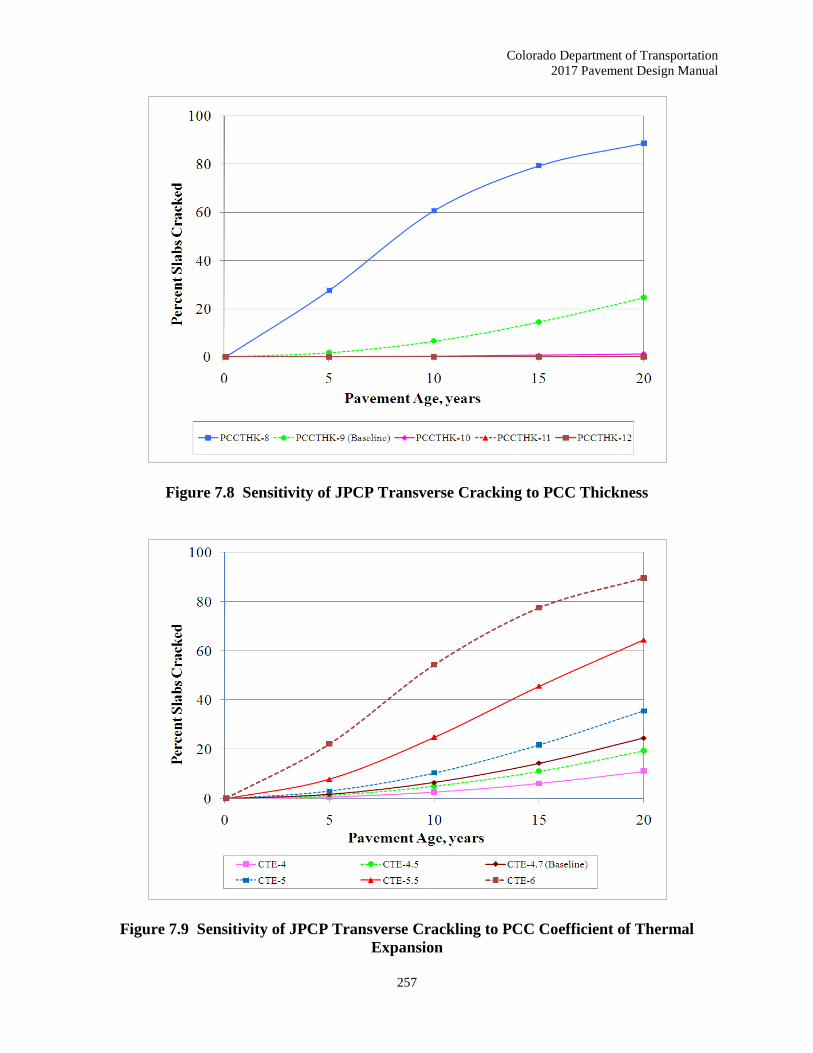
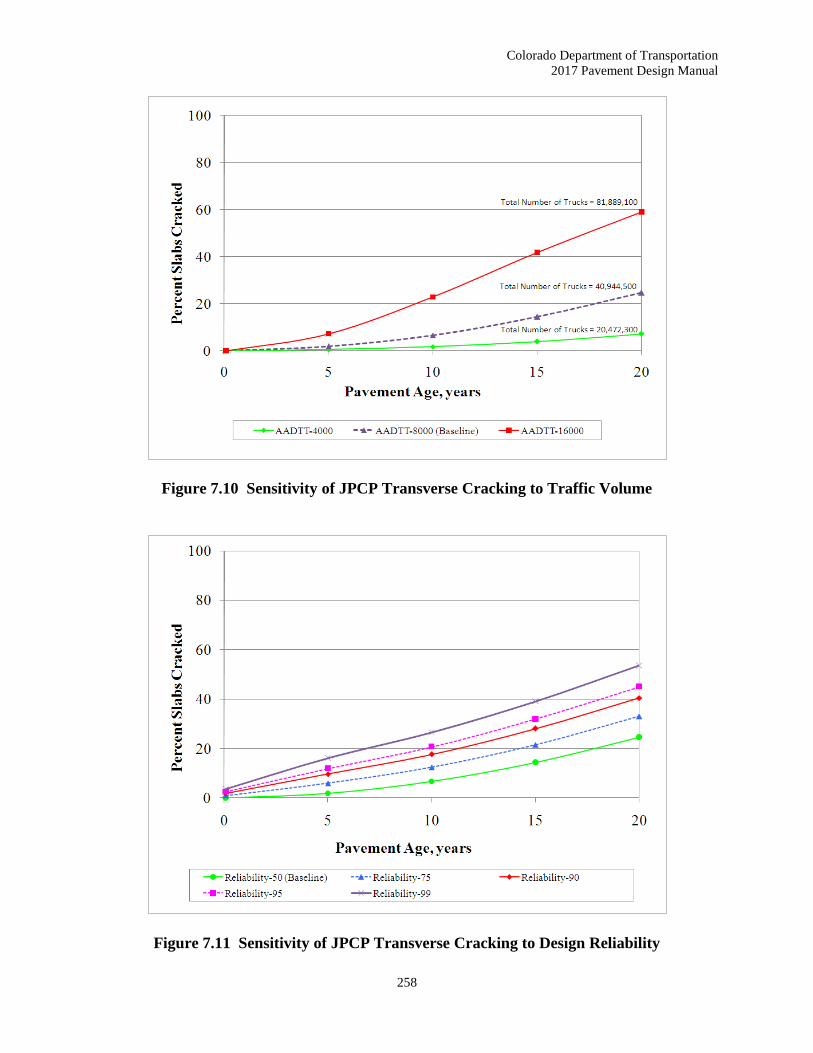
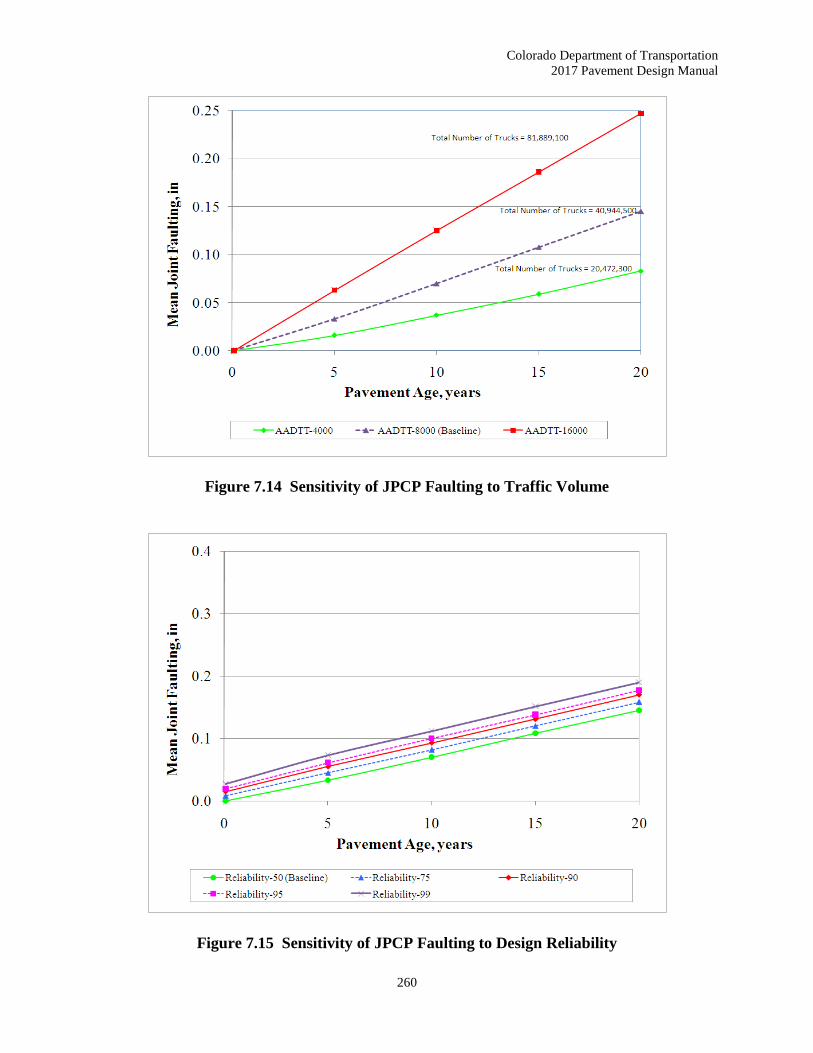
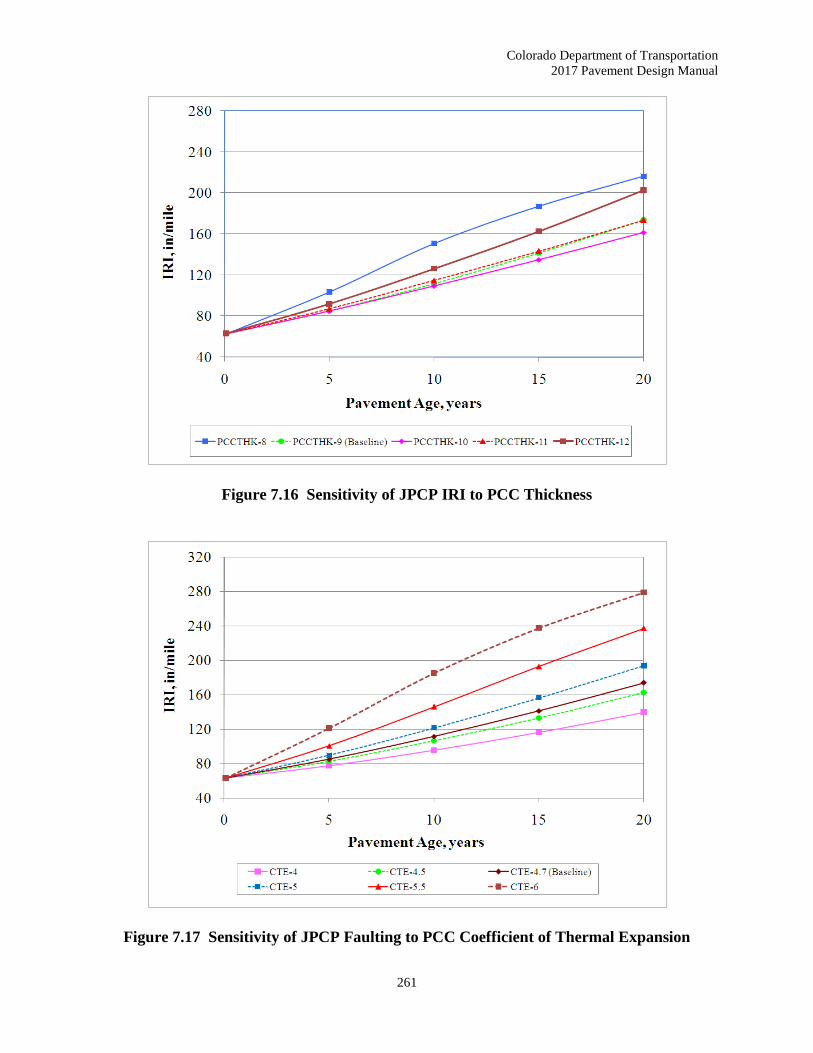
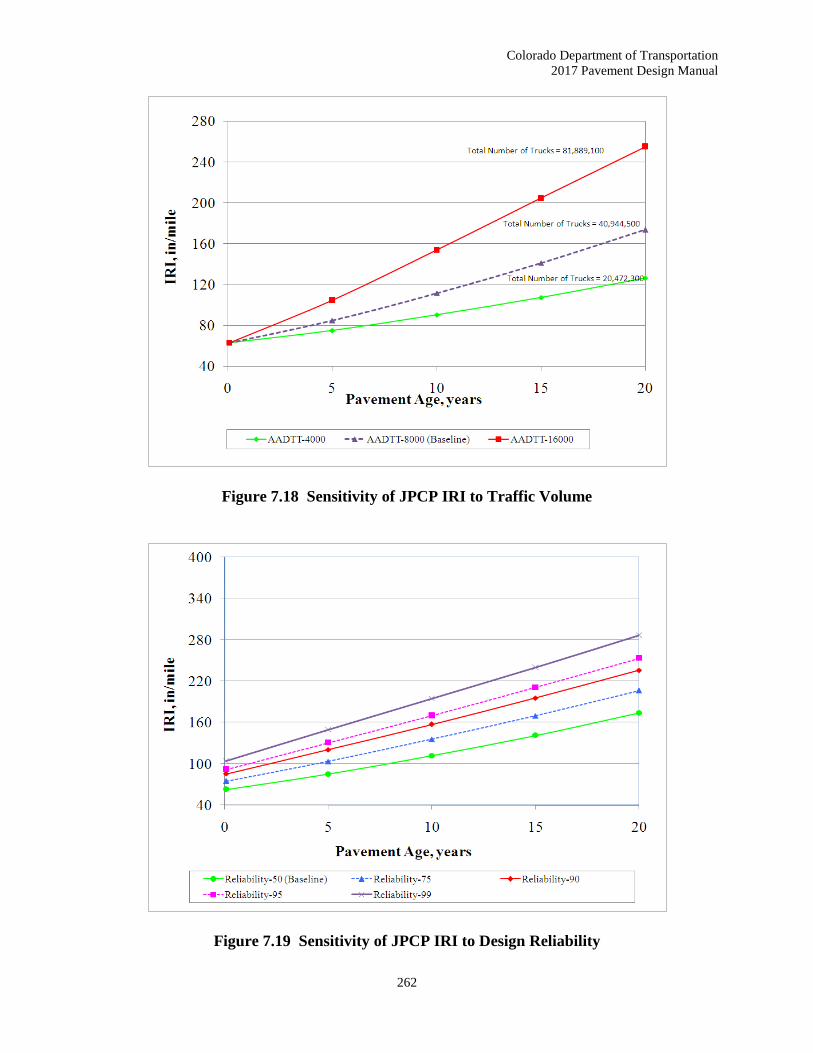
Figure 7.8 Sensitivity of JPCP Transverse Cracking to PCC Thickness through Figure 7.19
Sensitivity of JPCP IRI to Design Reliability presents sensitivity plots of a sample rigid
pavement trial design showing the effects of key inputs, such as traffic volume, PCC thickness,
PCC coefficient of thermal expansion, and design reliability on key distresses. Note: The plots do
not cover the effects of all key factors on rigid pavement performance; other significant factors are
not shown herein.
Colorado Department of Transportation
2017 Pavement Design Manual
257
Figure 7.8 Sensitivity of JPCP Transverse Cracking to PCC Thickness
Figure 7.9 Sensitivity of JPCP Transverse Crackling to PCC Coefficient of Thermal
Expansion
Colorado Department of Transportation
2017 Pavement Design Manual
258
Figure 7.10 Sensitivity of JPCP Transverse Cracking to Traffic Volume
Figure 7.11 Sensitivity of JPCP Transverse Cracking to Design Reliability

Colorado Department of Transportation
2017 Pavement Design Manual
259
Figure 7.12 Sensitivity of JPCP Faulting to PCC Thickness
Figure 7.13 Sensitivity of JPCP Faulting to PCC Coefficient of Thermal Expansion
Colorado Department of Transportation
2017 Pavement Design Manual
260
Figure 7.14 Sensitivity of JPCP Faulting to Traffic Volume
Figure 7.15 Sensitivity of JPCP Faulting to Design Reliability
Colorado Department of Transportation
2017 Pavement Design Manual
261
Figure 7.16 Sensitivity of JPCP IRI to PCC Thickness
Figure 7.17 Sensitivity of JPCP Faulting to PCC Coefficient of Thermal Expansion
Colorado Department of Transportation
2017 Pavement Design Manual
262
Figure 7.18 Sensitivity of JPCP IRI to Traffic Volume
Figure 7.19 Sensitivity of JPCP IRI to Design Reliability
Colorado Department of Transportation
2017 Pavement Design Manual
263
7.10 Joint Spacing (L)
In general, the spacing of both transverse and longitudinal contraction joints depends on local
conditions of materials and environment, whereas expansion and contraction joints are primarily
dependent on layout and construction capabilities. For contraction joints, when a positive
temperature gradient, or base frictional resistance increases; the spacing increases as the concrete
tensile strength increases. Spacing is also related to the slab thickness and joint sealant capabilities.
Determination of the required slab thickness includes an input for joint spacing. As joint spacing
increases, stresses due to thermal curling and moisture warping increase. CDOT designs their
PCCP using the Jointed Plain Concrete Pavement (JPCP) method. For a detailed illustration, see
CDOT’s current Standard Plan Sheet M-412-1. CDOT uses a joint spacing of 15 feet maximum
for concrete pavement thicknesses over 6 inches, 12 feet maximum for concrete thicknesses
of 6 inches or less, and a minimum of 8 feet for any full depth pavement.
7.11 Slab/Base Friction
The time over which full contact friction exists between the PCC slab and the underlying layer
(usually the base course) is an input in M-E Design. This factor indicates (1) whether or not the
PCC slab/base interface has full friction at construction, and (2) how long full friction will be
available at the interface if present after construction. This factor is a significant input in JPCP
cracking predictions since a monolithic slab/base structure is obtained when full friction exists at
the interface.
Global calibration of JPCP performance prediction models show full contact friction exists over
the life of the pavements for all base types, with the exception of cement treated or lean concrete
base. Therefore, it is recommended the designer set the “months to full contact friction” between
the JPCP and the base course equal to the design life of the pavement for unbound aggregate,
asphalt stabilized, and cementitious stabilized base courses.
For cement treated or lean concrete base, the months of full contact friction may be reduced if
attempts are made to debond the base from the PCC slab. The age at which debonding occurs can
be confirmed through construction specifications and/or historical records. If no efforts are made
to debond the interface, the designer is recommended to use 10 years of full interface friction.
The inputs required for M-E Design software are as follows:
Presence or absence of PCC-Base full-friction contact
Months until friction loss
Use the design life (in months) for asphalt treated and aggregate base types
Use 120 months for lean concrete and cement treated base
Colorado Department of Transportation
2017 Pavement Design Manual
264
7.12 Effective Temperature Differential (°F)
An effective temperature differential includes the effects of temperature, precipitation, and wind.
Wind is considered because if moist, it has an influence on the surface. Wind may be drier at the
surface of the slab creating a larger differential. The same concept may be applied to temperature
differences.
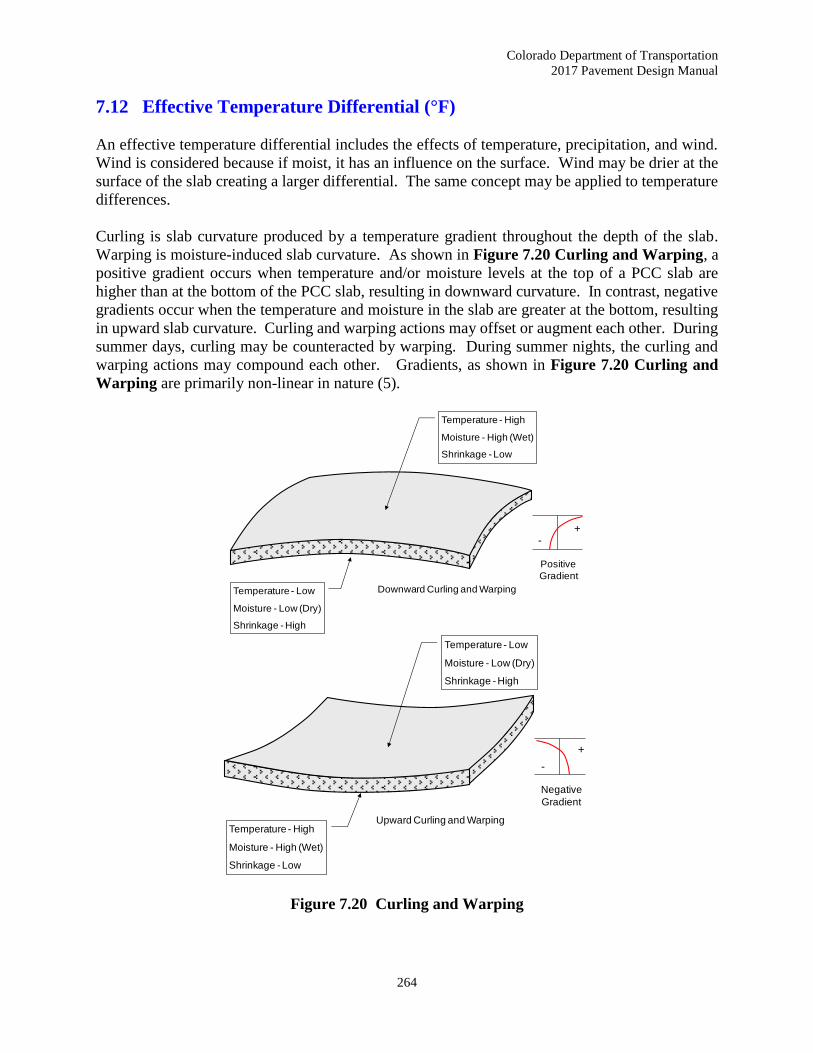
Curling is slab curvature produced by a temperature gradient throughout the depth of the slab.
Warping is moisture-induced slab curvature. As shown in Figure 7.20 Curling and Warping, a
positive gradient occurs when temperature and/or moisture levels at the top of a PCC slab are
higher than at the bottom of the PCC slab, resulting in downward curvature. In contrast, negative
gradients occur when the temperature and moisture in the slab are greater at the bottom, resulting
in upward slab curvature. Curling and warping actions may offset or augment each other. During
summer days, curling may be counteracted by warping. During summer nights, the curling and
warping actions may compound each other. Gradients, as shown in Figure 7.20 Curling and
Warping are primarily non-linear in nature (5).
Figure 7.20 Curling and Warping
Temperature - High
Moisture - High (Wet)
Shrinkage - Low
Temperature - Low
Moisture - Low (Dry)
Shrinkage - High
Positive
Gradient
+-
Downward Curling and Warping
Temperature - Low
Moisture - Low (Dry)
Shrinkage - High
Temperature - High
Moisture - High (Wet)
Shrinkage - Low
Negative
Gradient
+
-
Upward Curling and Warping
Colorado Department of Transportation
2017 Pavement Design Manual
265
The magnitude of thermal and moisture gradients within a pavement are influenced by factors of
daily temperature and relative humidity conditions, base layer type, slab geometry with constraints,
shrinkage characteristics, and concrete mixture characteristics. The key characteristics of concrete
mixtures that influence pavement response to thermal gradients are the coefficient of thermal
expansion, thermal conductivity, and specific heat (5).
Paving operations are often performed during the morning and daytime of hot sunny days, a
condition that tends to expose the newly paved slabs to a high temperature differential from the
intense solar radiation and heat of hydration. Depending on the exposure conditions, a significant
amount of positive temperature gradient may be present at the time of hardening. On the other
hand, shrinkage occurs when the surface drying and bottom moisture wicken into the base/subbase.
This resultant condition has been termed the "zero-stress temperature gradient" and is permanently
locked into the slab at the time of construction. The permanent components of curling and warping
are considered together and are indistinguishable. Creep occurs over time and negates the effects
of the permanent curvature, but only a portion of the permanent curling and warping actually
affects the long term pavement response (7). Refer to CDOT Final Research Report
CDOT-DTD-R-2006-9, Implementation of Proven PCCP Practices in Colorado, dated April 2006
(8) for additional discussion on curling.
M-E Design’s recommended value for permanent curl/warp is -10°F (obtained through
optimization) for all new and reconstructed rigid pavements in all climatic regions. This is an
equivalent linear temperature difference from top to bottom of the slab.
7.13 Dowel Bars (Load Transfer Devices) and Tie Bars
Load transfer is used to account for the ability of a concrete pavement structure to transfer
(distribute) load across discontinuities, such as joints or cracks. Load transfer devices, aggregate
interlock, and the presence of tied longitudinal joints along with tied shoulders all have an effect.
All new rigid pavements, new construction and reconstruction, including ramps, auxiliary lanes,
acceleration/deceleration lanes, and urban streets will require epoxy coated smooth dowel bars in
the transverse joints for load transfer. Smooth dowel bars aid the transfer of load across joints and
allow thermal contraction in the PCCP. Since these transverse joints must be allowed to expand
and contract, deformed tie bars should never be used as load transfer devices in the transverse
direction. Most pavements should be dowelled.
If the pavement has shoulders, the shoulders must be portland cement concrete and tied to the
travel lanes. Two major advantages of using tied portland cement concrete shoulders is the
reduction of slab stress and increased service life. Concrete shoulders of three feet or greater may
be considered a tied shoulder. Pavements with monolithic or tied curb and gutter that provide
additional stiffness and keep traffic away from the edge may be treated as a tied shoulder. Studies
have shown that on interstate projects, increasing the outside slab an additional two feet is
equivalent to a tied shoulder. In a typical situation with 12-foot lane widths, the paint stripe is
placed at 12 feet and the longitudinal joint is sawed and tied at 14 feet. Requiring the longitudinal
joint to coincide with the lane line is recommended in urban locations. 14-foot longitudinal joints
Colorado Department of Transportation
2017 Pavement Design Manual
266
may not be appropriate for ramps, since ramps are usually much thinner in comparison to the main
line pavement.
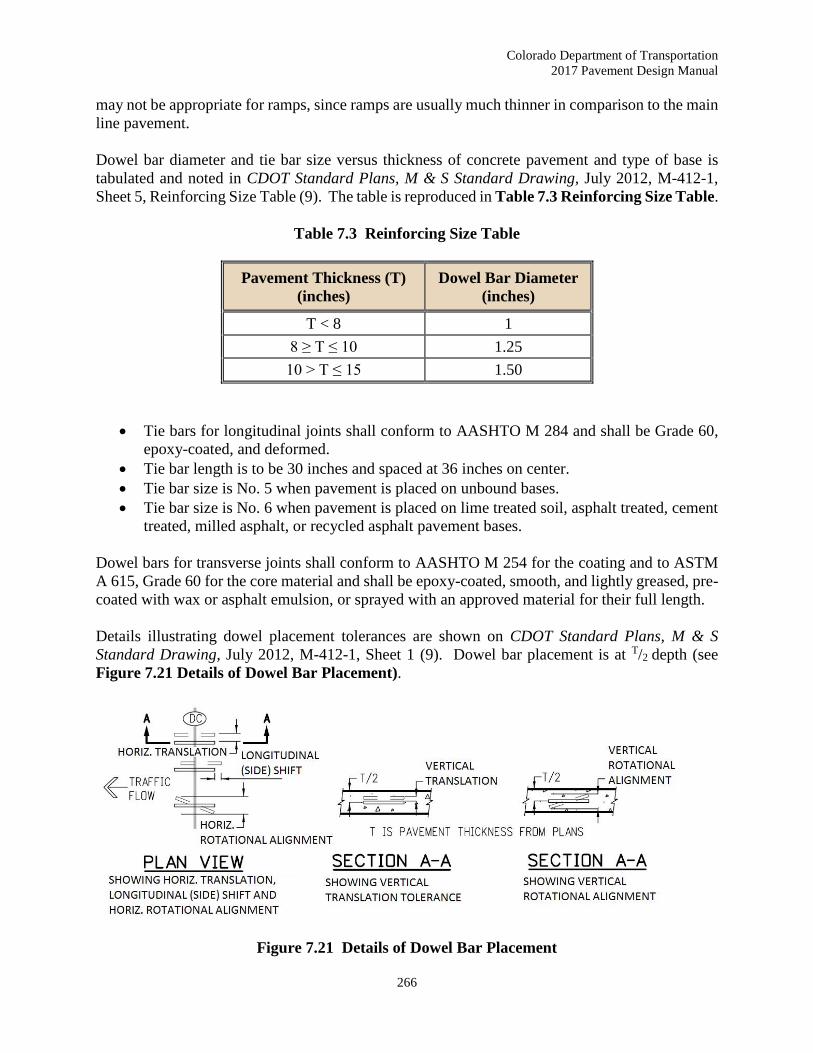
Dowel bar diameter and tie bar size versus thickness of concrete pavement and type of base is
tabulated and noted in CDOT Standard Plans, M & S Standard Drawing, July 2012, M-412-1,
Sheet 5, Reinforcing Size Table (9). The table is reproduced in Table 7.3 Reinforcing Size Table.
Table 7.3 Reinforcing Size Table
Pavement Thickness (T)
(inches)
Dowel Bar Diameter
(inches)
T < 8 1
8 ≥ T ≤ 10 1.25
10 > T ≤ 15 1.50
Tie bars for longitudinal joints shall conform to AASHTO M 284 and shall be Grade 60,
epoxy-coated, and deformed.
Tie bar length is to be 30 inches and spaced at 36 inches on center.
Tie bar size is No. 5 when pavement is placed on unbound bases.
Tie bar size is No. 6 when pavement is placed on lime treated soil, asphalt treated, cement
treated, milled asphalt, or recycled asphalt pavement bases.
Dowel bars for transverse joints shall conform to AASHTO M 254 for the coating and to ASTM
A 615, Grade 60 for the core material and shall be epoxy-coated, smooth, and lightly greased, pre-
coated with wax or asphalt emulsion, or sprayed with an approved material for their full length.
Details illustrating dowel placement tolerances are shown on CDOT Standard Plans, M & S
Standard Drawing, July 2012, M-412-1, Sheet 1 (9). Dowel bar placement is at T/2 depth (see
Figure 7.21 Details of Dowel Bar Placement).
Figure 7.21 Details of Dowel Bar Placement

Colorado Department of Transportation
2017 Pavement Design Manual
267
The tolerances are referenced in Subsection 412.13 of the CDOT Standard Specification for Road
and Bridge Construction, 2011 (23) and as revised. The tolerance table is reproduced in Table
7.4 Dowel Bar Target Placement Tolerances. Tolerances are based on NCHRP Report 637,
Guidelines for Dowel Alignment in Concrete Pavements (22).
Table 7.4 Dowel Bar Target Placement Tolerances
Position Tolerance
(inches)
Horizontal and Vertical Translation 1
Longitudinal (Side) Shift Translation 3
Horizontal and Vertical Rotational Alignment 1.5
For tied concrete shoulders, M-E Design requires the input of the long-term or terminal deflection
load transfer efficiency (LTE) between the lane (PCC outer lane slab) and shoulder’s longitudinal
joint. The LTE is defined as the ratio of deflections of the unloaded and loaded slabs. The higher
the LTE, the greater the support provided by the shoulder to reduce critical responses of the
mainline slabs. Typical long-term deflection LTE are:
50 to 70 percent for a monolithically constructed and tied PCC shoulder
30 to 50 percent for a separately constructed tied PCC shoulder
Untied concrete shoulders or other shoulder types that do not provide significant
support, therefore a low LTE value should be used.
7.14 Lane Edge Support Condition (E)
Conventional lane width (12 feet) with free edge
Conventional lane width (12 feet) with tied concrete shoulder
Wide slab (i.e. 14 feet) with conventional traffic lane width (12 feet)
Refer to CDOT Final Research Report CDOT-DTD-R-2006-9, Implementation of Proven PCCP
Practices in Colorado, dated April 2006 (8), and Evaluation of Premature PCCP Longitudinal
Cracking in Colorado, Final Research Report CDOT-DTD-R-2003-1, dated January 2003 (11) for
additional discussion on widen slabs.
7.15 Base Erodibility
The erodibility index allows the designer to select the base’s resistance to erosion. The potential
for base or subbase erosion (layer directly beneath the PCC layer) has a significant impact on the
initiation and propagation of pavement distress. Different base types are classified based on long-
term erodibility behavior as follows:
Class 1: Extremely erosion resistant materials
Class 2: Very erosion resistant materials
Colorado Department of Transportation
2017 Pavement Design Manual
268
Class 3: Erosion resistant materials
Class 4: Fairly erodible materials
Class 5: Very erodible materials
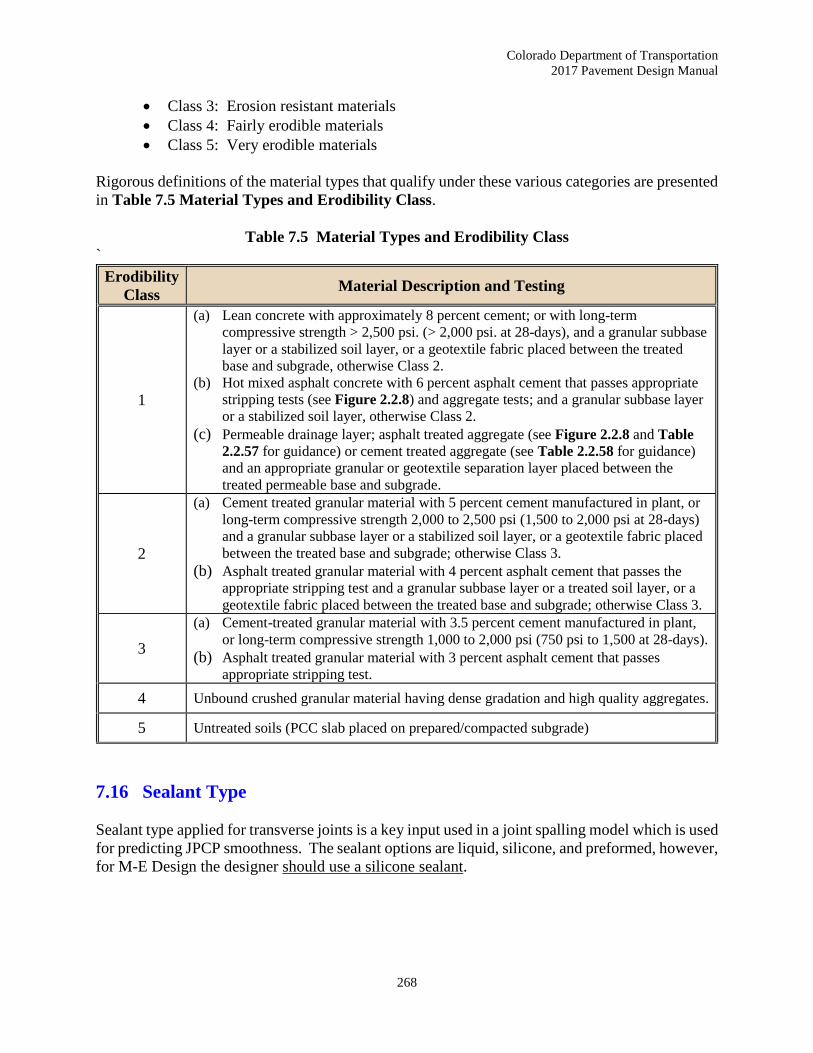
Rigorous definitions of the material types that qualify under these various categories are presented
in Table 7.5 Material Types and Erodibility Class.
Table 7.5 Material Types and Erodibility Class
`
Erodibility
Class Material Description and Testing
1
(a) Lean concrete with approximately 8 percent cement; or with long-term
compressive strength > 2,500 psi. (> 2,000 psi. at 28-days), and a granular subbase
layer or a stabilized soil layer, or a geotextile fabric placed between the treated
base and subgrade, otherwise Class 2.
(b) Hot mixed asphalt concrete with 6 percent asphalt cement that passes appropriate
stripping tests (see Figure 2.2.8) and aggregate tests; and a granular subbase layer
or a stabilized soil layer, otherwise Class 2.
(c) Permeable drainage layer; asphalt treated aggregate (see Figure 2.2.8 and Table
2.2.57 for guidance) or cement treated aggregate (see Table 2.2.58 for guidance)
and an appropriate granular or geotextile separation layer placed between the
treated permeable base and subgrade.
2
(a) Cement treated granular material with 5 percent cement manufactured in plant, or
long-term compressive strength 2,000 to 2,500 psi (1,500 to 2,000 psi at 28-days)
and a granular subbase layer or a stabilized soil layer, or a geotextile fabric placed
between the treated base and subgrade; otherwise Class 3.
(b) Asphalt treated granular material with 4 percent asphalt cement that passes the
appropriate stripping test and a granular subbase layer or a treated soil layer, or a
geotextile fabric placed between the treated base and subgrade; otherwise Class 3.
3
(a) Cement-treated granular material with 3.5 percent cement manufactured in plant,
or long-term compressive strength 1,000 to 2,000 psi (750 psi to 1,500 at 28-days).
(b) Asphalt treated granular material with 3 percent asphalt cement that passes
appropriate stripping test.
4 Unbound crushed granular material having dense gradation and high quality aggregates.
5 Untreated soils (PCC slab placed on prepared/compacted subgrade)
7.16 Sealant Type
Sealant type applied for transverse joints is a key input used in a joint spalling model which is used
for predicting JPCP smoothness. The sealant options are liquid, silicone, and preformed, however,
for M-E Design the designer should use a silicone sealant.

Colorado Department of Transportation
2017 Pavement Design Manual
269
7.17 Concrete Pavement Minimum Thickness
The minimum thickness requirement may be changed on a project to project bases depending on
traffic, soil conditions, bases, etc. (see Table 7.6 Minimum Thickness for Highways, Roadways
and Bicycle Paths).
Table 7.6 Minimum Thicknesses for Highways, Roadways, and Bicycle Paths
Design Truck Traffic Portland Cement Concrete
Pavement (inches)
Greater than 1,000,000 8.0
Less than or equal to 1,000,000 for driveways, multi-use
sidewalks, bicycle paths, and maintenance pavement 6.0
Sidewalks (pedestrian only) 1 4.0
Note: 1 Per Standard Plan No. M-609-1, Curb, Gutters and Sidewalks of CDOT’s M&S Standards, July 2012.
7.18 Concrete Pavement Texturing, Stationing, and Rumble Strips
Texture: Final surface of the pavement shall be uniformly textured with a broom, burlap
drag, artificial turf, or diamond ground to obtain a specified average texture depth of the
panel being greater than 0.05 inches. Refer to CDOT Final Research Report CDOT-2012-
10, Assessment of Concrete Pavement Texturing Methodologies in Colorado, dated
October 2012 (25), and CDOT Final Research Report CDOT-DTD-R-2005-22, PCCP
Texturing Methods, dated January 2005 (12).
Stationing: Stationing shall be stamped into the outside edge of the pavement at 500-foot
intervals on each outside mainline shoulder as shown on CDOT Standard Plans, M & S
Standard Drawing, July 2012, Standard Plan No. M-412-1, Concrete Pavement Joints.
Rumble Strips: When rumble strips are installed, they shall be of the style and location
as shown on CDOT Standard Plans, M & S Standard Drawing, July 2012, Standard Plan
Sheet No. M-614-1, Rumble Strips.
7.19 Concrete Pavement Materials Selection
Concrete pavement is a construction paving material that consists of cement (commonly portland
cement), other cementitious materials (fly ash), aggregate (gravel and sand), water, and chemical
admixtures. The concrete solidifies and hardens after mixing and placement due to a chemical
process known as hydration. The water reacts with cement, which bonds the other components
together, eventually creating a hard stone-like material.
Colorado Department of Transportation
2017 Pavement Design Manual
270
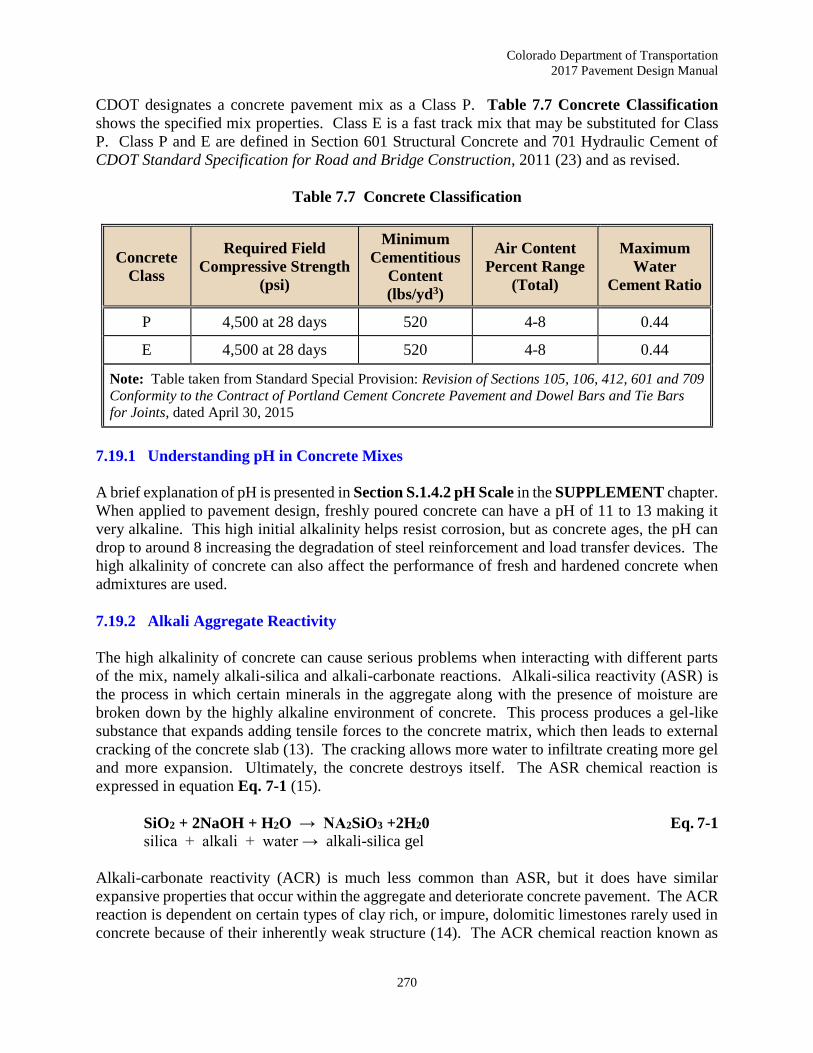
CDOT designates a concrete pavement mix as a Class P. Table 7.7 Concrete Classification
shows the specified mix properties. Class E is a fast track mix that may be substituted for Class
P. Class P and E are defined in Section 601 Structural Concrete and 701 Hydraulic Cement of
CDOT Standard Specification for Road and Bridge Construction, 2011 (23) and as revised.
Table 7.7 Concrete Classification
Concrete
Class
Required Field
Compressive Strength
(psi)
Minimum
Cementitious
Content
(lbs/yd3)
Air Content
Percent Range
(Total)
Maximum
Water
Cement Ratio
P 4,500 at 28 days 520 4-8 0.44
E 4,500 at 28 days 520 4-8 0.44
Note: Table taken from Standard Special Provision: Revision of Sections 105, 106, 412, 601 and 709
Conformity to the Contract of Portland Cement Concrete Pavement and Dowel Bars and Tie Bars
for Joints, dated April 30, 2015
7.19.1 Understanding pH in Concrete Mixes
A brief explanation of pH is presented in Section S.1.4.2 pH Scale in the SUPPLEMENT chapter.
When applied to pavement design, freshly poured concrete can have a pH of 11 to 13 making it
very alkaline. This high initial alkalinity helps resist corrosion, but as concrete ages, the pH can
drop to around 8 increasing the degradation of steel reinforcement and load transfer devices. The
high alkalinity of concrete can also affect the performance of fresh and hardened concrete when
admixtures are used.
7.19.2 Alkali Aggregate Reactivity
The high alkalinity of concrete can cause serious problems when interacting with different parts
of the mix, namely alkali-silica and alkali-carbonate reactions. Alkali-silica reactivity (ASR) is
the process in which certain minerals in the aggregate along with the presence of moisture are
broken down by the highly alkaline environment of concrete. This process produces a gel-like
substance that expands adding tensile forces to the concrete matrix, which then leads to external
cracking of the concrete slab (13). The cracking allows more water to infiltrate creating more gel
and more expansion. Ultimately, the concrete destroys itself. The ASR chemical reaction is
expressed in equation Eq. 7-1 (15).
SiO2 + 2NaOH + H2O → NA2SiO3 +2H20 Eq. 7-1
silica + alkali + water → alkali-silica gel
Alkali-carbonate reactivity (ACR) is much less common than ASR, but it does have similar
expansive properties that occur within the aggregate and deteriorate concrete pavement. The ACR
reaction is dependent on certain types of clay rich, or impure, dolomitic limestones rarely used in
concrete because of their inherently weak structure (14). The ACR chemical reaction known as
Colorado Department of Transportation
2017 Pavement Design Manual
271
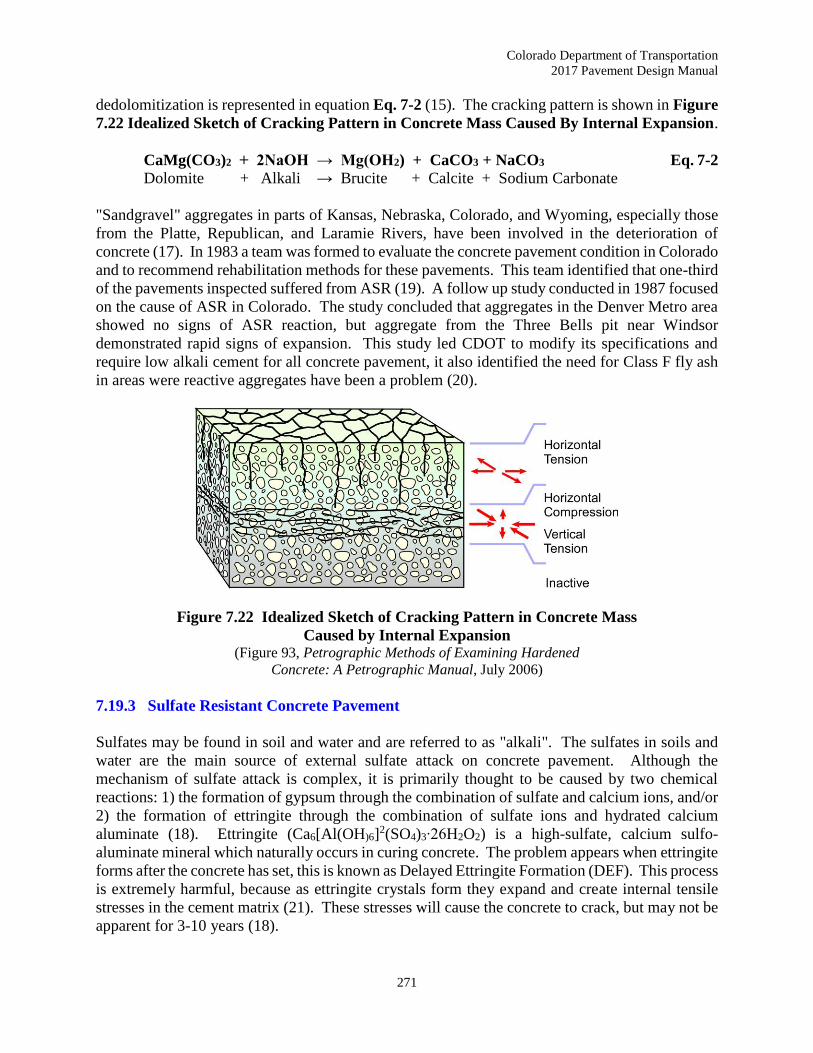
dedolomitization is represented in equation Eq. 7-2 (15). The cracking pattern is shown in Figure
7.22 Idealized Sketch of Cracking Pattern in Concrete Mass Caused By Internal Expansion.
CaMg(CO3)2 + 2NaOH → Mg(OH2) + CaCO3 + NaCO3 Eq. 7-2
Dolomite + Alkali → Brucite + Calcite + Sodium Carbonate
"Sandgravel" aggregates in parts of Kansas, Nebraska, Colorado, and Wyoming, especially those
from the Platte, Republican, and Laramie Rivers, have been involved in the deterioration of
concrete (17). In 1983 a team was formed to evaluate the concrete pavement condition in Colorado
and to recommend rehabilitation methods for these pavements. This team identified that one-third
of the pavements inspected suffered from ASR (19). A follow up study conducted in 1987 focused
on the cause of ASR in Colorado. The study concluded that aggregates in the Denver Metro area
showed no signs of ASR reaction, but aggregate from the Three Bells pit near Windsor
demonstrated rapid signs of expansion. This study led CDOT to modify its specifications and
require low alkali cement for all concrete pavement, it also identified the need for Class F fly ash
in areas were reactive aggregates have been a problem (20).
Figure 7.22 Idealized Sketch of Cracking Pattern in Concrete Mass
Caused by Internal Expansion (Figure 93, Petrographic Methods of Examining Hardened
Concrete: A Petrographic Manual, July 2006)
7.19.3 Sulfate Resistant Concrete Pavement
Sulfates may be found in soil and water and are referred to as "alkali". The sulfates in soils and
water are the main source of external sulfate attack on concrete pavement. Although the
mechanism of sulfate attack is complex, it is primarily thought to be caused by two chemical
reactions: 1) the formation of gypsum through the combination of sulfate and calcium ions, and/or
2) the formation of ettringite through the combination of sulfate ions and hydrated calcium
aluminate (18). Ettringite (Ca6[Al(OH)6]2(SO4)3∙26H2O2) is a high-sulfate, calcium sulfo-
aluminate mineral which naturally occurs in curing concrete. The problem appears when ettringite
forms after the concrete has set, this is known as Delayed Ettringite Formation (DEF). This process
is extremely harmful, because as ettringite crystals form they expand and create internal tensile
stresses in the cement matrix (21). These stresses will cause the concrete to crack, but may not be
apparent for 3-10 years (18).
Colorado Department of Transportation
2017 Pavement Design Manual
272
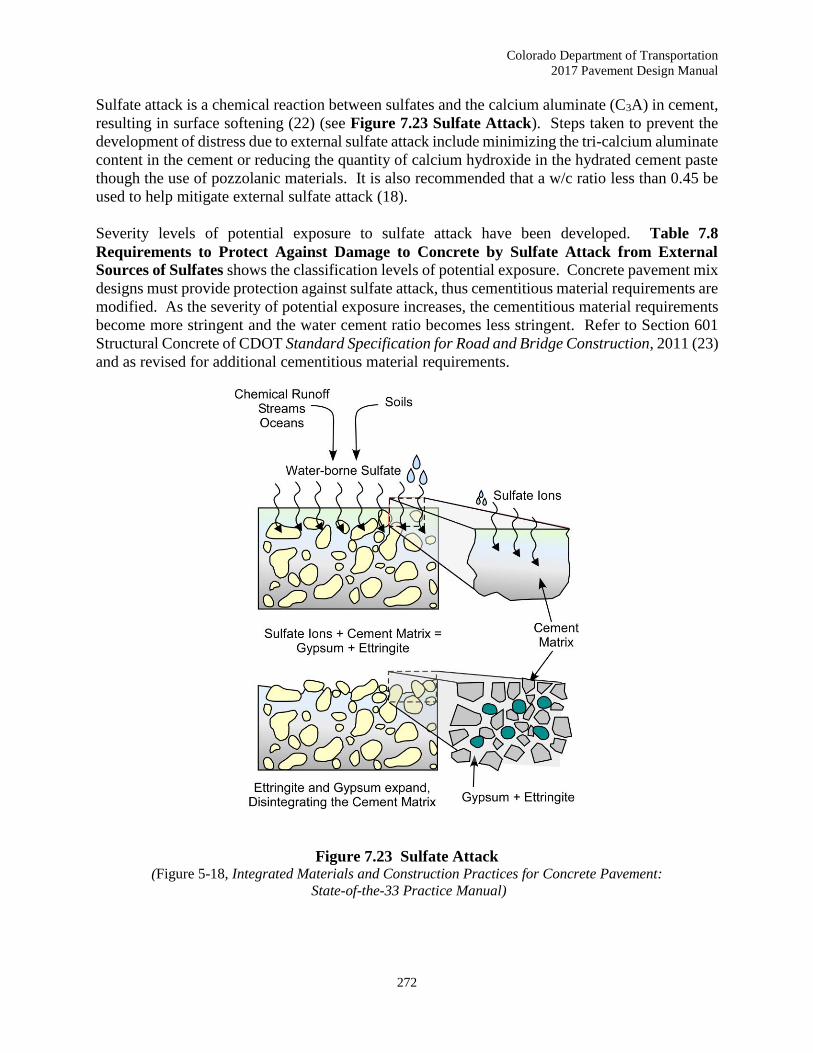
Sulfate attack is a chemical reaction between sulfates and the calcium aluminate (C3A) in cement,
resulting in surface softening (22) (see Figure 7.23 Sulfate Attack). Steps taken to prevent the
development of distress due to external sulfate attack include minimizing the tri-calcium aluminate
content in the cement or reducing the quantity of calcium hydroxide in the hydrated cement paste
though the use of pozzolanic materials. It is also recommended that a w/c ratio less than 0.45 be
used to help mitigate external sulfate attack (18).
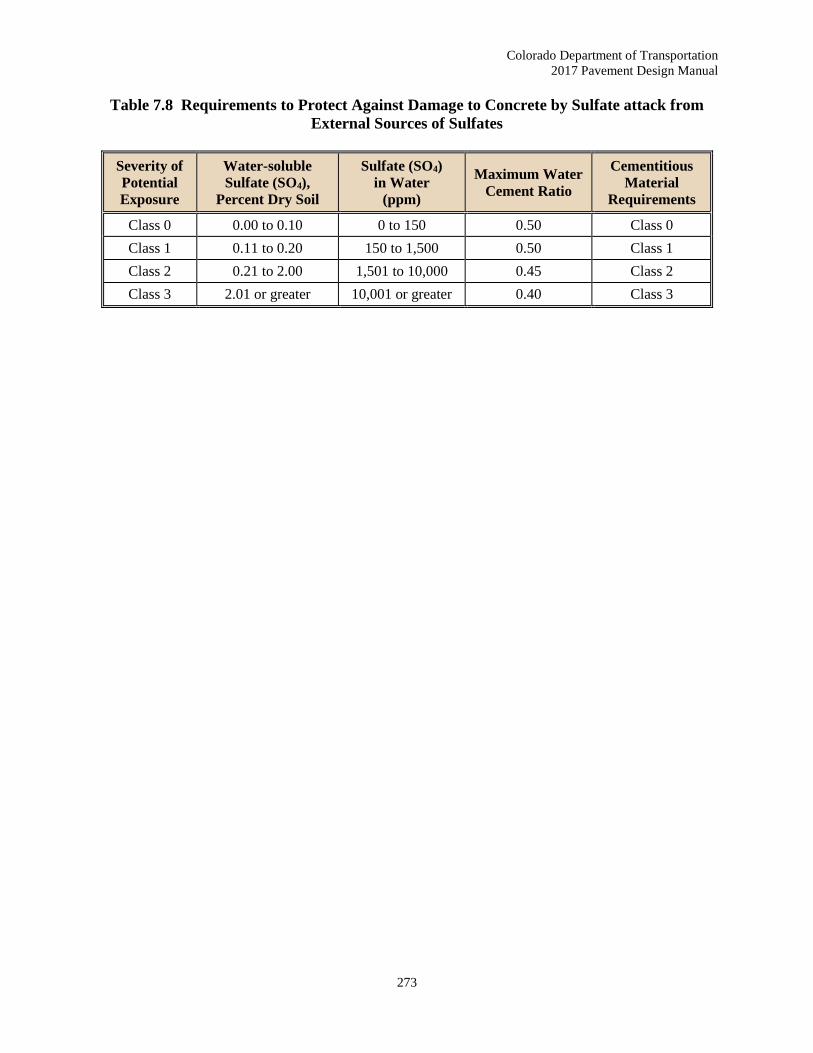
Severity levels of potential exposure to sulfate attack have been developed. Table 7.8
Requirements to Protect Against Damage to Concrete by Sulfate Attack from External
Sources of Sulfates shows the classification levels of potential exposure. Concrete pavement mix
designs must provide protection against sulfate attack, thus cementitious material requirements are
modified. As the severity of potential exposure increases, the cementitious material requirements
become more stringent and the water cement ratio becomes less stringent. Refer to Section 601
Structural Concrete of CDOT Standard Specification for Road and Bridge Construction, 2011 (23)
and as revised for additional cementitious material requirements.
Figure 7.23 Sulfate Attack (Figure 5-18, Integrated Materials and Construction Practices for Concrete Pavement:
State-of-the-33 Practice Manual)
Colorado Department of Transportation
2017 Pavement Design Manual
273
Table 7.8 Requirements to Protect Against Damage to Concrete by Sulfate attack from
External Sources of Sulfates
Severity of
Potential
Exposure
Water-soluble
Sulfate (SO4),
Percent Dry Soil
Sulfate (SO4)
in Water
(ppm)
Maximum Water
Cement Ratio
Cementitious
Material
Requirements
Class 0 0.00 to 0.10 0 to 150 0.50 Class 0
Class 1 0.11 to 0.20 150 to 1,500 0.50 Class 1
Class 2 0.21 to 2.00 1,501 to 10,000 0.45 Class 2
Class 3 2.01 or greater 10,001 or greater 0.40 Class 3
Colorado Department of Transportation
2017 Pavement Design Manual
274
References
1. AASHTO Guide for Design of Pavement Structures, American Association of State
Highway and Transportation Officials, Washington, DC, 1993.
2. Supplement AASHTO Guide for Design of Pavement Structures, Part II, - Rigid Pavement
Design & Rigid Pavement Joint Design, American Association of State Highway and
Transportation Officials, Washington, DC, 1998.
3. Techniques for Pavement Rehabilitation, Nichols Consulting Engineers, Chtd., U.S.
Department of Transportation, Federal Highway Administration and National Highway
Institute, Arlington, Virginia, Sixth Edition, January 1998.
http://www.fhwa.dot.gov/pavement/pub_details.cfm?id=375
4. LTPP Data Analysis Phase I: Validation of Guidelines for k-Value Selection and Concrete
Pavement Performance Prediction, Publication FHWA-RD-96-198, Federal Highway
Administration, Research and Development, Turner-Fairbank Highway Research Center,
6300 Georgetown Pike, McLean, VA 22101-2296, January 1997.
5. Wells, Steven A., Early Age Response of Jointed Plain Concrete Pavements to
Environmental Loads, thesis was presented and defended on July 27, 2005, University of
Pittsburgh, School of Engineering, 2005.
6. Computer-Based Guidelines for Concrete Pavements, Volume II: Design and Construction
Guidelines and HIPERPAV® II User's Manual, Publication No. FHWA-HRT-04-122, U.S.
Department of Transportation, Federal Highway Administration, Research and
Development, Turner-Fairbank Highway Research Center, 6300 Georgetown Pike, Mclean
VA 22101-2296, February 2005.
7. Guide for Mechanistic-Empirical Design, Final Report, NCHRP Project 1-37A, National
Cooperative Highway Research Program, Transportation Research Board, National
Research Council, Submitted by ARA, INC., ERES Consultants Division, Champaign, IL,
March 2004.
8. Ardani, Ahmad, Implementation of Proven PCCP Practices in Colorado, Final Report,
Report No. CDOT-DTD-R-2006-9, Colorado Department of Transportation, Research
Branch, April 2006.
9. CDOT Standard Plans, Concrete Pavement Joints M-412-1, July 2006.
10. Standard Specifications for Road and Bridge Construction, Colorado Department of
Transportation, Denver, Co, 2005.

Colorado Department of Transportation
2017 Pavement Design Manual
275
11. Ardani, Ahmad, Hussain, Shamshad, and LaForce, Robert, Evaluation of Premature PCCP
Longitudinal Cracking in Colorado, Final Report, Report No. CDOT-DTD-R-2003-1,
Colorado Department of Transportation, Research Branch, January 2003.
12. Ardani, Ahmad and Outcalt, William (Skip), PCCP Texturing Methods, Final Report,
Report No. CDOT-DTD-R-2005-22, Colorado Department of Transportation, Research
Branch, January 2005.
13. Alkali Silica Reactivity, Canadian Strategic Highway Research Program, Transportation
Association of Canada, Technical Brief #13, April 1996, 1 October 2007.
http://www.cshrp.org/products/csbf-e13.pdf
14. Alkali Aggregate Reaction, Concrete Technology, Portland Cement Association, 2007,
2 October 2007. http://www.cement.org/tech/cct_dur_AAR.asp
15. Alkali-Aggregate Reaction in Roads & Bridges, West, Graham, London: Thomas Telford
Ltd. 1996 pp. 10-12.
16. Petrographic Methods of Examining Hardened Concrete: A Petrographic Manual,
Publication No. FHWA-HRT-04-150, 1401 East Broad Street, Richmond, VA 23219 and
Federal Highway Administration, Office of Infrastructure R&D, 6300 Georgetown Pike,
McLean, VA 22101, July 2006.
17. Standard Practice for Concrete for Civil Works Structures, Publication No. EM 1110-2-
2000, Department of the Army, US Army Corps of Engineers, Washington, DC 20314-
1000, 1 February 1994.
18. Guidelines for Detection, Analysis, and Treatment of Materials-Related Distress in
Concrete Pavements - Volume 1: Final Report, Report No. FHWA-RD-01-163, U.S.
Department of Transportation, Federal Highway Administration, Research, Development
and Technology, Turner-Fairbank Highway Research Center, 6300 Georgetown Pike,
Mclean VA 22101-2296, August 2002.
19. Rehabilitation of Concrete Pavements, Report No. CDOH-83-1, Colorado Department of
Highways, U.S. Department of Transportation, Federal Highway Administration, January
1983.
20. Colorado Reactive Aggregate, Report No. CDOH-DH-DML-87-5, Colorado Department
of Highways, U.S. Department of Transportation, Federal Highway Administration, June
1987.
21. Integrated Materials and Construction Practices for Concrete Pavement: State-of-the-
Practice Manual, FHWA Publication No. HIF-07-004, U.S. Department of Transportation,
Federal Highway Administration, October 2007.

Colorado Department of Transportation
2017 Pavement Design Manual
276
22. Guidelines for Dowel Alignment in Concrete Pavements, NCHRP Report 637, National
Cooperative highway Research Program, Transportation Research Board, Washington,
D.C., 2009.
23. Standard Specifications for Road and Bridge Construction, Colorado Department of
Transportation, Denver, Co, 2011.
http://www.coloradodot.info/business/designsupport/construction-specifications/2011-
Specs
24. AASHTO Mechanistic-Empirical Pavement Design Guide, A Manual of Practice, Interim
Edition, July 2008, American Association of State Highway and Transportation Officials,
Washington, DC, 2008.
25. Rasmussen, Robert Otto and Sohaney, Richard C., Assessment of Concrete Pavement
Texturing Methodologies in Colorado, CDOT Final Research Report CDOT-2012-10,
dated October 2012 (24).