principal investigator: laurence cooper, md, phd · send comments regarding this burden estimate or...
TRANSCRIPT

AD Award Number: W81XWH-11-1-0459
TITLE: Innovative T Cell-Targeted Therapy for Ovarian Cancer
PRINCIPAL INVESTIGATOR: Laurence Cooper, MD, PhD
CONTRACTING ORGANIZATION: The University of Texas MD Anderson Cancer Center
Houston, Texas 77030-4009
REPORT DATE: October 2012
TYPE OF REPORT: Annual
PREPARED FOR: U.S. Army Medical Research and Materiel Command
Fort Detrick, Maryland 21702-5012 DISTRIBUTION STATEMENT: Approved for Public Release
Distribution Unlimited
The views, opinions and/or findings contained in this report are those of the author(s) and should not be construed as an official Department of the Army position, policy or decision unless so designated by other documentation.

2
REPORT DOCUMENTATION PAGE Form Approved
OMB No. 0704-0188 Public reporting burden for this collection of information is estimated to average 1 hour per response, including the time for reviewing instructions, searching existing data sources, gathering and maintaining the data needed, and completing and reviewing this collection of information. Send comments regarding this burden estimate or any other aspect of this collection of information, including suggestions for reducing this burden to Department of Defense, Washington Headquarters Services, Directorate for Information Operations and Reports (0704-0188), 1215 Jefferson Davis Highway, Suite 1204, Arlington, VA 22202- 4302. Respondents should be aware that notwithstanding any other provision of law, no person shall be subject to any penalty for failing to comply with a collection of information if it does not display a currently valid OMB control number. PLEASE DO NOT RETURN YOUR FORM TO THE ABOVE ADDRESS. 1. REPORT DATE (DD-MM-YYYY) October 2012
2. REPORT TYPE Annual
3. DATES COVERED (From - To) 30September2011–29September2012
4. TITLE AND SUBTITLE Innovative T Cell-Targeted Therapy for Ovarian Cancer
5a. CONTRACT NUMBER
5b. GRANT NUMBER W81XWH-11-1-0459 5c. PROGRAM ELEMENT NUMBER
6. AUTHOR(S) Laurence Cooper, MD, PhD
E-MAIL: [email protected]
5d. PROJECT NUMBER
5e. TASK NUMBER
5f. WORK UNIT NUMBER
7. PERFORMING ORGANIZATION NAME(S) AND ADDRESS(ES) UT MD Anderson Cancer Center
Houston, Texas 77030-4009
8. PERFORMING ORGANIZATION REPORT NUMBER
9. SPONSORING / MONITORING AGENCY NAME(S) AND ADDRESS(ES) U.S. Army Medical Research and Materiel Command Fort Detrick, Maryland 21702-5012
10. SPONSOR/MONITOR’S ACRONYM(S)
11. SPONSOR/MONITOR’S REPORT NUMBER(S)
12. DISTRIBUTION / AVAILABILITY STATEMENT Approved for Public Release; Distribution Unlimited
13. SUPPLEMENTARY NOTES
14. ABSTRACT Major advances have been made in two main areas. Firstly, Receptor tyrosine kinase-like orphan receptor-1 (ROR1) was identified as a tumor antigen expressed on ovarian cancer (OvCa), but not expressed on normal tissue(s). Second generation chimeric antigen receptors (CARs) were designed with CD3z and either CD28 or CD137 endodomains fused to the antigen-binding region of a ROR1-specific monoclonal antibody (clone 4A5). CARs were stably expressed in T cells following Sleeping Beauty transposition and propagation on ROR1+
artificial antigen presenting cells (aAPC). Re-directed cytolysis of ROR1+ OvCa cell lines by CAR+ T cells was demonstrated. Secondly, the anti-tumor activity of γδ T cells was harnessed to kill OvCa. aAPC were used to expand a polyclonal population of γδ T cells for immunotherapy. OvCa xenografts were eliminated by polyclonal γδ T cells. 15. SUBJECT TERMS ROR1, γδ T cells, adoptive T cell therapy, ovarian cancer, chimeric antigen receptor (CAR)
16. SECURITY CLASSIFICATION OF: 17. LIMITATION OF ABSTRACT
UU
18. NUMBER OF PAGES
34
19a. NAME OF RESPONSIBLE PERSON USAMRMC, Ayi Ayayi
a. REPORT
U
b. ABSTRACT
U
c. THIS PAGE
U
19b. TELEPHONE NUMBER (include area code)
301-619-4018 Standard Form 298 (Rev. 8-98) Prescribed by ANSI Std. Z39.18

3
TABLE OF CONTENTS
Page Introduction…………………………………………………………….………..….. 4
Body………………………………………………………………………………….. 8
Key Research Accomplishments………………………………………….…….. 16
Reportable Outcomes……………………………………………………………… 17
Conclusion…………………………………………………………………………… 18
References……………………………………………………………………………. 19
Appendices…………………………………………………………………………… 22

4
INTRODUCTION
Ovarian cancer, hypoxia, and tumor antigens. Relapsed ovarian cancer (OvCa) is refractory to current
therapies in many cases and remains a lethal disease for women worldwide.1, 2 Advanced ovarian tumors have
significant areas that are hypoxic (low O2 concentration), which can lead to therapeutic escape and relapse in
women who initially respond to therapy.3-5 Therapies targeting tumor-associated antigens (TAAs) expressed in
both hypoxic and normoxic regions of ovarian tumors could dramatically increase survivorship in women with
advanced disease. c-Met, hepatocyte growth factor receptor (HGFR), has been identified as a candidate TAA
because of its well-described expression on OvCa that increases in hypoxia.6-8 However, c-Met is also
expressed on normal tissues, such as liver and lung,9 thereby complicating its utility as a TAA for cell-based
therapy. In contrast to c-Met, the TAA receptor tyrosine kinase-like orphan receptor-1 (ROR1) is not expressed
on normal adult tissues, but is expressed on a variety of cancers, including OvCa.10-12 ROR1 expression was
maintained in hypoxia in OvCa cell lines (Figure 1), suggesting that targeting ROR1 may be a safe and
effective strategy for OvCa immunotherapy.
Chimeric Antigen Receptors. Chimeric antigen receptors (CARs) are employed to re-direct T-cell specificity to
TAAs. They are fashioned by fusing T-cell signaling endodomains (CD3ζ, CD28, and CD137) to a single
chain variable fragment (scFv) derived from a monoclonal antibody (mAb) with specificity to a cell surface TAA.
Upon docking with TAA the introduced CAR activates genetically modified T cells outside of the constraints of
major histocompatibility complex (MHC) interaction with the endogenous T-cell receptor (TCR). The CAR
contains both signal 1 (CD3ζ) and signal 2 (CD28 or CD137) to achieve full T-cell activation. Clinical trials are
investigating the therapeutic efficacy of CAR-based therapies.13 Patients with refractory B-cell malignancies
who were recently treated with CD19-specific CAR+ T cells employing a CD137 endodomain achieved
complete responses.14, 15 Thus, ROR1 was targeted in this study with CAR+ T cells expressing either
CD28 (ROR1RCD28) or CD137 (ROR1RCD137) endodomains (Appendix 1).
Adoptive T-cell therapy, graft-versus-host disease, and γδ T cells. Allogeneic adoptive T-cell therapy (allo-
ACT) is a cancer treatment modality used in clinical trials. Allo-ACT is particularly useful when autologous T
5
cells cannot be generated, e.g., after/during chemotherapy.16, 17 However, there is the risk of graft-versus-host
disease (GvHD) in allo-ACT, where donor TCRαβ inappropriately recognizes the host MHC leading the infused T
cells to attack normal tissues. It is difficult to predict GvHD incidence because specificity of the donor-
derived TCRαβ chains are uniquely educated within individuals.18 T cells can be dichotomized into two main
subsets based on their TCRs. The conventional αβ T cells express TCRαβ and constitute ~95% of the
circulating T-cell pool. In contrast, γδ T cells are less frequent (1-10% of peripheral-blood-derived T cells) and are
characterized by TCRγδ. While αβ T cells recognize peptides in the context of MHC, γδ T cells do not
necessarily recognize MHC and most of the antigens they recognize are outside of MHC presentation altogether.
Therefore, γδ T cells have a reduced risk for GvHD and appear to be a safer option for allogeneic allo-ACT
compared with T cells expressing αβTCR.19
γδ T-cell numeric expansion and utility in cancer therapy. Bisphosphonates have been used to propagate
mono- and oligo-clonal subsets of human peripheral blood-derived γδ T cells. The utility of clinical-grade
bisphosphonates in γδ T-cell expansion was serendipitously discovered when patients with bone diseases, e.g.
osteoporosis, sarcoma, etc., were treated with bisphosphonates to regenerate their bone and sizeable
expansions of γδ T cells were subsequently observed in vivo.20 The bisphosphonate-derived Vδ2 T cells are
reactive to metabolites in the cholesterol synthesis pathway and display natural anti-tumor reactivity, because
tumors are commonly dependent upon cholesterol-rich lipid rafts for growth factor signaling. Moreover, γδ T
cells are regarded in general as a critical part of the natural anti-tumor response.21, 22 Clinical trials have
investigated the efficacy of bisphosphonates in tumor therapy with some promising results in both
hematological and solid cancers, including OvCa, but were not curative.23 In contrast, long term survivorship of
patients following allogeneic TCRαβ-depleted hematopoietic stem-cell transplantation (HSCT) was predictive
based on increased frequency of peripheral γδ T cells that were primarily of Vδ1 origin.24-26 Polyclonal γδ T
cell expansion has not been achieved, which limits the ability to use both anti-tumor subsets of γδ T cells in anti-
cancer therapy. A major problem with attempting to ex vivo propagate γδ T cells to clinically-appealing
numbers is that conventional strategies to expand αβ T cells, e.g., with high-dose IL-2 and OKT3 (anti-CD3), do
not support long-term growth of γδ T cells in tissue culture. Furthermore, there are very limited starting
quantities of γδ T cells (1-10% of peripheral T cells). The expansion schema used in our lab centers around
using K562-derived artificial antigen presenting cells (aAPC) that express cytokines, co-stimulatory molecules,

6
and TAA as feeder cells to support T-cell growth to clinically relevant numbers. K562 cells are natural targets
for allogeneic γδ T cells, and preliminary data suggests that γδ T cells can be expanded with similar kinetics as
αβ T cells in compliance with current good laboratory practice (cGLP) and current good manufacturing
practices (cGMP) and thus can be rapidly extrapolated into clinical trials. The first clinical trials using Sleeping
Beauty transposition and aAPC technology is currently open at MD Anderson for treating B cell leukemia with
allogeneic αβ T cells re-directed to leukemia with a CD19-specific CAR.
Sleeping Beauty transposition and aAPC-based T-cell expansion. As with the CD19-specific CAR, ROR1
CARs can be expressed in T cells with the Sleeping Beauty transposase/transposon gene transfer system.
Sleeping Beauty transposition is a non-viral gene cut-and-paste mechanism where the transposase enzyme is
transiently expressed in the cell, makes excisions at inverted repeats flanking the transposon containing the CAR,
and integrates the excised transposon into TA repeats within the genome.27 After a few days, the transposase
enzyme is no longer expressed, and long-term expression of the transposon can be readily achieved.
Nucleofection is used to electroporate peripheral blood mononuclear cells (PBMC) with CAR transposon and
Sleeping Beauty transposase, and stimulations with γ-irradiated aAPC are applied weekly to the cells along
with recombinant interleukin-2 (IL-2) and interleukin-21 (IL-21).28 The aAPC culture imposes selective
pressure for CAR+ T-cell propagation through (i) corresponding antigen expression, (ii) co-stimulation, and (iii)
cytokine support, and after four weeks the culture contains >90% CAR+ T cells at clinically relevant numbers
(Appendix 2). The electroporated/propagated CAR+ T cells kill tumors and secrete pro- inflammatory cytokines
in a CAR- and antigen-restricted manner, and can allow for conditional production of
pro-inflammatory molecules in a canonically immunosuppressive tumor microenvironment.
IL-17 and ovarian cancer. IL-17-polarized T cells exhibit anti-tumor efficacy and are sought after cell lineage for
adoptive T cell therapy. More specifically, IL-17 expression and presence of IL-17 producing cell types in tumors
are positively associated with survivorship in ovarian cancer.29, 30 IL-17 is well described to induce pro-
inflammatory processes, which can be advantageous in cancer therapy.31 CD4+ T cells, CD8+ T cells, and γδ T
cells have been described as IL-17 producers, and are named Th17, Tc17, and Tγδ17, respectively.32
Importantly, Th17 cells are inversely correlated with regulatory T cells (Tregs), and Tregs often promote tumor
7
growth.33, 34 It was recently shown that inducible co-stimulator (ICOS) polarized CD4+ T cells towards
Th17 lineage, and that CD28 co-stimulation reversed the polarization and made the CD4+ T cells express
interferon- γ (IFNγ).35 This is important for the current aAPC expansion strategy because the aAPC express
CD86, a ligand for CD28, and most aAPC-expanded T cells are restricted to IFNγ production and not IL-17. γδ
T cells are also known to polarize towards either IFNγ or IL-17 producing lineages, although the co-stimulatory
requirements are unknown. CD27 expression predicts for IFNγ producing γδ T cells, whereas CD27neg γδ T
cells are commonly IL-17 producing lineages.36 Optimization of the co-stimulatory molecules on the aAPC
could allow skewing towards ideal cytokine production and anti-tumor effect that can be induced in the hypoxic
environment by T cells.
Summary. This proposal aims to accomplish (i) targeting of ovarian cancer with ROR1-specific T cells under
conditions of normoxia and hypoxia and (ii) optimization of the co-stimulation requirements for maximum anti-
tumor efficacy and pro-inflammatory cytokine production by the T cells, especially IL-17, in the ovarian tumors.
Sleeping Beauty gene transfer and aAPC technology will be integral in evaluating the hypotheses, and data
generated by this study will serve as the basis for initiating a clinical trial for the safe and effective treatment of
disease-resistant ovarian cancer.

8
BODY
We have adapted our specific aims from the Statement of Work as described below.
Task 1: Development of bi-specific T cells to recognize EBV and ovarian CA cells
• Generate EBV-specific T cells LCL (Mos. 1-2)
• Refine c-Met-specific CAR and propagate c-Met-specific T cells on K562-derived artificial antigen
presenting cells (Mos. 1-2)
• Generate EBV and c-Met-bi-specific T cells (Mos. 2-6)
• Functional analysis for redirected specificity targeting ovarian tumor (Mos. 4-8)
• Develop and obtain functional analyses of TK transgene (Mos. 6-8)
• Interim analysis (Mos. 9)
It was determined that ROR1 was a superior TAA compared to cMet, and we have switch the SOW to reflect
targeting ROR1 instead of cMet in the Specific Aims beloe. ROR1 is not expressed on normal tissues whereas
cMet is highly expressed in number of normal tissues, including liver and lung. Thus, there is no longer a need for
TK transgene for conditional ablation in the event of deleterious targeting of cMet on normal cells because ROR1
expression is absent on normal tissues. We have also advanced our understanding of T-cell biology to generate T
cells expressing γδ T-cell receptor (TCR) instead of αβTCR+ T cells as a cellular template for expressing ROR1-
specific CAR. This obviates the need to express CAR in EBV-specific T cells, because the TCR repertoire is no
longer an issue for allogeneic transplant with T cells.
Task 2: Development of conditionally-activated T cells to recognize ovarian CA cells
• Develop c-Met-specific CAR fused to ODDD (Mos. 9-14)
• Functional analysis for redirected specificity targeting ovarian tumor cells under hypoxia (Mos. 12-
16)
• Interim analysis (Mos. 16).
Targeting ROR1 instead of cMet obviates the need for conditional expression of the CAR with ODDD, because
ROR1 is not expressed on normal tissues. Thus, growth in hypoxia to enforce CAR expression is no longer

9
needed. We did investigate the immunobiology of T cells under conditions of hypoxia, since this mimics the tumor
microenvironment.
• Task 3: To evaluate relative ability of ovarian CA-specific T cells using PET as a biomarker for
molecular imaging to determine T-cell persistence and assess anti-tumor response in vivo.
• Develop and evaluate imaging probes for PET and bioluminescence (Mos. 16-17)
• Adoptive transfer of T cells and assess persistence by PET and bioluminescence (Mos. 17-23)
• Adoptive transfer of T cells and assess anti-tumor effect targeting ovarian CA (Mos. 17-23)
• Conditional elimination of infused genetically modified T cells (Mos. 17-23)
• Interim analysis (Mos. 24).
We were able to generate T cells expressing firefly luciferase and undertook BLI, but we did not complete PET-
based imaging.
Our data generating ROR1-specific CAR+ T cells and γδTCR+ T cells completed our work to date in which we
provide compelling pre-clinical data that CAR+ T cells targeting ROR1 and γδTCR+ T cells can be generated using
an approach amenable to their clinical translation.
We hypothesize that cell-based therapies for OvCa can be generated by (i) targeting ROR1 with CAR+ T cells
and (ii) expanding polyclonal γδ T cells for clinical use where optimization of their endogenous co-stimulation
will maximize anti-tumor efficacy.
Specific Aim #1: To evaluate the ability of ROR1-specific CAR to re-direct the specificity of T cells to kill OvCa.
Experimental Plan: Recent clinical trials treating refractory B-cell malignancies with CD19-specific CAR+ T cells
achieved complete responses using a CD137 endodomain instead of chimeric CD28.15 It is unknown
whether the same would apply to targeting ROR1. Thus, two second generation CAR transposons were
generated with CD28 (ROR1RCD28) and CD137 (ROR1RCD137) endodomains. Healthy donor-derived
peripheral blood mononuclear cells (PBMC) were electroporated with Sleeping Beauty transposase and either
ROR1RCD28 or ROR1RCD137 transposons then stimulated with ROR1+ aAPC, IL-2, and IL-21. Sham

10
electroporations will also be sorted and stimulated in parallel with OKT3 (agonistic CD3 antibody)-loaded
aAPC to propagate CARneg T cells for negative controls. Extended phenotypic analysis for CD3, CD4, CD8,
CD56, CD27, CD28, CD62L, CCR7, CD38, CD95, TCRγδ, and TCRαβ were evaluated by flow cytometry.
Interferon-γ (IFNγ) expression were evaluated by intracellular cytokine staining following TCR stimulation
(PMA/Ionomycin) and CAR stimulation from co-culture with EL4-ROR1neg and EL4-ROR1+ tumor targets.
Ovarian cancer cell lines (A2780, EFO21, EFO27, IGROV1, OC314, and UPN251) were profiled for ROR1
expression in normoxia (20% O2) and hypoxia (1% O2). Four-hour CRA was used to evaluate cytotoxicity against
the OvCa and EL4 tumor targets in normoxia and hypoxia. OC314 (ROR1+) cell line was genetically modified
to express mKate and firefly Luciferase (ffLuc) to measure tumor burden by fluorescence and
bioluminescent imaging (BLI), respectively. In vivo tumor clearance of established OC314-mKate-ffLuc
xenografts (intraperitoneal, i.p.) by CAR+ T cells (i.p.) in immunocompromised (NOD.scid.γc-/-; NSG) mice
were monitored by non-invasive BLI following subcutaneous (s.c.) D-Luciferin administration.
Immunohistochemistry and fluorescence will be used to corroborate BLI data post-mortem.
Progress Report Part Specific Aim#1. Before proceeding with ROR1 CAR studies, it was important to
evaluate ROR1 surface expression on OvCa as a function of oxygen tension. The following ovarian cancer
cell lines were kindly given to us by Dr. Bast (UTMDACC): A2780, EFO21, EFO27, IGROV1, OC314, and
UPN251. Identities of all cell lines were confirmed by STR Fingerprinting (Characterized Cell Line Core,
UTMDACC) and were found to be mycoplasma free. Flow cytometry was used to analyze ROR1 antigen levels
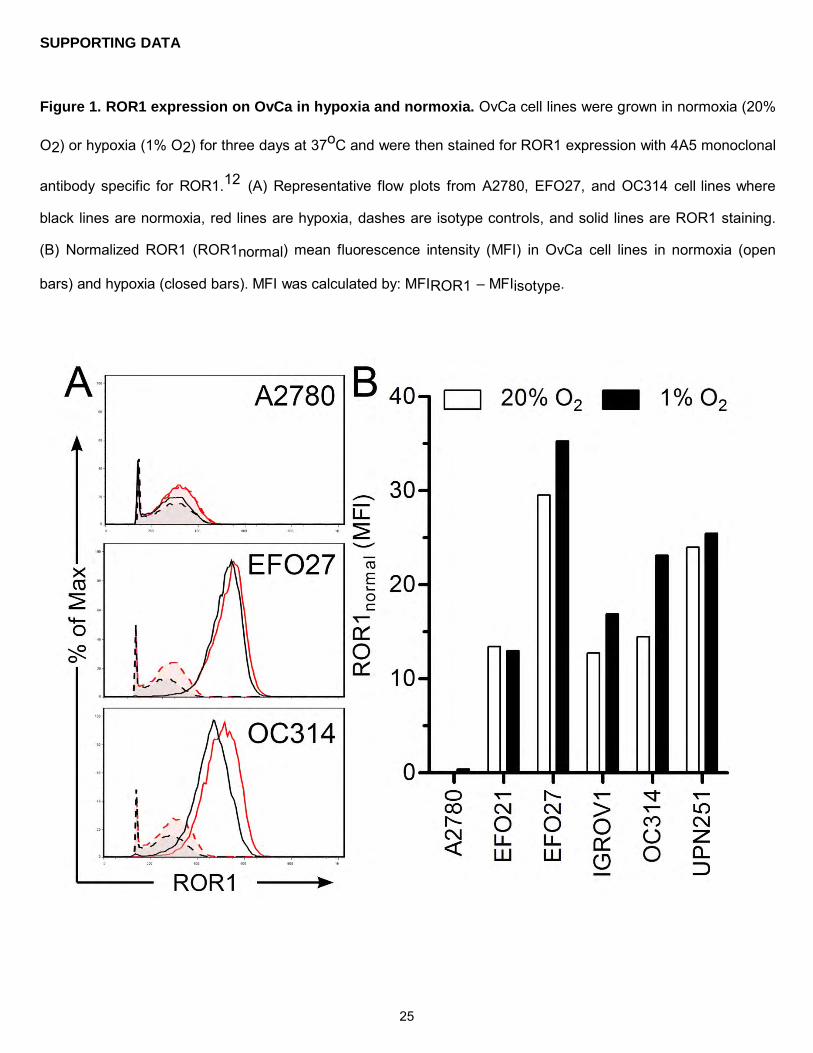
on the available OvCa cell lines following three days growth in normoxia (20% O2) or hypoxia (1% O2). As
anticipated, ROR1 was expressed on 5 of 6 cell lines tested and expression was maintained or increased in
hypoxic conditions (Figure 1). This was the first report of ROR1 expression in hypoxia to our knowledge, and
corroborated previous reports of ROR1 expression in OvCa.12 After establishing that ROR1 is expressed in
both high and low oxygen tension, OvCa can now be targeted with ROR1-specific CAR+ T cells.
Complete anti-tumor responses have been achieved with CD19-specific CAR+ T cells signaling through CD137
endodomain.14, 15 Whether the same would be true for ROR1-specific CAR+ T cells in the treatment of OvCa
is unknown. Thus, ROR1-specific CARs were constructed with CD137 endodomain (ROR1RCD137) and the
canonical CD28 endodomain (ROR1RCD28) and cloned into Sleeping Beauty (SB) transposons (Appendix 1).
Peripheral blood mononuclear cells (PBMC) were electroporated with plasmids encoding SB transposons and SB

11
transposase using Nucleofection and were stimulated in weekly recursive additions of γ-irradiated aAPC along
with exogenous interleukin-2 and -21 (IL-2 and IL-21) supplementation (Appendix 2). aAPC were
phenotyped for antigens (CD19 and ROR1), membrane bound IL15 (fused to IL-15Rα), co-stimulatory molecules
(CD86 and CD137L), and Fc receptors (CD32 and CD64) before stimulations (Appendix 3). After 36 days of
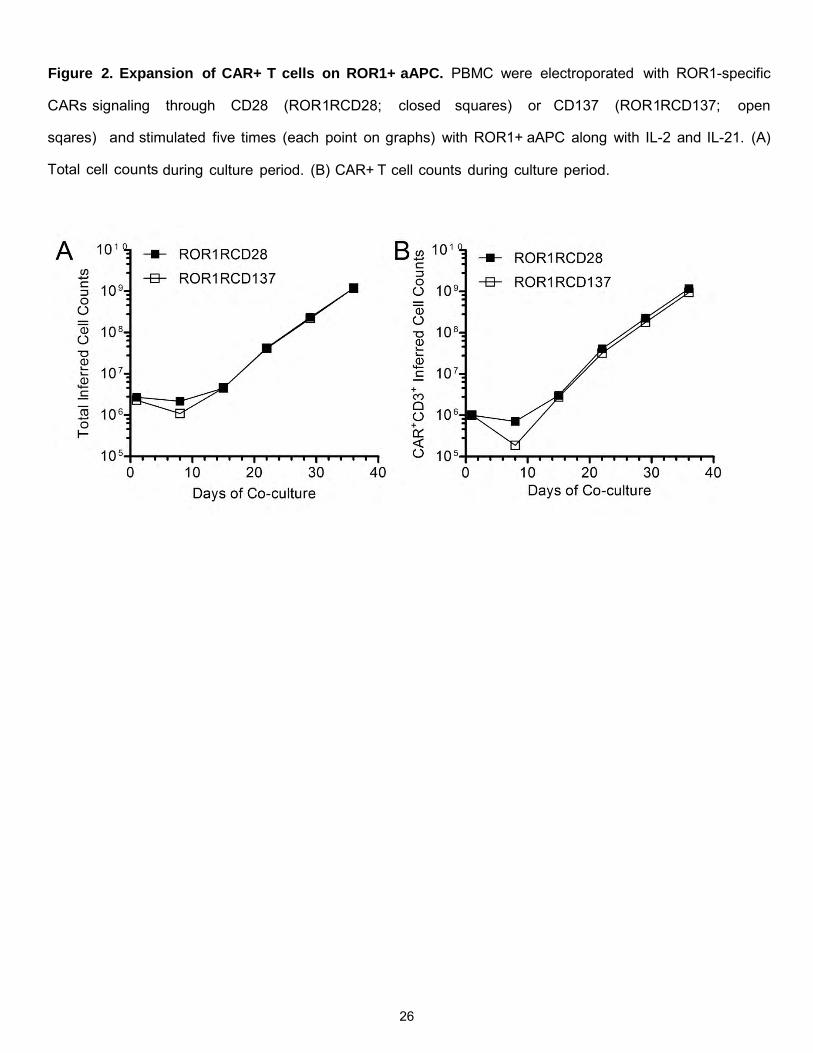
expansion on aAPC, >109 CAR+ T cells were propagated from 106 CAR+ T cells at the start of the culture
(Figure 2). Stable CAR expression was observed with both ROR1RCD28 and ROR1RCD137 indicating
that there was imposed selective pressure for CAR expression though cognate antigen expression on aAPC
(Figure 3). Sham electroporations were taken forward in parallel to propagate CARneg T cells with
OKT3(agonistic CD3 antibody)-loaded aAPC for negative controls. EL4 is a murine T cell lymphoma cell line used
to test specificity of CAR+ T cells with limited allo-reactivity from the endogenous T cell receptor (TCR). Thus,
EL4 (ROR1neg) cells were genetically modified to express recombinant ROR1 (EL4-ROR1+) and these cells
were used along with OvCa cell lines negative (A2780) or positive (EFO27) for ROR1 expression (Figure 1) in
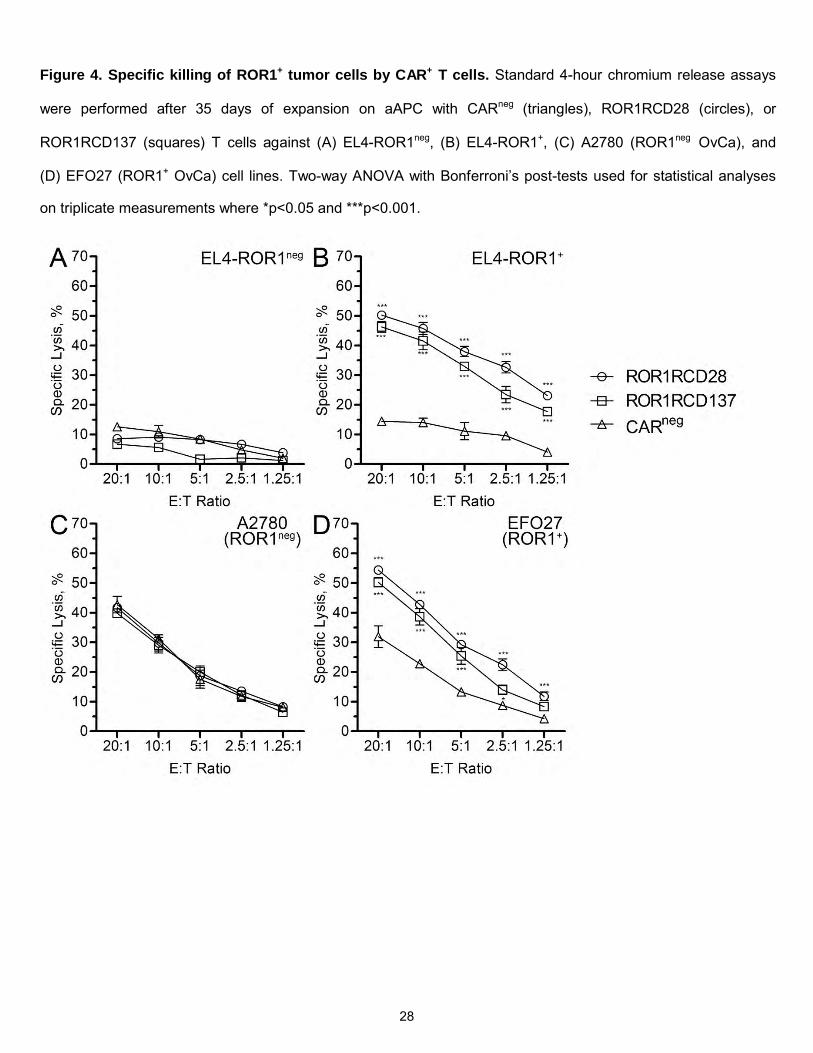
standard 4-hour chromium release assays to assess CAR-specific cytolysis. Both ROR1RCD28 and
ROR1RCD137 displayed minimal killing of EL4-ROR1neg cells (Figure 4A) but significantly higher killing of
EL4-ROR1+ cells compared to CARneg T cells (Figure 4B). Similarly, A2780 (ROR1neg) OvCa cells were
lysed at the same levels by CAR+ T cells as CARneg T cells (Figure 4C), whereas EFO27 (ROR1+) OvCa cells
were significantly killed by CAR+ cells compared to CARneg T cells (Figure 4D). Thus, CAR+ T cells were
specifically re-directed to ROR1 expressed on OvCa. As ROR1 expression on OvCa has only recently been
elucidated and has not yet been tested as a target for OvCa, ROR1-specific CAR T cells can thus be used for
the first time in OvCa treatment.
Specific Aim #2: To assess the inherent cytolysis of γδ T cells against OvCa. Experimental Plan: Healthy
donor-derived PBMC were paramagnetically sorted for γδ T cells with TCRγ/δ isolation kit then stimulated
weekly with aAPC feeder ells and exogenous IL-2 and IL-21. The other fraction of the paramagnetic bead sorting,
comprising mainly of αβ T cells, were stimulated with OKT3-loaded aAPC to propagate αβ T cells for
negative staining controls. Extended phenotypic analysis of cell surface markers (as in Aim#1 with TCRδ1,
TCRδ2, and TCRγ9) was performed at the end of the culture period by flow cytometry to assess TCR distribution
and T cell, homing, and memory phenotype in the culture. TCRγδ allele expression was evaluated by our direct
TCR expression array (DTEA) using digital probes to quantify mRNA expressing TCR chains and validated by

12
flow cytometry. Cytokine release following TCR stimulation (PMA/Ionomycin) and co-culture with OvCa cell
lines was assessed by Luminex. Standard 4-hour CRA was used to evaluate cytotoxicity towards OvCa
cell lines detailed in Aim#1 with healthy donor-derived B cells serving as negative controls. CAOV3 cell line was
genetically modified to express mKate and firefly Luciferase (ffLuc) as done for OC314 in Aim#1. The ability of i.p.
injected γδ T cells to eliminate i.p. established CAOV3-mKate-ffLuc xenografts in NSG mice was evaluated by
BLI during the course of the experiment then immunohistochemistry and fluorescence were used to corroborate
BLI data post-mortem.
Progress Report Specific Aim #2. We established that γδ T cells propagated on aAPC in parallel with CD19-
specific CAR+ γδ T cells and maintained a polyclonal distribution of γ and δ TCR chains.37 This was a major
advance as only one subset (Vγ9Vδ2) of γδ T cells had been previously expanded for human application, yet
other γδ T-cell subsets exhibit anti-tumor immunity. Thus, studies were initiated to evaluate whether aAPC
would drive γδ T-cell proliferation in the absence of CAR+ T cells and if these γδ T cell would express
polyclonal TCRγδ repertoire. PBMC were first depleted of NK cells with CD56 microbeads on paramagnetic
columns and then unlabeled γδ T cells were purified from other cells labeled with TCRγ/δ+ isolation kit
attached to magnetic columns. Recursive weekly stimulations on aAPC were performed with exogenous
administration of IL-2 and IL-21. γδ T cells were in limited quantities in the starting PBMC (3.2% ± 1.2%; mean
SD; n=4), but after sorting and expansion for 22 days on aAPC the cultures were highly pure for γδ T cells
(97.9% 0.6%) as assessed by co-expression of CD3+ and TCRγδ+ (Figure 5A). Cultures yielded >109 γδ
T cells from <106 total cells in three weeks of co- culture (Figure 5B), which represented 4.9x10³ ±
1.7x10³ fold change over the culture period (Figure 5C). Similar results were seen with γδ T cells sorted from
umbilical cord blood (UCB) by fluorescence activated cell sorting (FACS) and stimulated as was done with PBMC
(data not shown). Altogether this suggested the aAPC, not CAR, led to growth of γδ T cells in the culture system.
Only three TCRγδ chain-specific antibodies are commercially available limiting the detection of γδ T cell
repertoire outside of Vδ1, Vδ2, and Vγ9. Thus, the direct T cell expression array “DTEA” was utilized to detect
TCR mRNA in the γδ T-cell cultures and flow cytometry was used to corroborate mRNA data, when applicable.
All three Vδ alleles, i.e. Vδ1, Vδ2, and Vδ3, were detected by both flow cytometry (Figure 6A) and DTEA
(Figure 6C) with similar frequencies following the trend of Vδ1>Vδ3>Vδ2. The Vδ3 subset was shown to be
present within the Vδ1negVδ2neg population with DTEA analysis which allowed for inferential detection by

13
flow cytometry.37 Most Vδ2 cells paired with Vγ9 (Figure 6B), as expected, and DTEA revealed that Vγ2, Vγ5,
Vγ7,
Vγ8 (two alleles), Vγ10, and Vγ11 mRNA were expressed along with Vγ9 in the aAPC-expanded γδ T cell
cultures (Figure 6D). All work was performed under GLP for direct clinical translation. Thus, we report the first
clinically-relevant expansion of polyclonal γδ T cells for human use.
To determine whether γδ T cells would foster an inflammatory environment during therapy, a multiplex analysis
(27-Plex Luminex) of cytokines and chemokines was performed on T cells following culture on aAPC. Phorbol
myristate acetate (PMA) and Ionomycin mimic TCR activation by stimulating protein kinase C (PKC) and
increasing intracellular Ca2+ to activate phospholipase C (PLC), respectively.38, 39 There was no significant
production of anti-inflammatory Th2 cytokines IL-4, IL-5, and IL-13, and there was only a small increase in IL-
10 production from baseline (Figure 7A). In contrast, IL-1Ra, IL-6, and IL-17 were significantly secreted by γδ
T cells and have roles together for IL-17 inflammatory responses important γδ T cells in killing OvCa (Figure
7B).31, 40 Moreover, pro-inflammatory Th1 cytokines IL-2, IL-12 (p70), interferon-γ (IFNγ), and tumor necrosis
factor-α (TNFα) were all significantly produced by γδ T cells when TCR was stimulated compared to mock
stimulated controls (Figure 7C). Extremely high expression of chemokines CCL3 (macrophage inflammatory
protein-1α; MIP1α), CCL4 (MIP1β), and CCL5 (regulated and normal T cell expressed and secreted; RANTES)
were also detected (Figure 7D). In aggregate, TCR stimulation in γδ T cells led to a largely pro-inflammatory
response desired for cell-based OvCa therapy.
It is of interest to employ γδ T cells for adoptive T cell therapy because they have less risk for graft- versus-
host disease (GvHD). γδ T cells did not proliferate or produce IFNγ in response to healthy donor B cells (selected
for their relative abundance in PBMC and ability to function as APC) nor did they have any significant killing of
normal cells (Figure 8; upper left). Proliferation, IFNγ production, and killing were observed in positive
controls, which attests to their functional capacity while leaving healthy cells untouched (data not shown). In
addition to having fewer responses to normal cells, γδ T cells displayed an inherent ability to kill ovarian
cancer. All OvCa cell lines tested in standard 4-hour chromium release assays were lysed by γδ T cells but
healthy B cells were not killed (Figure 8). The order of killing tumor cell lines was cell line and donor dependent,
which could not be directly correlated to a particular Vδ subset of deference to a certain combination

14
of Vδ lineages (Figure 8). In aggregate, γδ T cells showed broad anti-tumor effects with limited reactivity to
healthy cells.
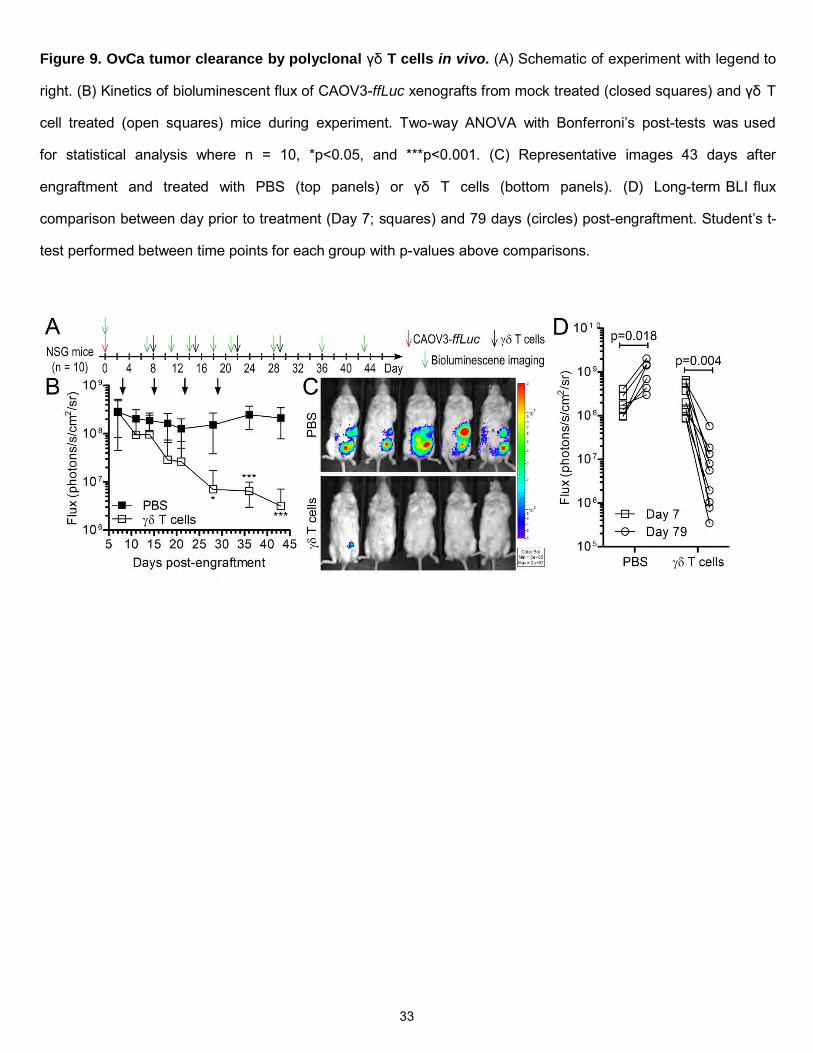
Lastly, the ability of γδ T cells to target and eliminate established OvCa xenografts in vivo was
evaluated. NSG mice were used for their ability to accept human tumor xenografts well and were injected with
CAOV3-ffLuc-mKate tumor cells i.p. then randomized into treatment groups. Stable disease was established after
8 days of engraftment and either PBS (negative control) or γδ T cells (escalating doses) were
administered i.p. to the mice. Tumor burden was monitored during the experiment with non-invasive
bioluminescence imaging (BLI) following D-luciferin administration (Figure 9A). γδ T cells significantly (p =
0.0005) eliminated established CAOV3 tumors during the course of the experiment whereas mice treated with
vehicle (PBS) retained high tumor burden (Figure 9B-C). Persistent OvCa disease was evident in the PBS
group by (i) flux maintenance to day 43 (Figure 9B), (ii) increase in flux to day 79 (Figure 9D), and (iii) death of
mice (n=3). In contrast, mice treated with γδ T cells displayed significantly lower CAOV3-ffLuc-mKate flux after
79 days post-engraftment compared to the day prior to treatment (day 7 post-engraftment) and no mice died in
this group (Figure 9D). Thus, polyclonal γδ T cells were effective in treating OvCa in vivo and represent an
attractive approach to cell-based OvCa treatment.
Specific Aim #3: To examine the role of endogenous co-stimulation for pro-inflammatory γδ T cell expansion in
both normoxia and hypoxia. Normal donor PBMC will be sorted for γδ T cells (as in Aim#2) and expanded in
parallel in 1% O2 and 20% O2 on aAPC with aAPC expressing differing co-stimulatory ligands: (i) none, (ii)
CD70, (iii) CD86, (iv) CD137L (4-1BBL), or (v) CD275 (ICOSL). Gene expression was profiled using nCounter
platform to identify candidate genes crucial for expansion in hypoxia. Polarization towards IL-17 or IFNγ
producing lineages was evaluated following expansion by flow cytometry and intracellular cytokine staining.
Cytolytic potency of cells expanded on different co-stimulatory ligands will be evaluated by CRA when targeted to
ovarian cancer cell lines in both hypoxia and normoxia.
Progress Report Specific Aim#3.. In order to maximize the anti-tumor efficacy of γδ T cells for OvCa
therapy, it is important to distinguish what molecules on aAPC drive their proliferation. The aAPC discussed in
Aims #1 and #2 co- expressed CD86 and 4-1BBL co-stimulatory molecules, which were high value targets for
these studies. It was also advantageous to examine IL-17/IFNγ polarization and growth in hypoxia in the same

15
studies. Reports in αβ T cells show that CD70 and CD86 led to IFNγ production but ICOS-L correlated with IL-
17. Whether the same is true for γδ T cells is not currently known nor is their ability to proliferate in hypoxia with
aAPC as a stimulus. Thus, aAPC were re-engineered on the K562 parental background to express on the
following co- stimulatory molecules: (i) none, (ii) CD70, (iii) CD86, (iv) 4-1BBL (CD137L), or (v) ICOS-L
(CD275). PBMC were sorted on paramagnetic columns (TCRγ/δ isolation kit) to isolate γδ T cells that were then
stimulated with one of the above aAPC for 9 days at 37oC in either in normoxia or hypoxia. Co-cultures were
either given no cytokine, IL-2, IL-21, or both IL-2 and IL-21. After stimulation, cells were (i) counted for
proliferation using trypan blue exclusion and (ii) tested for IFNγ/IL-17 polarization. For the latter scenario,
expanded cells were either mock activated or stimulated with leukocyte activation cocktail (LAC; PMA/Ionomycin)
in the presence of secretory pathway inhibitor GlogiPlug for 6 hours at 37oC in normoxia or hypoxia then stained
for CD3, TCRγδ, IFNγ, and IL-17 and analyzed by flow cytometry. As anticipated, the γδ T cells did not
appreciably expand in the absence of cytokine or aAPC. However, the addition of both IL-21 and IL-2/IL-21 led to
γδ T-cell numeric expansion especially when aAPC expressed 4-1BBL and with a combination of CD86 and 4-
1BBL (Figure 10A and 10C). It was also interesting that there was proliferative synergy between CD86 and 4-
1BBL. Signficantly, robust expansion of γδ T cells was observed in hypoxia in multiple scenarios, which
corroborated the approach to expand hypoxia-sensitive γδ T cells. Culture conditions could be adapted to result
in emergence of T cells that produced IL-17 and IFNγ (Figure 10B and 10D). The most IL-17 was observed with
IL-21/4-1BBL in hypoxia and with IL-2/IL-21/4-1BBL in normoxia. The same conditions led to IFNγ
production with the additional condition of IL-2/IL-21/CD86/4-1BBL in normoxia. It is also interesting that the
absence of oxygen or lack of IL-2 abrogated the functionality of cells stimulated with CD86/4-1BBL. Moreover,
IL-17 production in normoxia with IL-2/IL-21 was halted with the addition of CD86 but had no effect on IFNγ
(Figure 10D, left side, top and bottom panels). It appears that 4-1BBL is the crucial molecule on aAPC to drive
γδ T-cell proliferation and to yield IL-17 producing lineages, especially in normoxia. It was also unexpected
that ICOS-L neither induced considerable growth nor led to IL-17 production. Nonetheless, the culture system
can be adapted to generate γδ T cells that can produce IFNγ, IL-17, or both.
The long-term objective of this study is to create novel T cell-based treatments of disease-resistant ovarian
cancer that can function in the hostile tumor environment with minimal toxicity to normal tissues.

16
KEY RESEARCH ACCOMPLISHMENTS
Major advances have been made on this study and the project is poised for timely completion.
Specifically, the key research accomplishments are:
1. There has been significant headway in targeting OvCa with CAR+ T cells
2. There has been significant progress in targeting OvCa with polyclonal γδ T cells
3. ROR1 expression was detected on OvCa and was determined to be superior to cMet as a target
4. ROR1 expression was shown to be retained or increased in hypoxia (refractory areas of OvCa)
5. We show evidence that γδ T cells have inherent anti-tumor cytotoxicity towards OvCa
6. γδ T cells can proliferate with similar kinetics as in normoxia
7. γδ T cells produce both IFNγ and IL-17
In sum, this progress report gives two cell-based methods to treat OvCa with evidence of efficacy in hypoxia.
17
REPORTABLE OUTCOMES
The pre-clinical data for ROR1-specific T cells (described in “Progress Report Specific Aim #1”) has not
been published but is being compiled into a manuscript at present and is anticipated to be completed by the end
of 2013. Clinical trials are underway at MD Anderson Cancer Center using aAPC, SB, and CARs for cancer
treatment, and ROR1-specific CAR trial was approved by the Recombinant DNA Advisory Committee (RAC) for
the treatment of chronic lymphocytic leukemia (CLL). We anticipate that a future clinical trial can be written for
women with relapsed OvCa in the coming year. A manuscript detailing the utility of CAR+ γδ T cells for
leukemia treatment was published in Molecular Therapy, but is not directly applicable to OvCa.37 A second
paper about γδ T cells targeting OvCa (detailed in “Progress Report Part 3”) has been written and is awaiting
submission to Journal of Experimental Medicine.

18
CONCLUSION
We provide two T cell-based approaches for OvCa treatment that are both directly applicable to the clinic. First,
ROR1 was shown to be expressed on OvCa in both hypoxia and normoxia, and CAR+ T cells re-directed to
ROR1 could specifically and efficiently lyse OvCa targets. Second, polyclonal γδ T cells were expanded to
clinically-relevant numbers on aAPC, could lyse many OvCa cell lines, and eliminated OvCa xenografts in vivo.
Thus, translation of these T cell therapies will give women with advanced OvCa novel options in their
treatment.
19
REFERENCES 1. Rauh-Hain JA, Krivak TC, Del Carmen MG, Olawaiye AB. Ovarian cancer screening and early
detection in the general population. Rev Obstet Gynecol 2011; 4(1): 15-21. 2. Pignata S, Cannella L, Leopardo D, Pisano C, Bruni GS, Facchini G. Chemotherapy in epithelial
ovarian cancer. Cancer Lett 2011; 303(2): 73-83. 3. Milane L, Duan Z, Amiji M. Role of hypoxia and glycolysis in the development of multi-drug resistance
in human tumor cells and the establishment of an orthotopic multi-drug resistant tumor model in nude mice using hypoxic pre-conditioning. Cancer Cell Int 2011; 11: 3.
4. Zhu P, Ning Y, Yao L, Chen M, Xu C. The proliferation, apoptosis, invasion of endothelial-like epithelial
ovarian cancer cells induced by hypoxia. J Exp Clin Cancer Res 2010; 29: 124. 5. Galanis A, Pappa A, Giannakakis A, Lanitis E, Dangaj D, Sandaltzopoulos R. Reactive oxygen species
and HIF-1 signalling in cancer. Cancer Lett 2008; 266(1): 12-20. 6. Aune G, Lian AM, Tingulstad S, Torp SH, Forsmo S, Reseland JE et al. Increased circulating
hepatocyte growth factor (HGF): A marker of epithelial ovarian cancer and an indicator of poor prognosis. Gynecol Oncol 2011; 121(2): 402-6.
7. Anglesio MS, George J, Kulbe H, Friedlander M, Rischin D, Lemech C et al. IL6-STAT3-HIF signaling
and therapeutic response to the angiogenesis inhibitor sunitinib in ovarian clear cell cancer. Clin Cancer Res 2011; 17(8): 2538-48.
8. Huntsman D, Resau JH, Klineberg E, Auersperg N. Comparison of c-met expression in ovarian
epithelial tumors and normal epithelia of the female reproductive tract by quantitative laser scan microscopy. Am J Pathol 1999; 155(2): 343-8.
9. Yap TA, Sandhu SK, Alam SM, de Bono JS. HGF/c-MET targeted therapeutics: novel strategies for
cancer medicine. Curr Drug Targets 2011; 12(14): 2045-58. 10. Bicocca VT, Chang BH, Kharabi Masouleh B, Muschen M, Loriaux MM, Druker BJ et al. Crosstalk
between ROR1 and the Pre-B Cell Receptor Promotes Survival of t(1;19) Acute Lymphoblastic Leukemia. Cancer Cell 2012; 22(5): 656-67.
11. Zhang S, Chen L, Cui B, Chuang HY, Yu J, Wang-Rodriguez J et al. ROR1 is expressed in human
breast cancer and associated with enhanced tumor-cell growth. PLoS One 2012; 7(3): e31127. 12. Zhang S, Chen L, Wang-Rodriguez J, Zhang L, Cui B, Frankel W et al. The Onco-Embryonic Antigen
ROR1 Is Expressed by a Variety of Human Cancers. Am J Pathol 2012; 181(6): 1903-10. 13. Jena B, Dotti G, Cooper LJ. Redirecting T-cell specificity by introducing a tumor-specific chimeric
antigen receptor. Blood 2010; 116(7): 1035-44. 14. Kalos M, Levine BL, Porter DL, Katz S, Grupp SA, Bagg A et al. T cells with chimeric antigen receptors
have potent antitumor effects and can establish memory in patients with advanced leukemia. Sci Transl Med 2011; 3(95): 95ra73.
15. Porter DL, Levine BL, Kalos M, Bagg A, June CH. Chimeric antigen receptor-modified T cells in chronic
lymphoid leukemia. N Engl J Med 2011; 365(8): 725-33. 16. Ringden O, Karlsson H, Olsson R, Omazic B, Uhlin M. The allogeneic graft-versus-cancer effect. Br J
Haematol 2009; 147(5): 614-33.

20
17. Kapp M, Rasche L, Einsele H, Grigoleit GU. Cellular therapy to control tumor progression. Curr Opin Hematol 2009; 16(6): 437-43.
18. Blazar BR, Korngold R, Vallera DA. Recent advances in graft-versus-host disease (GVHD) prevention.
Immunol Rev 1997; 157: 79-109. 19. Lamb LS, Jr., Musk P, Ye Z, van Rhee F, Geier SS, Tong JJ et al. Human gammadelta(+) T
lymphocytes have in vitro graft vs leukemia activity in the absence of an allogeneic response. Bone Marrow Transplant 2001; 27(6): 601-6.
20. Stresing V, Daubine F, Benzaid I, Monkkonen H, Clezardin P. Bisphosphonates in cancer therapy.
Cancer Lett 2007; 257(1): 16-35. 21. Bonneville M, O'Brien RL, Born WK. Gammadelta T cell effector functions: a blend of innate
programming and acquired plasticity. Nat Rev Immunol 2010; 10(7): 467-78. 22. Gomes AQ, Martins DS, Silva-Santos B. Targeting gammadelta T lymphocytes for cancer
immunotherapy: from novel mechanistic insight to clinical application. Cancer Res 2010; 70(24): 10024- 7.
23. Chiplunkar S, Dhar S, Wesch D, Kabelitz D. gammadelta T cells in cancer immunotherapy: current
status and future prospects. Immunotherapy 2009; 1(4): 663-78. 24. Lamb LS, Jr., Henslee-Downey PJ, Parrish RS, Godder K, Thompson J, Lee C et al. Increased
frequency of TCR gamma delta + T cells in disease-free survivors following T cell-depleted, partially mismatched, related donor bone marrow transplantation for leukemia. J Hematother 1996; 5(5): 503-9.
25. Lamb LS, Jr., Gee AP, Hazlett LJ, Musk P, Parrish RS, O'Hanlon TP et al. Influence of T cell depletion
method on circulating gammadelta T cell reconstitution and potential role in the graft-versus-leukemia effect. Cytotherapy 1999; 1(1): 7-19.
26. Godder KT, Henslee-Downey PJ, Mehta J, Park BS, Chiang KY, Abhyankar S et al. Long term disease-
free survival in acute leukemia patients recovering with increased gammadelta T cells after partially mismatched related donor bone marrow transplantation. Bone Marrow Transplant 2007; 39(12): 751-7.
27. Hackett PB, Largaespada DA, Cooper LJ. A transposon and transposase system for human
application. Mol Ther 2010; 18(4): 674-83. 28. Singh H, Figliola MJ, Dawson MJ, Huls H, Olivares S, Switzer K et al. Reprogramming CD19-Specific T
Cells with IL-21 Signaling Can Improve Adoptive Immunotherapy of B-Lineage Malignancies. Cancer Res 2011; 71(10): 3516-27.
29. Kryczek I, Banerjee M, Cheng P, Vatan L, Szeliga W, Wei S et al. Phenotype, distribution, generation,
and functional and clinical relevance of Th17 cells in the human tumor environments. Blood 2009; 114(6): 1141-9.
30. Zou W, Restifo NP. T(H)17 cells in tumour immunity and immunotherapy. Nat Rev Immunol 2010;
10(4): 248-56. 31. Xu S, Cao X. Interleukin-17 and its expanding biological functions. Cell Mol Immunol 2010; 7(3): 164-
74. 32. Hao J, Wu X, Xia S, Li Z, Wen T, Zhao N et al. Current progress in gammadelta T-cell biology. Cell Mol
Immunol 2010; 7(6): 409-13. 33. Kryczek I, Wei S, Zou L, Altuwaijri S, Szeliga W, Kolls J et al. Cutting edge: Th17 and regulatory T cell
dynamics and the regulation by IL-2 in the tumor microenvironment. J Immunol 2007; 178(11): 6730-3.
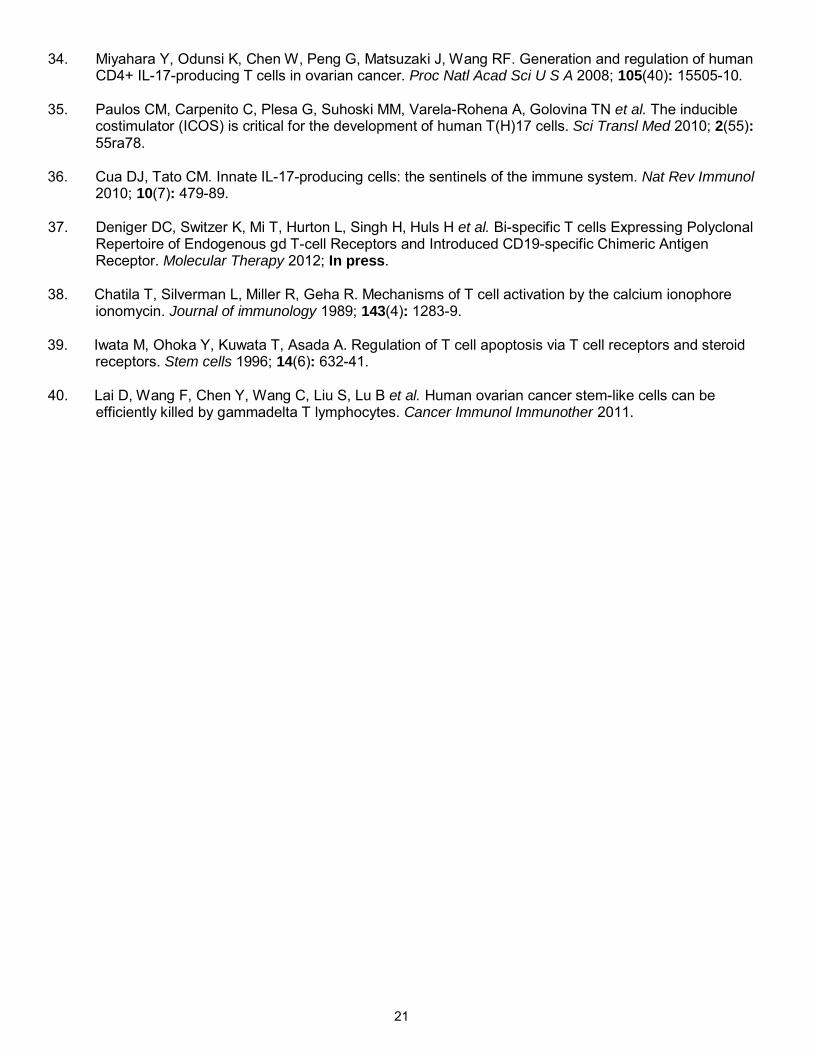
21
34. Miyahara Y, Odunsi K, Chen W, Peng G, Matsuzaki J, Wang RF. Generation and regulation of human CD4+ IL-17-producing T cells in ovarian cancer. Proc Natl Acad Sci U S A 2008; 105(40): 15505-10.
35. Paulos CM, Carpenito C, Plesa G, Suhoski MM, Varela-Rohena A, Golovina TN et al. The inducible
costimulator (ICOS) is critical for the development of human T(H)17 cells. Sci Transl Med 2010; 2(55): 55ra78.
36. Cua DJ, Tato CM. Innate IL-17-producing cells: the sentinels of the immune system. Nat Rev Immunol
2010; 10(7): 479-89. 37. Deniger DC, Switzer K, Mi T, Hurton L, Singh H, Huls H et al. Bi-specific T cells Expressing Polyclonal
Repertoire of Endogenous gd T-cell Receptors and Introduced CD19-specific Chimeric Antigen Receptor. Molecular Therapy 2012; In press.
38. Chatila T, Silverman L, Miller R, Geha R. Mechanisms of T cell activation by the calcium ionophore
ionomycin. Journal of immunology 1989; 143(4): 1283-9. 39. Iwata M, Ohoka Y, Kuwata T, Asada A. Regulation of T cell apoptosis via T cell receptors and steroid
receptors. Stem cells 1996; 14(6): 632-41. 40. Lai D, Wang F, Chen Y, Wang C, Liu S, Lu B et al. Human ovarian cancer stem-like cells can be
efficiently killed by gammadelta T lymphocytes. Cancer Immunol Immunother 2011.

22
APPENDICES Appendix 1. Schematics of CARs used in studies. Chimeric antigen receptors (CAR) are fusion proteins
of (i) antigen-specific binding regions of monoclonal antibodies constructed into single chain variable
fragments (scFv), (ii) a hinge region, (iii) an lgG4 constant region (Fe) stalk, (iv) CD28 transmembrane
(TM) domain, (v) co-stimulation domain (either CD28 (yellow) or CD137 (blue)), and CD3-zeta T cell
signaling domains. ROR1- specific CARs signaling through CD28 (ROR1RCD28; Left) and CD137
(ROR1RCD137; Right).

23
Appendix 2. Schematic for propagation of CAR+ T cells. Peripheral blood mononuclear cells (PBMC)
were electroporated with Sleeping Beauty (SB) plasmids expressing SB transposon (CAR) and SB
transposase by Amaxa nucleofection. Co-culture of CAR+ T cells with artificial antigen presenting cells
(aAPC; "Cione1") led to numeric expansion of CAR+ T cells and enforced CAR expression through ROR1.
Electro . 5/ee p_oratlon with pmgBeauty
(T DNA plasm ids 5) o be administered)
Tr•nsposon/T ranspos.ase C\ O 0 ~o-cult~rewi1~ F "d)
62""~""'•APC rom peripheral bl (clone 1)
collected ood mono by steady-state n phuclea~ cells a eres1s
Masterbank f 1<562 .o (N -aAPC (clone 1)
ot administ-ered usedo 1 • ' n yexvwo)
~ 1<562
~ Infusion (ad . . _,/ ministered)
Cryopreservatlon
Key
I CD86
.. (064
.. (019
/J>. ROR-1
""-C ROR-1-specifc CAR
• 4-1BBL
T 0
IL- 1 5-IL- 1 SRa
Transposon
0 Transposase (SB11)
(Q) T cell
c:::::::> K562 aAPC

24
Appendix 3. Phenotype of Clone1 aAPC used for propagation of ROR1-specific CAR+ T cells. Flow
cytometry was used to assess recombinant expression of antigens (CD19 and ROR1), membrane-bound
cytokines (IL-15 fused to IL-15Rα), co-stimulatory molecules (CD86 and CD137L), and Fc receptors (CD32
and CD64) on Clone1 aAPC. Isotype staining represented in open plots and filled plots represent antigen-
specific staining.
25
SUPPORTING DATA
Figure 1. ROR1 expression on OvCa in hypoxia and normoxia. OvCa cell lines were grown in normoxia (20%
O2) or hypoxia (1% O2) for three days at 37oC and were then stained for ROR1 expression with 4A5 monoclonal
antibody specific for ROR1.12 (A) Representative flow plots from A2780, EFO27, and OC314 cell lines where
black lines are normoxia, red lines are hypoxia, dashes are isotype controls, and solid lines are ROR1 staining.
(B) Normalized ROR1 (ROR1normal) mean fluorescence intensity (MFI) in OvCa cell lines in normoxia (open
bars) and hypoxia (closed bars). MFI was calculated by: MFIROR1 – MFIisotype.
26
Figure 2. Expansion of CAR+ T cells on ROR1+ aAPC. PBMC were electroporated with ROR1-specific
CARs signaling through CD28 (ROR1RCD28; closed squares) or CD137 (ROR1RCD137; open
sqares) and stimulated five times (each point on graphs) with ROR1+ aAPC along with IL-2 and IL-21. (A)
Total cell counts during culture period. (B) CAR+ T cell counts during culture period.

27
Figure 3. CAR expression after expansion on ROR1+ aAPC. Stable CAR expression after 29 days of
co- culture on ROR1+ aAPC. Sham electroporated "No DNA" cells were stimulated with OKT3-Ioaded aAPC
for negative controls. Gate frequencies are displayed in upper right corners.
28
Figure 4. Specific killing of ROR1+ tumor cells by CAR+ T cells. Standard 4-hour chromium release assays
were performed after 35 days of expansion on aAPC with CARneg (triangles), ROR1RCD28 (circles), or
ROR1RCD137 (squares) T cells against (A) EL4-ROR1neg, (B) EL4-ROR1+, (C) A2780 (ROR1neg OvCa), and
(D) EFO27 (ROR1+ OvCa) cell lines. Two-way ANOVA with Bonferroni’s post-tests used for statistical analyses
on triplicate measurements where *p<0.05 and ***p<0.001.

29
Figure 5. Expansion of γδ T cells on aAPC. (A) Flow cytometry of CD3 (y-axis) and TCRγδ (x-axis)
expression in PBMC prior to paramagnetic bead sorting at Day 0 and of T cell cultures after 22 days of co-
culture on aAPC. One representative donor of four healthy donors is shown and quadrant gate frequencies are
displayed in the upper right corners of flow plots. (B) Total inferred cell counts of viable cells during co-culture
period. (C) Fold expansion of cells in co-culture during co-culture period. Black lines are mean SD from 4
healthy donors, gray lines are individual donors, arrows represent stimulations with aAPC, and data are pooled
from two independent experiments.

30
Figure 6. TCRγδ expression on aAPC-expanded γδ T cells. (A) Flow cytometry of TCRδ2 and TCRδ1
expression in γδ T cells at day 22 of co-culture. (B) Flow cytometry of TCRδ2 and TCRγ9 expression in γδ T
cells at day 22 of co-culture. Numbers in lower right corners correlate with donor numbers in (A) and (B) where
quadrant frequencies are displayed in upper right corners. (C) Direct TCR expression array “DTEA” detection of
Vδ mRNA alleles in γδ T cells at day 22 of co-culture where Vδ1*01, Vδ2*02, and Vδ3*01 alleles are in
graphs from left to right, respectively, and each of the four donors are numbered on x-axes. (D) DTEA
detection of Vγ allele mRNA expression in γδ T cells at day 22. Lines are mean SD where each circle
represents an individual healthy donor grown in two independent experiments.

31
Figure 7. Cytokines and chemokines secreted by γδ T cells expanded on aAPC. Cells at day 22 were co-
cultured with a mock activation cocktail (complete media) or leukocyte activation cocktail (LAC;
PMA/Ionomycin) for 6 hours at 37oC. Conditioned media was interrogated on 27-Plex Luminex array to detect
cytokines and chemokines. A, Th2 cytokines. B, Th17 cytokines. C, Th1 cytokines. D, Chemokines. Data are
mean SD from 4 healthy donors. Student’s t-test performed for statistical analysis between mock and LAC
groups for each molecule. *p<0.05, **p<0.01, and ***p<0.001.

32
Figure 8. In vitro cytolysis of tumor cells by yo T cells. Standard 4-hour chromium release assays were
performed with increasing effector (y8 T cells) to target (E:T) ratios against healthy B cells from an
allogeneic donor (top left; one of four representative donors) and OvCa cell lines A2780, EF021,
EF027, IGROV1, OC314, UPN251, and CAOV3. Each line represents an individual effector where data is
mean ± SO (n = 3 wells per assay) from two independent experiments.
Allogeneic B cells A2780 EF021 EF027
60 ~ 60 ~ 60 ~ 60 ~ 0 0 0 0 50 rJi 50 rJi 50 rJi 50 (J) 40 -~ 40 -~ 40 -~ 40 ·u; >. 30 _J 30 _J 30
_J 30 _J
20 () ()
() 20 -.= 20 -.= 20 -.= ·u ·u ·u 10 10 <1.> 10 <1.> 10 <1.> Cl.. Cl.. Cl.. 0 0 C/) 0 C/) 0 C/)
-10 0 5 10 15 20 0 5 10 15 20 0 5 10 15 20 E:T ratio E:T ratio E:T ratio E:T ratio
IGROV1 OC314 70 UPN251 70
~ 60 ~ 60 ~ 60 ~ 60 0 0 -~ 50 (J) 50 rJi 50 .rJI 50
.:J 40 ·u; -~ 40 (J)
>. 40 .:J 40 .g 30 _J 30 _J 30 .S:2 30 () () - -~ 20 -.= 20 -.= 20 ·u 20 ·u ·u ~ 10
Cl.. <1.> 10 <1.> 10 C/) 10 Cl.. Cl..
C/) 0 C/) 0 C/) 0 0 0 5 10 15 20 0 5 10 15 20 0 5 10 15 20 0 5 10 15 20
E:T ratio E:T ratio E:T ratio E:T ratio
33
Figure 9. OvCa tumor clearance by polyclonal γδ T cells in vivo. (A) Schematic of experiment with legend to
right. (B) Kinetics of bioluminescent flux of CAOV3-ffLuc xenografts from mock treated (closed squares) and γδ T
cell treated (open squares) mice during experiment. Two-way ANOVA with Bonferroni’s post-tests was used
for statistical analysis where n = 10, *p<0.05, and ***p<0.001. (C) Representative images 43 days after
engraftment and treated with PBS (top panels) or γδ T cells (bottom panels). (D) Long-term BLI flux
comparison between day prior to treatment (Day 7; squares) and 79 days (circles) post-engraftment. Student’s t-
test performed between time points for each group with p-values above comparisons.

34
Figure 10. γδ T cells expanded on aAPC in normoxia and hypoxia and polarized towards IFNγ and IL-17
production. PBMC were sorted on TCRγ/δ+ isolation kit and 104 purified γδ T cells were then given a single
stimulation with either IL-21 (A and B) or IL-2 and IL-21 (C and D) along with no aAPC or 2x10⁴ aAPC with one
of the following co-stimulatory molecules: (i) none, (ii) CD70, (iii) CD86, (iv) 4-1BBL, (v) ICOS-L, or (vi) CD86 and
4-1BBL. Duplicate cultures were then placed in 20% O2 or 1% O2 for nine days at 37oC with humidified
conditions. (A and C) After the 9 day incubation, cells were counted using trypan blue exclusion. Numbers
above hatched bars represent fold changes of cytokine-treated cells compared to cultures without cytokines (bars
not hatched). (B and D) Remaining cells were then mock activated (black line) or activated with leukocyte
activation cocktail (LAC, PMA/Ionomycin, red line) for 6 hours in the presence of secretory inhibitor GolgiPlug at
the same oxygen concentration as the 9 day culture. Cells were then stained for CD3, TCRγδ, IFNγ, and IL-
17 and analyzed by flow cytometry. Data shown are histograms gated on CD3+TCRγδ+ cells where cytokine
detected (x-axis) is in upper right corner and y-axis is % of maximum value. Top panels are 4-1BBL cultures
and bottom panels are CD86/4-1BBL cultures. Left panels are 20% O2 and right panels are 1% O2.