primary productivity and water balance of grassland vegetation on
TRANSCRIPT
Primary Productivity and WaterBalance of Grassland Vegetation on
Three Soils in a Continuous CO2
Gradient: Initial Results from theLysimeter CO2 Gradient Experiment
Philip A. Fay,1* Alexia M. Kelley,2 Andrew C. Procter,2 Dafeng Hui,3 VirginiaL. Jin,1 Robert B. Jackson,2 Hyrum B. Johnson,1 and H. Wayne Polley1
1USDA-ARS Grassland Soil and Water Research Laboratory, 808 E Blackland Rd, Temple, Texas 76502, USA; 2Department of Biology
and Nicholas School of the Environment and Earth Sciences, Duke University, Durham, North Carolina 27708, USA; 3Department ofBiological Sciences, Tennessee State University, Nashville, Tennessee 37209, USA
ABSTRACT
Field studies of atmospheric CO2 effects on ecosys-
tems usually include few levelsof CO2 and a single soil
type, making it difficult to ascertain the shape of re-
sponses to increasing CO2 or to generalize across soil
types. The Lysimeter CO2 Gradient (LYCOG) cham-
bers were constructed to maintain a linear gradient of
atmospheric CO2 (�250 to 500 ll l-1) on grassland
vegetation established on intact soil monoliths from
three soil series. The chambers maintained a linear
daytime CO2 gradient from 263 ll l-1 at the subam-
bient end of the gradient to 502 ll l-1 at the super-
ambient end, as well as a linear nighttime CO2
gradient. Temperature variation within the chambers
affected aboveground biomass and evapotranspira-
tion, but the effects of temperature were small com-
pared to the expected effects of CO2. Aboveground
biomass on Austin soils was 40% less than on Bastrop
and Houston soils. Biomass differences between soils
resulted from variation in biomass of Sorghastrum
nutans, Bouteloua curtipendula, Schizachyrium scoparium
(C4 grasses), and Solidago canadensis (C3 forb), sug-
gesting the CO2 sensitivity of these species may differ
among soils. Evapotranspiration did not differ among
the soils, but the CO2 sensitivity of leaf-level photo-
synthesis and water use efficiency in S. canadensis was
greater on Houston and Bastrop than on Austin soils,
whereas the CO2 sensitivity of soil CO2 efflux was
greater on Bastrop soils than on Austin or Houston
soils. The effects of soil type on CO2 sensitivity may be
smaller for some processes that are tightly coupled to
microclimate. LYCOG is useful for discerning the ef-
fects of soil type on the CO2 sensitivity of ecosystem
function in grasslands.
Key words: carbon dioxide; climate change;
grassland; hydrology; net primary productivity;
photosynthesis; soil moisture; soil respiration; Soli-
dago canadensis.
INTRODUCTION
Atmospheric CO2 concentration (CA) has increased
by about 100 ll l-1 over the last 250 years to
approximately 380 ll l-1, its highest value since
Received 1 December 2008; accepted 11 March 2009;
published online 21 May 2009
Author Contributions: PF conceived study, analyzed data, and wrote the
paper. AK, AP analyzed data. DH, VJ, RJ, HJ, and WP conceived study,
and conducted research.
*Corresponding author; e-mail: [email protected]
Ecosystems (2009) 12: 699–714DOI: 10.1007/s10021-009-9247-3
� 2009 GovernmentEmployee: USDA Agricultural Research Service
699
the pre-industrial era. Further, CA has increased
more quickly in the last 30 years than in the prior
200 years (Forster and others 2007). Increasing CA
affects many ecosystem processes. Typically, field
studies have examined only two or a few experi-
mental levels of CA, making it difficult to detect the
presence of non-linear or threshold responses to
CA. These field experiments also have typically
been constrained to one soil type. However, CO2
change is continuous, and soils differ in hydrologic
and biogeochemical properties that can constrain
ecosystem responses to increasing CA. For example,
soil texture mediates the distribution of water in
the soil profile (Noy-Meir 1973), its availability to
plants (Brady and Weil 2002), the availability of
organic substrates to decomposers (Jenkinson
1977; Oades 1988), and the accumulation of or-
ganic matter (Hassink 1996). Therefore, the im-
pacts of multiple levels of CA on ecosystem function
must be understood on different soil types to re-
solve the shape of ecosystem productivity, carbon
cycling, and community structure as a function of
CA, to understand variation in these and other re-
sponses across soils, and ultimately to predict spa-
tial variation in ecosystem structure and function
under future climate scenarios (Ainsworth and
Long 2005; Rogers and others 2006).
The Lysimeter CO2 Gradient (LYCOG) facility
was constructed to impose a continuous gradient of
CA representing pre-industrial to mid twenty-first
century levels (�250 to 500 ll l-1) on multiple soil
types. LYCOG consists of outdoor chambers suited
for grassland or other short-statured ( £ �1 m tall)
vegetation. The design objectives were to maintain
the prescribed gradient in CA while also controlling
air temperature (TA) and precipitation inputs near
ambient values. LYCOG evolved from previous CA
gradient systems (Mayeux and others 1993; John-
son and others 2000) but incorporates several new
features, (1) intact, hydrologically isolated soil
monoliths from three soil series initially planted to
the same species of native perennial grasses and
forbs, (2) weighing lysimeters, and (3) a system to
sample drainage water exiting the bottom of the
monoliths. These features allow more precise
evaluation of soil type effects on ecosystem pro-
cesses and resolution of the effect of CO2 on the
water and carbon budgets of these soils than would
be possible in field plots.
Here our objectives are to (1) review the lineage
of CO2 gradient facilities that led to the LYCOG
facility and the major results each provided, (2)
document chamber function in terms of control of
CO2 and air temperature, (3) quantify the pre-CO2
treatment plant species assemblages and soil C and
N concentrations, (4) evaluate preliminary re-
sponses to CA in aboveground net primary pro-
ductivity, leaf photosynthesis, soil respiration, and
the ecosystem water budget.
PREVIOUS CO2 GRADIENT FACILITIES
LYCOG is the third generation of CO2 gradient
facilities. It was preceded by a prototype gradient
experiment that established the viability of the
technique, and then by a field facility. All three
CO2 gradient facilities rely on the simple concept
that sunlit plants photosynthesizing in an enclosed
linear chamber will deplete CO2 from parcels of air
moving directionally through the chamber. This
linear chamber approach results in continuously
varying CA, and a unique capacity to evaluate
plants and soils for linear, non-linear, and thresh-
old responses to changing CA.
Prototype Subambient to AmbientGradient
Mayeux and others (1993) constructed the first
CO2 gradient facility at the USDA laboratory at
Temple, Texas, USA. It consisted of a 38 m
long 9 45 cm wide serpentine chamber con-
structed in a greenhouse. The upper portion of the
chamber was a clear polyethylene tube enclosing
the aerial growth of plants, fixed to a 76 cm deep
lower portion filled with soil. The chamber was
supplied with ambient air, which during daylight
was depleted to approximately 200 ll l-1. Air
temperature was controlled by a system of chilled
water cooling coils and electrical resistance heaters.
The system was well suited for leaf-level physio-
logical studies of plant responses to subambient
variation in CO2 concentrations.
Monocultures and simple mixtures of species
including Triticum aestivum, Avena sativa, Brassica
kaber, and Schizachyrium scoparium were successfully
grown in this chamber to examine the effects of
increases in CA from subambient to ambient values
on vegetation function. Most species examined
showed increases in total biomass, photosynthetic
carbon assimilation, water and nitrogen use effi-
ciencies, and decreased stomatal conductance in C4
species (Polley and others 1992a, 1992b, 1993a,
1993b, 1994, 1995, 1996). These results suggested
that sizeable changes in ecosystem function and
plant growth may already have occurred in re-
sponse to rising CA, including increased vegetation
productivity (Johnson and others 1993; Polley and
others 1993a) and increased growth of woody
species over dominant grasses (Polley and others
700 P. A. Fay and others

1994) because of reduced water limitation (Polley
and others 1995).
The Prairie CO2 Gradient (PCG)
The PCG facility was the first field implementation
of a self-maintaining CO2 gradient, on perennial C4
grassland at Temple, Texas, USA (31�05¢ N, 97�20¢W). Advancements of PCG over the greenhouse
prototype included (1) extension of the gradient to
superambient concentrations, (2) a nighttime CA
gradient, created by reversing the direction of air
flow, and allowing nighttime plant + soil respira-
tion to progressively increase CA. PCG achieved
gradients of about 550–200 ll l-1 during daytime,
and approximately 720–370 ll l-1 at night using
two linear chambers enclosing 100 linear m of in-
tact grassland (Johnson and others 2000).
PCG’s subambient to superambient gradient al-
lowed for evaluation of the shape (linear or
nonlinear) of ecosystem responses under condi-
tions representing a continuum from past to fu-
ture CA. Responses varied among the ecosystem
processes that were studied. For example, plant
water status, leaf carbon assimilation and water
use efficiency increased linearly across the gradi-
ent (Anderson and others 2001). However, during
the 4 years of the PCG study, aboveground net
primary productivity increased linearly with CA in
some years, but the increase was nonlinear in
others, showing less increase at superambient CA
(Polley and others 2003). Soil organic carbon
content also increased from subambient to ambi-
ent CA but not beyond, and decomposition of
older soil C increased at superambient CA,
whereas N mineralization rates decreased (Gill and
others 2002). These results were consistent with N
limitation of ANPP at above-ambient CA. To-
gether, the studies from the PCG facility suggested
that linear increases in plant water status or pro-
ductivity may not translate into increased soil C if
N or other resources limit ecosystem function (Gill
and others 2006).
The Lysimeter CO2 Gradient (LYCOG)
LYCOG is the second field implementation of a self-
maintaining CO2 gradient. LYCOG built on PCG by
incorporating multiple soils and the capacity to
completely close ecosystem water budgets. The
overarching goal of LYCOG is to test the hypothesis
that soil properties will influence, and could even
override, the effects of CA on NPP, decomposition
(Epstein and others 2002; Jenkinson 1977; Oades
1988), C accumulation in soil (Hagedorn and
others 2003), and plant community structure
among other processes.
METHODS
Study Site
LYCOG is located on the same site as PCG. The
original native vegetation was Blackland Prairie,
which is the southern extension of the North
American tallgrass prairie. Intact Blackland Prairie
plant communities are dominated by C4 grasses
accounting for most of the biomass, accompanied
by numerous forb species. Less than 5% of this
ecosystem remains in Central Texas, but it is an
important benchmark for the structure and func-
tion of the diverse native grassland ecosystems in
this region. The climate is classified as subtropical,
and LYCOG is in an area of transition between
humid and sub-humid zones. Mean annual pre-
cipitation is 914 mm (1971–2000), falling in a bi-
modal distribution with growing season wet
periods in May–June and September–October, and
a pronounced July–August dry period. Precipita-
tion patterns are governed by interactions between
onshore flows of tropical maritime air from the
Gulf of Mexico and colder continental air masses.
Temperatures range from a July–August mean
maximum of 35�C to a December mean minimum
of 2.9�C. The mean frost free period is approxi-
mately 250 days, from mid March to late Novem-
ber.
Chamber Design
LYCOG uses the aboveground chamber, CO2
enrichment, temperature control, and monitoring
systems from PCG to enclose a CO2 gradient over
intact soil monoliths. There are again two linear
chambers, arranged in parallel on a north–south
axis (Figure 1). Each chamber is 1.2 m wide, 1.5 m
tall, and 60 m long, divided into 10–5 m long sec-
tions. Each section houses a steel container
5 9 1.2 9 1.6 m3 deep buried to 1.5 m. Each con-
tainer accommodates four 1 9 1 9 1.5 m deep in-
tact soil monoliths housed in water-tight steel
boxes (Polley and others 2008). Adjacent contain-
ers are joined by a 1-m sheet-metal plenum hous-
ing a chilled-water cooling coil. The coils are
supplied by a 161.4 kW refrigeration unit that cir-
culates coolant at 10�C.
Eighty intact soil monoliths were excavated in
2002 from three soil series: Houston Black clay (32
monoliths), a vertisol (Udic Haplustert) typical of
lowlands; Austin (32 monoliths), a high carbonate,
silty clay mollisol (Udorthentic Haplustol) typical of
A Grassland CO2 Gradient with Varying Soils 701
uplands, and Bastrop (16 monoliths), an alluvial
sandy loam alfisol (Udic Paleustalf). These soils were
chosen because they represent the broad range of
texture, N and C content, and hydrologic properties
of grasslands in the southern portion of the U.S.
Central Plains. Two monoliths each of two of the soil
types were placed randomly in each of the 20 con-
tainers. Bastrop soils were included in the pairings in
even numbered sections. Sixty of the 80 monoliths
(all Bastrop, 22 each of Austin and Houston) are
weighed continuously on scales (4500 kg capacity,
450 g precision; Avery Weigh-Tronix, Fairmont,
Minnesota, USA). The remaining monoliths serve as
non-weighing lysimeters. Water that has drained to
the bottom of the monoliths is channeled through a
fiberglass wick into a 10 l reservoir attached to the
bottom of each steel box. The reservoir is connected
to a drainage water measurement system. A vacuum
extracts each reservoir’s contents for gravimetric
determination of drainage volume and for collection
of a water sample.
The vegetation is enclosed with clear polyethyl-
ene (.006¢¢/.15 mm; Figure 1). This film transmits
more than 90% of incident light with minimal ef-
fects on spectral quality, and is similar to polyeth-
ylene films used in other global change
experiments (Fay and others 2003). The polyeth-
ylene is fitted with zippers backed by draft flaps to
allow access to the monoliths for sampling. The
polyethylene is replaced at the beginning of each
growing season to minimize the effects of photo-
degradation on light transmittance. The polyeth-
ylene is removed during winter and the vegetation
is exposed to ambient conditions.
CO2 Treatment
There were three treatment objectives. (1) Main-
tain a constant linear daytime gradient in CA from
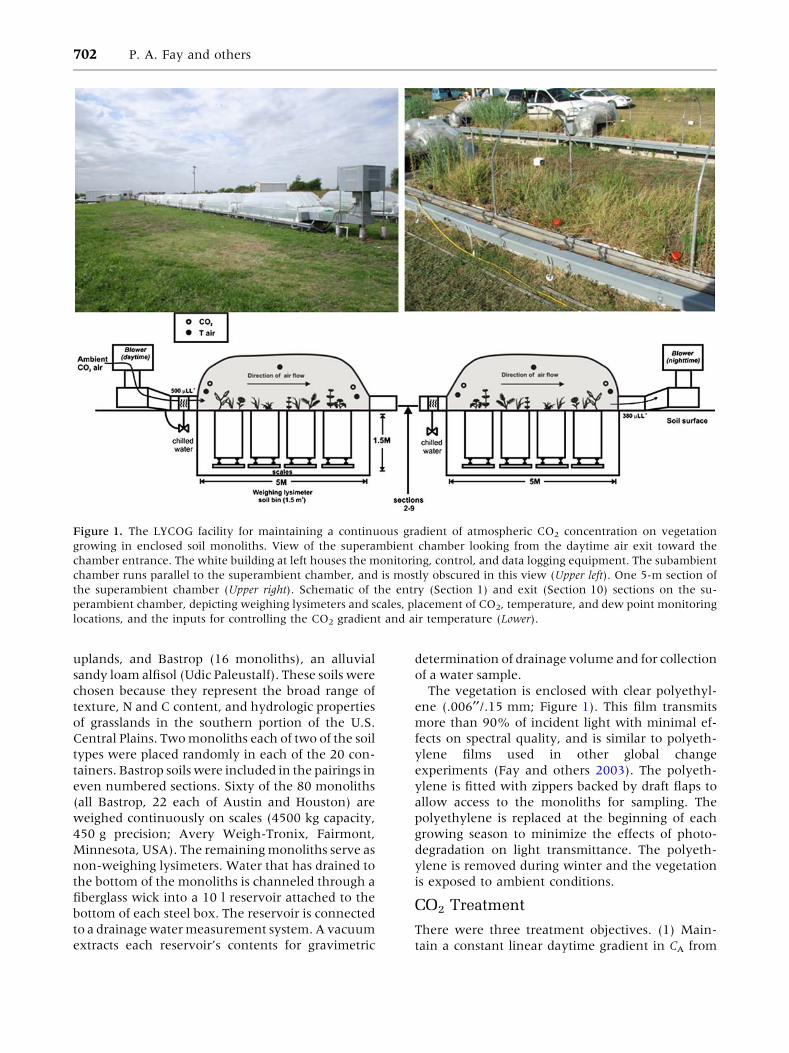
Figure 1. The LYCOG facility for maintaining a continuous gradient of atmospheric CO2 concentration on vegetation
growing in enclosed soil monoliths. View of the superambient chamber looking from the daytime air exit toward the
chamber entrance. The white building at left houses the monitoring, control, and data logging equipment. The subambient
chamber runs parallel to the superambient chamber, and is mostly obscured in this view (Upper left). One 5-m section of
the superambient chamber (Upper right). Schematic of the entry (Section 1) and exit (Section 10) sections on the su-
perambient chamber, depicting weighing lysimeters and scales, placement of CO2, temperature, and dew point monitoring
locations, and the inputs for controlling the CO2 gradient and air temperature (Lower).
702 P. A. Fay and others
500 to 380 ll l-1 in the superambient chamber,
and from 380 to 250 ll l-1 in the subambient cham-
ber (nighttime: �720–500 and 500–380 ll l-1,
respectively), (2) maintain constant TA along the
length of the chambers and track the daytime
ambient air temperature outside the chambers, and
(3) provide precipitation inputs representative of
an average year in total amount and seasonal dis-
tribution. The CO2 treatment was first applied in
May 2006, and is applied for that portion of each
growing season when the photosynthetic capacity
of the vegetation is adequate to maintain the CA
gradient, usually late April to early November. CO2
treatments were applied with a system consisting of
infrared gas analyzers (IRGAs; Li 6262, LiCor Bio-
sciences, Lincoln, Nebraska, USA), filtered air
sample lines at the entry and exit of each linear
50 m chamber, a quantum sensor for measuring
ambient photosynthetic photon flux (PFD) densi-
ties, and a mass flow controller for injecting precise
volumes of CO2 at the superambient chamber
entrance. The gradient endpoints were controlled
by measuring chamber entry and exit CA at 2-min
intervals. At the entrance to the superambient
chamber, the mass flow controller adds the
appropriate amount of pure CO2 to enrich the
incoming air to 500 ll l-1. The enriched air is
advected through the chamber by a blower fan
mounted at the entrance to section 1, supple-
mented by fans in sections 3, 5, and 7. The desired
exit CA (380 ll l-1) is controlled by adjusting the
blower speed. If the exit CA is below the set point,
blower speed is increased, resulting in less time for
plant uptake and a higher exit CA. Likewise, blower
speed is decreased if exit CA is above the set point.
Fan speed is also continuously adjusted for diurnal
and cloud-induced variation in PFD using inputs
from the quantum sensor to an algorithm relating
the direction and magnitude of PFD changes to the
deviation in CA from the set point. Air flow at the
chamber entrance at maximum blower speed
(800 rpm) is 380 l s-1, decaying to 160 l s-1 (�0.5–
0.2 m s-1) at the chamber exit because of leaks and
internal resistance. CA and dew point temperature
(TDP) at the entry and exit of each section are
measured on separate monitoring IRGAs and val-
ues stored at 20-min intervals. Nighttime control of
CA is identical to daytime control except the flow of
air is reversed using nighttime blowers (Figure 1),
CO2 is injected into the opposite end of the super-
ambient chamber, and nighttime respiration pro-
gressively increases CA. The CO2 treatment requires
an external CO2 source of approximately 3,700 l
per month, a small supply requirement com-
pared to other methods of ecosystem-level CO2
manipulation, such as free air CO2 exchange or
open top chambers (Kimball 1992; Rogers and
others 2006).
TA is controlled so that the midpoint of each
section tracks ambient air temperature. An aspi-
rated thermistor is suspended mid-section at
0.75 m above the monoliths. The thermistor con-
trols the flow of coolant through the cooling coil at
the entrance of each section. Separate control of
temperature in each section is necessary because
evapotranspiration differs among sections, causing
differences in energy balance. TA at each section
entry and exit is measured with shielded fine wire
thermocouples.
Water from an onsite well is applied to the
monoliths by a metered drip irrigation system in
volumes and temporal patterns that replicate an
average precipitation year. Applications are con-
trolled and logged by a data logger and are verified
by the measurements of monolith mass.
Pre-Treatment Soil Texture, C, and N
Soil texture was quantified using the rapid method
of Kettler and others (2001) on 1 m deep 9 4.2 cm
diameter soil cores collected in 2002 during exca-
vation of the monoliths. Soils from 0–10, 10–20,
20–30, 30–50, and 50–100 cm segments were
homogenized, and 15 g of soil was suspended in
3% sodium hexametaphosphate. Sand was sepa-
rated from the suspension by passage through a
0.05 mm sieve. The remaining material was
resuspended and allowed to settle for 6 h. The
supernatant containing suspended silt was dis-
carded. Clay and sand fractions were weighed after
drying to constant mass at 105�C. Silt mass was
determined by difference, and all masses expressed
as a percentage of the total mass. An additional 0.5–
1.0 g of homogenized soil was analyzed at 900�Cfor total %N and %C and at 600�C for organic %C
on a combustion gas chromatograph (Variomax
CN, Elementar Instruments, Hanau, Germany).
Plant Establishment and Pre-TreatmentPlant Biomass
To establish experimental plant communities on
the three soils, the original vegetation on the
monoliths was killed with a non-residual herbicide
(glyphosate), and planted in spring 2003 with
seedlings of perennial grass and forb species char-
acteristic of Central Texas Blackland prairie. Eight
plants of each of five grass species [Bouteloua
curtipendula (side-oats grama), Panicum obtusum
(vinemesquite), Schizachyrium scoparium (little
A Grassland CO2 Gradient with Varying Soils 703
bluestem), Sorghastrum nutans (Indiangrass), and
Tridens albescens (white tridens)] and three forb
species [Salvia azurea (pitcher sage), Solidago canad-
ensis (Canada goldenrod), and the legume Desman-
thus illinoensis (Illinois bundleflower)] were
transplanted into each monolith at a total density of
64 plants per m2 during May 2003. Seedlings were
planted in a Latin Square design that was re-ran-
domized for each monolith. Transplants were
watered during the initial 2 months to promote
establishment, but thereafter received only rainfall
until CO2 treatments began. Other species that
emerged in the monoliths were removed. The grass
P. obtusum proved to be highly aggressive and was
removed in 2004 by cutting each plant beneath the
crown. In addition, grubs (Coleoptera: Scarabaei-
dae) infested 20 monoliths of Houston and Austin
soils. These were replanted in spring 2007 with well-
watered and fertilized monocultures of Panicum
virgatum (switchgrass) to maintain the assimilation
capacity of the gradient, and to examine the re-
sponse of this species to the CA gradient. The Pani-
cum monocultures are not considered further here.
Aboveground net primary productivity (ANPP)
was measured each November. All current year
growth of each species was clipped from the entire
1 m2 monolith at 10 cm above the soil surface,
dried to constant mass, and weighed. ANPP was
measured similarly in subsequent years. Vertical
profiles of volumetric soil water content (vSWC) in
the top meter of each monolith were measured
biweekly with a calibrated neutron attenuation
probe (503DR Hydroprobe, CPN International,
Concord, California, USA) in permanently installed
access tubes. Soil temperature at 10 and 30 cm
depth was measured with fine wire thermocouples
in a total of 18 monoliths, pairs of each soil type at
high, intermediate, and low CA.
Monolith C and N pools were measured again
after the 2005 growing season (early January 2006)
prior to the CO2 treatment and after the third
growing season for the experimental plant com-
munities. The monoliths were cored (1 m
deep 9 2.5 cm) and divided into 0–5, 5–10, 10–20,
20–30, 30–50, and 50–100 cm segments. Roots
were separated from soil, dried to constant mass at
60�C, and weighed. Total %N, %C, and organic
%C were measured as before.
Preliminary Responses to CO2
Treatments
Leaf-level carbon and water exchange were
measured on the forb Solidago canadensis and grass
Sorghastrum nutans in 12 of the 20 sections, on one
or two leaves on two plants per species per cham-
ber section. The plants chosen had typical vigor for
that soil type and CO2, and the chosen leaves were
recently fully expanded, and also of typical vigor.
Leaves were measured for net carbon assimilation
(ACO2) and transpiration rate (E) with an infrared
gas analyzer (LI-6400 LiCor Biosciences, Inc., Lin-
coln, Nebraska, USA) using a 2 9 3 cm leaf cuv-
ette, CO2 mixer, and 85:15 red:blue light source.
Leaf chamber illumination was controlled at
1500 lmol m-2 s-1 photon flux density, leaf tem-
perature at 30�C, and leaf cuvette H2O mole frac-
tion and [CO2] to the conditions maintained at that
position along the gradient. The plants were mea-
sured on a day when the chamber was opened for
monthly sampling (13 June 2007) during the per-
iod of rapid plant growth. In preliminary sampling,
leaves (both species) measured with the chamber
open and the leaf cuvette simulating closed cham-
ber conditions gave readings indistinguishable from
leaves measured with the chamber closed
(P = 0.10–0.90). Surface (0–10 cm) volumetric soil
water content (vSWC) during the gas exchange
measurements was measured with a time domain
reflectometry (TDR) probe (Fieldscout TDR 200,
Spectrum Technologies, Plainfield, Illinois, USA).
vSWC was computed from soil-specific calibrations.
Soil CO2 efflux (JCO2) was also measured when
the chambers were open (13 June 2007) on the 60
monoliths planted to mixtures of prairie species.
JCO2was measured with a LiCor LI 6400 IRGA
fitted with a soil respiration chamber. Two mea-
surements were taken per monolith by placing the
chamber on 10-cm deep PVC collars inserted in the
soil to 7.5 cm depth. Each measurement was based
on a 20 ll l-1 change in CO2 centered on ambient
CA. This technique provides an estimate of how
combined root + microbial respiration differed
among soils because of preceding CO2 treatments.
Rates were corrected for soil chamber insertion
depth using SoilRecomp Version 1.3 software
(LI-COR, Inc., Lincoln, Nebraska).
A water balance was tabulated for the month of
May 2008, a period of rapid plant growth. Total
irrigation inputs for this month were determined
by summing the increases in monolith mass on the
days when water was applied. Evapotranspiration
(ET) was determined by summing the decreases in
monolith mass on non-watering days. The portion
of ET that was greater than irrigation inputs was
classified as ET from storage, and represented
depletion of prior soil moisture stores. Deep
drainage was determined by summing the water
removed from the reservoirs at the base of the
monoliths during this period.
704 P. A. Fay and others
Data Analysis
CA, TA, and TDP from mid April to early Novem-
ber 2007 were examined to characterize daytime
(0830–1730) and nighttime (2100–0530) control
of these parameters in the chambers. Vapor
pressure deficit (VPD) was computed from TA and
TDP. ANPP, ET (June 1–July 18 2006), 0–20 cm
vSWC (neutron probe), and soil temperature at
10 and 30 cm were averaged by monolith posi-
tion within the sections to evaluate their associ-
ation with TA variation within sections. The
estimated effect of monolith position on ANPP
was compared to the effect of CO2 on ANPP by
fitting a second order polynomial to the ANPP
data, and then adjusting the resulting predicted
ANPP curve for the effect of position within sec-
tion on biomass.
Pre-treatment differences in aboveground bio-
mass between soil types were evaluated for statis-
tical significance using linear mixed model
procedures with the monolith as the experimental
unit. Soil type was a fixed effect, and species was
considered a spatially repeated measure, because
the species biomasses within a monolith are not
independent. This enabled computation of a
covariance matrix to determine correlations be-
tween species in biomass changes during estab-
lishment. Differences among soils in ET, leaf
physiology, soil respiration, and 0–10 cm vSWC
(TDR) were evaluated for statistical significance
using linear mixed model procedures, again with
the monolith as experimental unit, soil type as
fixed effect, and CA as a covariate. All analyses were
conducted using SAS v9.1.3 (SAS Institute Inc.
2003).
RESULTS
Chamber Function: CO2, Temperature,and VPD
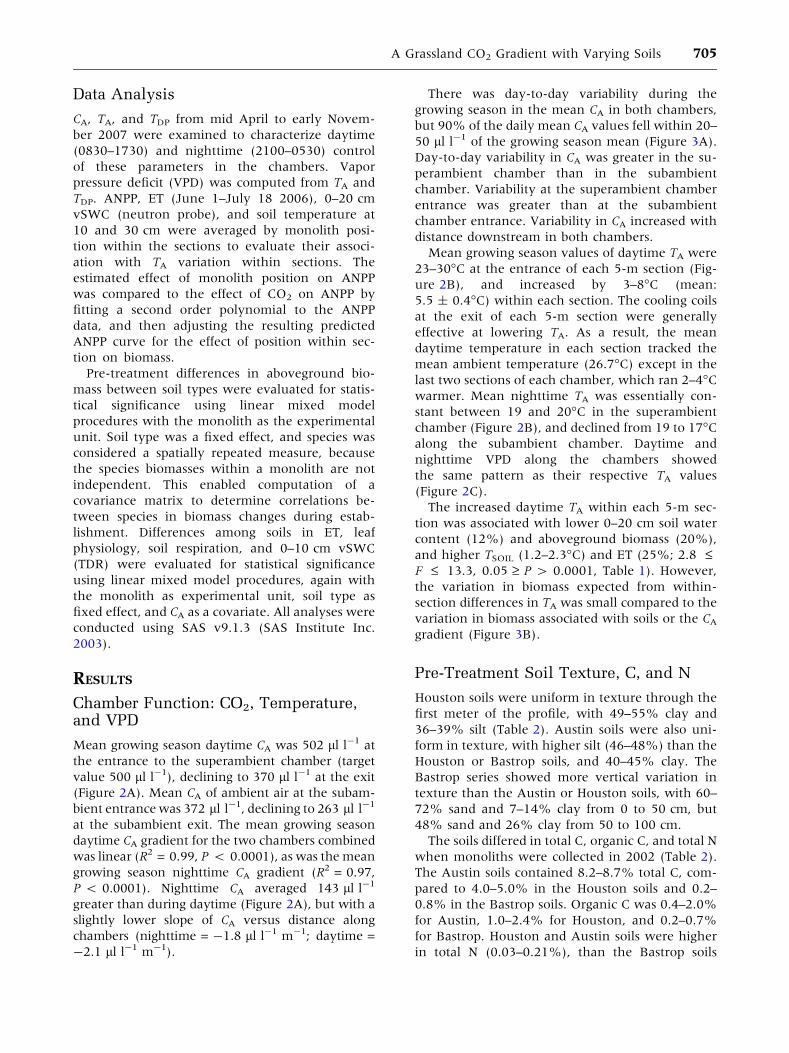
Mean growing season daytime CA was 502 ll l-1 at
the entrance to the superambient chamber (target
value 500 ll l-1), declining to 370 ll l-1 at the exit
(Figure 2A). Mean CA of ambient air at the subam-
bient entrance was 372 ll l-1, declining to 263 ll l-1
at the subambient exit. The mean growing season
daytime CA gradient for the two chambers combined
was linear (R2 = 0.99, P < 0.0001), as was the mean
growing season nighttime CA gradient (R2 = 0.97,
P < 0.0001). Nighttime CA averaged 143 ll l-1
greater than during daytime (Figure 2A), but with a
slightly lower slope of CA versus distance along
chambers (nighttime = -1.8 ll l-1 m-1; daytime =
-2.1 ll l-1 m-1).
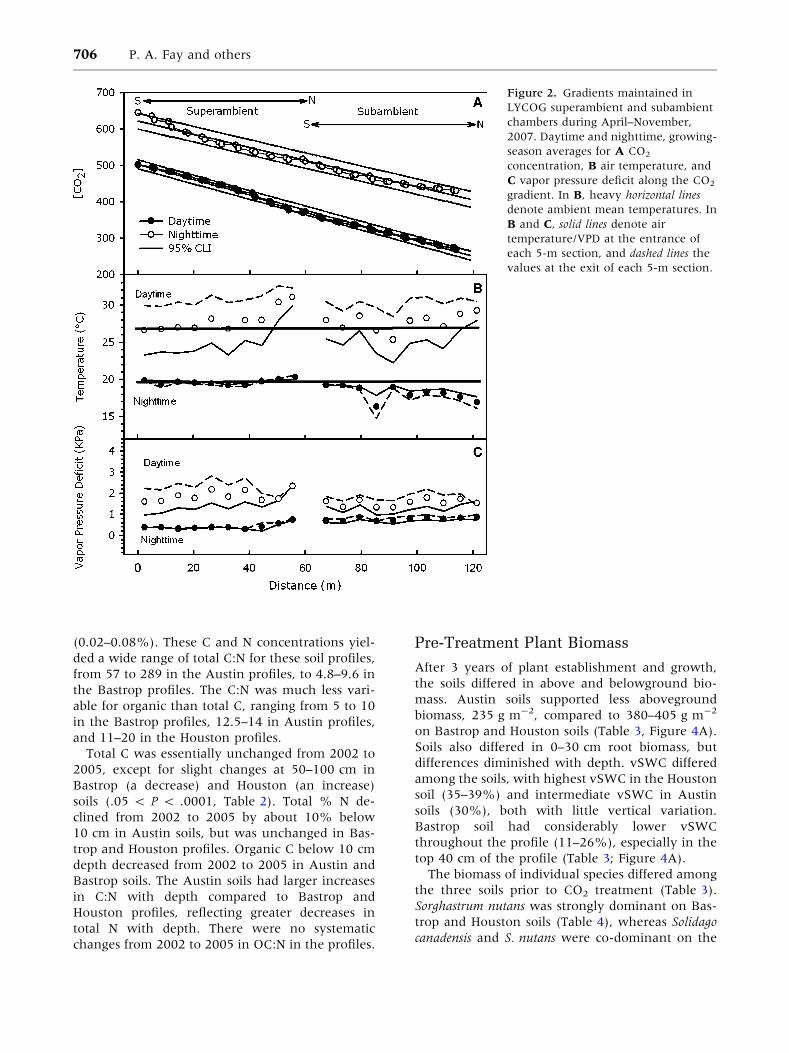
There was day-to-day variability during the
growing season in the mean CA in both chambers,
but 90% of the daily mean CA values fell within 20–
50 ll l-1 of the growing season mean (Figure 3A).
Day-to-day variability in CA was greater in the su-
perambient chamber than in the subambient
chamber. Variability at the superambient chamber
entrance was greater than at the subambient
chamber entrance. Variability in CA increased with
distance downstream in both chambers.
Mean growing season values of daytime TA were
23–30�C at the entrance of each 5-m section (Fig-
ure 2B), and increased by 3–8�C (mean:
5.5 ± 0.4�C) within each section. The cooling coils
at the exit of each 5-m section were generally
effective at lowering TA. As a result, the mean
daytime temperature in each section tracked the
mean ambient temperature (26.7�C) except in the
last two sections of each chamber, which ran 2–4�Cwarmer. Mean nighttime TA was essentially con-
stant between 19 and 20�C in the superambient
chamber (Figure 2B), and declined from 19 to 17�Calong the subambient chamber. Daytime and
nighttime VPD along the chambers showed
the same pattern as their respective TA values
(Figure 2C).
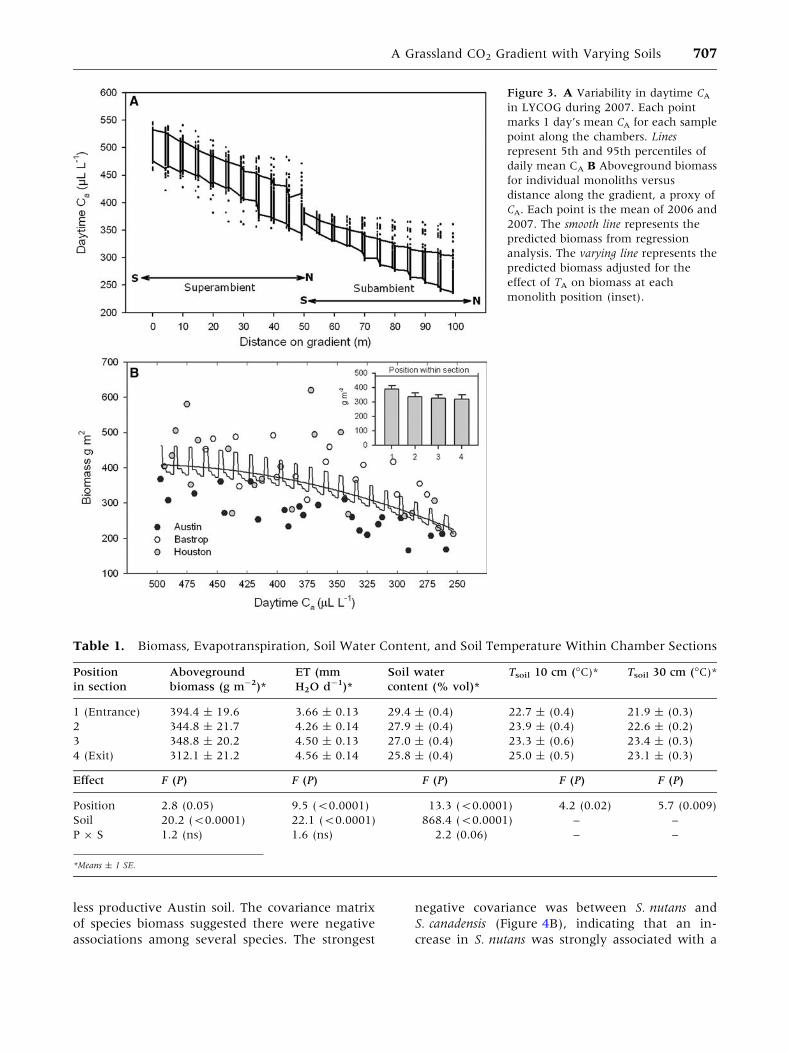
The increased daytime TA within each 5-m sec-
tion was associated with lower 0–20 cm soil water
content (12%) and aboveground biomass (20%),
and higher TSOIL (1.2–2.3�C) and ET (25%; 2.8 £F £ 13.3, 0.05 ‡ P > 0.0001, Table 1). However,
the variation in biomass expected from within-
section differences in TA was small compared to the
variation in biomass associated with soils or the CA
gradient (Figure 3B).
Pre-Treatment Soil Texture, C, and N
Houston soils were uniform in texture through the
first meter of the profile, with 49–55% clay and
36–39% silt (Table 2). Austin soils were also uni-
form in texture, with higher silt (46–48%) than the
Houston or Bastrop soils, and 40–45% clay. The
Bastrop series showed more vertical variation in
texture than the Austin or Houston soils, with 60–
72% sand and 7–14% clay from 0 to 50 cm, but
48% sand and 26% clay from 50 to 100 cm.
The soils differed in total C, organic C, and total N
when monoliths were collected in 2002 (Table 2).
The Austin soils contained 8.2–8.7% total C, com-
pared to 4.0–5.0% in the Houston soils and 0.2–
0.8% in the Bastrop soils. Organic C was 0.4–2.0%
for Austin, 1.0–2.4% for Houston, and 0.2–0.7%
for Bastrop. Houston and Austin soils were higher
in total N (0.03–0.21%), than the Bastrop soils
A Grassland CO2 Gradient with Varying Soils 705
(0.02–0.08%). These C and N concentrations yiel-
ded a wide range of total C:N for these soil profiles,
from 57 to 289 in the Austin profiles, to 4.8–9.6 in
the Bastrop profiles. The C:N was much less vari-
able for organic than total C, ranging from 5 to 10
in the Bastrop profiles, 12.5–14 in Austin profiles,
and 11–20 in the Houston profiles.
Total C was essentially unchanged from 2002 to
2005, except for slight changes at 50–100 cm in
Bastrop (a decrease) and Houston (an increase)
soils (.05 < P < .0001, Table 2). Total % N de-
clined from 2002 to 2005 by about 10% below
10 cm in Austin soils, but was unchanged in Bas-
trop and Houston profiles. Organic C below 10 cm
depth decreased from 2002 to 2005 in Austin and
Bastrop soils. The Austin soils had larger increases
in C:N with depth compared to Bastrop and
Houston profiles, reflecting greater decreases in
total N with depth. There were no systematic
changes from 2002 to 2005 in OC:N in the profiles.
Pre-Treatment Plant Biomass
After 3 years of plant establishment and growth,
the soils differed in above and belowground bio-
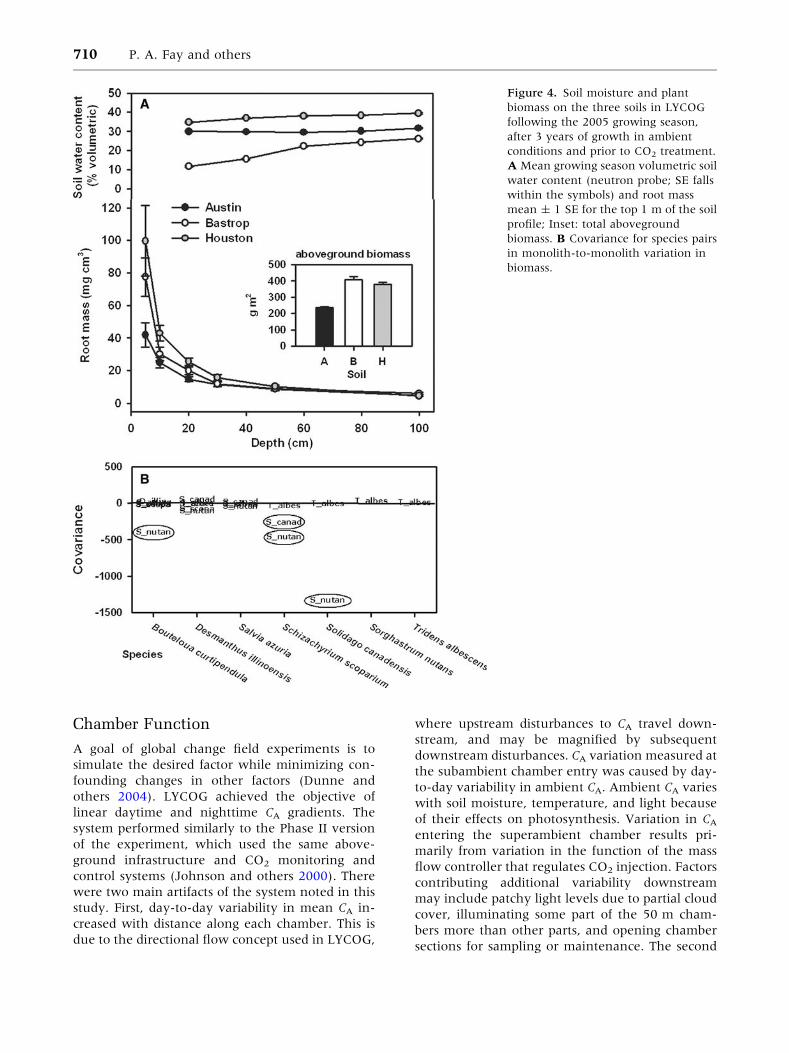
mass. Austin soils supported less aboveground
biomass, 235 g m-2, compared to 380–405 g m-2
on Bastrop and Houston soils (Table 3, Figure 4A).
Soils also differed in 0–30 cm root biomass, but
differences diminished with depth. vSWC differed
among the soils, with highest vSWC in the Houston
soil (35–39%) and intermediate vSWC in Austin
soils (30%), both with little vertical variation.
Bastrop soil had considerably lower vSWC
throughout the profile (11–26%), especially in the
top 40 cm of the profile (Table 3; Figure 4A).
The biomass of individual species differed among
the three soils prior to CO2 treatment (Table 3).
Sorghastrum nutans was strongly dominant on Bas-
trop and Houston soils (Table 4), whereas Solidago
canadensis and S. nutans were co-dominant on the
Figure 2. Gradients maintained in
LYCOG superambient and subambient
chambers during April–November,
2007. Daytime and nighttime, growing-
season averages for A CO2
concentration, B air temperature, and
C vapor pressure deficit along the CO2
gradient. In B, heavy horizontal lines
denote ambient mean temperatures. In
B and C, solid lines denote air
temperature/VPD at the entrance of
each 5-m section, and dashed lines the
values at the exit of each 5-m section.
706 P. A. Fay and others
less productive Austin soil. The covariance matrix
of species biomass suggested there were negative
associations among several species. The strongest
negative covariance was between S. nutans and
S. canadensis (Figure 4B), indicating that an in-
crease in S. nutans was strongly associated with a
Figure 3. A Variability in daytime CA
in LYCOG during 2007. Each point
marks 1 day’s mean CA for each sample
point along the chambers. Lines
represent 5th and 95th percentiles of
daily mean CA B Aboveground biomass
for individual monoliths versus
distance along the gradient, a proxy of
CA. Each point is the mean of 2006 and
2007. The smooth line represents the
predicted biomass from regression
analysis. The varying line represents the
predicted biomass adjusted for the
effect of TA on biomass at each
monolith position (inset).
Table 1. Biomass, Evapotranspiration, Soil Water Content, and Soil Temperature Within Chamber Sections
Position
in section
Aboveground
biomass (g m-2)*
ET (mm
H2O d-1)*
Soil water
content (% vol)*
Tsoil 10 cm (�C)* Tsoil 30 cm (�C)*
1 (Entrance) 394.4 ± 19.6 3.66 ± 0.13 29.4 ± (0.4) 22.7 ± (0.4) 21.9 ± (0.3)
2 344.8 ± 21.7 4.26 ± 0.14 27.9 ± (0.4) 23.9 ± (0.4) 22.6 ± (0.2)
3 348.8 ± 20.2 4.50 ± 0.13 27.0 ± (0.4) 23.3 ± (0.6) 23.4 ± (0.3)
4 (Exit) 312.1 ± 21.2 4.56 ± 0.14 25.8 ± (0.4) 25.0 ± (0.5) 23.1 ± (0.3)
Effect F (P) F (P) F (P) F (P) F (P)
Position 2.8 (0.05) 9.5 (<0.0001) 13.3 (<0.0001) 4.2 (0.02) 5.7 (0.009)
Soil 20.2 (<0.0001) 22.1 (<0.0001) 868.4 (<0.0001) – –
P 9 S 1.2 (ns) 1.6 (ns) 2.2 (0.06) – –
*Means ± 1 SE.
A Grassland CO2 Gradient with Varying Soils 707
decrease in S. canadensis. This negative association
was apparent in the biomass values (Table 4). On
Bastrop and Houston soils the biomass of S. canad-
ensis was relatively low compared to S. nutans, and
on Austin soils S. canadensis biomass increased
compared to S. nutans. Sizeable negative covari-
ances were also found between Schizachyrium
scoparium and both S. nutans and S. canadensis, and
between Bouteloua curtipendula and S. nutans.
Covariances near zero for the forbs Tridens albescens,
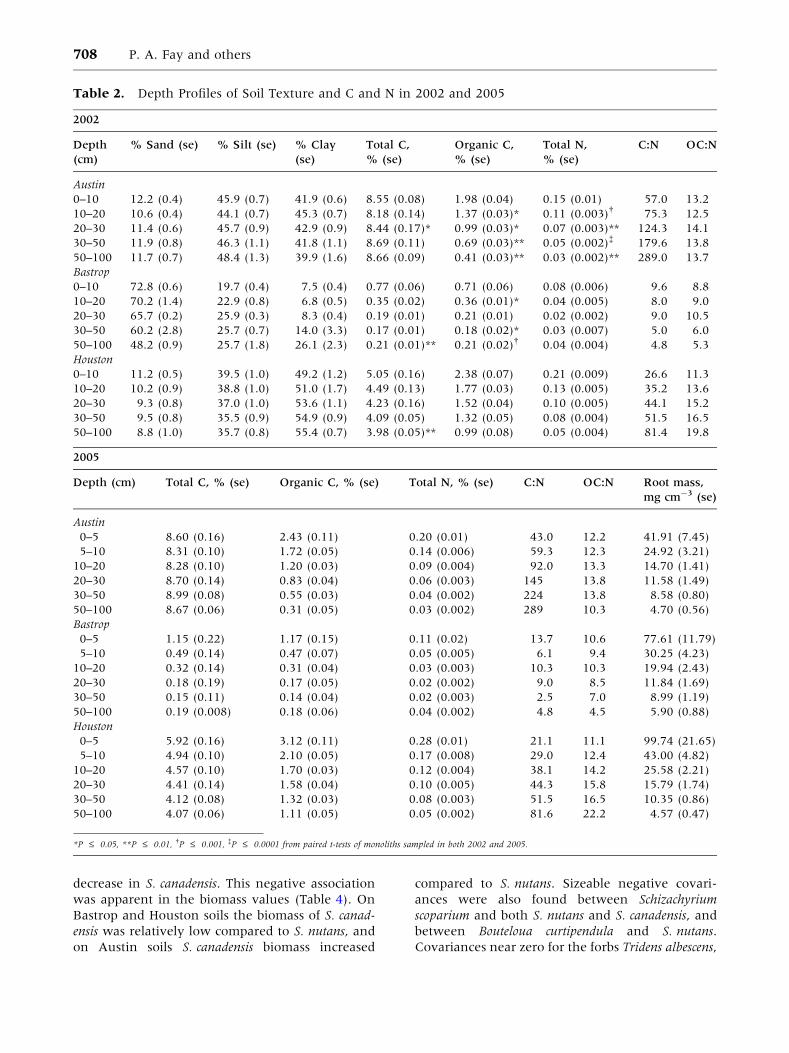
Table 2. Depth Profiles of Soil Texture and C and N in 2002 and 2005
2002
Depth
(cm)
% Sand (se) % Silt (se) % Clay
(se)
Total C,
% (se)
Organic C,
% (se)
Total N,
% (se)
C:N OC:N
Austin
0–10 12.2 (0.4) 45.9 (0.7) 41.9 (0.6) 8.55 (0.08) 1.98 (0.04) 0.15 (0.01) 57.0 13.2
10–20 10.6 (0.4) 44.1 (0.7) 45.3 (0.7) 8.18 (0.14) 1.37 (0.03)* 0.11 (0.003)� 75.3 12.5
20–30 11.4 (0.6) 45.7 (0.9) 42.9 (0.9) 8.44 (0.17)* 0.99 (0.03)* 0.07 (0.003)** 124.3 14.1
30–50 11.9 (0.8) 46.3 (1.1) 41.8 (1.1) 8.69 (0.11) 0.69 (0.03)** 0.05 (0.002)� 179.6 13.8
50–100 11.7 (0.7) 48.4 (1.3) 39.9 (1.6) 8.66 (0.09) 0.41 (0.03)** 0.03 (0.002)** 289.0 13.7
Bastrop
0–10 72.8 (0.6) 19.7 (0.4) 7.5 (0.4) 0.77 (0.06) 0.71 (0.06) 0.08 (0.006) 9.6 8.8
10–20 70.2 (1.4) 22.9 (0.8) 6.8 (0.5) 0.35 (0.02) 0.36 (0.01)* 0.04 (0.005) 8.0 9.0
20–30 65.7 (0.2) 25.9 (0.3) 8.3 (0.4) 0.19 (0.01) 0.21 (0.01) 0.02 (0.002) 9.0 10.5
30–50 60.2 (2.8) 25.7 (0.7) 14.0 (3.3) 0.17 (0.01) 0.18 (0.02)* 0.03 (0.007) 5.0 6.0
50–100 48.2 (0.9) 25.7 (1.8) 26.1 (2.3) 0.21 (0.01)** 0.21 (0.02)� 0.04 (0.004) 4.8 5.3
Houston
0–10 11.2 (0.5) 39.5 (1.0) 49.2 (1.2) 5.05 (0.16) 2.38 (0.07) 0.21 (0.009) 26.6 11.3
10–20 10.2 (0.9) 38.8 (1.0) 51.0 (1.7) 4.49 (0.13) 1.77 (0.03) 0.13 (0.005) 35.2 13.6
20–30 9.3 (0.8) 37.0 (1.0) 53.6 (1.1) 4.23 (0.16) 1.52 (0.04) 0.10 (0.005) 44.1 15.2
30–50 9.5 (0.8) 35.5 (0.9) 54.9 (0.9) 4.09 (0.05) 1.32 (0.05) 0.08 (0.004) 51.5 16.5
50–100 8.8 (1.0) 35.7 (0.8) 55.4 (0.7) 3.98 (0.05)** 0.99 (0.08) 0.05 (0.004) 81.4 19.8
2005
Depth (cm) Total C, % (se) Organic C, % (se) Total N, % (se) C:N OC:N Root mass,
mg cm-3 (se)
Austin
0–5 8.60 (0.16) 2.43 (0.11) 0.20 (0.01) 43.0 12.2 41.91 (7.45)
5–10 8.31 (0.10) 1.72 (0.05) 0.14 (0.006) 59.3 12.3 24.92 (3.21)
10–20 8.28 (0.10) 1.20 (0.03) 0.09 (0.004) 92.0 13.3 14.70 (1.41)
20–30 8.70 (0.14) 0.83 (0.04) 0.06 (0.003) 145 13.8 11.58 (1.49)
30–50 8.99 (0.08) 0.55 (0.03) 0.04 (0.002) 224 13.8 8.58 (0.80)
50–100 8.67 (0.06) 0.31 (0.05) 0.03 (0.002) 289 10.3 4.70 (0.56)
Bastrop
0–5 1.15 (0.22) 1.17 (0.15) 0.11 (0.02) 13.7 10.6 77.61 (11.79)
5–10 0.49 (0.14) 0.47 (0.07) 0.05 (0.005) 6.1 9.4 30.25 (4.23)
10–20 0.32 (0.14) 0.31 (0.04) 0.03 (0.003) 10.3 10.3 19.94 (2.43)
20–30 0.18 (0.19) 0.17 (0.05) 0.02 (0.002) 9.0 8.5 11.84 (1.69)
30–50 0.15 (0.11) 0.14 (0.04) 0.02 (0.003) 2.5 7.0 8.99 (1.19)
50–100 0.19 (0.008) 0.18 (0.06) 0.04 (0.002) 4.8 4.5 5.90 (0.88)
Houston
0–5 5.92 (0.16) 3.12 (0.11) 0.28 (0.01) 21.1 11.1 99.74 (21.65)
5–10 4.94 (0.10) 2.10 (0.05) 0.17 (0.008) 29.0 12.4 43.00 (4.82)
10–20 4.57 (0.10) 1.70 (0.03) 0.12 (0.004) 38.1 14.2 25.58 (2.21)
20–30 4.41 (0.14) 1.58 (0.04) 0.10 (0.005) 44.3 15.8 15.79 (1.74)
30–50 4.12 (0.08) 1.32 (0.03) 0.08 (0.003) 51.5 16.5 10.35 (0.86)
50–100 4.07 (0.06) 1.11 (0.05) 0.05 (0.002) 81.6 22.2 4.57 (0.47)
*P £ 0.05, **P £ 0.01, �P £ 0.001, �P £ 0.0001 from paired t-tests of monoliths sampled in both 2002 and 2005.
708 P. A. Fay and others
Salvia azurea, and Desmanthus illinoensis indicated
that variation among monoliths in biomass in these
species was unrelated to the biomass of the other
species.
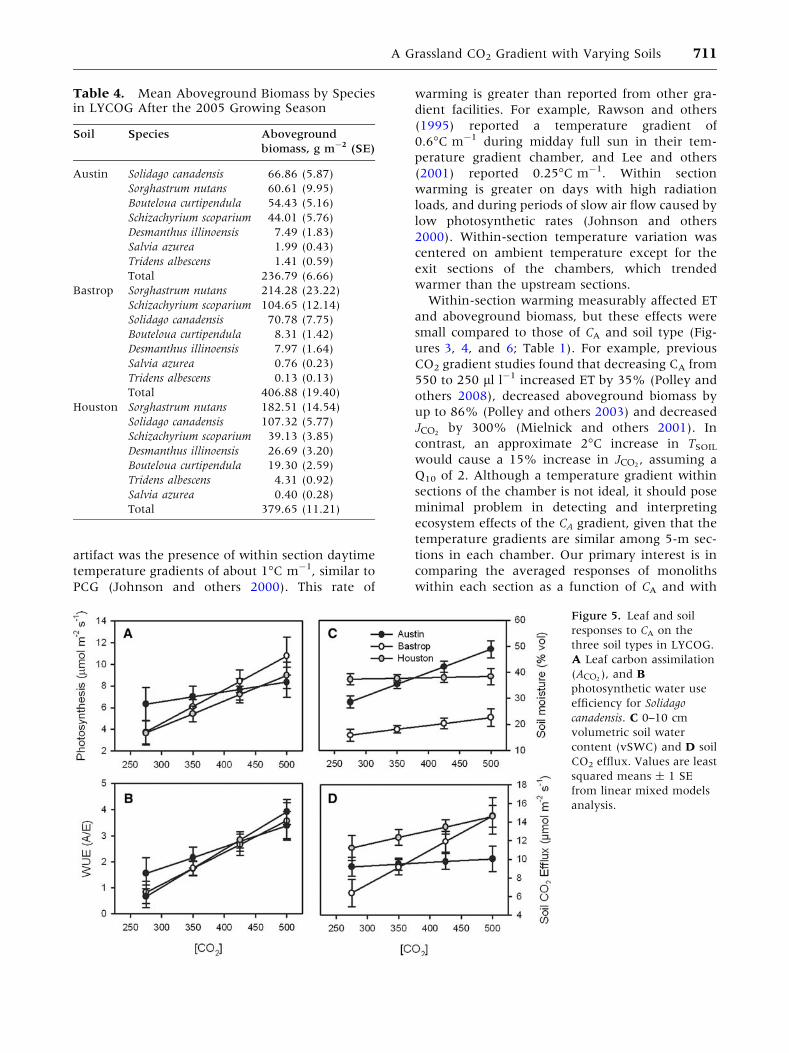
Preliminary Plant and Soil Responses toCO2
For S. canadensis, leaf ACO2and water use efficiency
(WUE) increased at higher CA (Figure 5A, B). The
CA sensitivity of ACO2and WUE in S. canadensis was
greater on Houston and Bastrop than on Austin
soils (Table 3). However, there was no significant
main effect of soil type on ACO2or WUE. For
S. nutans, there were no significant effects of soil
type or CA on ACO2or WUE. vSWC was lower in
Bastrop than in Austin or Houston soils (Table 3,
Figure 5C) and increased more with CA on Austin
than on Houston or Bastrop soils. Soil CO2 efflux
was 32% greater on Houston than on Austin or
Bastrop soils (Table 3, Figure 5D), however, efflux
increased with CA more on Bastrop soils.
ET during May 2008 averaged 109 mm on
Houston soils, compared to 91 mm on the Austin
and Bastrop soils (Table 3, Figure 6). ET was
46 mm greater than irrigation on the Houston soils,
and 26 mm greater on Austin and Bastrop soils,
indicating that ET depleted previously stored soil
water. ET from storage was correlated with changes
in monolith soil moisture measured with the neu-
tron probe (R2 = 0.73, P < 0.0001). Both total ET
and ET from storage increased with higher CA
(Table 3; Figure 6). The effects of CA on ET and
storage did not differ between soils (P ‡ 0.88).
Mean drainage from the monoliths was
1.39 ± 0.37 mm (max = 9.20 mm), which was a
negligible portion of the water budget. Irrigation
inputs to the monoliths averaged about 64 mm
during May 2008 (Figure 6).
DISCUSSION
LYCOG extends the CO2 gradient approach of
Mayeux and others (1993) and Johnson and others
(2000) to multiple soil types and allows for closure
of monolith water budgets. Preliminary results
support the hypothesis that soil properties will
influence the effects of CA on the productivity, soil
CO2 efflux, hydrology, and plant species composi-
tion of these grassland monoliths.
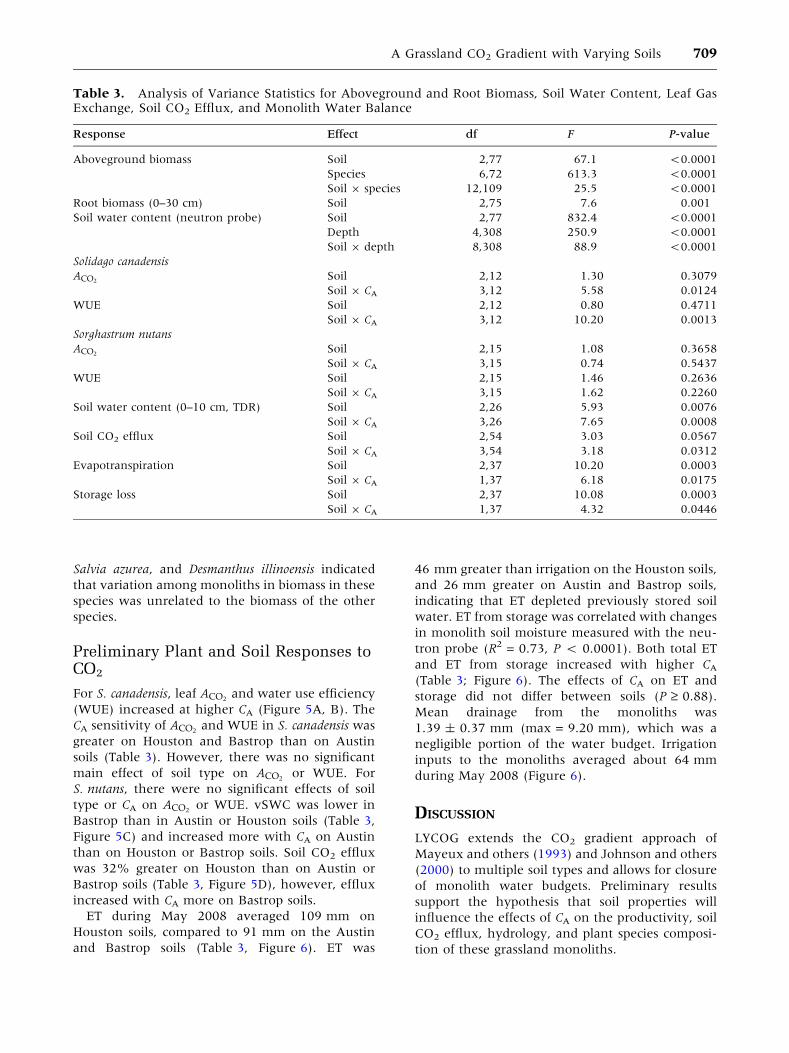
Table 3. Analysis of Variance Statistics for Aboveground and Root Biomass, Soil Water Content, Leaf GasExchange, Soil CO2 Efflux, and Monolith Water Balance
Response Effect df F P-value
Aboveground biomass Soil 2,77 67.1 <0.0001
Species 6,72 613.3 <0.0001
Soil 9 species 12,109 25.5 <0.0001
Root biomass (0–30 cm) Soil 2,75 7.6 0.001
Soil water content (neutron probe) Soil 2,77 832.4 <0.0001
Depth 4,308 250.9 <0.0001
Soil 9 depth 8,308 88.9 <0.0001
Solidago canadensis
ACO2Soil 2,12 1.30 0.3079
Soil 9 CA 3,12 5.58 0.0124
WUE Soil 2,12 0.80 0.4711
Soil 9 CA 3,12 10.20 0.0013
Sorghastrum nutans
ACO2Soil 2,15 1.08 0.3658
Soil 9 CA 3,15 0.74 0.5437
WUE Soil 2,15 1.46 0.2636
Soil 9 CA 3,15 1.62 0.2260
Soil water content (0–10 cm, TDR) Soil 2,26 5.93 0.0076
Soil 9 CA 3,26 7.65 0.0008
Soil CO2 efflux Soil 2,54 3.03 0.0567
Soil 9 CA 3,54 3.18 0.0312
Evapotranspiration Soil 2,37 10.20 0.0003
Soil 9 CA 1,37 6.18 0.0175
Storage loss Soil 2,37 10.08 0.0003
Soil 9 CA 1,37 4.32 0.0446
A Grassland CO2 Gradient with Varying Soils 709
Chamber Function
A goal of global change field experiments is to
simulate the desired factor while minimizing con-
founding changes in other factors (Dunne and
others 2004). LYCOG achieved the objective of
linear daytime and nighttime CA gradients. The
system performed similarly to the Phase II version
of the experiment, which used the same above-
ground infrastructure and CO2 monitoring and
control systems (Johnson and others 2000). There
were two main artifacts of the system noted in this
study. First, day-to-day variability in mean CA in-
creased with distance along each chamber. This is
due to the directional flow concept used in LYCOG,
where upstream disturbances to CA travel down-
stream, and may be magnified by subsequent
downstream disturbances. CA variation measured at
the subambient chamber entry was caused by day-
to-day variability in ambient CA. Ambient CA varies
with soil moisture, temperature, and light because
of their effects on photosynthesis. Variation in CA
entering the superambient chamber results pri-
marily from variation in the function of the mass
flow controller that regulates CO2 injection. Factors
contributing additional variability downstream
may include patchy light levels due to partial cloud
cover, illuminating some part of the 50 m cham-
bers more than other parts, and opening chamber
sections for sampling or maintenance. The second
Figure 4. Soil moisture and plant
biomass on the three soils in LYCOG
following the 2005 growing season,
after 3 years of growth in ambient
conditions and prior to CO2 treatment.
A Mean growing season volumetric soil
water content (neutron probe; SE falls
within the symbols) and root mass
mean ± 1 SE for the top 1 m of the soil
profile; Inset: total aboveground
biomass. B Covariance for species pairs
in monolith-to-monolith variation in
biomass.
710 P. A. Fay and others
artifact was the presence of within section daytime
temperature gradients of about 1�C m-1, similar to
PCG (Johnson and others 2000). This rate of
warming is greater than reported from other gra-
dient facilities. For example, Rawson and others
(1995) reported a temperature gradient of
0.6�C m-1 during midday full sun in their tem-
perature gradient chamber, and Lee and others
(2001) reported 0.25�C m-1. Within section
warming is greater on days with high radiation
loads, and during periods of slow air flow caused by
low photosynthetic rates (Johnson and others
2000). Within-section temperature variation was
centered on ambient temperature except for the
exit sections of the chambers, which trended
warmer than the upstream sections.
Within-section warming measurably affected ET
and aboveground biomass, but these effects were
small compared to those of CA and soil type (Fig-
ures 3, 4, and 6; Table 1). For example, previous
CO2 gradient studies found that decreasing CA from
550 to 250 ll l-1 increased ET by 35% (Polley and
others 2008), decreased aboveground biomass by
up to 86% (Polley and others 2003) and decreased
JCO2by 300% (Mielnick and others 2001). In
contrast, an approximate 2�C increase in TSOIL
would cause a 15% increase in JCO2, assuming a
Q10 of 2. Although a temperature gradient within
sections of the chamber is not ideal, it should pose
minimal problem in detecting and interpreting
ecosystem effects of the CA gradient, given that the
temperature gradients are similar among 5-m sec-
tions in each chamber. Our primary interest is in
comparing the averaged responses of monoliths
within each section as a function of CA and with
Table 4. Mean Aboveground Biomass by Speciesin LYCOG After the 2005 Growing Season
Soil Species Aboveground
biomass, g m-2 (SE)
Austin Solidago canadensis 66.86 (5.87)
Sorghastrum nutans 60.61 (9.95)
Bouteloua curtipendula 54.43 (5.16)
Schizachyrium scoparium 44.01 (5.76)
Desmanthus illinoensis 7.49 (1.83)
Salvia azurea 1.99 (0.43)
Tridens albescens 1.41 (0.59)
Total 236.79 (6.66)
Bastrop Sorghastrum nutans 214.28 (23.22)
Schizachyrium scoparium 104.65 (12.14)
Solidago canadensis 70.78 (7.75)
Bouteloua curtipendula 8.31 (1.42)
Desmanthus illinoensis 7.97 (1.64)
Salvia azurea 0.76 (0.23)
Tridens albescens 0.13 (0.13)
Total 406.88 (19.40)
Houston Sorghastrum nutans 182.51 (14.54)
Solidago canadensis 107.32 (5.77)
Schizachyrium scoparium 39.13 (3.85)
Desmanthus illinoensis 26.69 (3.20)
Bouteloua curtipendula 19.30 (2.59)
Tridens albescens 4.31 (0.92)
Salvia azurea 0.40 (0.28)
Total 379.65 (11.21)
Figure 5. Leaf and soil
responses to CA on the
three soil types in LYCOG.
A Leaf carbon assimilation
(ACO2), and B
photosynthetic water use
efficiency for Solidago
canadensis. C 0–10 cm
volumetric soil water
content (vSWC) and D soil
CO2 efflux. Values are least
squared means ± 1 SE
from linear mixed models
analysis.
A Grassland CO2 Gradient with Varying Soils 711

determining effects of CA and soil type within
chambers, rather than comparing the chambers
with outside conditions (Rawson and others 1995).
Pre-Treatment Soils and Plants
Soils differed markedly in texture and C:N pools.
Bastrop soils had the lowest total C, organic C, total
N, and soil moisture values, typical of sandy soils.
Organic C (OC) accounted for nearly all the carbon
in these soils, and the low OC:N despite high plant
productivity suggested higher potential decompo-
sition rates versus the other soils. The Houston soils
were highest in total C, organic C, total N, and soil
moisture. A strong increase in OC:N with depth
suggested that decomposition rates are greatest in
the top of the soil profile. Austin soils were highest
in total C, because of high concentrations of car-
bonate (V. Jin, unpublished data), and intermedi-
ate in soil moisture, organic C and total N. OC:N
was higher in Austin than Bastrop soil and com-
parable to that in the upper layer of Houston soils,
implying that decomposition rates are slower in the
clay soils compared to the Bastrop soil.
The soils exhibited substantial differences in pre-
treatment aboveground and belowground biomass,
with Austin soils much less productive than Bas-
trop and Houston soils. However, productivity did
not correlate with either soil water or the pre-
treatment C and N pools. Soil texture strongly
influences both N and water availability to plants.
Other things being equal, decomposition rates and
therefore N availability to plants usually are greater
in clay than C-poor sandy soils (Paul and others
2001; Johnson and others 2007). In contrast, soil
water potential at a given soil water content is
greater (less negative) and the permanent wilting
point lower in sandy than fine textured soils,
resulting in greater plant access to soil moisture
(Brady and Weil 2002). This result suggests that
productivity differences among soils will depend on
soil-specific nutrient 9 water interactions and their
variation with CA.
The strong negative covariances among Boute-
loua, Sorghastrum, Solidago, and Schizachyrium imply
that CO2 and soil effects on plant productivity and
species composition will be mediated primarily
through interactions among these dominant spe-
cies. We expect to see different trajectories of
community change among the soil types in re-
sponse to the CO2 gradient because of differential
effects of CO2 on the water budgets of these three
soils. For example, we expect CO2 enrichment to
favor the C3 component of the experimental com-
munities, especially S. canadensis, more on the
sandy Bastrop soil than on the clay soils. These
species are likely to be the most active players in
productivity responses to the CO2 gradient. The
differences among LYCOG soils in pre-treatment
plant composition are comparable to differences in
plant composition both among and within soil
types in established tallgrass prairie (Diamond and
Smeins 1984; Gibson and Hulbert 1987; Piper
1995). Precipitation may mediate the relationship
between soil type and plant community composi-
tion. Diamond and Smeins (1984) reported that in
Figure 6. Water balance for the LYCOG soils along the
CO2 gradient for May 2008. Data shown are averages for
the 2 monoliths of a given soil type in each 5-m section of
the chambers.
712 P. A. Fay and others
Texas coastal prairies, plant communities located
where precipitation was higher showed less asso-
ciation with soil type than communities with lower
precipitation.
Preliminary Responses to CA
Leaf photosynthesis (ACO2) and photosynthetic
water use efficiency (WUE) in Solidago canadensis
increased with CA more on the more productive
Houston and Bastrop soils in this early summer
assessment. ACO2and WUE are coupled to soil
water and N availability, and to the radiation,
temperature, and H2O vapor pressure conditions
surrounding the leaf. The vSWC differed substan-
tially among soils during the leaf gas exchange
measurements (Figure 5C), but the differences in
vSWC sensitivity to CA among soils did not corre-
spond to the CA sensitivity of ACO2and WUE in
S. canadensis. This implies that leaf carbon assimi-
lation and water loss for S. canadensis were regu-
lated more strongly by the leaf microenvironment
at this time. However, the relative importance of
leaf microclimate versus availability of soil moisture
or nutrients such as N is not static, and soil re-
sources should become more important for leaf
function when soil moisture is more limiting later
in the season and at low CA (Anderson and others
2001).
JCO2increased nearly 3-fold with CA on Bastrop
soils. The magnitude of the Bastrop JCO2response
was similar to that reported by Mielnick and others
(2001) in the PCG experiment. This large response
to CA may reflect tighter coupling of JCO2to vSWC
on the Bastrop soils, as the CA response of JCO2was
smaller on the wetter Austin and Houston soils.
The greater efflux response to CA on the Bastrop
than Austin and Houston soils suggests that there
was a larger increase in root and microbial activity
with higher CA on the Bastrop soil. However, con-
trol of JCO2depends on vSWC, soil temperature,
and substrate availability (Luo and Zhou 2006).
The response of JCO2to CA may decrease as the
season progresses and photosynthesis decreases
and labile soil C and soil moisture are depleted.
The water budgets showed that ET and the por-
tion of ET supplied by pre-existing stores of soil
moisture increased at higher CA on all three soils.
Stomatal closure at higher CA typically reduces
transpiration per unit leaf area (for example, Ward
and others 1999; Anderson and others 2001). In
this preliminary study, transpiration was not sig-
nificantly affected by CA for either species on any of
the soils (P = 0.15–0.27). Increased aboveground
biomass at higher CA may be responsible for the
higher ET. As with leaf carbon assimilation and
JCO2, the effects of soil and CA on ET are likely to
change through the season as soil moisture be-
comes depleted.
CONCLUSIONS
The CO2 gradient approach has been used suc-
cessfully to study plant and soil responses to su-
bambient-to-ambient (Mayeux and others 1993)
and subambient-to-superambient (Johnson and
others 2000) ranges of CA. LYCOG maintained lin-
ear gradients of daytime and nighttime CA, with
good overall control of Tair. The facility advances
our capability to discern effects of pre-industrial to
mid-twenty-first century levels of CA on ecosystem
structure and function on soils that differ in water
and nutrient availability, primary productivity, and
plant species composition. The initial results of this
study indicate that aboveground net primary pro-
ductivity, ET, leaf C assimilation in an abundant C3
forb, soil C efflux, and soil moisture depletion all
increased with enriched CA, particularly on the
sandy soil. No counteracting effect of CA on sto-
matal conductance was detected. These results
suggest that increased CA may accelerate rates of
carbon cycling on these soils. Over the longer term,
plant and soil responses to CA may be mediated by
differences in hydrologic properties among the soils
and in particular by differences in both soil water
content and the availability of soil water to plants
and microbes. The larger implication is that varia-
tion in soil texture and other properties has the
potential to cause considerable variation across the
landscape in grassland responses to continuing CO2
enrichment.
ACKNOWLEDGMENTS
We thank A. Gibson, A. Griffith, K. Jones, C. Kol-
odziejczyk, A. Naranjo, K. Tiner, and scientists and
staff involved in the previous CO2 gradients for
their contributions to this experimental approach,
and to the development of LYCOG and to this
manuscript. R.B.J. acknowledges financial support
from the Department of Energy’s Program for
Ecosystem Research (#ER64242).
REFERENCES
Ainsworth EA, Long SP. 2005. What have we learned from
15 years of free-air CO2 enrichment (FACE)? A meta-analytic
review of the responses of photosynthesis, canopy properties
and plant production to rising CO2. New Phytol 165:351–72.
Anderson LJ, Maherali H, Johnson HB, Polley HW, Jackson RB.
2001. Gas exchange and photosynthetic acclimation over
A Grassland CO2 Gradient with Varying Soils 713
subambient to elevated CO2 in a C-3-C-4 grassland. Glob
Chang Biol 7:693–707.
Brady NC, Weil RR. 2002. The nature and properties of soils.
Upper Saddle River, NJ: Prentice Hall, p 960.
Diamond DD, Smeins FE. 1984. Remnant grassland vegetation
and ecological affinities of the upper costal prairie of Texas.
Southwest Nat 29:321–34.
Dunne JA, Saleska SR, Fischer ML, Harte J. 2004. Integrating
experimental and gradient methods in ecological climate
change research. Ecology 85:904–16.
Epstein HE, Burke IC, Lauenroth WK. 2002. Regional patterns of
decomposition and primary production rates in the US Great
Plains. Ecology 83:320–27.
Fay PA, Carlisle JD, Knapp AK, Blair JM, Collins SL. 2003.
Productivity responses to altered rainfall patterns in a C4-
dominated grassland. Oecologia 137:245–51.
Forster P, Ramaswamy V, Artaxo P, Berntsen T, Betts R, Fahey
DW, Haywood J, Lean J, Lowe DC, Myhre G, Nganga J, Prinn
R, Raga G, Schulz M, Van Dorland R. 2007. Changes in
atmospheric constituents and in radiative forcing. In: Solomon
S, Qin D, Manning M, Chen Z, Marquis M, Avery KB, Tignor
M, Miller HL, Eds. Climate change 2007: The physical science
basis. Contribution of working group I to the fourth assess-
ment report of the intergovernmental panel on climate
change. Cambridge, United Kingdom and New York, NY:
Cambridge University Press. p 129–234.
Gibson DJ, Hulbert LC. 1987. Effects of fire, topography and
year-to-year climatic variation on species composition in
tallgrass prairie. Vegetatio 72:175–86.
Gill RA, Anderson LJ, Polley HW, Johnson HB, Jackson RB. 2006.
Potential nitrogen constraints on soil carbon sequestration
under low and elevated atmospheric CO2. Ecology 87:41–52.
Gill RA, Polley HW, Johnson HB, Anderson LJ, Maherali H,
Jackson RB. 2002. Nonlinear grassland responses to past and
future atmospheric CO2. Nature 417:279–82.
Hagedorn F, Spinnler D, Bundt M, Blaser P, Siegwolf R. 2003.
The input and fate of new C in two forest soils under elevated
CO2. Glob Chang Biol 9:862–71.
Hassink J. 1996. Preservation of plant residues in soils differing in
unsaturated protective capacity. Soil Sci Soc Am J 60:487–91.
Jenkinson DA. 1977. Studies on the decomposition of plant
material in soil. J Soil Sci 28:424–34.
Johnson JMF, Barbour NW, Weyers SL. 2007. Chemical com-
position of crop biomass impacts its decomposition. Soil Sci
Soc Am J 71:155–62.
Johnson HB, Polley HW, Mayeux HS. 1993. Increasing CO2 and
plant-plant interactions: effects on natural vegetation. Vege-
tatio 104–105:157–70.
Johnson HB, Polley HW, Whitis RP. 2000. Elongated chambers
for field studies across atmospheric CO2 gradients. Funct Ecol
14:388–96.
Kettler TA, Doran JW, Gilbert TL. 2001. Simplified method for
soil particle-size determination to accompany soil-quality
analyses. Soil Sci Soc Am J 65:849–52.
Kimball BA. 1992. Cost comparisons among free-air CO2 enrich-
ment, open-top chamber, and sunlit controlled-environment
chamber methods ofCO2 exposure. CritRev Plant Sci 11:265–70.
Lee JS, Usami T, Oikawa T. 2001. High performance of CO2-tem-
perature gradient chamber newly built for studying the global
warming effect on a plant population. Ecol Res 16:347–58.
Luo Y, Zhou X. 2006. Soil respiration and the environment.
Burlington: Academic Press.
Mayeux HS, Johnson HB, Polley HW, Dumesnil MJ, Spanel GA.
1993. A controlled environment chamber for growing plants
across a subambient CO2 gradient. Funct Ecol 7:125–33.
Mielnick PC, Dugas WA, Johnson HB, Polley HW, Sanabria J.
2001. Net grassland carbon flux over a subambient to super-
ambient CO2 gradient. Glob Chang Biol 7:747–54.
Noy-Meir I. 1973. Desert ecosystems: environment and pro-
ducers. Annu Rev Ecol Syst 4:25–51.
Oades JM. 1988. The retention of organic matter in soils. Bio-
geochemistry 5:35–70.
Paul EA, Morris SJ, Bohm S. 2001. The determination of soil C
pool sizes and turnover rates: biophysical fractionation and
tracers. In: Lal R, Kimble JM, Follett RF, Stewart BA, Eds.
Assessment methods for soil carbon. Boca Raton, FL: CRC
Press. p 193–206.
Piper JK. 1995. Composition of prairie plant communities on
productive versus unproductive sites in wet and dry years.
Can J Bot 73:1635–44.
Polley HW, Johnson HB, Derner JD. 2003. Increasing CO2 from
subambient to superambient concentrations alters species
composition and increases above-ground biomass in a C-3/C-4
grassland. New Phytol 160:319–27.
Polley HW, Johnson HB, Fay PA, Sanabria J. 2008. Initial response
of evapotranspiration from tallgrass prairie vegetation to CO2 at
subambient to elevated concentrations. Funct Ecol 22:163–71.
Polley HW, Johnson HB, Mayeux HS. 1992a. Carbon dioxide
and water fluxes of C3 annuals and C4 perennials at subam-
bient CO2 concentrations. Funct Ecol 6:693–703.
Polley HW, Johnson HB, Mayeux HS. 1992b. Growth and gas
exchange of oats (Avena sativa) and wild mustard (Brassica kaber)
at subambient CO2 concentrations. Int J Plant Sci 153:453–61.
Polley HW, Johnson HB, Marino BD, Mayeux HS. 1993a. In-
crease in C3 plant water-use efficiency and biomass over
Glacial to present CO2 concentrations. Nature 361:61–4.
Polley HW, Johnson HB, Mayeux HS, Malone SR. 1993b.
Physiology and growth of wheat across a subambient carbon
dioxide gradient. Ann Bot 71:347–56.
Polley HW, Johnson HB, Mayeux HS. 1994. Increasing CO2:
comparative responses of the C4 grass Schizachyrium and
grassland invader Prosopis. Ecology 75:976–88.
Polley HW, Johnson HB, Mayeux HS. 1995. Nitrogen and water
requirements of C3 plants grown at glacial to present carbon
dioxide concentrations. Funct Ecol 9:86–96.
Polley HW, Johnson HB, Mayeux HS, Brown DA, White JWC.
1996. Leaf and plant water use efficiency of C4 species grown
at glacial to elevated CO2 concentrations. Int J Plant Sci
157:164–70.
Rawson HM, Gifford RM, Condon BN. 1995. Temperature gra-
dient chambers for research on global environment change. I.
Portable chambers for research on short-stature vegetation.
Plant Cell Environ 18:1048–54.
Rogers A, Ainsworth EA, Kammann C. 2006. FACE value: per-
spectives on the future of free-air CO2 enrichment studies. In:
Nosberger J, Long SP, Norby RJ, Stitt M, Eds. Managed eco-
systems and CO2: case studies, processes, and perspectives.
Berlin: Springer. p 431–49.
SAS Institute Inc. 2003. The SAS system for windows. [9.1.3].
Cary, NC: SAS Institute.
Ward JK, Tissue DT, Thomas RB, Strain BR. 1999. Comparative
responses of model C3 and C4 plants to drought in low and
elevated CO2. Glob Chang Biol 5:857–67.
714 P. A. Fay and others