pricing model and environmental impact analysis for …
TRANSCRIPT

A PRICING MODEL AND ENVIRONMENTAL IMPACT ANALYSIS FOR MANURE-BASED BIOCHAR AS A SOIL AMENDMENT
by
Amanda Bushell
Dr. Martin Smith, Adviser
April 23, 2018
Masters project submitted in partial fulfillment of the
requirements for the Master of Environmental Management degree in
the Nicholas School of the Environment of
Duke University

2
Table of Contents
EXECUTIVE SUMMARY ....................................................................................................... 3
RELEVANT FARMING ENVIRONMENTAL CHALLENGES........................................... 4
MANURE MANAGEMENT ............................................................................................................ 5 SOIL DEGRADATION ................................................................................................................... 7 WATER-USE ............................................................................................................................... 9 FERTILIZER .............................................................................................................................. 11
THE COMPANY .................................................................................................................... 12
HISTORY & TECHNOLOGY ....................................................................................................... 12 BUSINESS OPPORTUNITY .......................................................................................................... 14 LOCATION ................................................................................................................................ 16
BIOCHAR ............................................................................................................................... 18
TYPES ....................................................................................................................................... 19 PLANT-BASED CHAR.................................................................................................................. 19 MANURE-BASED CHAR ............................................................................................................... 20 ATTRIBUTES .............................................................................................................................. 21 USE-CASES ............................................................................................................................... 22 ADOPTION ................................................................................................................................ 25
METHODS .............................................................................................................................. 26
PRICING MODELS ..................................................................................................................... 27 BREAKEVEN ANALYSIS............................................................................................................... 27 VALUE-BASED PRICING .............................................................................................................. 28 INTERVIEWS ............................................................................................................................. 31
RESULTS ................................................................................................................................ 32
BREAKEVEN ANALYSIS ............................................................................................................. 32 ECONOMIC VALUE ADD ........................................................................................................... 33 INTERVIEWS ............................................................................................................................. 35
DISCUSSION .......................................................................................................................... 39
APPENDIX ............................................................................................................................. 41
REFERENCES ....................................................................................................................... 48

3
Executive Summary
This document explores the environmental and market opportunity for manure-based char
(MBC) to be used as an agricultural soil amendment product. Biochar is a product with multiple
environmental and financial benefits to farmers. Current products on the market are made from
plant-based feedstocks and are priced with little consistency; the lowest market price is $50/ton
and the highest is $5000/ton with an average global price of $2200/ton (Jerka and Thayer, 2013).
A new product is being developed by a gasification company utilizing manure feedstocks for a
product that is highly differentiated from other chars. In this report, I discuss the price and
market opportunity for manure-based biochar as a soil amendment in California.
In the first section, I discuss the environmental challenges that are relevant to gasification
and biochar application. These challenges include manure management, soil degradation, water-
use and fertilizer use for crop and livestock farming in the United States. In the next section, the
technology, business model and location of application are explored. Then, I discuss the
alternative applications for biochar and the differences between plant-based char and manure-
based char as well as the farmer willingness to adopt biochar.
I then use a breakeven analysis to find a minimum viable price for the biochar and a
value-based pricing model to determine an appropriate target price in early years of adoption. In
the breakeven analysis, I find that the minimum price for biochar that allows gasification to be
profitable is $383 per ton to achieve a debt service coverage ratio of 1.00x and $485/ton to
maintain a DSCR of 1.25x. The economic value-added analysis finds that a dairy feedstock could
achieve a market price between $388-688 and a blended feedstock could achieve a market price
between $422-722 depending on market conditions for the closest competitor, plant-based char.
4
In the final section of the report, I conduct interviews with farmers about water and
fertilizer-use as well as willingness to adopt biochar. Based on farmer interviews, I recommend
that the company sell the product at $485 per ton. I also recommend that the company focus on
indoor agriculture producers who are price insensitive and then vineyard managers whose water
and nutrient needs align with the attributes of the char. Finally, I recommend that the company
collaborate with respected academic institutions and extension services to continue research
trials and gain credibility with farmers in California.
The document will be submitted in partial fulfillment of the requirements for the Master
of Environmental Management degree in the Nicholas School of the Environment of Duke
University to be made available to the public and will be shared with CoalTec to aid in the
market development strategy for biochar distribution.
Relevant Farming Environmental Challenges
This section explores the environmental challenges that are relevant to manure
management and biochar for soil amendment to illustrate the environmental and economic
opportunity associated with these interrelated technologies. Manure management, soil use,
water-use and fertilizer-use have generated an environment of increased risk for livestock
farmers (Brandjes et al, 1996) and crop farmers (Eswaran et al, 2001) as well as societal risks
external to the farm. Gasification provides a less environmentally impactful alternative to current
manure management practices (Belete and Ayza, 2015). Biochar responds to soil-degradation
challenges while retaining water and replacing Nitrogen, Phosphorous and Potassium more
commonly applied with synthetic fertilizers. Exploration of the underlying environmental
challenges illustrates the areas of opportunity from new agricultural technologies.

5
Manure Management
According to the US EPA, over 7 million dry tons of bio-solids are produced in the
United States annually. In 2004, 49% of bio-solids were applied as fertilizer for agricultural land
use and the remainder was send to a landfill or incinerated (NEBRA, 2007). The high nutrient
content supports the case for land application as a fertilizer substitute. According to the EPA,
excess manure applied to crops and fields as fertilizer is among the greatest sources of nitrogen
and phosphorous pollution in the country. (EPA, 2017)
Both state and federal regulation have implemented tighter environmental controls over
land-application to respond to the nutrient run-off and waterway contamination commonly
associated with land application of bio-solids. Larger confined animal feeding operations
(CAFOs) are increasingly regulated by the EPA rather than by state-level oversight (Westerman,
2005). The EPA defines an AFO and CAFO as:
Animal Feeding Operations (AFOs) are agricultural operations where animals are kept and raised
in confined situations. An AFO is a lot or facility (other than an aquatic animal production facility)
where the following conditions are met:
1- animals have been, are, or will be stabled or confined and fed or maintained for a total of
45 days or more in any 12-month period, and
2- crops, vegetation, forage growth, or post-harvest residues are not sustained in the normal
growing season over any portion of the lot or facility.
A CAFO is another EPA term for a large concentrated AFO. A CAFO is an AFO with more than
1000 animal units (an animal unit is defined as an animal equivalent of 1000 pounds live weight
and equates to 1000 head of beef cattle, 700 dairy cows, 2500 swine weighing more than 55 lbs,
125 thousand broiler chickens, or 82 thousand laying hens or pullets) confined on site for more

6
than 45 days during the year. Any size AFO that discharges manure or wastewater into a natural
or man-made ditch, stream or other waterway is defined as a CAFO, regardless of size.
CAFOs are regulated by the EPA according to both the 2003 and 2008 versions of the
Clean Water Act. CAFOs are considered point soirces as defined by the Clean Water Act (CWA)
and are regulated by the National Pollution Discharge Elimination System (NPDES) program.
Water quality and nutrient leaching are the primary drivers of the regulation of manure land-
application. 90% of freshwater systems in 12 of the 14 U.S. ecoregions currently exceed total
nutrient reference values and nearly 50% of lakes suffer from excess nutrients (Dodds et al,
2008). Nutrient over-enrichment from manure and fertilizer run-off leads to eutrophication of
water supplies. One study analyzing the potential economic damages of eutrophication in the
U.S. estimated costs of approximately $2.2 billion annually. (Dodds et al, 2008) Economic
damages in this study were primarily attributed to lakefront property values and recreational use
of watersheds.
Due to increasing regulation, the cost of manure disposal, defined as a “hauling fee”, is
increasing in magnitude and prevalence. The national average hauling fee is $48.27 per ton with
higher prices in sensitive watersheds (EREF, 2016, WIH, 2016). Manure hauling costs on a
confined dairy operation in the North Valley of California average at $1.61 per cow per month or
$19.32 per cow per year and the average over the entire state is $1.05 per cow per month
(CDFA, 2016). For a 5,000-cow dairy, average waste management fees amount to $96,600 per
year. These high hauling fees represent an opportunity to monetize gasification technology that
manages the manure on site for larger CAFOs and lowers the environmental footprint of these
operations.
7
Nutrient run-off is not the sole source of pollution for dairy operations. Livestock
production contributes ~14.5% of global anthropogenic GHG emissions. Methane (CH4) and
nitrous oxide (N2O) emissions from managed livestock waste total roughly 80 MMT CO2-eq
(USDA, 2016). Both CH4 and N2O emissions from managed livestock waste are increasing,
which are the primary drivers for the increases in livestock GHG emissions.
Methane emissions represent six percent of California’s GHG emissions and have a
global warming potential about 25 times more potent than CO2. Dairy operations are the primary
source of methane emissions with roughly equal emissions from manure management systems
and digestive enteric fermentation through exhalation. (California Air Resources Board, 2015)
Methane is generated when volatile solids are stored anaerobically in open-lagoons causing a
chemical reaction from anaerobic digestion releasing gas into the atmosphere. (Leytem et al,
2017)
Manure management is responsible for 42% of nitrous oxide (N2O) emissions with 300
times the impact of equivalent tonnage of CO2 emissions. Between 70-95% of ingested nitrogen
in animal feed is lost via animal waste (Oenema et al, 2015). Storage and handling of manure
creates a favorable environment for bacteria which converts the excess nitrogen into N2O.
Separating solids from liquids, as required in the gasification process, eliminates these microbial
processes and significantly reduces emissions from lagoon practices while fixing nitrogen,
carbon and phosphorous into a usable stable substrate. According to our analysis, a single
gasification unit can service a 5,000-cow dairy and can process 5,000 tons of manure annually
which reduces emissions by 15,300 MT CO2e, equivalent to planting 706,000 trees a year.
Soil Degradation

8
Land degradation is an area of increasing concern to agronomists. Due to soil erosion and
degradation, some lands have decreased productivity by 50 percent. (Eswaran et al, 2001)
Agriculture has stimulated erosion through tilling and other practices that increase runoff.
Agronomists and economists estimate that agricultural erosion in the USA costs roughly US$44
billion per year, equivalent to US$247 per ha of crop or pasture land. (Eswaran et al, 2001)
Globally, 75 billion tons of soil is lost every year which costing about US$400 billion, or
approximately US$70 per person per year. (Eswaran et al, 2001)
Degradation is caused by both natural and anthropogenic impacts on soil from physical,
chemical and biological processes and results when land is used beyond its level of quality.
(Beinroth et al., 1994) Land degradation can take the form of nutrient depletion, inability to
retain water, decreased microbial activity and decreased soil organic carbon content. Some of the
most common causes of degradation are associated with agriculture including overgrazing
(35%), deforestation (30%), farming (28%). (Gruver, 2013)
Early studies focusing on soil erosion and remediation recommended application of
nitrogen and phosphorous in the form of inorganic fertilizers. (Langdale and Shrader 1982)
However, recent work has shifted to recommending organic amendments with restorative effects
on soil structure and hydrolic function rather than inorganic fertilizers that merely increase
nutrient load. (Larney et al., 2000) Organic soil amendments increase the level of organic matter
in the top several centimeters of an eroded soil which can dramatically increase water
infiltration, nutrient cycling and resistance to run-off. (Franzluebbers 2002).
EQIP recommends amendments that restore organic carbon levels in the soil. A single
gasification unit can produce 4,000 tons of char per year that sequesters 850 tons of carbon in a

9
stable-state for land application. Char may represent an amendment that can increase organic
carbon in the soil to decrease erosion and rebuild soil capacity.
Water-Use
Due to the impacts of a changing climate, availability, reliability and quality of water will
become increasingly unpredictable. (USGCRP, 2014) Agricultural irrigation accounts for a
significant proportion of water use in the United States. Recent drought conditions in California
have directed increased public attention to agriculture’s impacts on water availability (Guo,
2015). Different data sources report different degrees of water use varying between 40 and 80%
of total water supplies in the state (Johnson, 2015).
The U.S. Geological Survey (USGS) estimates that California agricultural operations
account for 25.8 million acre-feet or 61% of total water use. (Maupin, 2014) California
Department of Water Resources (DWR) estimates water use at 33 million acre-feet or about 41%
of total water use. (DWR, 2014). Regardless of discrepancies in state-use statistics, California’s
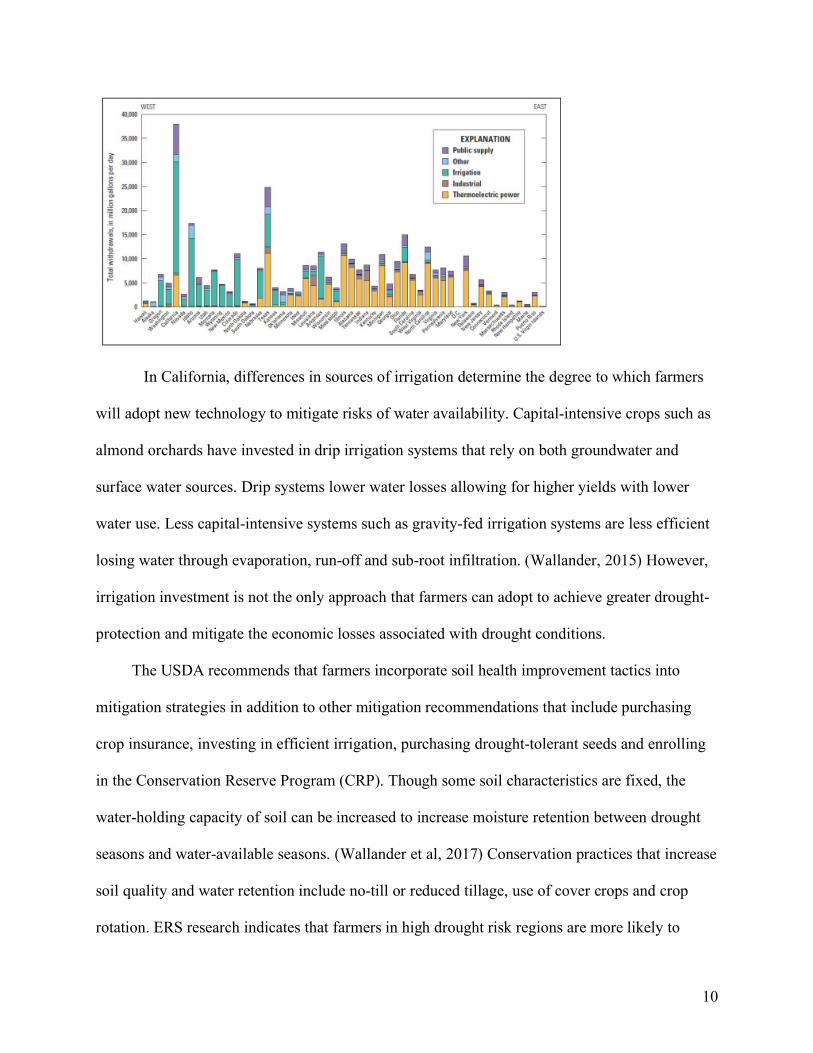
water use and irrigation are significantly higher than every other state as illustrated in Figure 1
(Maupin et al, 2014).
Figure 1. Total US Water Use (Withdrawals) by State, USGS Estimate Source: Maupin et al 2014
10
In California, differences in sources of irrigation determine the degree to which farmers
will adopt new technology to mitigate risks of water availability. Capital-intensive crops such as
almond orchards have invested in drip irrigation systems that rely on both groundwater and
surface water sources. Drip systems lower water losses allowing for higher yields with lower
water use. Less capital-intensive systems such as gravity-fed irrigation systems are less efficient
losing water through evaporation, run-off and sub-root infiltration. (Wallander, 2015) However,
irrigation investment is not the only approach that farmers can adopt to achieve greater drought-
protection and mitigate the economic losses associated with drought conditions.
The USDA recommends that farmers incorporate soil health improvement tactics into
mitigation strategies in addition to other mitigation recommendations that include purchasing
crop insurance, investing in efficient irrigation, purchasing drought-tolerant seeds and enrolling
in the Conservation Reserve Program (CRP). Though some soil characteristics are fixed, the
water-holding capacity of soil can be increased to increase moisture retention between drought
seasons and water-available seasons. (Wallander et al, 2017) Conservation practices that increase
soil quality and water retention include no-till or reduced tillage, use of cover crops and crop
rotation. ERS research indicates that farmers in high drought risk regions are more likely to

11
participate in the Environmental Quality Incentives Program (EQIP) and are more likely to adopt
reduced tillage practices. (Wallander, 2013)
EQIP provides financial assistance to agricultural producers to deliver environmental
benefits including water retention, soil quality and drought preparation. The USDA, through
EQIP, has funded research into biochar application for soil health improvement but has not
incorporated any biochar product into its granting or financing offerings for agricultural
deployment to respond to water retention challenges.
Fertilizer
Environmental impacts associated with fertilizer are generated either in the creation or
the over-application of inorganic fertilizer. Nitrogen (N), phosphorous (P) in the form of
phosphate and potassium (K) in the form of potash are essential inputs for crop production in
levels that vary depending on crop type. In 2014, US crop producers deployed 23.2 million tons
of nutrients including 13.3 million tons of N, 4.6 million tons of P and 5.2 million tons of K
(TFI, 2016). The U.S. fertilizer market is roughly $11.3 billion annually with an expected
compound annual growth rate (CAGR) of 3.2% (TFI, 2016).
The environmental impact from fertilizer production is concentrated on inputs. Nitrogen
manufacturing is heavily reliant on natural gas which accounts for 70-90% of manufacturing
costs. (TFI, 2016) Fertilizer producers emit over 26.7 million tons CO2e every year representing
1.7 tons CO2e per ton of fertilizer produced (TFI, 2016). Environmental impact of fertilizer
production is also influenced by intensive mining operations to access P and K inputs. Both
resources are non-renewable, and scientists are in disagreement about the future viability of
minable sites as sources of P and K. (Cho, 2013)

12
Excess fertilizer can influence air quality through volatilization, water quality through
leaching into ground water or runoff into surface water, and climate by emission from soil.
(WRI, 2017) An estimated 20% of all applied N is lost to runoff or leaching and volatilization
losses can account for up to 40% of applied N. Volatilized ammonia is commonly redeposited in
waterways through atmospheric deposition. P binds more readily to soil and is more commonly
lost through soil erosion. (Millennium Ecosystem Assessment, 2005) Excess N and P in
waterways causes eutrophication and can fundamentally change the chemical and biological
makeup of habitats.
According to my analysis, a single gasification unit can produce 4,000 tons of char with
60 tons of N and 38.5 tons of P which is equivalent to replacing 600 tons of N fertilizer and 385
tons of P fertilizer per year. Scaling application of biochar as a soil amendment could
significantly decrease environmental impacts of both production and over-application of
synthetic fertilizers.
The Company
History & Technology
CoalTec was established in 2000 by Mike McGolden an engineer with experience in the
coal mining industry. The company is the only current manure-based gasification company and it
holds multiple patents to protect the process that allows for manure feedstock gasification. The
ability to process manure is the company’s key differentiator but their technology has also been
used for other feedstock applications. The technology has been deployed at commercial-scale
facilities in addition to the original test facility. Current operations include a dairy farm in Ohio, a
swine farm in the Netherlands, a poultry farm in Indiana, a distillery in Nebraska, a municipal solid

13
waste facility in Georgia and five poultry farms in Russia.
The company’s critical technology is gasification. Gasification is a method of converting
bio-solids into clean water, electricity and biochar (Figure 1). Before gasification some
feedstocks, such as cow manure, must be separated into solids and liquids in an air-locked
system. The liquid is returned to the on-the-farm lagoon for land application and the solid is
dried in a drum dryer before entering the gasifier. Other feedstocks, such as poultry waste, are
directly applied to the gasifier without the need for solid separation.
Figure 2. Flow chart of feedstock process through gasification
Gasification is a process of heating organic material at high temperatures between 1800
and 2000 degrees Fahrenheit in a regulated low-oxygen environment resulting in incomplete
combustion that converts organic material into carbon monoxide, hydrogen and carbon dioxide.
The presence of oxygen in the process is the key differentiator between gasification and
pyrolysis, a similar thermal decomposition process in a fully oxygen-starved environment. The
gasses are combusted in a thermal oxidizer with the controlled addition of air. The outputs of
gasification are energy and biochar. The energy from the system can be used to regulate the high
temperature needed for the gasifier and dryer. Excess energy can be used to power a boiler and
produce steam for industrial application or energy generation using an Organic Rankine Cycle
14
system. A single unit can convert 50 tons of manure per day, equivalent to the waste of 5,000-
dairy cows, producing 720kWh of energy and 12 tons of MBC daily and 4,270 ton in a year.
In 2010, the company developed the first gasification units to process manure from
livestock production facilities and generate energy and biochar. The company’s patented
technological development is the ability to move manure through the gasification system such
that the temperature and duration of exposure are finely controlled to ensure a consistent quality
of biochar. Without this innovation, gasification systems cannot process manure feedstocks and
are largely used to process wood-based feedstocks. The company also uses additional
technologies to capture and eliminate undesired emissions including nitrous oxide. The current
design of the technology was installed and patented in 2012.
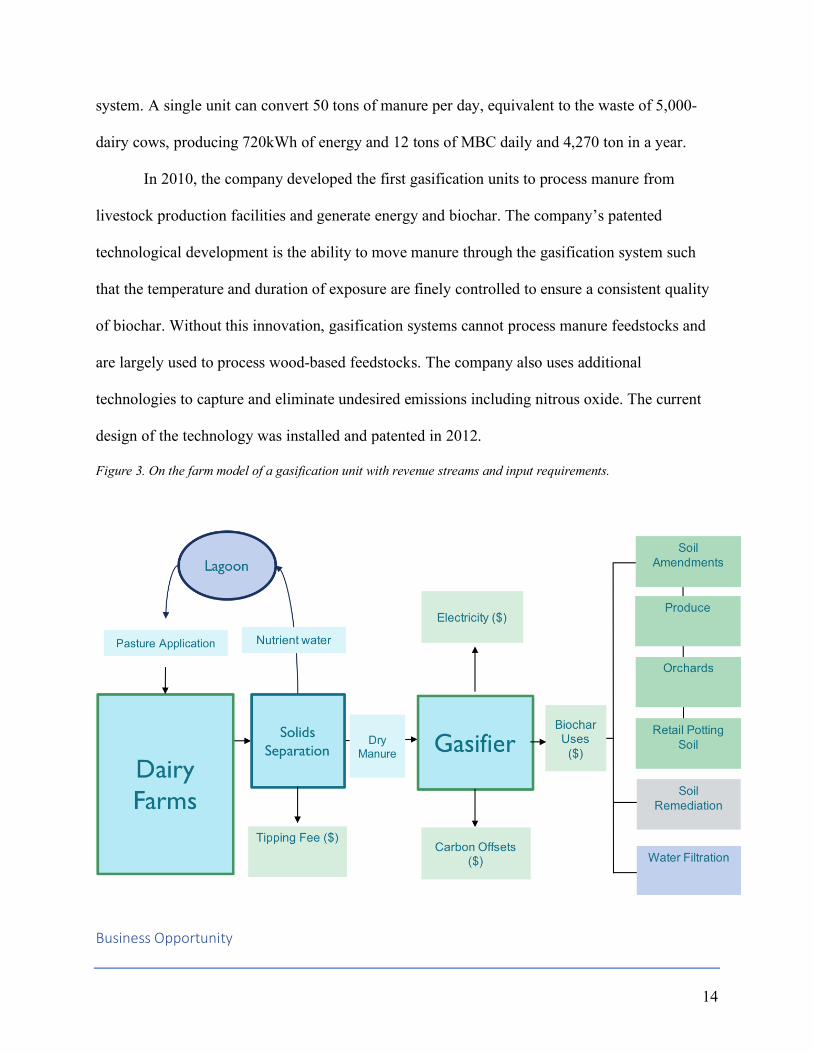
Figure 3. On the farm model of a gasification unit with revenue streams and input requirements.
Business Opportunity

15
Revenue from this technology can come from multiple streams: fees for livestock farmers
for waste management (competitive with cost avoidance from regulatory fees and waste
disposal), energy production sold to the grid or used for heating and cooling, carbon offset
credits in states with relevant policy frameworks and sales of char for multiple use-cases.
Currently, the business model for gasification units has centered on the economic opportunity of
waste management for livestock farmers and steam energy for facilities support. The company
has yet to fully incorporate the biochar sales and electricity generation into the strategy, location
and operation of the units.
The waste management, energy production and heating / cooling markets are well
understood. Manure hauling costs on a confined dairy operation in the North Valley of
California average at $1.61 per cow per month or $19.32 per year and the average over the entire
state is $1.05 per cow per month (CDFA, 2016). For a 5,000-cow dairy, average waste
management fees amount to $96,600 per year (CDFA, 2016). Additional fines for regulatory
infractions can also pose additional costs for farmers increasing the value of gasification
investment. The energy produced can be monetized with a contracted power purchase agreement
with a generation capacity of 720 kWh at $0.128/kWh amounting to over $750,000 per year. The
rate is defined by PG&E’s BioMat feed-in-tariff program for animal inputs (PG&E, 2016).
The carbon offset markets are an unreliable revenue stream due to the unclear future of
the policy mechanism. Assuming that a protocol can be developed to generate carbon-offsets
based on the reduction in greenhouse gas emissions from baseline manure management
practices, a gasifier can offset 15,300 MT of CO2e at $10/ton amounting to $153,000 per year.
This revenue stream is the least reliable but also the least significant for project profitability.

16
The revenue generation from char sales is the unknown element in the business model.
Manure-based char (MBC) is a product that is highly differentiated from the closest competitor
currently sold on the market: plant-based char (PBC). With attributes and values that do not exist
in the market, the willingness to pay for MBC cannot be forecast using the existing pricing
structures for PBC. Alternate uses for MBC are understood as are uses for alternate chars but the
price per ton for MBC as a soil amendment has not been quantified.
Location
Previous deployments of the technology have relied solely on the waste management fee
with some allocation of char and energy for on-the farm use. Therefore, previous strategies did
not require further exploration of the char market opportunity when determining appropriate
locations for siting the gasifiers. Co-location of feedstocks and char deployment would lower
costs of transportation and increase operational capacity to market the product.
California is the leading producer of agricultural products including crops and livestock.
Almost 11 percent of all U.S. agricultural revenue is generated in California. Based on the 2012
Census of Agriculture, California is the leading crop producing state, generating more than $30
billion in crop value (ERS, 2017) which is roughly 75 percent higher than the second-ranked
state, Iowa. (Figure 4) Agricultural value in the next four leading states (Iowa, Illinois,
Minnesota and Nebraska) are primarily generated by commodity crops such as corn, soy, wheat
and oilseeds while California farms generate higher value from specialty crops such as grapes
($5.6 billion annually) and almonds ($5.2 billion annually) of which California produces 89.2%
and 100% of US production. (ERS, 2016) These producers are likely consumers for MBC
because they achieve wider margins than commodity crops and are more likely to invest in long-
term soil, water and fertilizer management planning.

17
Figure 4. US market value of crops sold in 2012 and livestock and poultry products sold in 2012.
Source: USDA 2012
California, along with Texas, Iowa, Nebraska and Kansas, are the leading livestock
producing states (ERS 2012) with California in the lead as largest dairy producer totaling $6
billion in annual production (ERS, 2016, Table). California’s collocation of specialized crop and
livestock farmers presents the market for both feedstock supply and char demand.
Figure 5. US Dairy product sales, Source: ERS 2018
Additionally, California has existing infrastructure for utility-level power purchase
agreements to enable sale of generated electricity. The state is also the leading state for policy to
enable an existing carbon credit protocol for bio-digesters as a manure management mechanism
on dairy operations. An existing protocol makes further protocol development in the future more
feasible. The co-location of dairy-farming as a feedstock for gasification, specialty crop-farming
State Receipts ($1,000)
Share of State Receipts
Cumulative Share of State Receipts
U.S. Receipts ($1,000)
Share of U.S. Receipts
California 6,065,700 13.2 13.2 34,543,067 17.6
Texas 1,848,140 8.9 59.5 34,543,067 5.4
Iowa 833,154 3.1 95.1 34,543,067 2.4
Kansas 530,400 3.4 93.8 34,543,067 1.5
Nebraska 235,248 1.1 95.2 34,543,067 0.7

18
for biochar application and electricity infrastructure suggest that California would be a potential
state for early market development assuming permits can be achieved.
BioChar
This section defines biochar according to its types, attributes and use-cases. The global
biochar market is estimated at $444,000 with a projected CAGR of 14.5% between 2017-2025
when the market value is expected to reach $14 million (Transparency Market Research, 2017).
Biochar is a solid, carbon-rich material obtained from the thermochemical decomposition
of biomass in an oxygen-limited environment. (IBI, 2013) Biochar’s soil health benefits were
first observed in the 1990s in the Amazon basin where soils had been enriched with charcoal by
pre-Columbian Amerindian populations. Char improves soil function because of its resistance to
biological and physical degradation that allows for nutrient and water retention, microbial
activation and liming. The vast majority of char research and char products use woody biomass
and agricultural plant-based residues as feedstocks but dewatered bio-solids such as manure can
also be used to similar effect. (IBI, 2013)
Manure based biochar is an opportunity to recover value from waste streams and upcycle
nutrients that are expensive to produce and rely heavily on environmentally damaging processes.
Animal manure can be a valuable source of nutrients and carbon that can improve soil health and
lower the need for synthetic fertilizers. However, the application of raw manure to soils is a
significant environmental challenge. When processed by gasification, the nutrients in the manure
are retained in a more stable state while the bacterial and pathogenic contaminants are removed.
The output is a char with high nitrogen, phosphorous, magnesium and potassium levels in

19
addition to water retention properties, carbon fixation, high mineral composition, and porous
structure that supports soil microorganisms.
Types
Biochar is characterized by the feedstock inputs for gasification that is used to generate
the product. This section defines the critical differences between PBC and MBC.
Plant-Based Char
Most biochar is currently produced from wood given the high availability of woody-
biomass feedstocks from forest management operations. Gasification technology was originally
developed to focus on forest residual use. Though the process is similar, plant-based and manure-
based chars have very different chemical and physical properties. The chars look very similar but
plant-based feedstocks lack critical nutrients like phosphorous and potassium and so the final
PBC also lacks these inputs. In one study, PBC showed improvements in physical soil properties
but in the absence of nitrogen fertilizer, the application of PBC to the soil did not increase radish
yields even at the highest rate of 100ton/ha of char applied. (Chan et al, 2008)
The primary competitor using PBC is company called CoolPlanet whose product sells for
$16 per 5-quart container weighing 6.5lb which translates to $4900/ton at retail (CoolPlanet,
2018). This product is primarily marketed toward gardeners, hobbyists and enthusiasts rather
than large-scale agricultural producers. Additionally, it is not sold as a fertilizer amendment but
rather as a soil enhancer. The value proposition is not tied to water retention and fertilizer
savings. It is unlikely that MBC can be sold at this price point to agricultural producers who
purchase amendments by the ton rather than by the pound.

20
Average global biochar price is $2.65/kg ($2200/ton) and average US biochar price is
$2.74/kg ($2400/ton) (Jerka and Thayer, 2013). However, at present, the customer base is
limited to small-scale application rather than access the agricultural market that is more price
sensitive. Other char companies targeting industrial agricultural application are priced in the
$300-500/ton range which is a more reasonable price point for my comparison.
Manure-based char
Biochar from manure is free from pathogens, E-coli, growth hormones, and residues from
medications due to the high temperatures and retention time. Manure has 15-30% mineral ash
and 6-18% fixed carbon, which produces a biochar with a carbon content of 20% and twelve
beneficial nutrients including nitrogen, phosphorous, potassium, calcium, magnesium, zinc,
copper and others. The composition of the manure biochar varies with animal type and diet.
MBC can act as a fertilizer replacement because it has high levels of phosphorous and
potassium and can have high levels of nitrogen with certain feedstocks. Compared to manure
chars that range from 4-22% phosphorous and 5-17% potassium, wood-based alternatives have
0% phosphorous and potassium composition. These figures were determined by the company’s
internal testing in collaboration with Cornell University. The product being produce by the
company is further inoculated with microorganisms, nitrogen, humic acid, soybean mill, worm
castings and trace minerals to enhance the probiotic benefits of the product.

21
Figure 6. Breakdown of carbon, moisture, ash, phosphorous and potassium of plant- and manure- based chars made
from nine feedstocks. Source: CoalTec testing with laboratorial assistance at Cornell University.
Attributes
When used as a soil amendment, biochar brings many benefits to the soil which can
increase soil quality, fertility and yield in the short- and long-term. Soil benefits include a)
reversing acidification by increasing soil pH, b) increasing moisture in the soil, c) supporting
populations of beneficial microbes or fungi, and d) retaining nutrients. (Filiberto and Gaunt,
2013) Additionally, manure-based char provides high nutrient content including nitrogen,
phosphorous and potassium with high supply potential.
Nitrogen, Phosphorous and Potassium (NPK) values vary depending on feedstock with
low N in dairy cow manure and high N in chicken waste. By mixing chars from different
feedstocks, the company can engineer an NPK profile that reflects the values in commercially
available fertilizer. The addition of NPK is the primary differentiator between manure-based and
plant-based char and represents the primary driver of price differentiation.
The company recommends application of 5-10 tons per acre per year which is validated
by studies of applied plant-based char for water retention purposes (Jerka and Thayer, 2013). In

22
these studies, at high organic carbon application, all studied soils showed the benefits of
increased water retention with a most significant increase in sandy and silty soils. (Rawls et al,
2003) Improved soil health and crop yield has been studied across different application methods
and crop varietals. A meta-analysis of the literature found a mean yield increase of 10% (Jeffery
et al) from application of primarily plant-based biochar. Legumes (30%) and vegetable (29%)
crops achieved higher than mean yield benefit while corn (8%), wheat (11%) and rice (7%)
achieved lower than average yield benefits. One study found a 64% yield increase from
application of 10 tons/ha of bio-solid char due to the increased nutrient availability. Studies have
shown limited yield improvement benefit above 55 tons/ha with growth reductions at high
application rates generally above 100-200 tons/ha. (Filiberto, 2013). Biochar does not
decompose in the soil or runoff with water application; therefore, a single application may
provide benefits over multiple growing seasons without further investment.
Additionally, the soil has increased capacity to retain fertilizer. In one study, plant-based
biochar increased nutrient holding capacity to reduce losses of Nitrate by 10% and Phosphorous
by 40-70% (Laird et al., 2010). Retention of fertilizer can allow farmers to decrease application
levels over time to save money and decrease environmental impacts of fertilizer runoff.
Use-Cases
A variety of uses for char have been explored to both environmental and financial
benefit. These uses include 1) soil amendment 2) feed supplement 3) poultry farming pollution
reduction 4) animal bedding and 5) soil remediation. Alternatives to soil amendment are
explored in this section.
Feed supplement

23
Ninety percent of the WBC produced in Europe is currently being used in livestock
farming either as a preventative feedstock to reduce the levels of botulism in cattle or as bedding.
(Gerlach, 2012) Chronic botulism is an infection caused by clostridium botulinum toxins which
can be fatal for livestock. (Kruger et al 2012) Among the factors influencing the toxic infection,
Kruger (2012) suggests that glyphosate, a broad-spectrum herbicide, is likely causing detectable
changes in the gastrointestinal microbiota. Activated carbon has been used as an effective
method to absorb pathogenic clostridial toxins such as C. botulinum (Luder 1947) and new
studies have shown absorptive capacity of biochar to bind glyphosate (Graber 2012). Biochar is a
subcategory of activated carbon however activated carbons on the market can be 5-10 times
more expensive (Gerlach, 2012).
There are reported advantages of mixing biochar into animal feed. In North Vietnam,
growth rates of goats improved when 0.5-1g of bamboo-based biochar / kg feed was added to the
feed (DoThiThanVan, 2006); weight increases were seen in chickens with the addition of .2-.6%
corn-based char (Kana et al 2011); and methane formulation by bulls was reduced by 12.7%
when 1% char was added to feed (Leng et al, 2012). The current price of activated carbon
products is $1440 per ton and has grown at 1.8% per year. (IBIS, 2018).
Poultry farming
Poultry diseases including foot pad dermatitis have been traced to pathogens and
ammonia in litter or bedding. These diseases can cause poultry losses, slower growth and even
cannibalism (Gerlach and Schmidt, 2012). The porosity of biochar can regulate moisture levels
in litter and reduce ammonia pollution in indoor coops while restricting microbial pathogens,
preventing diseases and lowering unpleasant odors (Steiner et al, 2010). If biochar is included in

24
the feed, digestive toxins can be deactivated which increases health and growth rates for poultry.
Short term impacts of biochar application in feed and litter have been studied for egg laying
chickens (Van, 2006), ducks (Kana, 2010) and broilers for meat production (Ruttanvut, 2009).
Long-term effects of biochar application in chicken litter has not yet been studied.
Animal bedding
The Coaltec facility in Indiana has deployed the char output as animal bedding to
considerable but anecdotal success. Use of char as bedding has shown a reduction in humidity
and ammonia levels. Char application is a potential opportunity to improve living conditions in
CAFOs, increase animal health in feeding operations and increase growth and yield of livestock.
MBC and PBC have both been used for this purpose and an existing market yields a $30-50/ton
price for biochar for bedding application. (University of Kentuky,2016) Though the market has
been developed for animal bedding application, more research is still needed to fully quantify the
benefits to animal health and growth.
Soil remediation
The majority of literature published about MBC with dairy-cattle inputs discusses the
opportunities for remediation of contaminated sites. One study showed that MBC from dairy
operations can be effectively used to absorb heavy metal contaminants such as lead as well as
organic contaminants such as atrazine. In this study, the biochar was six times more effective in
lead sorption than commercially available activated carbon and the biochar was able to absorb
lead and atrazine where it coexisted while commercially available activated carbon was unable to
remediate both simultaneously. (Cao, 2008) Another study showed that MBC was also effective

25
at absorbing CD, CU and SN due to the high mineral components in the char that play an
important role in the char’s high sorption capacity (Cao, 2008).
Activated carbon is the market competitor for soil remediation and it sells at $1,586 per
ton (Research and Markets, 2017). The activated carbon market valued is estimated at $3.0
billion (Hegeman, 2018).
Adoption
In a case study of Polish farmers conducted last year, researchers found that only twenty
percent of farmers were interested in adopting biochar into their agricultural practices. However,
farmers with more knowledge of sustainable agriculture were 16% more likely to express interest
in adoption and farmers with the least experience running an agricultural business (<5 years or 5-
10 years) were most likely to express interest in adoption. Farmers with less than five years’
experience were half as likely to directly reject biochar as a soil amendment. (Figure 7) Of the
farmers who expressed interest in adopting biochar, 74% expressed knowledge about sustainable
agriculture and 52% expressed that sustainable agriculture could be financially beneficial to farm
operations.
Figure 7. Willingness to adopt biochar versus time of running an agricultural business. Source: Latawiec 2017

26
Interest in use was also a function of education. The next phase of the research was to
educate farmers on the positive and possible negative effects of biochar application. Of the
farmers who received the training, 59% were interested in its use. Across the board, the greatest
influence on perceived benefits of biochar were related to soil quality improvements (50%) and
the greatest concerns were related to cost of adoption (52%). This research suggests that
education about both plant-based and manure-based char will increase the willingness to pay and
early adopters are more likely to have preexisting interest in sustainability as a financial driver
for investment.
Methods
First, I built an operational model considering the inputs for revenue sources, capital
expenditure, operational expenditure and debt service. Using this model, I found a breakeven
price of char at which the company is able to repay its debt obligations on an operating facility. I
ran sensitivity analyses on the model to find a minimum possible char price with consideration
for fluctuations in critical assumptions.
Next, I used Value-Based Pricing analysis to identify a reasonable price premium over
the next best competitors: plant-based char. This pricing strategy considers differentiating
attributes that increase or decrease the value to the consumer for replacing existing practices with
biochar application.
Third, I construct an interview methodology with vineyard managers, almond growers
and indoor producers to understand their requirements for fertilizer use, their water limitations
and their hesitance to adopt a new product. From these interviews, I am able to verify the
willingness to adopt at the price generated by the models.

27
Pricing Models
This section explores two pricing methodologies and the assumptions deployed in each model.
Breakeven analysis
In this analysis, a discounted cash flow model with hauling fees, electricity generation
and debt service to identify a base-state for the financial operation of a single gasification unit.
From this base-state, Excel Solver identified the break-even point at which biochar sales allows
the cash flow to service the debt and operations of a single gasification unit. The assumptions
associated with manure hauling fee, animals per farm, electricity credit valuation, carbon credit
valuation and biochar COGS were tested for sensitivity analysis using 60 to 140% of assumed
values and compared across values.
Assumptions
• A unit has a depreciation schedule of 20 years based on the expected lifespan of the
technology and the tax rate is 21% to reflect the corporate tax rate in the US.
• The nominal discount rate is 8% to reflect the weighted average cost of capital of
agricultural operations (NYU, 2018) and the inflation rate is 2%.
• A single unit can service a 5,000-cow dairy farm. This is a conservative assumption
because the true maximum capacity of the unit is likely generated by 6,000-cows. The
assumption of operation at 83% capacity is achievable based on previous operating
models. A 5,000-cow operation produces 109,500 tons of manure with 13% solid content
and 14,235 tons of gasifier feedstock. The gasifier produces 3,600 tons of char and 720
kWh valued at $0.128/kWh according to the PG&E’s BioMat feed-in-tariff program for
animal inputs (PG&E, 2016). Carbon credits are priced in this model at $10/credit with

28
an annual generation of 15,300 credits. As a conservative assumption, the model does not
generate credits for the first three years of operations giving time to put a protocol in
place based on the existing bio-digester protocol baseline standards of lagoon
management practices for dairy operations.
• Capital expenditure, operating expenditures, equipment, labor and construction costs
$8,500,000. The cost of goods sold (COGS) for char are 25% revenue.
• The project will be financed with 75% debt and 25% equity to reflect the equity
requirements of most lenders for infrastructural programs.
• The debt services a 10-year loan valued at $6,375,000 to cover 75% of the operational
costs with an annual repayment schedule of 5% of the debt with a balloon payment at
year 10 and an 8.5% interest rate.
Value-based pricing
Value-based pricing is a method of pricing strategy that incorporates estimated or
perceived value to the customer in determining a feasible price for a new product. Unlike cost-
plus pricing, it is not based on the cost of the product. Often, value-based pricing is used when a
small number of competitors are in the market for non-commodity products being sold to
sophisticated buyers. The output of value-based pricing is best compared with break-even
analysis to assure that cost recovery is achieved.
Economic Value to the Customer (EVC) analysis helps determine a customer’s
willingness to pay for a product using the following equation: EVC = Reference Value +
Differentiation Value. This valuation method assumes that the customer is aware of the product
benefits and competitors.
29
Reference value is the price of the closest substitute with adjustments made for
differences in quantity or cost of applying the two products. The differentiation value is the value
of a product’s attributes that differentiate it the closest substitute. The EVC analysis provides
insight on the maximum willingness to pay for the farmer. This process is repeated for each
market segment with consideration for segment market opportunity to determine a multi-segment
pricing strategy.
In the case of biochar, value-based pricing is a good approach because manure-based char
has different attributes from its closest competitor, plant-based char. In this case, the reference
value is the price of PBC and the differentiation value is the summation of the cumulative
benefits attributed to MBC but lacking in PBC.
Assumptions
1- Price of competitors
Average price of plant-based biochar at wholesale is $2.06 / kg equivalent to $1,868 / ton
according to the International Biochar Initiative 2014 State of the Industry Report with a price
range from $362/ton to $7257/ton (Jirka, 2015). This discrepancy comes from a variety of use-
cases and application methods. Most compelling recommendations come from the US Biochar
Initiative at $500/ton. For this analysis, I assumed that a low scenario would be $350/ton, a
medium scenario would be $500/ton and a high scenario would be $650/ton. This price
internalizes the price of water retention and soil improvement as a proxy for yield increase.
2- Value of fertilizer
N: The 2017 average price for N in the form of Anhydrous ammonia is $509/ton. (Schnitkey, G.)
One ton of char from dairy manure feedstock and blended feedstock contain 18.8 lb and 21.3lb
of N respectively.
30
P: The 2017 average price for P as Diammonium phosphate is $425/ton. (Schnitkey, G.)
One ton of char from dairy manure feedstock and blended feedstock contain 41.2 lb and 152.9 lb
of P respectively.
K: The 2017 average price for K as Potash is $318/ton. (Schnitkey, G.)
One ton of char from dairy manure feedstock and blended feedstock contain 55.39 lb and 80.8 lb
of K respectively.
Micronutrients: Both blended and dairy manure feedstocks contain levels of the following
micronutrients: Aluminum, Calcium, Copper, Iron, Magnesium, Manganese, Sodium, Sulfur and
Zinc. A pricing market for these micronutrients is less well developed. For example, Zinc price is
currently $3,262/ton (IndexMundi, 2018) but is not stable at that price for agricultural
application because of the low current adoption of enriched fertilizers. For a conservative
estimate, the value of all micronutrients was assumed to be $100/ton to reflect the value of
micronutrient loss which is estimated to be $247/hectare or $100/acre (Eswaran et al, 2001) and
application of 1 ton per acre for micronutrient benefit.
3- Value of fertilizer retention
In addition, use of biochar increases the retention of fertilizer by 10-30% allowing for decreased
application quantity with comparable yield (Gaunt and Cowie, 2009). In this model, I use a
conservative 10% reduction to reflect early year benefits.
All assumptions and calculations are summarized in the chart below.
31
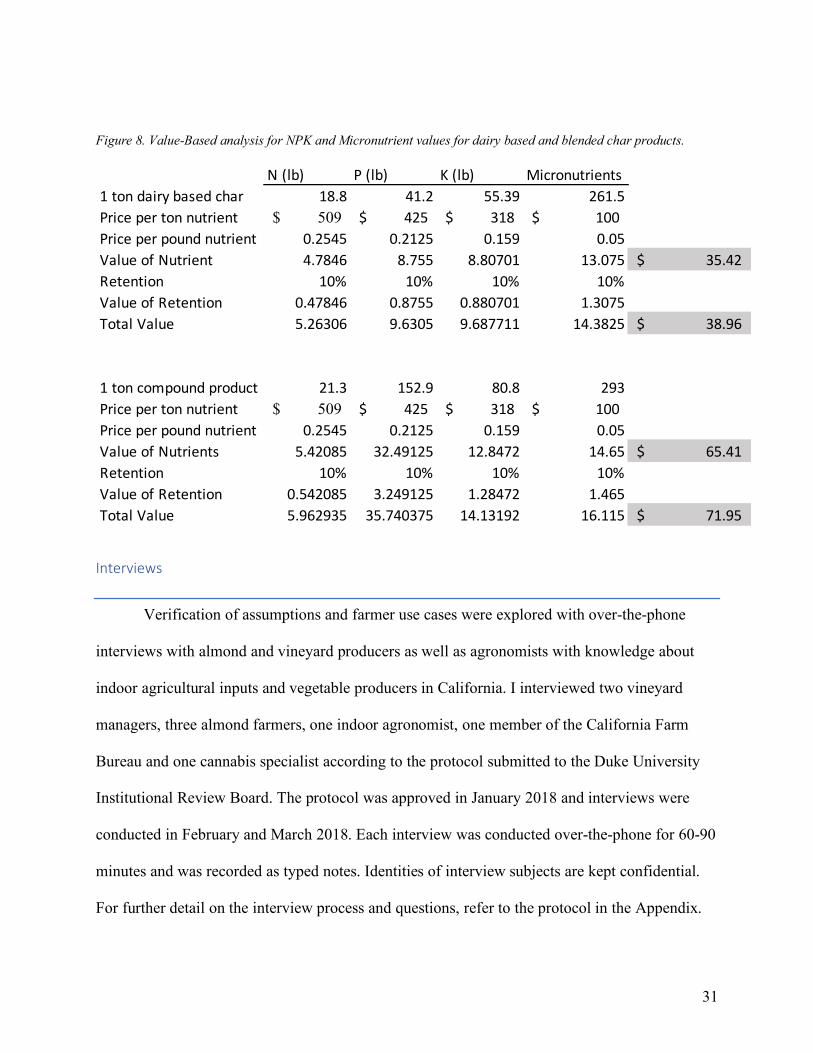
Figure 8. Value-Based analysis for NPK and Micronutrient values for dairy based and blended char products.
Interviews
Verification of assumptions and farmer use cases were explored with over-the-phone
interviews with almond and vineyard producers as well as agronomists with knowledge about
indoor agricultural inputs and vegetable producers in California. I interviewed two vineyard
managers, three almond farmers, one indoor agronomist, one member of the California Farm
Bureau and one cannabis specialist according to the protocol submitted to the Duke University
Institutional Review Board. The protocol was approved in January 2018 and interviews were
conducted in February and March 2018. Each interview was conducted over-the-phone for 60-90
minutes and was recorded as typed notes. Identities of interview subjects are kept confidential.
For further detail on the interview process and questions, refer to the protocol in the Appendix.
N (lb) P (lb) K (lb) Micronutrients1 ton dairy based char 18.8 41.2 55.39 261.5Price per ton nutrient 509$ 425$ 318$ 100$ Price per pound nutrient 0.2545 0.2125 0.159 0.05Value of Nutrient 4.7846 8.755 8.80701 13.075 35.42$ Retention 10% 10% 10% 10%Value of Retention 0.47846 0.8755 0.880701 1.3075Total Value 5.26306 9.6305 9.687711 14.3825 38.96$
1 ton compound product 21.3 152.9 80.8 293Price per ton nutrient 509$ 425$ 318$ 100$ Price per pound nutrient 0.2545 0.2125 0.159 0.05Value of Nutrients 5.42085 32.49125 12.8472 14.65 65.41$ Retention 10% 10% 10% 10%Value of Retention 0.542085 3.249125 1.28472 1.465Total Value 5.962935 35.740375 14.13192 16.115 71.95$

32
Results
Breakeven Analysis
The breakeven price at which the project achieves a debt service coverage ratio equal to
1.00x occurs at an opening MBB price of $383.19/ton. At this price, the NPV of the project is
$4.5 million, the equity IRR is 34.4% and the project after-tax IRR is 14.8%. If the debt service
coverage ratio requirement is raised to 1.25x, the minimum char price increases to $485/ton. At
this price, the NPV of the project is $7.5 million, the equity IRR is 52%, and the after-tax IRR is
18.6%. It is understandable that there is a significant difference between the rates of return for
the project and the interest rate of 8.5%. This discrepancy represents the different risk profiles of
the debt and equity investments. The debt investment is paid first and is returned within 10 years
while the equity is not realized until later and is exposed to the fluctuations in the market and the
success of the project. This reflects common discrepancies in similar infrastructure investment
projects.
The sensitivity analysis found that the necessary price of biochar will change to reflect
fluctuations in the following assumptions.
• Animals/Unit: The model is most sensitive to the number of cows providing feedstock
because the inputs generate multiple sources of revenue.
• Electricity rate: The feed-in-tariff sensitivity is linear because electricity and char sales
are independent events. This input generates the second largest revenue and is the second
most sensitive variable.
• COGS: When cost of production increases, the necessary price of sale increases to reflect
the lost profit. This is likely to occur in the case that transportation costs increase
substantially or access to customers increases.

33
• Hauling Fee: Despite the fact that previous facilities have been supported solely by
hauling fees, this operation is fairly insensitive to changes in hauling agreements.
• Carbon price: The model is insensitive to the price of carbon with no change in the
necessary break-even price for char. This is because the early years of debt payment are
the most limiting and the carbon protocol does not generate revenue until the fourth year.
Figure 9. Sensitivity analysis between -40% and 140% of initial input assumptions and the corresponding breakeven
price for MBC.
Economic Value Add
The Economic Value Add pricing model indicates that MBC with dairy and blended
feedstocks are both valued above the breakeven threshold of $383 in low, medium and high
market scenarios for plant-based char. Dairy feedstocks increase the value above PBC by $38.96
per ton and blended feedstocks increase the value above PBC by $71.95 per ton. The blended
$250.00
$300.00
$350.00
$400.00
$450.00
$500.00
$550.00
$600.00
$650.00
$700.00
60% 70% 80% 90% 100% 110% 120% 130% 140%
Sensitivity Analysis% Change of Assumptions
Animals/Unit Electricity Rate COGS Hauling Fee Carbon Market

34
char showed higher price potential than the dairy-based char due to the higher Nitrogen,
Phosphorous, potassium and micronutrient levels. However, as the market for char strengthens,
the benefit of blended feedstock over a dairy feedstock is depleted. These results suggest that
agricultural application is a viable market for MBC and that a blended product is more valuable
but not prohibitively critical as the market for char develops in the future.
Figure 10. Results of Economic Value Add pricing model for dairy and blended feedstock chars in low, medium and
high market penetration of plant-based char competitors.
$389
$539
$689
$422
$572
$722
7.8%
5.8%
4.6%
0.0%
1.0%
2.0%
3.0%
4.0%
5.0%
6.0%
7.0%
8.0%
9.0%
$-
$100
$200
$300
$400
$500
$600
$700
$800
Low Medium High
Three Scenarios for Char Sales
Dairy Feedstock Blended Feedstock Percent difference
Low Medium HighPBC price per ton 350$ 500$ 650$ Cow value 38.96$ 38.96$ 38.96$ Total Value 388.96$ 538.96$ 688.96$
Blended value 71.95$ 71.95$ 71.95$ Total Value 421.95$ 571.95$ 721.95$

35
Interviews
Interviews with almond farmers, vineyard managers and vegetable growers illuminated
farmer strategies that must be considered in determining an ideal market for MBC and a future
growth strategy for the product if increasing numbers of gasification units are built.
Almonds
Themes from conversations with almond farmers highlighted more threats than
opportunities suggesting that almond farmers may not be the primary candidate for early
adoption. Opportunities and threats are synthesized below.
Opportunities:
• Water-risk avoidance is indeed critical according to almond farmers in California. Water
access in an increasingly drought-prone region is a risk more than a cost so linking the
value of char to risk avoidance is more compelling than linking the value to cost
avoidance. Farmers are willing to spend over $70,000 for a new well to increase their
surety of supply in drought affected years. Wells and other irrigation investments are also
factored into land prices should farmers wish to sell the property in the future. If char can
be applied as a long-term water benefit, farmers may be willing to invest in addition to
investing in wells and irrigation systems. Biochar is unlikely to provide an alternative to
wells and irrigation systems.
• The Almond Board is holding trainings and educational opportunities around char
adoption and could be an asset in convincing farmers of the benefits associated with
applying char during planting.
Threats:

36
• Almond farmers apply no soil amendments and use little or no fertilizer which nullifies
the nitrogen, phosphorous and potassium benefits of MBC over PBC. It is unlikely that
these farmers will be willing to pay a premium for the micronutrients in the product
beyond the water benefits already present in PBC.
• Almond farming exposes soil to minimal tilling because of the multi-year life of a single
planting. Soils on almond farms have not been degraded to the same degree as other crop
lands and may not benefit from the activated carbon sequestered in biochar.
• Almond processing produces signification waste from almond hulls. These hulls are
adequate feedstocks for gasification and farmers are unlikely to pay a price for MBC if
they can produce PBC from their local waste streams.
Vineyards
Vineyards are a likely candidate for early adoption of MBC based on the high-margins
and long-investment horizons of vineyard operators. Opportunities and threats indicated in
conversations with vineyard managers are highlighted below.
Opportunities:
• Vineyard owners are accustomed to long investment horizons because it is common for a
new vineyard to start returning revenue after 10 years. This timeline is aligned with the
benefit schedule associated with biochar application because soil benefits may not be
available in the first years of planting.
• Many farmers are concerned about water availability and water location. Many farms are
following the trend of becoming “dry farms” which are farms that rely only on natural
annual rainfall with no additional irrigation. Biochar would help farmers achieve this
vision by sequestering water between rainfalls. Additionally, farmers want to manipulate

37
the roots of the vine to encourage greater growth below 5 inches of soil. Increased
sequestration of water below the top layer would help farmers achieve this goal.
• Vineyard managers are a consolidated information channel that influence many
producers. Their position allows biochar companies to market products in a less
fragmented approach.
Threats:
• Many viticulturists recommend applying organic certified products onto vineyards even if
those vineyards are not producing organic wine. Organic certification is thought by some
to be a proxy for safety standards in soil. No MBC has been certified as organic at this
time and the company may need to consider certification to gain access to the vineyard
production market.
• Many vineyard managers apply compost once a year to encourage yield increases.
Compost in Northern California sells at roughly $7 for a 40 lb bag which translates to
$350 per pound. It is unlikely that farmers will be willing to spend more than this price
for fertilization properties but may be willing to forego compost application in favor of
MBC with NPK attributes.
Vegetables
Crops including lettuce, berries, tomatoes, broccoli and other commodities exceeded $35
billion in revenue in 2016 (ERS, 2017). These farmers are diversified and fragmented.
Discussion with the California Farm Bureau highlighted the following opportunities and threats.
Opportunities:

38
• Specialty crop farmers are highly influenced by extension experts primarily through the
UC Davis extension program. This centralization of expertise could allow beneficial
partnerships between UC Davis and biochar companies to rebuild degraded soils.
Threats
• Specialty crop farmers operate on margins that are not as low as row crop farmers such a
corn or wheat but are still highly price sensitive as their profitability is contingent on
input costs for fertilizer, protectants and seeds. An additional expenditure may be
challenging to most farmers who already apply multiple soil amendments.
• These farmers tend to be timid about adopting new products and many have heard of
biochar in the past but are still skeptical about the tangible yield benefits.
Indoor Cultivation
Indoor agronomists are gaining increasing financing for high capital expenditure farming
operations. These indoor farms often grow leafy greens, tomatoes and in some states, cannabis.
The following opportunities and threats were highlighted by an agronomist working in indoor
farming.
Opportunities:
• Indoor farmers are unable to rely on the natural environment for water or soil. They are
accustomed to importing fertilizers, soils and other amendments in large quantities and
are likely to try a new product to decrease reliance on synthetic amendments. The
availability of NPK values increase the willingness to adopt for these farmers as their
NPK values are closely monitored for maximum yield.

39
• Indoor farming operations have a high willingness to pay for products that increase yield
because space constraints are the greatest limitation to profitability and faster harvest
times allow for increased usage of limited space.
• Competitors selling PBC soil amendments sell for $50/lb which illustrates that indoor
farmers have low price sensitivity and high willingness to adopt new technologies.
Threats
• The potential environmental benefits of MBC would be hindered if applied indoors.
Degraded soils and polluted water supplies will not be positively impacted by application
of MBC to indoor farms.
Discussion
In this project, I aimed to understand the price and market opportunity for manure-based
char as a soil amendment. The breakeven analysis found that the char must sell for $383 per ton
to achieve a debt service coverage ratio of 1.00x and must be priced at $485/ton to maintain a
DSCR of 1.25x. The economic value-added analysis finds that a dairy feedstock could achieve a
market price between $388-688 and a blended feedstock could achieve a market price between
$422-722 depending on market conditions for the closest competitor, plant-based char.
Understanding the potential market price for the product is only helpful if the customer’s
goals are aligned with the product’s attributes and if the customer is willing to adopt a new
product. Conversations with farmers influenced the following recommendations to the company.
1- Set the price for the product at $485 per ton in the first years of sales. This price allows
for a cushion in the debt service and is priced below plant-based competitors despite the
40
increased benefits of a manure-based product. This price is justified by the value-added
analysis for both blended and dairy feedstocks in medium and high market conditions.
2- Start with indoor growers to gain economies of scale in a price insensitive market with
growing partners who are accustomed to investing in new technologies to increase plant
yield. This market is not large enough for long-term specialization and limits
environmental upside potential but is the most profitable market to launch.
3- Secure organic certification before going to market with either indoor or outdoor
growers. Organic certification will increase the trust in the product and will decrease
concern around the safety of manure application to crops.
4- Collaborate with an academic institution such as UC Davis to increase the credibility of
research that supports the benefits of the product. In this partnership the following
questions should be revisited and quantified: i.) What is the NPK and micronutrient
availability schedule and how is it impacted by biochar’s absorptive capacity? ii.) What
are the yield increases in the first five years for vine growth and lettuce growth? iii.)
What is the timeline of water-retention benefits and does the manure-based char have
increased absorptive capacity for water beyond that of plant-based char?

41
Appendix
Research Description
1. Research Design
What is the purpose of the study? Provide background information when appropriate.
The purpose of the study is to understand the willingness of nut, berry and grape farmers in
California to adopt a new product called EcoChar and the price-point at which this product might
enter the market based on its value to farmers. EcoChar is an output from the gasification of
livestock waste in a controlled temperature in a low-oxygen environment. EcoChar can be used
as a feed supplement, animal bedding, soil remediation from heavy metal contamination and as a
soil amendment. The market has signals for the willingness to pay for chars as feed supplements,
animal bedding and soil remediation but no comprehensive substitutes exist for char as a soil
amendment. This interview-based study will be complementary to a pricing financial model that
forecasts a pricing strategy for EcoChar based on the product’s value proposition to reduce
water, reduce fertilizer and improve soil quality. The interviews in this study will confirm or
deny the validity of the pricing model based on the input of farmers and farming professionals.
The participants in the study will be limited to California-based farmers because 1) California
leads the country as the largest producer of agricultural products and 2) the dairy-based
gasification technology will also be focused on California livestock farmers. This research will
help understand if the market for EcoChar can help support a larger financial strategy to invest in
on-the-farm gasification technology in California. This research is being done to support my
candidacy as a Master of Environmental Management at the Nicholas School of the Environment
in May 2018. The results will be made available online and will also be shared with a company,
CoalTech, that is developing an EcoChar product. I am not being paid for the research.

42
In what activities will subjects participate? How long will each activity take?
• Describe and attach surveys, questionnaires, and interview schedules. • If you plan to conduct informal interviews, life histories, or other “organic” interviews,
provide a description of the topics you will address or sample questions. • If the study involves observation, describe the events to be observed and the setting. The activity of this study will be on-the-phone interviews.
First, I will be connected via e-mail with farmers by a consultant who has been paid to
make connections between the company developing the gasification technology and California
farmers who might deploy it. In this email, I will introduce myself and explain the research I am
conducting according the language in the informed consent description attached below in section
3 of this application. I will schedule interviews to take place at the farmer’s convenience, over
the phone and will not record the interviews.
During the interview, I will reiterate the information from the informed consent
documentation to ensure that they understand the purpose and procedure of the interview. I will
ask questions from 6 categories: 1) Background 2) New technology adoption 3) Char 4) Water-
use 5) Fertilizer-use 6) EcoChar pricing. Questions for each category are listed below. Each
interview will not include an exhaustive review of all questions depending on the participant’s
level of interest in each area. None of these areas represent risks for discovering illegal behavior.
Though the production and sale of fertilizer is regulated in the state of California, the use and
application are not regulated at the farm level.
I will take hand-written notes on the responses to the questions. After the interview I will
type these notes to allow me to analyze the responses. The analysis and the conclusions will be
made available on the internet with my final report through the Nicholas School of the

43
Environment. The notes of the comments will not be made available with the final report. I will
keep the notes on my computer for one year then I will delete them.
Will you collect identifiable data? Please describe.
I will not collect identities of farmers. The only data that describes the farmers is the crop or
crops that they are farming and the size (by acreage) of the farm. California has 79,631farms in
seven regions making it difficult to deduce the identity of a single farmer based on the size of his
or her farm and the crops grown on that farm.
2. Subject Selection
Describe your proposed subject population.
California crop farmers whose crops include nuts (almonds, pistachios, walnuts), berries
(strawberries, raspberries), orchards (oranges, tangerines, peaches, plums, prunes, nectarines,
lemons, limes), vineyards (grapes), and planted vegetables (lettuce, tomatoes, broccoli, carrots,
peppers, celery, garlic, rice, avocados).
Describe how you will you recruit your subjects.
I have a consultant who is working for the company that has developed the new product,
EcoChar. She has been hired to help analyze the market for gasification and has colleagues who
are berry, nut, orchard, vegetable and vineyard farmers as well as relationships in the California
Farm Bureau to access additional farmers. As a line of work in her consulting contract, she has
agreed to make introductions with both communities. No raw data will be returned to the
consultant and I am not working for the consultant. She has been introduced to me through the

44
company CoalTech as they are interested in my findings. CoalTech will also not receive the raw
data.
The following message will be used to send preliminary emails to
Dear ------,
My name is Amanda Bushell and I am a master’s degree candidate from Duke University
working toward my MBA and Master of Environmental Management. I am doing research to
learn about the willingness of farmers like yourself to adopt a new product called EcoChar and
the price-point at which this product might enter the market based on its value to farmers. I
would very much appreciate if you would be willing to speak with me on the phone at your
convenience. For more information, please see the attached informed consent form.
I look forward to speaking with you and appreciate your time.
Sincerely,
Amanda Bushell

45
3. Informed Consent
Informed Consent (circulated before the interview and reiterated up front)
Thank you for taking the time to talk with me about a new product called EcoChar. My name is Amanda Bushell and I am a master’s degree candidate from Duke University working toward my MBA and Master of Environmental Management. Today’s discussion supports my research requirement for the Environmental Management degree. The analysis will be made available online and will be shared with a start-up company developing a product in this space. I am interested in learning the willingness of farmers like yourself to adopt a new product called EcoChar and the price-point at which this product might enter the market based on its value to farmers. If you agree to participate in this interview, I will ask you to talk with me about the limitations you perceive in your process for applying fertilizer and water to your fields. I will ask you questions about your approach to using both fertilizer and water. I will also ask you about your perception of your soil quality and the change in soil quality over time. If at any point you feel uncomfortable disclosing any information about your on-the-farm practices or opinions, you may ask to skip a question. You can also stop the interview at any time, for any reason. We can talk for as long as you like, but I expect our conversation will take about one hour. This conversation will not be recorded but I will be taking notes on your comments. I will not record your name in my notes of this conversation and your name will not be associated with my research. If you request that any remark be considered “off the record” I will not write it down and it will not be considered in my analysis. Please let me know if you have any questions for me at this time. If you have any questions about this study in the future, please contact me at 203-767-5841 or [email protected]

46
Questions that will be asked. This is an exhaustive list and most interviews should not need all the questions listed in each category, but each interview will include at least one questions per category. Respondents with limited answers will be given more questions per category. Background: What crops do you grow? How large is the land you farm? Approximately what share of your land is allocated to each crop type? What technologies do you use on the farm? How long have you farmed this land? Have you changed your crop allocations? What are your biggest on-the-farm concerns for the operation of your farm? New technology adoption: Have you adopted any new products or technologies on the farm in the last year? If yes: Where you did you hear about this technology/product? If no: Did you hear about any technologies or products that you chose not to adopt? What information sourced do you trust when deciding to adopt a new product? Do you talk to other farmers? Do you test a new product in a small part of your field or the whole field in the first year? What percent of the field would you feel comfortable dedicating to a new product? What would make you more comfortable to test a new product? Chars: Are you familiar with any char products including Biochar? What is your perception of those products? Are they valuable? Do they address any challenges you have on the farm? How did you hear about char products in the past? Water-Use: Can you describe your approach to irrigation? Can you quantify your annual budget for water? Can you quantify the amount of water you use and the way you access your water use data? Has your water-use changed over time? Is water-use a concern for your operating budget or your profitability? Is water-use a concern for your buyers or customers? How confident are you that using less water would decrease your yield? How do you decide the amount of water to use? Is there any additional information you can share about your water-use at this time?
47
Fertilizer-Use: Can you describe your approach to applying fertilizer to your fields? How do you decide what fertilizer to use and how much? Can you quantify your annual budget for fertilizer? Can you quantify the amount of fertilizer you use? Has your fertilizer use changed over time? Is fertilizer-use a concern for your operating budget or your profitability? Is fertilizer-use a concern for your buyers or customers? How confident are you that using less fertilizer would decrease your yield? Is there any additional information you can share about your fertilizer-use at this time? Soil Quality: How do you define soil quality? How would you characterize your soil quality: poor, medium, high quality? Have you seen a change in your soil quality over time? Do you wish you had a solution to soil quality? Have you heard of other solutions to improve soil quality? Price for BioChar How much would you pay for a product that reduces your water costs by 10%? How much would you pay for a product that reduces your fertilizer costs by 10% Do you think $0.20/lb (aka 400/ton) is a reasonable price for a product that cuts your water and fertilizer costs by 10%?

48
References
Act, C. W. (2008). Clean Water Act. EPA’s Office. AgWeb (2017) Zinc Fertilizer Sees Slow, Steady Growth. https://www.agweb.com/article/zinc-
fertilizer-sees-slow-steady-growth-blmg/ Assessment, M. E. (2005). Ecosystems and human well-being: policy responses. Belete, E., & Ayza, A. (2015). A review on alternative technologies to manage manure: Cost
effective and environmentally beneficial. Livestock Research for Rural Development, 27(10).
California Air Resources Board. (May 2015) Short-lived Climate Pollutant Reduction Strategy: Concept Paper, pp. 21-22. http:// www.arb.ca.gov/cc/shortlived/concept_paper.pdf
California Department of Water Resources (2014) “The Strategic Plan”, California Water Today, Volume 1, Chapter 3, pp. 3-35
Cao, X., Ma, L., Gao, B., & Harris, W. (2009). Dairy-manure derived biochar effectively sorbs lead and atrazine. Environmental science & technology, 43(9), 3285-3291.
Chan, K. Y., L. Van Zwieten, I. Meszaros, A. Downie, and S. Joseph. “Agronomic Values of Greenwaste Biochar as a Soil Amendment.” Soil Research 45, no. 8 (January 7, 2008): 629–34. https://doi.org/10.1071/SR07109.
Cho, R. (2013). "Phosphorus: essential to life-are we running out." Agriculture, Earth Sciences. Earth Institute, Columbia
CoolPlanet (2018) Website accessed from: http://www.coolplanet.com/ Dodds, W. K., Bouska, W. W., Eitzmann, J. L., Pilger, T. J., Pitts, K. L., Riley, A. J., ... &
Thornbrugh, D. J. (2008). Eutrophication of US freshwaters: analysis of potential economic damages.EPA (2017) “The Sources and Solutions: Agriculture” https://www.epa.gov/nutrientpollution/sources-and-solutions-agriculture
EREF (2016) “Analysis of MSW Landfill Tipping Fees (PDF).” Environmental Research & Education Foundation, 2016. https://erefdn.org/product/analysis-msw-landfill-tipping-fees/.
ERS (2017, April) “Agricultural Production and Prices” https://www.ers.usda.gov/data-products/ag-and-food-statistics-charting-the-essentials/agricultural-production-and-prices/
Eswaran, H., R. Lal and P.F. Reich. (2001) Land degradation: an overview. Natural Resources Conservation Service https://www.nrcs.usda.gov/wps/portal/nrcs/detail/soils/use/?cid=nrcs142p2_054028
Filiberto, D. M., & Gaunt, J. L. (2013). Practicality of biochar additions to enhance soil and crop productivity. Agriculture, 3(4), 715-725.
Flynn, R. (2014) “Calculating Fertilizer Costs” NM State University Extension Services Gaunt, J., & Cowie, A. (2009). Biochar, greenhouse gas accounting and emissions trading.
Biochar for environmental management: Science and technology, 317-340. Genesio, L., Miglietta, F., Baronti, S., & Vaccari, F. P. (2015). Biochar increases vineyard
productivity without affecting grape quality: Results from a four years field experiment in Tuscany. Agriculture, Ecosystems & Environment, 201, 20-25.
Gerlach H, Schmidt HP (2012) "Biochar in poultry farming" Ithaka Journal 1/2012: 262–264 Gerlach, H., Gerlach, A., Schrödl, W., Schottdorf, B., Haufe, S., Helm, H., ... & Krüger, M.
(2014). Oral application of charcoal and humic acids to dairy cows influences Clostridium botulinum blood serum antibody level and glyphosate excretion in urine. J Clin Toxicol, 4(186), 2161-0495.
49
Gerlach, Henning, and Hans-Peter Schmidt. “Biochar in Poulty Farming.” Ithaka Journal 2012 (2012): 262–64.
Gibbs, H. K., & Salmon, J. M. (2015). Mapping the world's degraded lands. Applied geography, 57, 12-21.
Grandview Research (2017) “Biochar Market Size Worth $3.14 Billion by 2025 | Growth Rate: 13.1%.” https://www.grandviewresearch.com/press-release/global-biochar-market.
Gruver, J. B. (2013) Prediction, Prevention and Remediation of Soil Degradation by Water Erosion. Nature Education Knowledge 4(12):2
Guo, J (2015, April 3) “Agriculture is 80 percent of water use in California. Why aren’t farmers being forced to cut back?” The Washington Post
Hagemann, N., Spokas, K., Schmidt, H. P., Kägi, R., Böhler, M. A., & Bucheli, T. D. (2018). Activated Carbon, Biochar and Charcoal: Linkages and Synergies across Pyrogenic Carbon’s ABCs. Water, 10(2), 182.
IndexMundi (2018, April) “Zinc Monthly Price” https://www.indexmundi.com/commodities/?commodity=zinc
Jirka, S., & Tomlinson, T. (2014). 2013 State of the Biochar Industry. Johnson, Renée, and Betsy A. Cody. "California Agricultural Production and Irrigated Water
Use." Congressional Research Service: Washington, DC, USA (2015). Jones, C., & Jacobsen, J. (2009). Micronutrients: cycling, testing and fertilizer
recommendations. Nutr. Manage. Module, 7, 2-4. Kana, J. R., Teguia, A., Mungfu, B. M., & Tchoumboue, J. (2011). Growth performance and
carcass characteristics of broiler chickens fed diets supplemented with graded levels of charcoal from maize cob or seed of Canarium schweinfurthii Engl. Tropical animal health and production, 43(1), 51-56.
Kawano, Y, Yanai, J, Yamada, H, Nakajima, K, Yasui, D, & Takebe, K. (2012). Physicochemical properties of carbonized sewage sludge and effects on plant growth, Japanese Journal of Soil Science and Plant Nutrition, (in Japanese), 83, 125-132.
Kulyk, N. (2012). Cost-benefit analysis of the biochar application in the US cereal crop cultivation. Center for Public Policy Administration Capstones, Paper, 12.
Laird, D. A., Fleming, P., Davis, D. D., Horton, R., Wang, B., & Karlen, D. L. (2010). Impact of biochar amendments on the quality of a typical Midwestern agricultural soil. Geoderma, 158(3-4), 443-449.
Latawiec, Agnieszka E., et al. "Willingness to Adopt Biochar in Agriculture: The Producer’s Perspective." Sustainability 9.4 (2017): 655.
Lehmann, Johannes, and Stephen Joseph. Biochar for Environmental Management: Science, Technology and Implementation. Routledge, 2015.
Leytem, A. B., Bjorneberg, D. L., Koehn, A. C., Moraes, L. E., Kebreab, E., & Dungan, R. S. (2017). Methane emissions from dairy lagoons in the western United States. Journal of dairy science, 100(8), 6785-6803.
Maupin, M. A., Kenny, J. F., Hutson, S. S., Lovelace, J. K., Barber, N. L., & Linsey, K. S. (2014). Estimated use of water in the United States in 2010 (No. 1405). US Geological Survey.
Melillo, J. M. (2014). Climate change impacts in the United States: the third national climate assessment. Government Printing Office.

50
Mui, N. T., & Ledin, I. (2006). Effect of method of processing foliage of Acacia mangium and inclusion of bamboo charcoal in the diet on performance of growing goats. Animal Feed Science and Technology, 130(3-4), 242-256.
NYU (2018, January) “Cost of Capital by Sector” http://people.stern.nyu.edu/adamodar/New_Home_Page/datafile/wacc.htm
Oenema, O., Wrage, N., Velthof, G. L., van Groenigen, J. W., Dolfing, J., & Kuikman, P. J. (2005). Trends in global nitrous oxide emissions from animal production systems. Nutrient Cycling in Agroecosystems, 72(1), 51-65.
Perry, A. (2011) “Carefully unraveling the intricacies of biochar” Agricultural Research, 59(10), 4.
PG&E (2016) Electric Schedule E-BIOMAT, Bioenergy Market Adjusting Tarrif https://www.pge.com/tariffs/tm2/pdf/ELEC_SCHEDS_E-BioMAT.pdf
Rawls, W. J., Pachepsky, Y. A., Ritchie, J. C., Sobecki, T. M., & Bloodworth, H. (2003). Effect of soil organic carbon on soil water retention. Geoderma, 116(1-2), 61-76.
Research and Markets (2017) Global and China Activated Carbon Industry Report, 2017-2021 https://www.researchandmarkets.com/research/vcglxp/global_and_china
Sohi, S. P., Krull, E., Lopez-Capel, E., & Bol, R. (2010). A review of biochar and its use and function in soil. In Advances in agronomy (Vol. 105, pp. 47-82). Academic Press.
Steiner, C., Das, K. C., Melear, N., & Lakly, D. (2010). Reducing nitrogen loss during poultry litter composting using biochar. Journal of environmental quality, 39(4), 1236-1242.
TFI (2016, May) “Fertilizer State of the Industry Report, 2015” The Fertilizer Institute https://www.tfi.org/sites/default/files/State_of_the_Industry_(ind._pages)_-_may_16_-_km_.pdf
Transparency Market Research (2017) Biochar Market (Feedstock - Woody Biomass, Agricultural Waste, and Animal Manure; Application - Electricity Generation, Agriculture, and Forestry) - Global Industry Analysis, Size, Share, Growth, Trends, and Forecast 2017 – 2025 https://www.transparencymarketresearch.com/report-toc/2863
Tsai, W. T., Liu, S. C., Chen, H. R., Chang, Y. M., & Tsai, Y. L. (2012). Textural and chemical properties of swine-manure-derived biochar pertinent to its potential use as a soil amendment. Chemosphere, 89(2), 198-203.
USDA (2016) “Cash Receipts by State, California” https://data.ers.usda.gov/reports.aspx?ID=17843#P8f4f843e248441289b0d569ac196a1fd_2_17iT0R0x5
USDA (2016) “Greenhouse Gas Inventory 1990-2013” Technical Bulletin Number 1943 Wallander, S., Marshall, E., & Aillery, M. (2017). Farmers Employ Strategies To Reduce Risk of
Drought Damages. Amber Waves. Wallander, Steve, et al. "The role of conservation programs in drought risk adaptation." (2013). Wallander, Steven. "California's Irrigation Varies by Crop." Amber Waves (2015): 1. WRI (2017) “Source of Eutrophication” http://www.wri.org/our-work/project/eutrophication-
and-hypoxia/sources-eutrophication Xu, X., Cao, X., Zhao, L., Wang, H., Yu, H., & Gao, B. (2013). Removal of Cu, Zn, and Cd
from aqueous solutions by the dairy manure-derived biochar. Environmental Science and Pollution Research, 20(1), 358-368.