press release “communications usage trend survey” in 2019
TRANSCRIPT

PRESS RELEASE
May 29, 2020
“Communications Usage Trend Survey” in 2019 Compiled
The Ministry of Internal Affairs and Communications (MIC, Japan) has compiled its
Communications Usage Trend Survey, a survey of the communication services usage by
households and businesses at the end of September 2019.
For the highlights and an outline of the survey, please see Attachment 1 and Attachment
2, respectively.
Details of the survey will be posted on the website for the MIC’s Information &
Communications Statistics Database and e-Stat, and released in a machine-readable data
format (CSV format).
(URL: https://www.soumu.go.jp/johotsusintokei/statistics/statistics05.html)
[Highlights of the Survey]
1 The internet user share rises to 89.8% close to 90%. Particularly, the share increases by more
than 10 percentage points for those aged between 6 and 12, and 60 or more.
2 The smartphone ownership rate among households continues increasing, topping 80% for the first
time. The rate among individuals continues an uptrend, reaching 67.6%.
3 The share for businesses having introduced cloud computing services exceeds 60% for the first
time. Outsourcing of assets and maintenance arrangements and other effects are recognized as
advantages of cloud services. Businesses seeing cloud services as effective or effective to some
extent account for 85.5% of those having introduced such services.
4 About 30% of businesses covered by the survey have introduced or are planning to introduce
telework, posting an uptrend. “Information and communications” and “financial and insurance”
industries post higher telework introduction rates than other industries.
(The survey took place in late September 2019 before the COVID-19 pandemic.)
[Survey Outline] MIC has conducted the Communications Usage Trend Survey annually since 1990, targeting
households (households and household members) and businesses, as a general statistics survey in
accordance with the Statistics Act (Act No. 53 of 2007). (Business surveys have been conducted
each year since 1993, except for 1994. Surveys of household members started in 2001.) MIC also
has conducted the household survey by prefecture since 2010.
Households Businesses
Survey period December 2019
Survey area Nationwide
Scope of attributes /
Level of survey
Households headed by someone aged
20 or older (as of April 1, 2019) and
household members aged 6 or older
Businesses with 100 or more regular
employees in industries other than
public affairs
Sample size
[Effective mails]
40,592 households
[38,737 households]
5,930 businesses
[4,587 businesses]

Effective responses
[%]
15,410 households (39,658 persons)
[39.8%]
2,122 businesses
[46.3%]
Survey items Communication services usage, communication-device ownership, etc.
Survey method Survey form sent and collected by postal mail or online (email)
Contact information Economic Research Office, Information and Communications Bureau, MIC Tel.: +81-3-5253-5744

Highlights of the Communications Usage Trend Survey in 2019
Attachment 1
Released May 29, 2020

The internet user share rises to 89.8% close to 90%. Particularly, the share increases by more than 10 percentage points for those aged between 6 and 12, and 60 or more.
The smartphone ownership rate among households continues increasing, topping 80% for the first time. The rate among individuals continues an uptrend, reaching 67.6%.
The share for businesses having introduced cloud computing services exceeds 60% for the first time. Outsourcing of assets and maintenance arrangements and other effects are recognized as advantages of cloud services. Businesses seeing cloud services as effective or effective to some extent account for 85.5% of those having introduced such services.
About 30% of businesses covered by the survey have introduced or are planning to introduce telework, posting an uptrend. “Information and communications” and “financial and insurance” industries post higher telework introduction rates than other industries.(The survey took place in late September 2019 before the COVID-19 pandemic.)
Highlights of the Survey
<Note> * The survey took place in late September 2019.* The 2016-2018 surveys used simple and detailed questionnaires to cover households and their members.* Graphs with titles including (businesses) are based on the survey of businesses and colored orange.
Those with titles including (households) are based on the survey of households, and including (individuals) are based on the survey of household members. Both (households) and (individuals) are colored blue.
* Non-responses were excluded except in the graphs of “Ownership of common communication devices (households)” in Page 3 and “Introduction of telework” in Page 7.
1

2
35.0
76.7
87.9
87.7
83.5
79.3
55.6
27.2
7.8
4.9
6.4
9.1
11.4
9.9
11.7
12.4
14.3
8.8
23.6
42.3
66.0
68.9
64.8
63.9
49.0
31.4
11.3
36.6
28.8
26.3
33.2
30.0
26.2
17.1
8.3
3.3
0% 20% 40% 60% 80% 100%
6-12
13-19
20-29
30-39
40-49
50-59
60-69
70-79
80 and older
Smartphones
Mobile phones and PHS handsets(exclude smartphones)
Computers
Tablets
63.3
50.4
23.2
13.5
12.0
10.5
59.5
48.2
20.8
6.5
9.7
8.8
0% 20% 40% 60%
Smartphones
Computers
Tablets
Internet-enabled TV receivers
Home game consoles
Mobile phones and PHS handsets(exclude smartphones)
2019 (n=37,182)
2018 (n=40,664)
79.8
67.1
96.6 98.7 97.9 96.793.0
76.6
51.0
21.5
89.8
80.2
98.4 99.1 99.0 98.3 97.7
90.5
74.2
57.5
0%
20%
40%
60%
80%
100%
All 6 andolder
6-12 13-19 20-29 30-39 40-49 50-59 60-69 70-79 80 and older
2018 (n=40,664)2019 (n=37,182)
1. Internet Usage TrendsThe internet user share rises close to 90%. Particularly, internet usage is increasing among people aged between 6 and 12, and 60 or more.Smartphones are used more frequently than computers for internet access.
Internet usage (individuals)
Usage of internet access devices (individuals)
Usage of internet access devices by age group (individuals)
(Note) Only major devices are covered.
81.4
53.1
35.1
83.6
56.8
33.6
84.0
60.9
29.3
84.0
64.7
26.3
81.1
67.6
24.1
0%
20%
40%
60%
80%
100%
Mobile devices (overall)(Mobile phone, PHS and/or
smartphone)
Smartphones Mobile phones and PHShandsets
(exclude smartphones)
2015(n=36,402)
2016(n=44,430)
2017(n=41,752)
2018(n=42,744)
2019(n=39,658)
Ownership of common communication devices (households) (2010-2019)
Note: Each figure is the percentage of all households in each year’s survey that own the respective communication device.
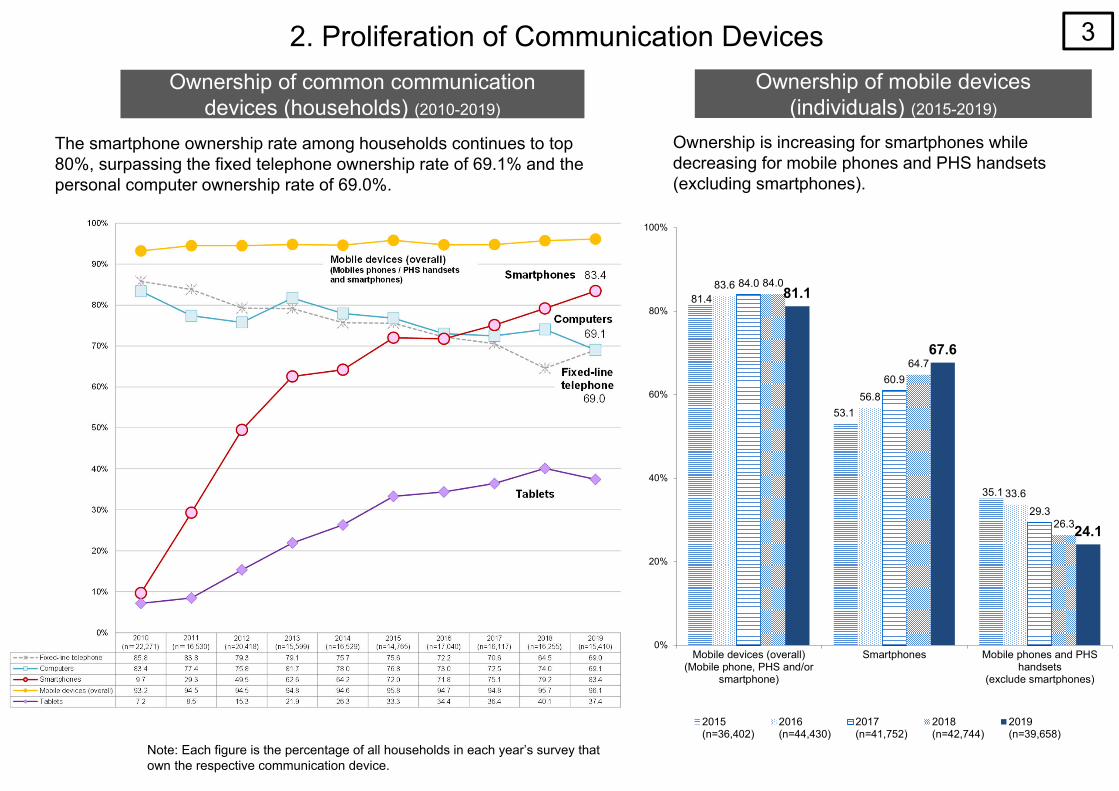
2. Proliferation of Communication Devices
The smartphone ownership rate among households continues to top 80%, surpassing the fixed telephone ownership rate of 69.1% and the personal computer ownership rate of 69.0%.
3
Ownership of mobile devices (individuals) (2015-2019)
Ownership is increasing for smartphones while decreasing for mobile phones and PHS handsets (excluding smartphones).

4
86.9
63.6
36.7
24.8
14.9
12.6
6.0
3.0
87.4
57.4
35.3
20.2
22.0
10.7
6.0
3.3
0% 20% 40% 60% 80% 100%
To communicate with current friends
To find information on topics of interest
To kill time
To gather or provide information duringemergencies or disasters
To expand exchanges
To announce my own informationor creative work
To find old friends
Other
2019 (n=16,676)
2018 (n=2,485)
69.060.0
24.123.2
80.575.0
87.178.5
83.074.8
78.470.6
70.459.8
51.738.6
40.723.6
42.816.9
0% 20% 40% 60% 80%
(n=26,757)
(n=28,875)
(n=1,364)
(n=1,428)
(n=1,936)
(n=2,294)
(n=2,654)
(n=3,199)
(n=3,616)
(n=4,174)
(n=4,750)
(n=5,089)
(n=4,873)
(n=5,268)
(n=4,756)
(n=4,978)
(n=2,395)
(n=2,090)
(n=413)
(n=355)
Total
6-12
13-19
30-39
40-49
60-69
70-79
80 and older
■■: 2019■■: 2018
20-29
50-59
3. Social Networking Service Usage Trends (individuals)The share for individuals using social networking services rises by 9 percentage points. The share increases for those using SNS “to find information on topics of interest.”
Purposes of social networking service usage (individuals)
Social networking service usage (individuals)
Responses from social networking service users
(Note 1)This item was covered only by the detailed questionnaire in the 2018 survey. (Note 2)“To find people who share the same interests or tastes or people with the same concerns or problems, or to broaden social relationships” in the 2018 survey
(Note 1)
(Note 2)

45.9
43.3
36.8
32.6
25.9
24.8
18.6
18.4
41.6
29.6
16.4
33.8
31.9
24.6
21.6
19.5
0% 20% 40%
No need to have internal asset and storage systems
The same services are available irrespective oflocation or equipment
Improve operational stability and availability
Useful as a backup in a time of disaster
Reliability is higher (information leakagecountermeasures, etc.)
Quick response capability, such as upgradingsystem capacity
Costs are lower than existing systems
Easy system scalability
2019 (n=1,375)2018 (n=1,312)
Very beneficial33.6%
Somewhat beneficial51.9%
Not very beneficial0.2%
Negative impact0.4%
Do not know the impact13.9%
2019 (n=1,319)
56.0
48.0
43.0
37.3
35.7
31.4
18.4
15.4
12.5
11.4
11.2
10.2
53.1
52.2
40.5
38.4
31.9
29.3
16.7
12.6
14.3
9.2
7.0
9.0
0% 10% 20% 30% 40% 50% 60%
File storage / data sharing
Information sharing / portal
Schedule sharing
Payroll, financial accounting, HR
Data backups
Sales support
Sharing information with
business partners
e-learning
System development and
Website construction
Order taking and sales
Production management, distribution
management, store management
2019 (n=1,445)
2018 (n=1,312)
4. Cloud Service Usage (businesses) 5
Cloud service usage
The share for businesses having introduced cloud computing services continues an uptrend, exceeding 60% for the first time.Purposes for using cloud services include “file storage/data sharing” and “email.” The most frequently cited reason for using cloud services is that “there is no need for owning proprietary assets or maintenance arrangements.”The share for businesses viewing cloud services as “very beneficial” or “somewhat beneficial” among cloud service-using businesses exceeds 80%.
Responses from cloud service users
Purposes for using cloud services
Impact of cloud computing services
Responses from cloud service users
Very beneficial and somewhat beneficial85.5%
Reasons for using cloud servicesResponses from cloud service users
2019 (n=1,375)2018 (n=1,312)

4.34.4
11.212.6
21.021.0
24.628.2
30.4
0% 20%
Cellular modules for automobiles
Electronic tags (RFID tags)
Smart meters, energy management systems
Industrial robots
Non-contact IC cards
OCR
Sensors
Physical security devices
Surveillance cameras
2019(n=291)
8.4
13.9
15.9
25.0
34.0
83.5
0% 20% 40% 60% 80% 100%
Others
Business continuity
New business projects/management
Overall optimization of businessoperations
Improvement of customer services
Improvement of businessefficiency/operations
2019 (n=291)
Have introduced
14.1%Have not
introduced but are planning to introduce
9.8%
Have not introduced65.4%
Don’t know10.7%
2019 (n=2,111)
5. Collection/utilization of digital data with IoT/AI systems (businesses)
Introduction of IoT/AI systems/services
6
More than 20% of businesses have introduced or are planning to introduce IoT and AI systems or services to collect and analyze digital data.
Devices for introduced systems or services
Effects of IoT /AI system/service introduction
The most frequently cited responses among components of IoT and AI systems or services that have been introduced are “surveillance cameras” (30.4%), followed by “Physical security devices” (28.2%).
Percentage shares for businesses thathave introduced IoT/AI system /services
Purposes of IoT/AI digital data collection and analysis
Have introduced or are planning to introduce23.9%
Percentage shares for businesses that have introduced IoT/AI system /services
Very or somewhat effective
79.8%
Percentage shares for businesses that have introduced IoT/AI system /services

18.2
15.1
26.0
48.5
21.7
56.1
18.5
26.0
27.9
46.8
46.9
68.3
0% 20% 40% 60% 80%
Secure employment, prevent personnel losses
Prepare for business continuity in the event ofemergencies (earthquakes, typhoon, heavy snow,
super-flu outbreaks, etc.)
Meet needs of employees including persons withdisabilities, elderly persons and those engaging in
nursing care or childcare
Shorten workers’ traveling time and avoid congestion
Improve workers’ work-life balance
Raise efficiency (productivity) of business processes
2019 (n=480)
2018 (n=427)
20.219.1
22.518.8
21.120.8
11.78.7
20.120.1
40.737.9
25.416.9
46.539.9
16.516.2
0% 20% 40%
(n=2,118)(n=2,106)
(n=303)(n=299)
(n=359)(n=371)
(n=339)(n=316)
(n=305)(n=292)
(n=141)(n=133)
(n=132)(n=130)
(n=252)(n=243)
(n=287)(n=322)
■: 2019■: 2018Construction
Manufacturing
Transport / mailing
Wholesale / retail
Financial / insurance
Real estate
Information and communications
Service and other industries
Total
63.2
50.4
16.4
63.5
37.6
11.1
56.4
29.9
12.1
0% 20% 40% 60%
Mobile work
Working from home
Satellite office work
2019 (n=480)2018 (n=427)2017 (n=440)
6. Introduction of Telework (businesses)
Introduction of telework
7
Introduction of telework by industry
About 30% of businesses covered by the survey have introduced or are planning to introduce telework, posting an uptrend.
“Information and communications” and “financial and insurance” industries post higher telework introduction rates than other industries.
Frequently cited purposes of telework introduction include “raising the efficiency (productivity) of business processes,” “improving workers’ work-life balance” and “reducing workers’ travel times.”
Note: as a percentage of businesses which have introduced telework
Type of telework introduced The share is rising for businesses introducing a system for working from home
Purposes of introducing telework
The survey took place in late September 2019 (before the COVID-19 pandemic).
Note: as a percentage of businesses which have introduced telework

65.7
68.0
71.7
78.8
81.0
83.4
81.7
74.5
55.5
63.3
69.2
75.0
75.9
77.3
74.3
59.4
0% 20% 40% 60% 80%
13-19
20-29
30-39
40-49
50-59
60-69
70-79
80 and older
2019(n=29,851)
2018(n=4,435)
88.4
62.6
51.9
46.8
44.1
43.3
20.9
13.0
12.1
2.4
84.6
65.7
48.3
47.9
43.3
37.8
21.1
11.6
11.2
2.3
0% 20% 40% 60% 80%
Leak of personal information andInternet use history
Computer virus infections
Concern about fraudulent email or fraudusing the Internet
Spam
Security measures
Concern about the reliability of electronicpayment means
Viewing of illegal and harmful information
Concern about trouble with communication onsocial media, etc.
Internet addict
Other
2019 (n=22,164)
2018 (n=3,091)
7. Concerns about Using the Internet (individuals)
Concerns about using the internet
8
75% of internet users feel insecure during internet use, rising by 4.3 points from the previous survey.The share for internet users feeling insecure during internet use is high among those aged 40 or more.
The percentage is as high as 88.4% for “leak of personal information and internet use history” among types of concerns about using the internet. Particularly, the percentage for “concern about the reliability of electronic payment means” posts a rise of 5.5 points to 43.3%.
Types of concerns about using the internet
Note: Percentage of internet users who “feel concerned” and “feel rather concerned”The target age group of 13-19 years old was 12-19 years old in the 2018 survey.
This item was covered only by the detailed questionnaire in the 2018 survey.
Responses from individuals who have used the internet and have concerns about using the internet

1
Released May 29, 2020
Attachment 2
Table of Contents
1. Proliferation of the Internet and Other Networks .......................................................... 2 (1) Internet usage (individuals) ............................................................................................................... 2 (2) Internet usage by device (individuals) ............................................................................................. 3 (3) Internet usage by prefecture and region (individuals) ................................................................... 4 (4) Types of internet connections (businesses) ................................................................................... 5 (5) Types of internet connections (households) ................................................................................... 6 (6) Ownership of communication devices (households) ..................................................................... 6 (7) Ownership of mobile devices (individuals) ..................................................................................... 7 (8) Internet connection through TV, etc. (households) ........................................................................ 8
2. Current ICT Usage by Individuals ................................................................................ 9 (1) Purposes of using the internet (individuals) ................................................................................... 9 (2) Social networking service usage (individuals) .............................................................................. 10
3. Current ICT Usage by Businesses ............................................................................. 12 (1) Cloud computing service usage (businesses) .............................................................................. 12 (2) Introduction of IoT/AI systems/services (businesses) ................................................................. 16
4. Introduction and Implementation of Telework............................................................. 18 (1) Introduction of telework (businesses) ........................................................................................... 18 (2) Engagement in telework (individuals) ............................................................................................ 22
5. Safety and Security Efforts ......................................................................................... 24 (1) State of security measures (households) ...................................................................................... 24 (2) Concerns about using the internet (individuals) ........................................................................... 25 (3) Security breaches against information-communication networks and security measures implemented (businesses) .................................................................................................................... 27
Summary Findings of the 2019 Communications Usage Trend Survey
<Notes> ・Data in this document exclude non-respondents in the survey (unless otherwise specified). ・The 2016-2018 surveys used simple and detailed questionnaires to cover households and their members.

2
平成 30 年(n=40,664)
1. Proliferation of the Internet and Other Networks
(1) Internet usage (individuals)
The internet user share is rising. Particularly, internet usage is increasing among people aged between 6 and 12, and 60 or more.
Figure 1-1: Transitions in internet usage
Figure 1-2: Transitions in internet usage by age group
46.3%
57.8%
64.3% 66.0%70.8% 72.6% 73.0%
75.3%78.0% 78.2% 79.1% 79.5%
82.8%82.8% 83.0% 83.5%
80.9% 79.8%
89.8%
0%
20%
40%
60%
80%
100%
2001 2002 2003 2004 2005 2006 2007 2008 2009 2010 2011 2012 2013 2014 2015 2016 2017 2018 2019
2019(n=37,182)
6-12 13-19 20-29 30-39 40-49 50-59 60-69 70-79 80 and older2015 (n=33,525) 74.8 98.2 99.0 97.8 96.5 91.4 76.6 53.5 20.22016 (n=40,297) 82.6 98.4 99.2 97.5 96.7 93.0 75.7 53.6 23.42017 (n=38,630) 73.6 96.9 98.7 97.8 96.8 92.4 73.9 46.7 20.12018 (n=40,664) 67.1 96.6 98.7 97.9 96.7 93.0 76.6 51.0 21.52019 (n=37,182) 80.2 98.4 99.1 99.0 98.3 97.7 90.5 74.2 57.5
0%
20%
40%
60%
80%
100%

3
Figure 1-3: Internet usage by age and gender (2019)
Figure 1-4: Internet usage by annual household income
(2) Internet usage by device (individuals) The internet usage by device indicates that the percentage of those using smartphones for
internet access is 12.9 points higher than that of those using computer. By age group, the smartphone usage rate is higher than 70% in the age groups between 13 and 59 years old.
Figure 1-5: Internet usage by device
Figure 1-6: Use of internet devices by age group
92.4
79.2
98.3 99.0 99.1 98.2 97.993.0
81.0
66.9
87.381.1
98.5 99.2 99.0 98.5 97.588.1
68.3
52.3
0%
20%
40%
60%
80%
100%
All 6 and older 6-12 13-19 20-29 30-39 40-49 50-59 60-69 70-79 80 and older
Male (n=18,024)Female (n=19,158)
54.4
70.6
83.987.8 89.7 90.3
80.786.5 90.8 92.7 93.4 94.5
0%
20%
40%
60%
80%
100%
Less than ¥2 million ¥2 million to less than¥4 million
¥4 million to less than¥6 million
¥6 million to less than¥8 million
¥8 million to less than¥10 million
¥10 million and over
2018 (n=40,664) 2019 (n=37,182)
63.3
50.4
23.2
13.5
12.0
10.5
0.8
59.5
48.2
20.8
6.5
9.7
8.8
1.4
0% 20% 40% 60%
Smartphones
Computers
Tablets
Internet-enabled TV receivers
Home game consoles
Mobile phones and PHShandsets
(exclude smartphones)
Other
2019(n=37,182)
2018(n=40,664)
35.0
76.7
87.9
87.7
83.5
79.3
55.6
27.2
7.8
4.9
6.4
9.1
11.4
9.9
11.7
12.4
14.3
8.8
23.6
42.3
66.0
68.9
64.8
63.9
49.0
31.4
11.3
36.6
28.8
26.3
33.2
30.0
26.2
17.1
8.3
3.3
0% 20% 40% 60% 80% 100%
6-12
13-19
20-29
30-39
40-49
50-59
60-69
70-79
80 and older
Smartphones
Mobile phones and PHS handsets(exclude smartphones)Computers
Tablets
(Note) Only major devices are covered.

4
(3) Internet usage by prefecture and region (individuals)
Figure 1-7: Internet usage by prefecture and device (2019)
(%)
Computers Mobile phones(incl. PHS) Smartphones Tablets
Hokkaido (661) 88.4 48.8 10.2 61.1 20.4
Aomori (778) 80.0 37.0 8.2 45.5 17.0
Iwate (803) 85.9 32.2 7.0 52.1 15.1
Miyagi (769) 86.2 38.4 9.8 54.7 15.9
Akita (933) 82.8 39.5 8.8 47.7 17.7
Yamagata (1,068) 81.0 39.6 11.0 52.7 13.7
Fukushima (900) 81.8 40.3 11.2 54.4 14.2
Ibaraki (696) 91.6 49.4 11.0 60.7 22.3
Tochigi (849) 87.7 47.3 10.9 58.9 23.7
Gunma (850) 90.8 49.4 12.3 62.7 20.5
Saitama (691) 90.8 54.9 9.8 71.4 25.8
Chiba (727) 91.5 59.3 10.9 68.3 24.6
Tokyo (622) 95.7 65.1 10.4 74.5 33.2
Kanagawa (627) 92.7 56.7 9.7 68.7 28.2
Niigata (935) 84.0 40.6 8.9 52.5 14.8
Toyama (1,111) 87.0 48.8 10.6 59.0 19.5
Ishikawa (1,105) 88.3 46.6 9.8 57.1 17.8
Fukui (891) 88.7 44.4 9.0 58.8 19.4
Yamanashi (906) 87.7 41.2 7.7 59.2 18.7
Nagano (945) 87.2 44.1 9.3 55.6 17.3
Gifu (959) 85.3 43.6 10.8 57.9 18.4
Shizuoka (1,047) 87.4 47.7 9.9 58.2 18.7
Aichi (651) 91.3 51.5 12.3 64.6 21.1
Mie (794) 89.7 43.0 7.8 62.7 21.7
Shiga (747) 90.8 51.4 13.1 66.9 21.8
Kyoto (733) 91.7 57.2 11.7 68.3 25.7
Osaka (669) 93.3 54.2 15.0 66.7 28.1
Hyogo (793) 88.8 49.1 10.6 59.5 19.3
Nara (760) 89.3 54.7 12.2 65.3 19.1
Wakayama (664) 87.6 48.2 10.0 56.7 19.1
Tottori (860) 86.1 46.2 9.0 59.7 20.2
Shimane (1,049) 84.9 42.5 8.3 54.4 20.5
Okayama (816) 90.6 45.4 9.2 58.0 21.9
Hiroshima (820) 87.8 46.2 11.9 59.6 22.7
Yamaguchi (767) 84.9 36.6 8.8 54.1 14.3
Tokushima (698) 87.1 43.5 9.9 56.4 17.6
Kagawa (926) 88.3 48.3 11.5 60.5 19.2
Ehime (696) 84.9 37.5 8.2 58.4 16.3
Kochi (627) 85.6 41.9 9.0 51.7 17.4
Fukuoka (572) 88.4 49.0 7.9 65.6 25.0
Saga (931) 84.6 39.1 10.3 52.1 18.0
Nagasaki (706) 84.7 34.4 10.3 51.8 17.4
Kumamoto (744) 87.7 40.3 9.1 54.9 19.0
Oita (659) 89.0 42.6 10.1 61.4 23.9
Miyazaki (616) 85.4 32.8 8.1 53.4 14.9
Kagoshima (587) 85.1 34.9 7.4 53.8 19.1
Okinawa (424) 90.1 43.9 8.0 66.4 27.1
Total (37,182) 89.8 50.4 10.5 63.3 23.2
Prefecture (n)
Percentage of internet users
Total
The internet usage by prefecture indicates that Tokyo posts the highest internet usage rate,
followed by Osaka and Kanagawa in that order (see the colored parts in Figure 1-7). By region, the internet usage rate in southern Kanto, Kinki and northern Kanto is higher
than the national average rate.

5
Figure 1-8: Internet and smartphone usage by region (2019)
(4) Types of internet connections (businesses)
Of the surveyed businesses, 96.8% use a broadband connection to access the internet
from their premises. Of businesses using a broadband connection, 86.9% use an optical
fiber connection. Figure 1-9: Internet connection types (multiple responses accepted)
89.8 88.4
83.3
90.293.2
85.987.9 89.3
91.387.6 86.3 87.4
63.361.1
51.9
60.8
71.4
54.858.2
61.964.5
57.7 57.359.7
40%
60%
80%
100%
(n=37,182) (n=661) (n=5,251) (n=2,395) (n=2,667) (n=2,786) (n=3,107) (n=3,451) (n=4,366) (n=4,312) (n=2,947) (n=5,239)
Total Hokkaido Tohoku NorthernKanto
SouthernKanto
Hokuriku Koshinetsu Tokai Kinki Chugoku Shikoku Kyushu andOkinawa
Used the internet Used a smartphone
95.8
86.9
12.7
4.7
3.4
1.2
0.8
1.5
13.3
9.8
5.2
96.8
87.9
13.6
4.8
3.2
2.3
1.2
1.6
13.5
10.2
5.3
0% 20% 40% 60% 80% 100%
Broadband
Optical fiber(FTTH)
Leased line
DSL
Cable TV(CATV)
BWA access service
Fixed wireless access(FWA)
Other
Narrowband
ISDN
Telephone(dial-up)
2019 (n=2,090)
2018 (n=2,074)
Note: as a percentage of businesses using the Internet

6
(5) Types of internet connections (households) Of households using a broadband connection to access the internet from computers,
tablets and other devices at home, 89.0% use a broadband connection. Figure 1-10: Types of internet connections for computers at home and other devices (multiple responses)
(6) Ownership of communication devices (households)
Ownership rises to 83.4% for smartphones among communication devices.
Figure 1-11: Transitions in ownership of communication devices
89.0
54.5
50.8
16.4
3.2
1.9
6.8
5.8
1.2
97.4
63.4
51.3
17.3
4.6
1.7
3.4
2.1
1.5
0% 20% 40% 60% 80% 100%
Broadband
Optical fiber(FTTH)
Mobile phone
Cable TV(CATV)
DSL
Fixed wireless access(FWA)
Narrowband
Telephone(dial-up)
ISDN
2019 (n=12,963)
2018 (n=10,545)
Notes: 1. “Mobile devices (overall)” include mobile phones and PHS handsets. This category also included personal digital assistants (PDAs) from 2009 to 2012 and smartphones from 2010.
(注 2. For comparison purposes between years, these calculations do include non-responses.
Note: as a percentage of households accessing the Internet from computers at home and other devices.

7
(7) Ownership of mobile devices (individuals)
Regarding the ownership of mobile devices by individuals, the ownership rate for
“smartphones” is 67.6%, 43.5 points higher than the ownership rate for “mobile phones/PHS
handsets” (24.1%). By age group, the ownership rate for “smartphones” is higher than the ownership rate for
“mobile phones/PHS handsets” in the age groups between 6 and 69 years old. Figure 1-12: Transitions in ownership of mobile devices
Figure 1-13: Ownership of mobile devices by age group (2019)
81.4
53.1
35.1
83.6
56.8
33.6
84.0
60.9
29.3
84.0
64.7
26.3
81.1
67.6
24.1
0%
20%
40%
60%
80%
100%
Mobile devices (overall)(Mobile phone, PHS and/or smartphone)
Smartphones Mobile phones and PHS handsets(exclude smartphones)
2015(n=36,402)
2016(n=44,430)
2017(n=41,752)
2018(n=42,744)
2019(n=39,658)
Total(n=39,658)
6-12(n=2,145)
13-19(n=2,291)
20-29(n=3,028)
30-39(n=4,067)
40-49(n=5,440)
50-59(n=5,672)
60-69(n=7,192)
70-79(n=6,299)
80 and older(n=3,524)
Mobile devices(overall)(Mobile phone,
PHS and/or smartphone)81.1 47.2 86.2 94.6 93.9 93.3 94.5 86.9 67.6 40.3
Smartphones 67.6 37.2 83.8 93.3 90.6 88.0 85.6 64.7 33.8 11.0Mobile phones and PHS
handsets(exclude smartphones)
24.1 18.2 12.6 13.2 18.7 19.2 22.0 32.1 40.3 31.9
Not owning 6.8 32.0 7.6 0.7 0.7 1.2 1.4 3.6 8.8 23.7
0%
20%
40%
60%
80%
100%

8
(8) Internet connection through TV, etc. (households)
Figure 1-14 Internet connection through TV, etc. (multiple responses accepted) (2019)
70.3
45.5
21.8
15.4
24.0
17.5
19.7
18.6
0% 20% 40% 60% 80%
(n=13,868)
(n=2,032)
(n=10,008)
(n=1,560)
(n=7,577)
(n=1,176)
(n=6,205)
(n=1,002)
■■: 2019■■: 2018
Connection through TV
Connection through DVD/Blu-ray disc recorders
Connection through cable tuners
Connection through IPTV tuners (Note) This item was covered only by the detailed
questionnaire in the 2018 survey.
Of households using an internet connection through a TV, etc., those using a connection through a TV account for the highest share at 70.3%, followed by 24.0% for those using a connection through cable TV.
Responses from households owning TVs, etc.

9
2. Current ICT Usage by Individuals (1) Purposes of using the internet (individuals)
The most common usage of the internet is “sending and receiving email,” at 76.8%. This is
followed by “information search” (75.6%) and “using social networking services” (69.0%).
By age group, “sending and receiving email” and “information search” are common usages
across all age groups, while there is wide difference across age groups with respect to such
purposes as “using video posting/sharing sites.”
Figure 2-1: Purposes of using the internet (multiple responses accepted)
Responses from Internet users

10
Figure 2-2: Purposes of using the internet by age group (multiple responses accepted) (2019)
(2) Social networking service usage (individuals)
Figure 2-3: Social networking service usage
69.060.0
24.123.2
80.575.0
87.178.5
83.074.8
78.470.6
70.459.8
51.738.6
40.723.6
42.816.9
0% 20% 40% 60% 80%
(n=26,757)(n=28,875)
(n=1,364)(n=1,428)
(n=1,936)(n=2,294)
(n=2,654)(n=3,199)
(n=3,616)(n=4,174)
(n=4,750)(n=5,089)
(n=4,873)(n=5,268)
(n=4,756)(n=4,978)
(n=2,395)(n=2,090)
(n=413)(n=355)
Total
6-12
13-19
30-39
40-49
60-69
70-79
80 and older
■: 2019■: 2018
20-29
50-59
Of internet users, 69.0% use social networking services, up 0.9 points from the previous year. Among purposes of SNS usage, “to communicate with current friends” (86.9%) is the most
frequently cited. The percentage of “to find information on topics of interest” stands at 63.6%,
up 6.2 points from the previous survey.
Note: as a percentage of Internet users

11
Figure 2-4: Purposes of social networking service usage (multiple responses accepted)
86.9
63.6
36.7
24.8
14.9
12.6
6.0
3.0
87.4
57.4
35.3
20.2
22.0
10.7
6.0
3.3
0% 20% 40% 60% 80% 100%
To communicate with current friends
To find information on topics of interest
To kill time
To gather or provide information duringemergencies or disasters
To expand exchanges
To announce my own informationor creative work
To find old friends
Other
2019 (n=16,676)
2018 (n=2,485)
Responses from social networking service users
(Note 1) This item was covered only by the detailed questionnaire in the 2018 survey. (Note 2) “To find people who share the same interests or tastes or people with the same concerns or problems, or to broaden social relationships” in the 2018 survey
(Note 2)
(Note 1)

12
3. Current ICT Usage by Businesses (1) Cloud computing service usage (businesses)
Figure 3-1: Transitions in cloud service usage
The share for businesses using at least some cloud computing services (hereafter referred to
as “cloud services”) rises to 64.7%.
The most frequently cited among cloud services is “file storage and data sharing” (56.0%),
followed by “e-mail” (48.0%) and “Information sharing / portal” (43.0%). Users of advanced
services such as “sales support” and “production management” are limited. Reasons for using cloud services include “No need to have internal asset and storage
systems” (45.9%) and “the same services are available irrespective of location or equipment”
(43.3%).
As for the effects of the use of cloud services, 85.5% recognized either “very beneficial” or
“somewhat beneficial” effects.
Note: The 2017 survey treated information and communications companies as a single industry and indicated that ICT industry members’ share of the whole of survey targets increased from the previous year. Attention must be paid to this point for historical analysis. (Until the 2016 survey, ICT companies had been treated as a component of the services and other industries. See Figure 3-2 for a breakdown by industry.)

13
Figure 3-2: Cloud service usage by industry and capitalization
71.765.1
62.454.3
55.350.8
69.664.4
80.180.5
80.272.9
90.878.5
59.754.4
0% 20% 40% 60% 80% 100%
(n=302)(n=298)
(n=357)(n=370)
(n=340)(n=314)
(n=305)(n=292)
(n=141)(n=134)
(n=131)(n=130)
(n=251)(n=243)
(n=288)(n=326)
By industry
■: 2019■: 2018
Construction
Manufacturing
Transport / mailing
Wholesale / retail
Financial / insurance
Real estate
Information and communications
Service and other industries
36.537.1
51.149.3
66.150.8
69.261.0
73.665.9
90.175.7
88.288.3
92.086.7
0% 20% 40% 60% 80% 100%
(n=86)(n=92)
(n=496)(n=475)
(n=305)(n=267)
(n=484)(n=511)
(n=418)(n=431)
(n=60)(n=60)
(n=124)(n=130)
(n=142)(n=141)
By capitalization
■: 2019■: 2018
Less than ¥10 million
¥10 million to less than ¥30 million
¥30 million to less than ¥50 million
¥50 million to less than ¥100 million
¥100 million to less than ¥500 million
¥500 million to less than ¥1 billion
¥1 billion to less than ¥5 billion
¥5 billion or more

14
Figure 3-3: Cloud services used by businesses (multiple responses accepted)
56.0
48.0
43.0
37.3
35.7
31.4
18.4
15.4
12.5
11.4
11.2
10.2
9.6
8.1
5.5
5.7
1.9
7.9
53.1
52.2
40.5
38.4
31.9
29.3
16.7
12.6
14.3
9.2
7.0
9.0
8.4
8.4
6.4
6.3
2.1
6.8
0% 20% 40% 60%
File storage / data sharing
Information sharing / portal
Schedule sharing
Payroll, financial accounting, HR
Data backups
Sales support
Sharing information withbusiness partners
e-learning
System development andWebsite construction
Order taking and sales
Production management,distribution management,
store management
Project management
Purchasing
Billing and payment systems
Authentication systems
R&D related
Other
2019 (n=1,445)
2018 (n=1,312)
Responses from cloud service users

15
Figure 3-4: Reasons for using cloud services (multiple responses accepted)
Figure 3-5: Impact of cloud computing services (2019)
45.9
43.3
36.8
32.6
25.9
24.8
18.6
18.4
41.6
29.6
16.4
33.8
31.9
24.6
21.6
19.5
0% 20% 40%
No need to have internal asset and storagesystems
The same services are available irrespective oflocation or equipment
Improve operational stability and availability
Useful as a backup in a time of disaster
Reliability is higher (information leakagecountermeasures, etc.)
Quick response capability, such as upgradingsystem capacity
Costs are lower than existing systems
Easy system scalability
2019 (n=1,375)2018 (n=1,312)
Very beneficial33.6%
Somewhat beneficial51.9%
Not very beneficial0.2%
Negative impact0.4%
Do not know the impact13.9%
2019 (n=1,319)
Responses from cloud service users
Responses from cloud service users
Very beneficial or somewhat beneficial
85.5%

16
(2) Introduction of IoT/AI systems/services (businesses)
Figure 3-6: Introduction of IoT and AI systems or services
Figure 3-7: Purposes of digital data collection/analysis (multiple answers accepted) (2019)
12.1
14.1
8.5
9.8
63.2
65.4
16.2
10.7
2018(n=2,095)
2019(n=2,111)
0% 10% 20% 30% 40% 50% 60% 70% 80% 90% 100%
Have introduced Have not introduced but are planning to introduce
Have not introduced Don’t know
8.4
13.9
15.9
25.0
34.0
83.5
0% 20% 40% 60% 80% 100%
Others
Business continuity
New business projects/management
Overall optimization of businessoperations
Improvement of customer services
Improvement of businessefficiency/operations
2019 (n=291)
Businesses that have introduced IoT and AI systems or services to collect and analyze digital data account for 14.1% of respondents. The percentage of those that have done so and are planning to do so is 23.9%.
Among purposes of digital data collection/analysis with IoT/AI systems, “improvement of business efficiency/operations” is the most frequently cited (83.5%), followed by “improvement of customer services” (34.0%) and “overall optimization of business operations” (25.0%).
Those saying that the introduction of IoT and AI systems or services has been “very effective” or “somewhat effective” account for 79.8% of respondents.
The most frequently cited among components of IoT and AI systems or services that have been introduced are “surveillance cameras” (30.4%), followed by “physical security devices” (28.2%) and “sensors” (24.6%).
Responses form IoT, AI and other system service users

17
Figure 3-8: Effects of IoT/AI system/service introduction (2019)
Figure 3-9: Components of AI/IoT systems/services (multiple answers accepted) (2019)
4.34.4
11.212.6
21.021.0
24.628.2
30.4
0% 20%
Cellular modules for automobiles
Electronic tags (RFID tags)
Smart meters, energy management systems
Industrial robots
Non-contact IC cards
OCR
Sensors
Physical security devices
Surveillance cameras
2019(n=291)
Responses form IoT, AI and other system service users
Responses form IoT, AI and other system service users
Very or somewhat effective 79.8%

18
4. Introduction and Implementation of Telework (1) Introduction of telework (businesses)
Figure 4-1: Telework introduction
Of the surveyed businesses, 20.2% have introduced telework. Among types of telework that have been introduced, “mobile work” is the most frequently
cited (63.2%). “Information and communications” and “financial and insurance” industries post higher
telework introduction rates than other industries.
Businesses capitalized at 5 billion yen or more post high growth in their telework introduction rates of up to 64.3%.
The most common percentage of telework employees is “less than 5%” cited by 47.6% of responding businesses.
The highest ranked purpose for introducing telework is to “raise efficiency (productivity) of business processes,” cited by 68.3%. This was followed by to “improve workers’ work-life balance” (46.9%) and to “shorten workers’ traveling time and avoid congestion” (46.8%).
Concerning the intended effects of telework introduction, 87.2% recognize either “very beneficial” or “somewhat beneficial” effects.
Of businesses that have not implemented telework, “work is not suited to telework” is cited by the largest percentage, 74.7%, as the reason for not introducing telework.
(The survey took place in late September 2019 before the COVID-19 pandemic.)

19
Figure 4-2: Telework introduction by industry and capitalization
20.219.1
22.518.8
21.120.8
11.78.7
20.120.1
40.737.9
25.416.9
46.539.9
16.516.2
0% 20% 40%
(n=2,118)(n=2,106)
(n=303)(n=299)
(n=359)(n=371)
(n=339)(n=316)
(n=305)(n=292)
(n=141)(n=133)
(n=132)(n=130)
(n=252)(n=243)
(n=287)(n=322)
By industry
■: 2019■: 2018
Construction
Manufacturing
Transport / mailing
Wholesale / retail
Financial / insurance
Real estate
Information and communications
Service and other industries
Total
6.2
12.1
10.0
10.5
14.4
12.3
22.0
15.9
26.9
26.9
35.5
30.0
36.1
46.7
64.3
53.3
0% 20% 40% 60%
(n=86)
(n=90)
(n=495)
(n=476)
(n=305)
(n=269)
(n=486)
(n=511)
(n=418)
(n=429)
(n=61)
(n=60)
(n=124)
(n=130)
(n=143)
(n=141)
By capitalization
■: 2019■: 2018
Less than ¥10 million
¥10 million to less than ¥30 million
¥30 million to less than ¥50 million
¥50 million to less than ¥100 million
¥100 million to less than ¥500 million
¥500 million to less than ¥1 billion
¥1 billion to less than ¥5 billion
¥5 billion or more
(The survey took place in late September 2019 before the COVID-19 pandemic.)
(The survey took place in late September 2019 before the COVID-19 pandemic.)

20
Figure 4-3: Percentage of telework employees
Figure 4-4: Purposes of introducing telework (multiple responses accepted)
7.1
1.9
4.8
9.0
15.3
18.2
15.1
26.0
48.5
21.7
56.1
5.2
1.8
6.5
7.1
15.1
18.5
26.0
27.9
46.8
46.9
68.3
0% 20% 40% 60% 80%
Other
Conserve energy and electricity
Reduce office costs
Improve creativity of business processes
Increase customer satisfaction
Secure employment, prevent personnel losses
Prepare for business continuity in the event ofemergencies (earthquakes, typhoon, heavy snow,
super-flu outbreaks, etc.)
Meet needs of employees including persons withdisabilities, elderly persons and those engaging in
nursing care or childcare
Shorten workers’ traveling time and avoid congestion
Improve workers’ work-life balance
Raise efficiency (productivity) of business processes
2019 (n=480)
2018 (n=427)
(Note 2)
(Note 3)
(Note 4)
(Note 5)
(Note 6)
(Note 7)
(Note 1)
Responses from businesses having introduced telework
Responses from businesses having introduced telework
(The survey took place in late September 2019 before the COVID-19 pandemic.)
(The survey took place in late September 2019 before the COVID-19 pandemic.)
(Note 1) “Raise efficiency (productivity) of routine business processes” in the 2018 survey (Note 2) “Provide healthy, comfortable lives for workers” in the 2018 survey (Note 3) “Reduce workers' travel times” in the 2018 survey (Note 4) “Address employees with commuting difficulties (persons with disabilities, elderly persons, nursing/child-rearing persons, etc.)” in the 2018 survey (Note 5) “Prepare for business continuity in the event of emergencies (earthquakes, super-flu outbreaks, etc.)” in the 2018 survey (Note 6) “Improve creativity of creative, value-added business processes” in the 2018 survey (Note 7) The percentage for the 2018 survey represents businesses that chose “Conserve energy and electricity” and/or “Counter global warming by lowering CO2 emissions through transportation alternatives.”

21
Figure 4-5: Telework benefits (2019)
Figure 4-6: Reasons for not introducing telework (multiple responses accepted)
Very beneficial25.9%
Somewhat beneficial61.3%
Not very beneficial0.3%
Negative impact0.0%
Do not know the impact12.5%
2019 (n=464)
Very beneficial or Somewhat beneficial
87.2%
7.6
4.0
5.7
7.5
6.9
9.7
8.7
13.4
11.0
12.7
9.1
22.8
20.5
73.1
5.3
5.0
5.3
6.7
6.8
9.2
9.9
10.2
10.6
11.3
11.8
22.3
23.3
74.7
0% 20% 40% 60% 80%
Other
Shifts burden to other employees
No requests from union or employees
Too expensive
Difficult to calculate wages
Difficult to assess employees
Troublesome to introduce an HR system
Do not see the advantage of introducingtelework
Have not moved to digital documents
Impedes office / internal communications
Impedes handling customers and otherexternal entities
Difficult to advance work operations
Concern about information security breaches
Work is not suited to telework
2019 (n=1,346)
2018 (n=1,462)
Responses from businesses having introduced telework
(The survey took place in late September 2019 before the COVID-19 pandemic.)
Responses from businesses that have not introduced telework or made plans to do so.
(The survey took place in late September 2019 before the COVID-19 pandemic.)

22
(2) Engagement in telework (individuals)
Of individuals aged 15 or older and working for businesses or other organizations, 8.4% have
the experience of engaging in telework. The percentages of respondents citing “working from
home” and “out of the office (mobile work)” as telework types in which they have engaged are as
high as 68.9% and 62.0%, respectively.
Of individuals who have not engaged in telework, those hoping to engage in telework account
for 16.1%.
The most frequently cited reason for failing to engage in telework is that “there is not a telework
system at the employer” (41.1%), followed by the reason that “work is not suited to telework”
(40.3%). Figure 4-7: Having engaged and hoping to engage in telework
Figure 4-8: Type of telework (multiple responses accepted)
8.4%
14.6%
Those who hope to engage in telework
or make no response 77.1%
Haveengaged intelework
Would liketo engage intelework
Have engaged in telework or would like to do so
22.9%
2019(n=23,885)
68.9
23.9
62.0
0%
20%
40%
60%
80%
Working fromhome
Satellite office Out of the office(mobile work)
2019(n=1285)
Note: as a percentage of individuals aged 15 or older and working for businesses and other organizations
Responses from employees who are aged 15 or more and have engaged in telework.
(The survey took place in late September 2019 before the COVID-19 pandemic.)
(The survey took place in late September 2019 before the COVID-19 pandemic.)

23
Figure 4-9: Whether or not individuals would like to engage in telework (2019)
Figure 4-10: Reasons for not engaging in telework (multiple responses accepted) (2019)
16.1%
83.9%
2019(n=22,175)
Would like to engage in telework
Would not like to engage in telework
41.1
40.3
8.4
8.2
6.5
6.3
4.0
3.2
2.8
0% 10% 20% 30% 40%
There is not a telework system at the employer
Work is not suited to telework
There is no adequate ICT systems required fortelework
The telework business environment (includingsatellite offices) has not been developed
It is unclear whether telework is allowed at theemployer
The employer cannot make adequate labormanagement
Have not moved to digital documents
The atmosphere at the employer is not favorablefor telework
Impedes office / internal communications
2019 (n=20,944)
Responses from employees who are aged 15 or more and have not engaged in telework.
Responses from employees who are aged 15 or more and have not engaged in telework.
(The survey took place in late September 2019 before the COVID-19 pandemic.)
(The survey took place in late September 2019 before the COVID-19 pandemic.)

24
5. Safety and Security Efforts (1) State of security measures (households)
Of households that use the internet, 81.1% have taken some security measures. The most
common security measures taken are “installing anti-virus software,” at 52.9%. This is
followed by “keeping software updated to the latest version” (50.2%) and “setting a
password lock on my devices” (44.8%). Figure 5-1: State of security measures (multiple responses accepted) (2019)
81.1
18.9
52.9
50.2
44.8
35.0
34.0
31.4
31.3
27.6
0% 10% 20% 30% 40% 50% 60% 70% 80% 90%
I have taken security measures.
I have not taken security measures.
Install anti-virus software
Keep software updated to the latest version
Set a password lock on my devices
Subscribe to security services
Do not connect to unknown Wi-Fi networks
Take any measures against spam
Use only reliable applications
Refrain from entering personal information
2019(n=12,223)
Tabulating responses from households that have at least one member who has used the internet in the past year

25
(2) Concerns about using the internet (individuals) The combined percentage of internet users who “feel concerned” and “feel rather
concerned” during internet use stands at 75.0%, rising by 4.3 points from the previous year. The most frequently cited type of concern about using the internet is “leak of personal
information and internet use history” (cited by 88.4%), followed by “computer virus infections”
(62.6%) and “concern about fraudulent email or fraud using the internet” (51.9%). Those
citing “concern about the reliability of electronic payment means” account for 43.3% of
respondents, up 5.5 points. Figure 5-2: Concerns about using the internet
Responses from Internet users
Notes: as a percentage of Internet users who “feel concerned” and “feel rather concerned”
This item was covered only by the detailed questionnaire in the 2018 survey.
The target age group of 13-19 years old was 12-19 years old in the 2018 survey.
(注)
65.7
68.0
71.7
78.8
81.0
83.4
81.7
74.5
55.5
63.3
69.2
75.0
75.9
77.3
74.3
59.4
0% 20% 40% 60% 80%
13-19
20-29
30-39
40-49
50-59
60-69
70-79
80 and older
2019(n=29,851)
2018(n=4,435)

26
Figure 5-3: Types of concerns about using the internet (multiple responses accepted)
88.4
62.6
51.9
46.8
44.1
43.3
20.9
13.0
12.1
2.4
84.6
65.7
48.3
47.9
43.3
37.8
21.1
11.6
11.2
2.3
0% 20% 40% 60% 80%
Leak of personal information andinternet use history
Computer virus infections
Concern about fraudulent email or fraudusing the internet
Spam
Security measures
Concern about the reliability of electronicpayment means
Viewing of illegal and harmful information
Concern about trouble withcommunication on social media, etc.
Internet addict
Other
2019 (n=22,164)
2018 (n=3,091)
Note:This item was covered only by the detailed questionnaire in the 2018 survey.
(Note)
Responses from individuals who have used the internet and have concerns about using the internet

27
(3) Security breaches against information-communication networks and security measures implemented (businesses)
Among businesses that use information-communication networks, 55.2% report some
losses resulting from a security breach during the use of information-communication networks
in the past year. The most frequently cited type of security breach is “discovery of or infection
with a computer virus” (cited by 36.7%), followed by “targeted emails” (33.7%). The percentage of businesses that implement some security measures is 97.8%. By type of
security measure, the implementation rate is the highest at 83.2% for “installing anti-virus
programs on computers and other devices (operating systems, software, etc.), followed by
62.4% for “installing anti-virus programs on servers” and 57.6% for “controlling access with
IDs, passwords, etc.”
Figure 5-4: Security breaches that occurred in the past year during the use of information-communication networks (multiple responses accepted)
55.2
44.8
36.7
29.5
7.1
33.7
9.4
2.7
2.4
1.2
0.4
1.7
55.6
44.4
46.9
37.2
9.7
35.7
8.7
4.1
2.4
0.9
0.8
0.5
0% 20% 40% 60%
Sustained some kind of loss
Sustained no losses
Discovered or infected bya computer virus
Discovered a computer virusbut not infected
Discovered a computer virus andat least one incidence of an infection
Have received targeted emails
Used as a spam bot or zombie
Illegal access
DoS (DDoS)
Data breach due to theft or negligence
Web site defacement
Other losses
2019 (n=2,085)
2018 (n=2,077)
Responses from businesses using information and communication networks (intra-business or inter-business networks and the internet)

28
Figure 5-5: State of security measures (multiple responses accepted)
97.8
2.2
83.2
62.4
57.6
51.2
46.9
41.1
38.6
36.4
25.8
21.9
19.9
18.9
16.1
15.7
14.3
14.1
13.4
12.3
5.0
97.8
2.2
82.9
61.0
51.6
44.6
50.6
45.2
36.7
32.7
25.6
16.9
17.1
21.0
12.8
14.2
14.6
13.0
12.5
10.5
33.0
0% 20% 40% 60% 80% 100%
Implemented some measures
Not implemented any particular measure
Install anti-virus programs on computers and other devices(operating system, software, etc.)
Install anti-virus programs on servers
Control access with IDs, passwords, etc.
Install and maintain firewalls
Training for employees
Apply security patches for operating systems
Establish security policies
Maintain access logs
Construct anti-virus walls at external access points
Encrypt data or networks
Security audits
Use proxy servers, etc.
User authentication by means of authentication technologies
Line monitoring
Install and maintain intrusion detection systems (IDS)
Establish manuals on responding to viruses
Outsource security management
Install and maintain Web application firewalls
Other measures
2019(n=2,092)
2018(n=2,077)
Responses from businesses using information and communication networks (intra-business or inter-business networks and the internet)