presentation to shareholders - asx · wesfarmers limited 5.6 22.7 15.7 telstra corporation 9.2 3.7...
TRANSCRIPT

Presentation to Shareholders November 2011
1
For
per
sona
l use
onl
y

Disclaimer
2
This material has been prepared by BKI Investment Company Limited.
The information within this document is not intended to provide advice to investors or take into account an individual’s financial
circumstances or investment objectives. This is general investment advice only and does not constitute advice to any person. The
opinions within this document are not intended to represent recommendations to investors, they are the view of BKI Investment
Company Limited as of this date and are accordingly subject to change.
Information related to any company or security is for information purposes only and should not be interpreted as a solicitation of
offer to buy or sell any security. The information on which this presentation is based has been obtained from sources we believe
to be reliable, but we do not guarantee its accuracy or completeness.
Investors should consult their financial adviser in relation to any material within this document.
For
per
sona
l use
onl
y

BKI Update Solid Background Delivering Performance
Macro Snapshot Domestic V’s International
Valuation V’s Income
Taking Advantage Investing for the Future
BKI Update Focus on Value and Yield
3
Agenda
For
per
sona
l use
onl
y

BKI Update Solid Background Delivering Performance
4
For
per
sona
l use
onl
y

Robert Millner Chairman of the Board
Chairman of the Investment Committee
David Hall Independent Non-Executive Director
Alex Payne Non-Executive Director
Investment Committee
Ian Huntley Independent Non-Executive Director
Investment Committee
Tom Millner Chief Executive Officer
Investment Committee
Jaime Pinto Company Secretary
5
Directors and Management
For
per
sona
l use
onl
y

BKI awarded “2011 Listed Investment Company of the Year”.
The award is a great endorsement of an LIC whose major focus
is to invest in quality companies, enabling it to generate a
growing dividend stream and capital growth.
Exciting future for the LIC sector.
Fund Manager of the Year Awards
6
For
per
sona
l use
onl
y

7
Dividends Paid
2
4.3 5 5.3
6 6 5.25
6
1 1
1
0.0
1.0
2.0
3.0
4.0
5.0
6.0
7.0
cps cps cps cps cps cps cps cps
2004 2005 2006 2007 2008 2009 2010 2011
Ordinary Dividends Special Dividends
For
per
sona
l use
onl
y

8
Management Expense Ratio
0.69% 0.71%
0.56%
0.46% 0.46%
0.31%
0.19% 0.18%
0.10%
0.20%
0.30%
0.40%
0.50%
0.60%
0.70%
0.80%
2004 2005 2006 2007 2008 2009 2010 2011
For
per
sona
l use
onl
y

9
Source: BKI Investment Company Limited, IRESS. Portfolio Returns are measured by change in pre tax NTA and are after all
operating expenses, provision and payment of both income and capital gains tax and the reinvestment of dividends. Total Shareholder
Returns include reinvestment of dividends. Past performance is not indicative of future performance.
BKI Performance as at 31 October 2011
BKI Portfolio
Returns are
measured after
all operating
expenses,
provision and
payment of
income and
capital gains
tax.
BKI Performance 6 Mths 1 Year 3 Years 5 Years 7 Yearsas at 31 October 2011
(pa) (pa) (pa)
S&P/ASX 300 ACC INDEX (XKOAI) -9.0% -3.9% 7.1% -0.2% 6.3%
BKI Total Shareholder Returns 1.9% 6.5% 7.9% 2.1% 8.0%
BKI Share Price Outperformance V's XKOAI 10.9% 10.4% 0.8% 2.3% 1.7%
BKI Portfolio Performance -1.9% 3.4% 8.4% 3.0% 6.8%
BKI Portfolio Outperformance V's XKOAI 7.1% 7.3% 1.3% 3.2% 0.5%
For
per
sona
l use
onl
y

Macro Snapshot Domestic V’s International
Valuation V’s Income
10
For
per
sona
l use
onl
y

Low Investor Confidence
• Domestic Inappropriate interest rates
Uncertainty on the future cost of living
Pressure on household affordability
Negativity surrounding weak global economies
Unstable federal government
• International High unemployment
Financial instability
Low economic growth outlook
11
Market Commentary
For
per
sona
l use
onl
y

Investor’s Defensive Reaction
• Domestic Changed risk appetite to investing in shares
Increased household savings
…Leading to a reduced exposure to Australian shares
• International High Australian Dollar
Unfavorable federal government policies;
Carbon Tax
Mining Resources Rent Tax
…Leading to a reduced exposure to Australian shares
12
Market Commentary
For
per
sona
l use
onl
y

13
Historical PE Multiples (X)
5
7
9
11
13
15
17
19
21
23
25
2001 2003 2005 2007 2009 2011 2013
Australia US Euro UK
Valuation – PE Ratios
Source: Credit Suisse
For
per
sona
l use
onl
y

14
Valuation – PE Ratios
Australian Market – Historical PE (X)
8
9
10
11
12
13
14
15
16
17
18
2001 2003 2005 2007 2009 2011 2013
Australian Market 12-month Forward PE Average +/- 1 S.D.
Source: Credit Suisse
For
per
sona
l use
onl
y

15
Income – Dividend Yields
10 year Historical Dividend Yields (%), Aust, US, Euro and UK
0%
1%
2%
3%
4%
5%
6%
7%
2001 2003 2005 2007 2009 2011 2013
Australia US Euro UK
Source: Credit Suisse
For
per
sona
l use
onl
y

16
Australian Market – Historical Dividend Yield (%)
Income – Dividend Yields
2%
3%
4%
5%
6%
7%
2001 2003 2005 2007 2009 2011 2013
Australian Market Dividend Yield Average +/- 1 S.D.
Source: Credit Suisse
For
per
sona
l use
onl
y

Taking Advantage Investing for the Future
17
For
per
sona
l use
onl
y

• Long term investor’s need to act upon these opportunities.
• BKI has been investing through many cycles.
• Balance sheets of quality companies appear more robust than ever.
• Dividend distributions have continued to improve.
• BKI remain cautious of companies exposed to:
Retail – Poor consumer activity and changing buying patterns
Media – Low advertising spending
Manufacturing – Import pressure from high Australian Dollar
18
Investment Opportunity
For
per
sona
l use
onl
y

1 Income - Dividend Yields, Franking, Pay Out Ratios.
2 Principal Activity - Sustainable Business Model, Competitive
Advantage.
3 Debt Levels - Gearing Ratios, Net Interest Coverage.
4 Management and Board - Ownership, Board Meeting Attendance,
History of creating shareholder wealth.
5 Earnings and Valuations - Earnings Profiles, PE Multiples,
EV/EBITDA Multiples. 19
Stock Selection Criteria
For
per
sona
l use
onl
y

20
Portfolio Movements
Since 30 June 2011
Major Investments FY12 Forecast
Dividend Yield (%)
FY12 Forecast
EPS Growth (%)
FY12 Forecast
PE Multiple (X)
Wespac Banking Corp 7.7 2.7 9.9
National Australia Bank 7.2 8.5 8.7
Fleetwood Corporation 6.9 0.6 12.3
Wesfarmers Limited 5.6 22.7 15.7
Telstra Corporation 9.2 3.7 11.3
Commonwealth Bank 6.9 4.1 11.2
QUBE Logistics 3.1 10.2 15.6
Tatts Limited 9.8 13.7 9.8
Crown limited 4.6 20.4 14.7
Invocare Limited 5.0 17.6 16.7
Source: BKI Investment Company, Credit Suisse
For
per
sona
l use
onl
y

21
Portfolio Movements
Since 30 June 2011
Source: BKI Investment Company, Credit Suisse
Major Divestments FY11 Actual
Dividend Yield (%)
FY11 Actual
EPS Growth (%)
FY11 Actual
PE Multiple (X)
Bluescope Steel 2.9 -204 -10.7
Echo Entertainment 0 n.a 22.6
Westpac Pref Shares(WBCPA) 5.0 0 n.a
Orica Pref Shares (ORIPB) 6.4 0 n.a
For
per
sona
l use
onl
y

1 New Hope Corporation 11 ANZ Banking Group
2 BHP Billiton Limited 12 Woodside Petroleum
3 National Australia Bank 13 QBE Insurance Group
4 Commonwealth Bank 14 Coca Cola Amatil Limited
5 Westpac Banking Corp 15 Metcash Limited
6 Wesfarmers Limited 16 Westpac Banking Corp SPSII
7 Telstra Corporation 17 ARB Corporation
8 Campbell Brothers Limited 18 ASX Limited
9 Woolworths Limited 19 Invocare Limited
10 AGL Energy Limited 20 TPG Telecom Limited
22
Diversification Top 20 Investments
As at 31 October 2011
For
per
sona
l use
onl
y
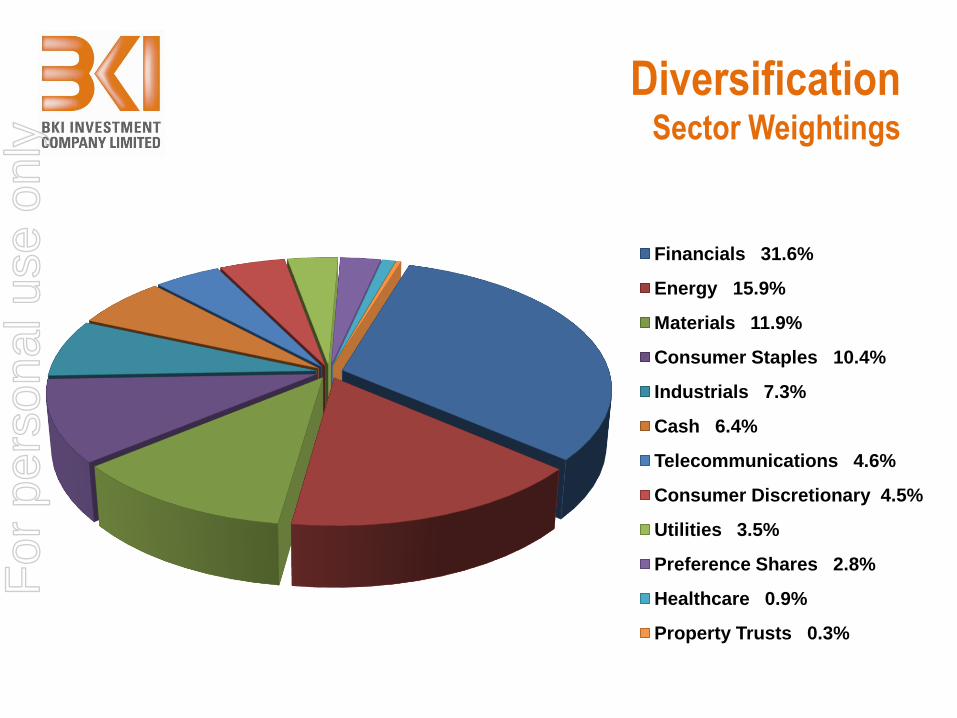
Diversification Sector Weightings
23
Financials 31.6%
Energy 15.9%
Materials 11.9%
Consumer Staples 10.4%
Industrials 7.3%
Cash 6.4%
Telecommunications 4.6%
Consumer Discretionary 4.5%
Utilities 3.5%
Preference Shares 2.8%
Healthcare 0.9%
Property Trusts 0.3%
For
per
sona
l use
onl
y

Diversification S&P/ASX300 Acc Indices
24
-15%
-5%
5%
15%
25%
35%
Financials Consumer Staples
S&P/ASX 300 Acc Index
Industrials Energy Materials
NAB CBA WBC WES
WOW AGK BHP
NHC
BKI
CPB
Source: BKI Investment Company, IRESS
12 Month Total Shareholder Returns as at 31 October 2011.
Larger portfolio holdings V’s Index returns; diversification delivering performance.
For
per
sona
l use
onl
y

BKI Update Focus on Yield and Value
25
For
per
sona
l use
onl
y

BKI announced as the inaugural winner of the “Listed Investment
Company of the Year”.
Revenues from the Investment Portfolio (excluding Special Dividend
Income) is up approx 7% on the previous corresponding period.
Operating Profits (excluding Special Dividend Income) is up 7% on the
previous corresponding period.
BKI is confident of at least maintaining the interim and final ordinary
dividends during FY2012.
BKI historical grossed up dividend yield is 8.1% as at 31 October 2011.
26
BKI Update July 2011 – October 2011
For
per
sona
l use
onl
y

27
New Hope Corporation
• Solid FY2011 results:
• Despite flood impacts and rail line closures
• Realised Net Profits from sale of Arrow Energy of $329m
• Achieved record export sales
• Plans to double production in next 5 - 7 years
• Increased Final Dividend by 11%
• Announced 7th Special Dividend (15cps fully franked)
• Launched a formal bid process after a number of approaches from
interested parties.
• Total Return since 30 June 2011 is 17.6%.
• Ranked by market Cap as the 43rd largest company in Australia.
For
per
sona
l use
onl
y

28
Value
-20.0%
-10.0%
0.0%
10.0%
20.0%
30.0%
$0.50
$0.60
$0.70
$0.80
$0.90
$1.00
$1.10
$1.20
$1.30
$1.40
$1.50
$1.60
$1.70
$1.80
Prem/Disc % Pre Tax NTA BKI Share Price
Opportunity for investment at a 10% discount to the Pre Tax NTA. Ideal
for long term passive shareholders and SMSF’s.
For
per
sona
l use
onl
y

Strong dividend payout ability with abundant franking credits. Historical
grossed up dividend yield was 8.1% as at 31 October 2011.
29
Yield
1.0%
3.0%
5.0%
7.0%
9.0%
BKI Grossed Up Dividend Yield 90 Day Bank Bill
For
per
sona
l use
onl
y

30
Office Level 2, 160 Pitt Street
Sydney NSW 2000
Telephone +61 2 9210 7000
Fax +61 2 9210 7099
Web www.bkilimited.com.au
ABN 23 106 719 868
For
per
sona
l use
onl
y