presentation overview back to the future reality check reaping the destiny dividend conclusions
TRANSCRIPT


Presentation overview• Back to the Future
• Reality check
• Reaping the Destiny Dividend
• Conclusions
Executive Summary•Celtic Tiger doesn’t exist
• Ireland’s economy no miracle; a coiled spring waiting to unwind
• The economic slowdown is a needed pause for breath…more the “end of the beginning” than the “beginning of the end”
•BUT
•Productivity growth is running into the sand. A range of interconnected and mutually dependant obstacles to the future exist
• East-west population imbalance• Failure to urbanise• Poor infrastructure• No economic planning • Bad use of land• Dysfunctional local authority structures
•Ultimate debate: Political Technology of decisions making is part of our economy and needs to be upgraded starting with Electoral system

BACK TO THE FUTURE
Back to the Future
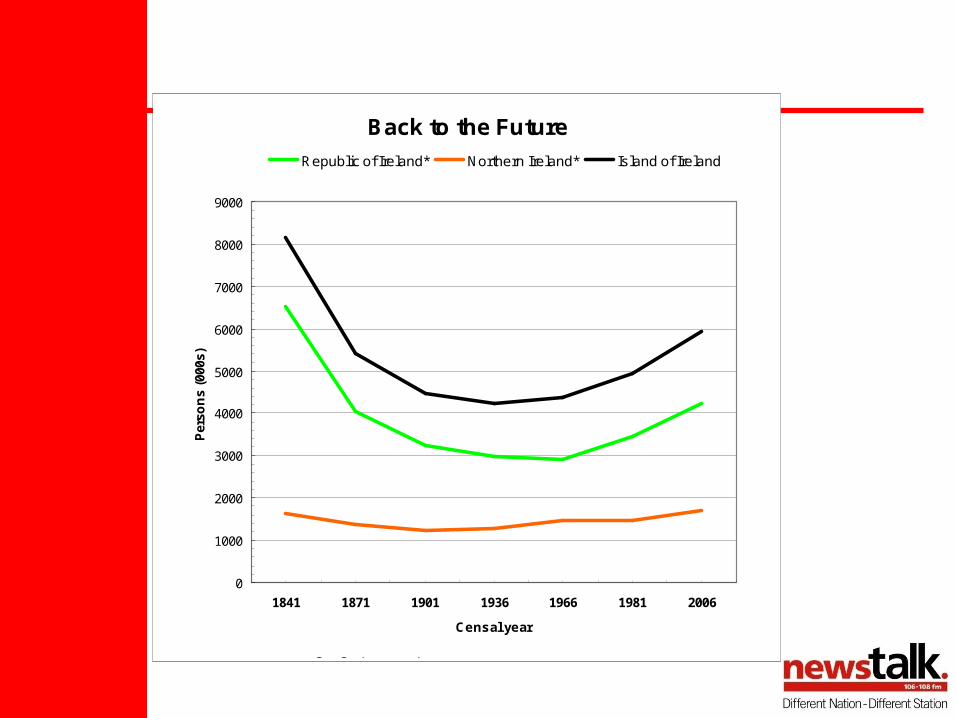
• 1841: Population of island 8.2 million
• Net exporter of food• Post famine (1851) 7 million • Since 1851 population of Europe
has trebled • Island’s pop today would be around
20 million today• Only EU country to have fallen
Back to the Future: Policy Permafrost
• 1847 Although repealed, legacy of penal laws hugely influential on economy and subsequent development– Capital flows to UK– No native industrial entrepreneurs
• 1847 to 1917: Even after famine, emigration encouraged as substitute to developing indigenous economy
• 1932 to 1957: Protectionism cripples domestic economy
• 1957 to 1977: Brief respite• 1977 to 1987: Fiscal insanity
• Policy permafrost only ended in 1987– NCB: Population of Republic to hit 6 million by
2050– 2 million in the six counties – so finally recovery of pre-famine
population levels by 2050– But since 19th Europe’s population has
trebled
• This implies a higher population level for Ireland by then than 8 million.
• How high?
Back to the Future: Then and now
• 1841 - 1987: – Huge dependance on agriculture– Inward looking economy– Real (policy-driven) or effective (incompetence-
driven) closure to world economy
• 1987-2007: – Agriculture falls to less than 4 % GDP– Globalised, diverse economy – Currency union in a market of almost 400 million
people– Strong links with US & developing links with
China, India
Back to the Future
0
1000
2000
3000
4000
5000
6000
7000
8000
9000
1841 1871 1901 1936 1966 1981 2006
Censal year
Per
son
s (0
00s)
Republic of Ireland* Northern Ireland* Island of Ireland
*Before 1922 the geographical equivalent of
Back to the Future
• What is Ireland’s “steady-state” population potential?
• How quickly can it be reached?
• What obstacles have to be overcome to reach it?
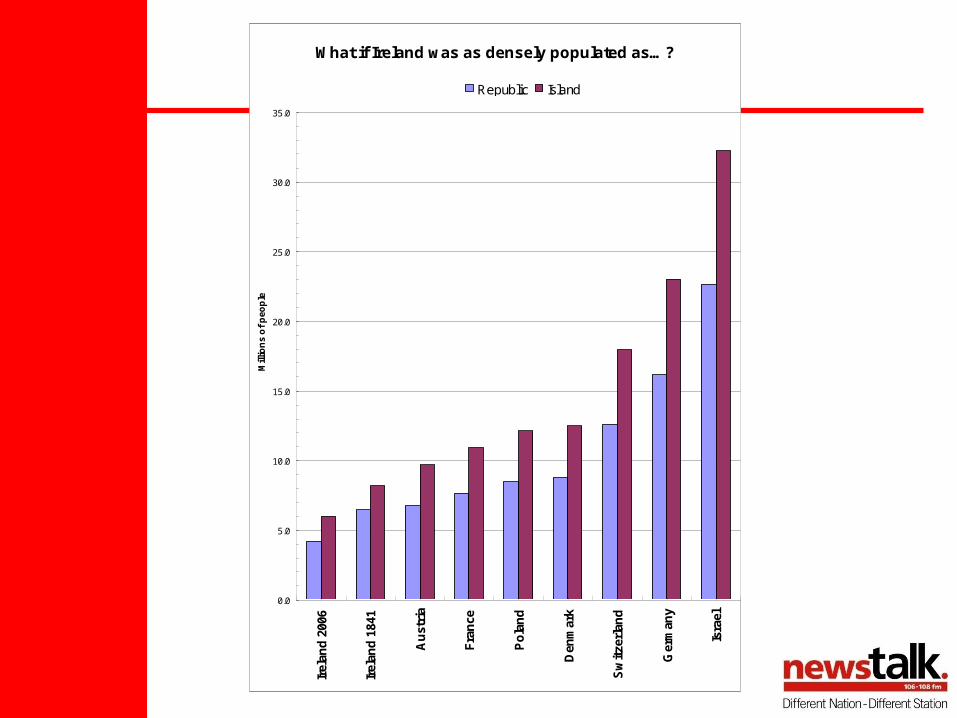
What if Ireland was as densely populated as…?
0.0
5.0
10.0
15.0
20.0
25.0
30.0
35.0
Irel
and
200
6
Irel
and
184
1
Au
stri
a
Fra
nce
Po
lan
d
Den
mar
k
Sw
itze
rlan
d
Ger
man
y
Isra
el
Mill
ion
s o
f p
eop
le
Republic Island

Rates of population growth 1970 to 2005
0.0%
50.0%
100.0%
150.0%
200.0%
250.0%
Malaysia Singapore S Korea
Per
cen
tag
e ch
ang
e

Back to the Future
• The case of Israel– 1948:2 million people– Now: 7 million people
• Land mass– Size of Leinster.
• If they can do it……

REALITY CHECK

Reality Check
• Coldwell international estate agents:“Ireland 2nd most expensive in world for executive property costs after Beverly Hills”
- CSO - “Between 1996 and 2002 the average
distance traveled to work nationally had risen from 6 to 10 miles”
- And this with just 4.2 million?
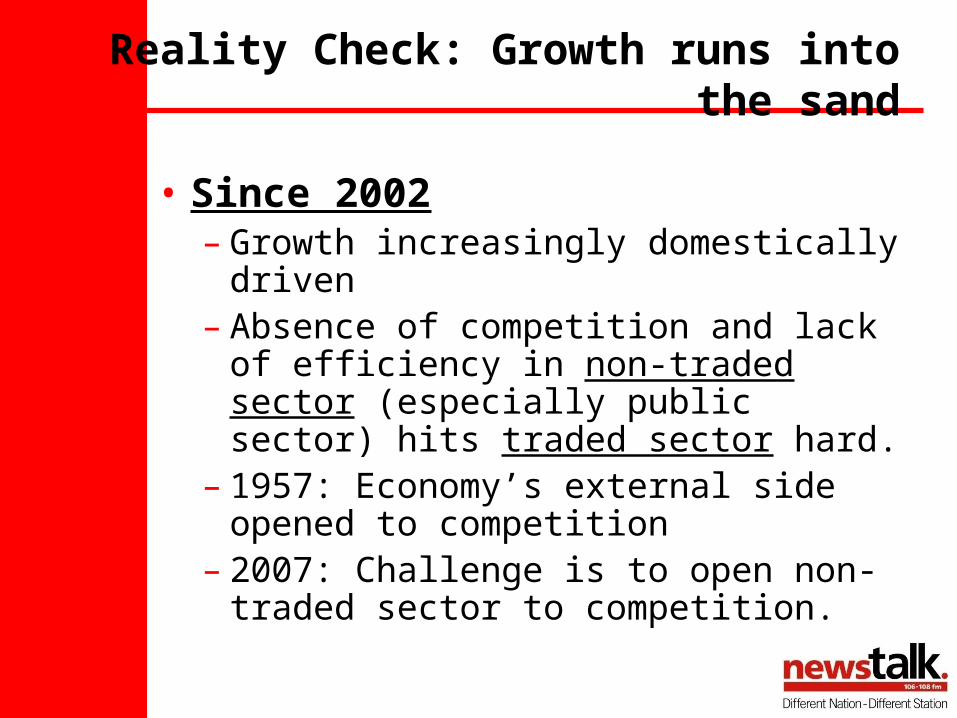
Reality Check: Growth runs into the sand
• Since 2002– Growth increasingly domestically
driven– Absence of competition and lack of
efficiency in non-traded sector (especially public sector) hits traded sector hard.
– 1957: Economy’s external side opened to competition
– 2007: Challenge is to open non-traded sector to competition.
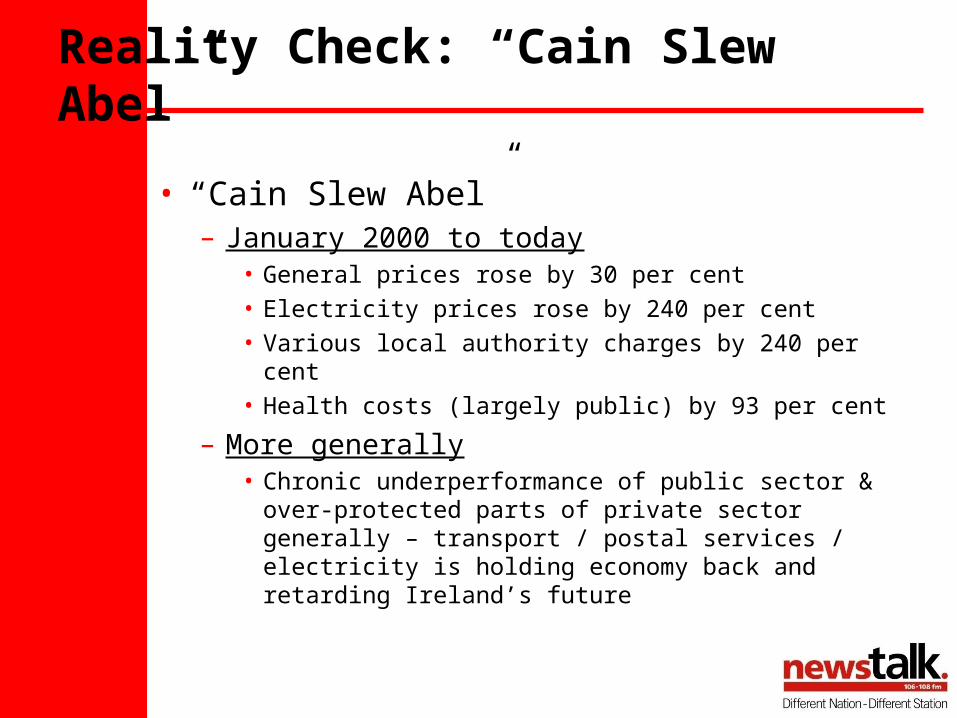
Reality Check: “Cain Slew Abel”
• “Cain Slew Abel”– January 2000 to today
• General prices rose by 30 per cent• Electricity prices rose by 240 per cent• Various local authority charges by 240 per cent• Health costs (largely public) by 93 per cent
– More generally• Chronic underperformance of public sector &
over-protected parts of private sector generally – transport / postal services / electricity is holding economy back and retarding Ireland’s future
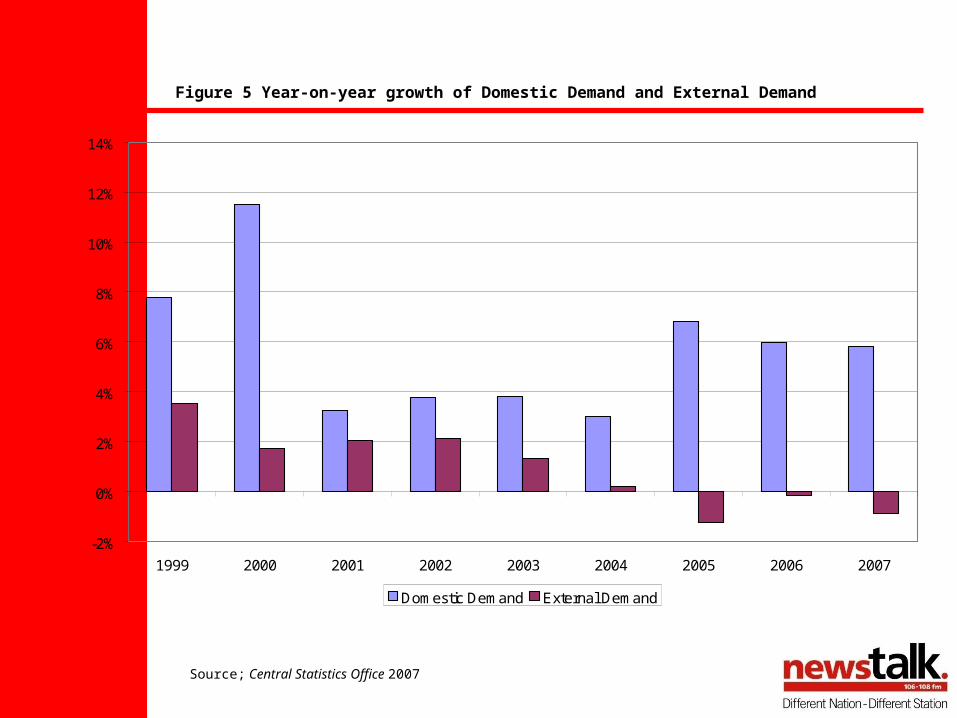
Figure 5 Year-on-year growth of Domestic Demand and External Demand
-2%
0%
2%
4%
6%
8%
10%
12%
14%
1999 2000 2001 2002 2003 2004 2005 2006 2007
Domestic Demand External Demand
Source; Central Statistics Office 2007
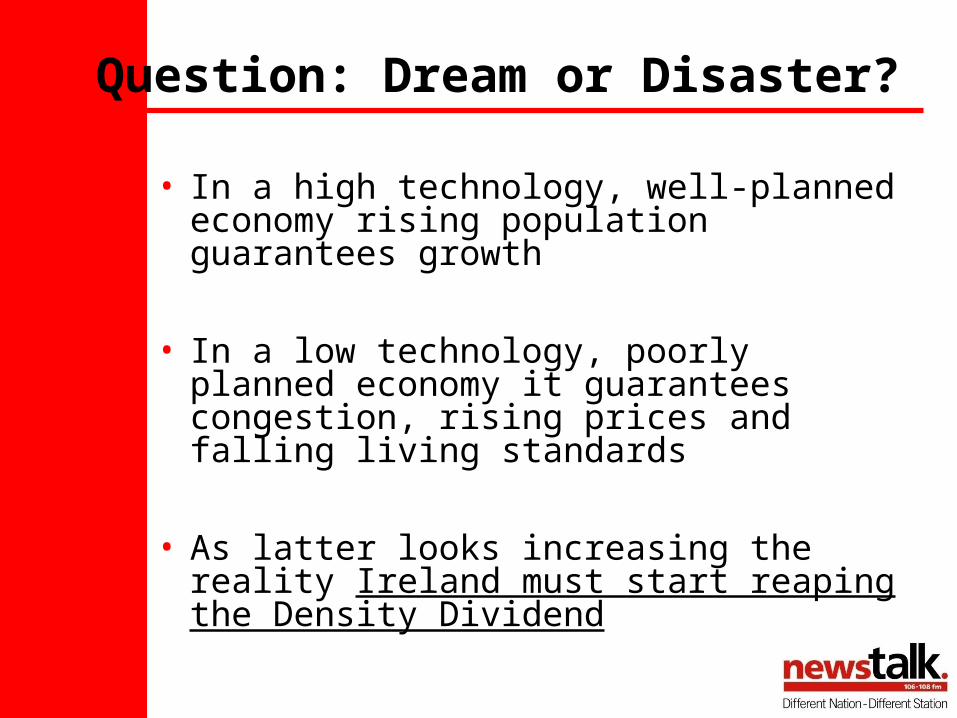
Question: Dream or Disaster?
• In a high technology, well-planned economy rising population guarantees growth
• In a low technology, poorly planned economy it guarantees congestion, rising prices and falling living standards
• As latter looks increasing the reality Ireland must start reaping the Density Dividend
DENSITY DIVIDEND
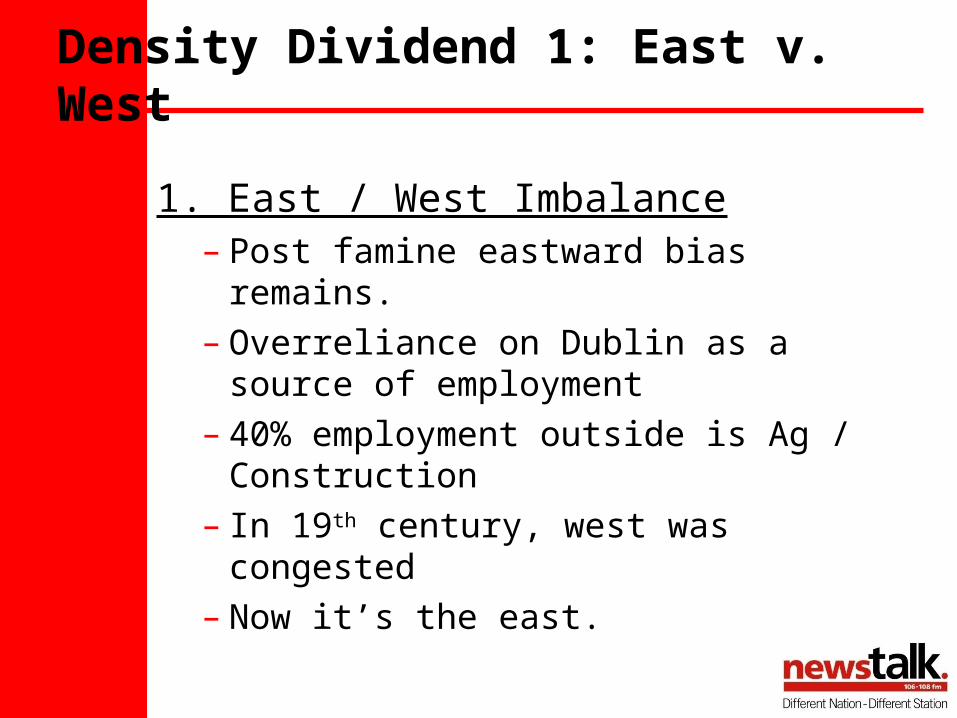
Density Dividend 1: East v. West
1. East / West Imbalance– Post famine eastward bias remains.– Overreliance on Dublin as a source
of employment– 40% employment outside is Ag /
Construction– In 19th century, west was
congested– Now it’s the east.
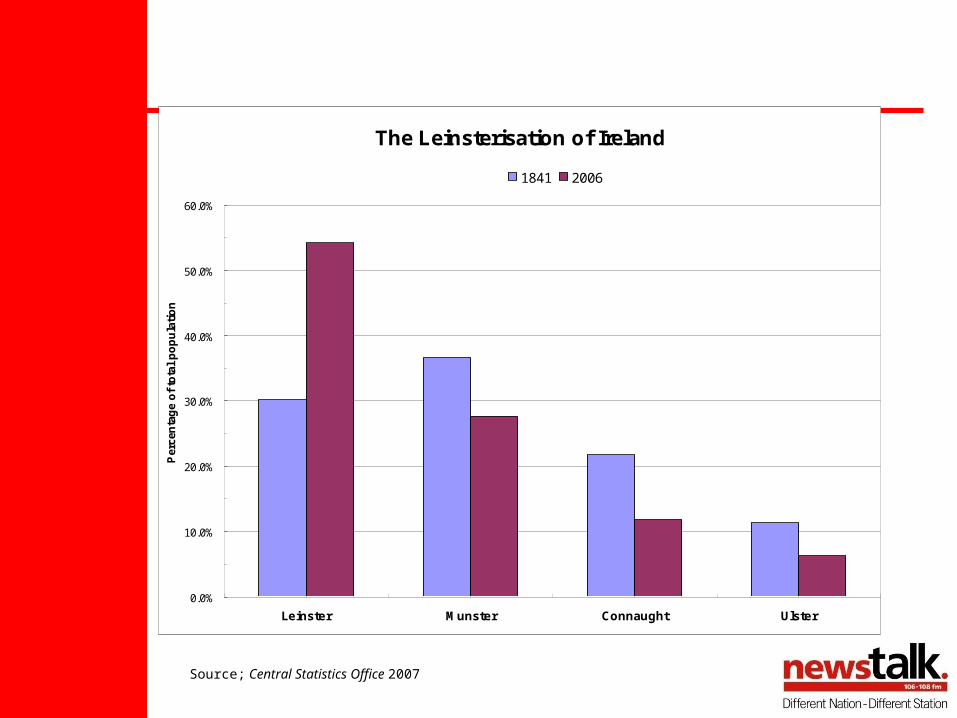
The Leinsterisation of Ireland
0.0%
10.0%
20.0%
30.0%
40.0%
50.0%
60.0%
Leinster Munster Connaught Ulster
Per
cen
tag
e o
f to
tal
po
pu
lati
on
1841 2006
Source; Central Statistics Office 2007

Urbanisation• Sweden less densely populated
than Ireland (for climatic reasons)• But three-quarters of Sweden’s
pop. lives in urban areas (Ireland: 55%)
• Swedish cities are really cities.• Galway, Limerick, Waterford,
Sligo, Athlone: Are they cities?
Density Dividend 2: Cities Anyone?
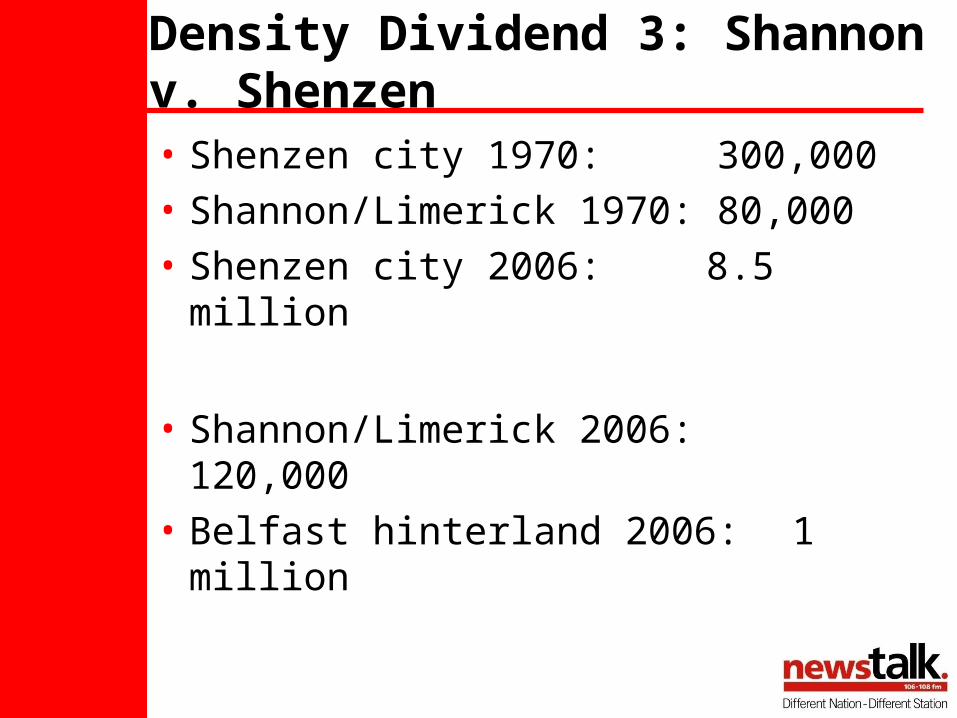
• Shenzen city 1970: 300,000• Shannon/Limerick 1970: 80,000• Shenzen city 2006: 8.5 million
• Shannon/Limerick 2006: 120,000
• Belfast hinterland 2006: 1 million
Density Dividend 3: Shannon v. Shenzen

• 8 % growth in overall population 2002 to 2006
• Cork & Limerick’s population’s actually fell
• Urban population growth was half national growth
• What if we could reverse this latter relationship?:
Density Dividend 3: Shannon v. Shenzen
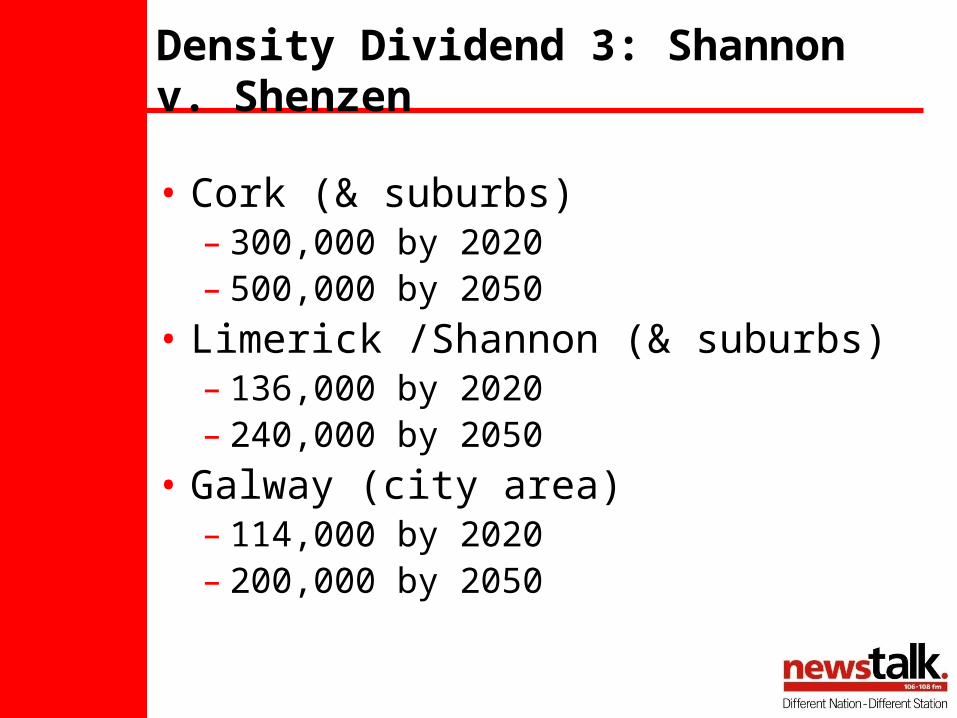
• Cork (& suburbs)– 300,000 by 2020– 500,000 by 2050
• Limerick /Shannon (& suburbs)– 136,000 by 2020– 240,000 by 2050
• Galway (city area)– 114,000 by 2020– 200,000 by 2050
Density Dividend 3: Shannon v. Shenzen
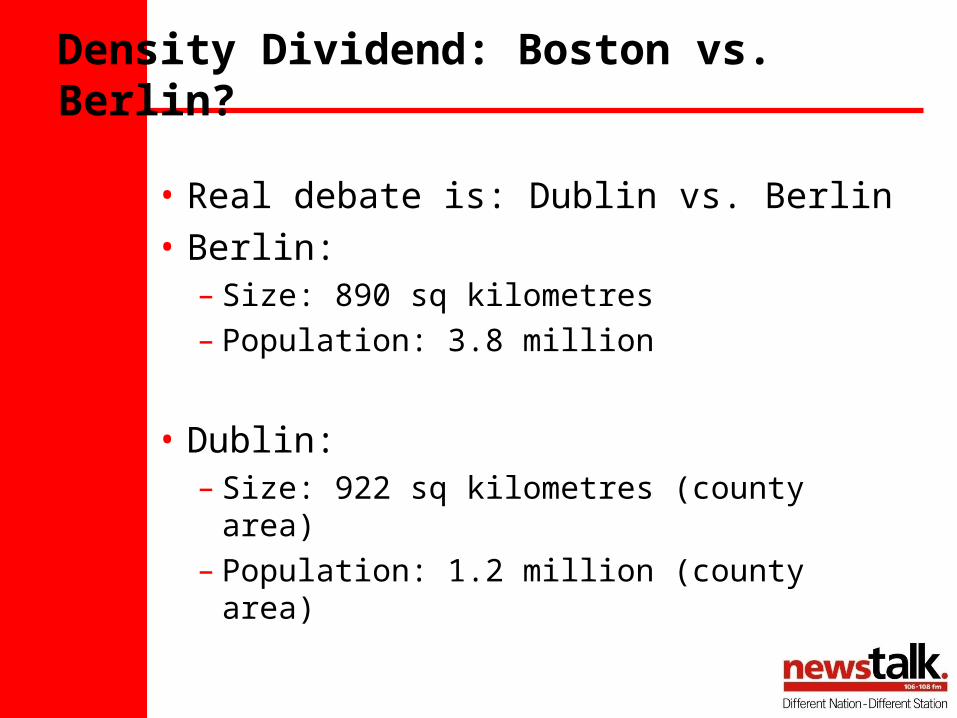
• Real debate is: Dublin vs. Berlin• Berlin:
– Size: 890 sq kilometres– Population: 3.8 million
• Dublin:– Size: 922 sq kilometres (county area)– Population: 1.2 million (county area)
Density Dividend: Boston vs. Berlin?
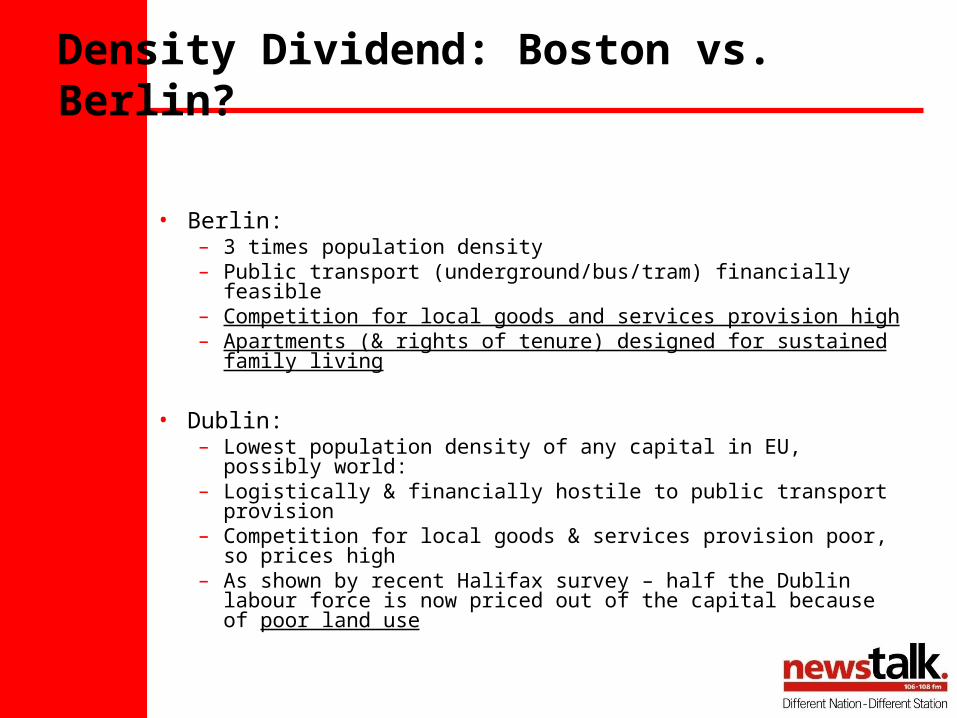
• Berlin: – 3 times population density– Public transport (underground/bus/tram) financially feasible– Competition for local goods and services provision high– Apartments (& rights of tenure) designed for sustained
family living
• Dublin:– Lowest population density of any capital in EU, possibly
world: – Logistically & financially hostile to public transport provision– Competition for local goods & services provision poor, so
prices high– As shown by recent Halifax survey – half the Dublin labour
force is now priced out of the capital because of poor land use
Density Dividend: Boston vs. Berlin?
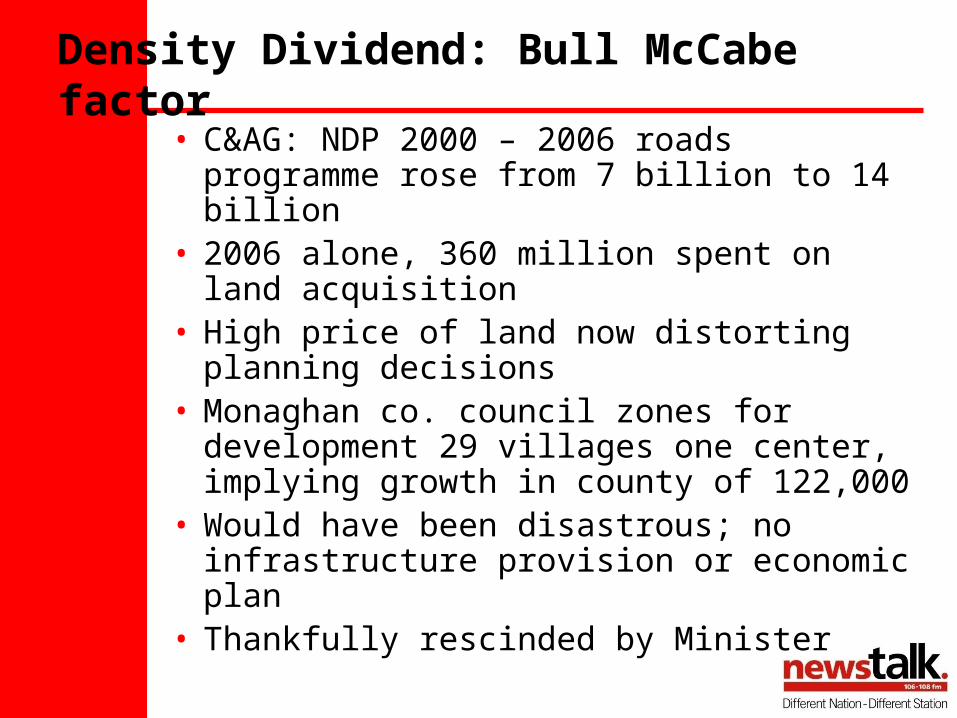
• C&AG: NDP 2000 – 2006 roads programme rose from 7 billion to 14 billion
• 2006 alone, 360 million spent on land acquisition
• High price of land now distorting planning decisions
• Monaghan co. council zones for development 29 villages one center, implying growth in county of 122,000
• Would have been disastrous; no infrastructure provision or economic plan
• Thankfully rescinded by Minister
Density Dividend: Bull McCabe factor
Density Dividend: Bull McCabe Factor
• Massive transfers of wealth to farming community (already benefit 40 billion from CAP)
• Impact on cost of accommodation severe.• Impact on residential, commercial & industrial
rents also severe• Sean Dunne 59 million per square acre;
Unsustainable unless we build up.
• Erskine Childrers 1957 “It is not too much to say that our entire economy will stand or fall by the use made of the land”
• > 100 local authorities• Poor interaction with road / rail authorities / government
departments• Plays havoc with infrastructure planning and cost
effectiveness
• 2006: N.I. local authorities cut from 26 to 7
• Consolidation of local authorities from 100 into around 8 properly planned authorities corresponding to existing regions would– Achieve economies of scale– Provide proper local government– Be consistent with reform of local authority finance and real
local democracy– not to mention segregation of local from national perspectives
amongst our TDs.
Density Dividend: Ireland of the 100 governments
• How do we want to be governed?– National or tribal interest?– Leadership or “followership” ?– Short term or Long term?
• Existing electoral system..– Gives huge weight to organised lobbies
who trade votes or favours– Large mass of voters who seek national
interest ignored
• Electoral reform needed to desensitise system to minorities & facilitate reform
Density Dividend: Electoral Reform
• Ireland is a bicycle in a traffic jam.– It is bizarrely underpopulated– It is linked into the euro zone and US economies
and is forging strong links with Asia
• But…– …although 1957 saw “external” side of economy– ..internal side still needs drastic reform
• Vast gains in terms of potential economic growth are there for the taking
• So….let the debate begin.
CONCLUSIONS