presentation: oil & gas law chapter 1: rule of capture 1.pdf · oil & gas law chapter 1:...
TRANSCRIPT
Oil & Gas Law Chapter 1: Rule of Capture Professors Wells
Presentation:
August 21, 2017
2
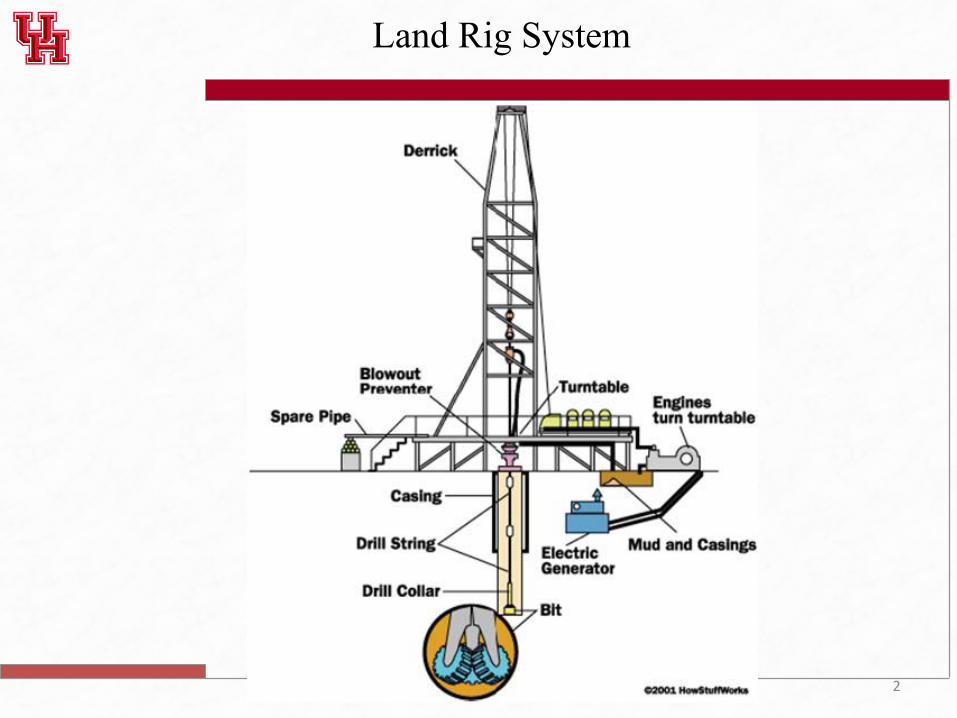
Land Rig System

3
Photo courtesy the Energy Institute
Mud Circulation

Mud System

Float Collar
Guide Shoe
Top Plug
Bottom Plug
Plug Container
Centrilizer
Basics of Well Cementing

Well Cementing Animation

Perforating Animation
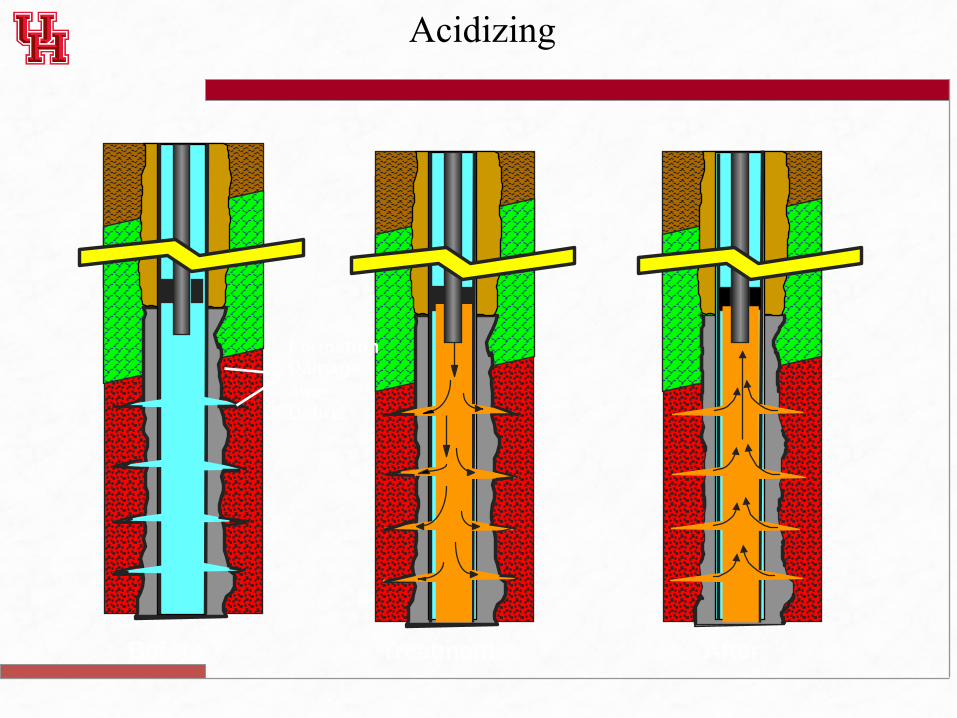
Acidizing
Before Treatment After
Formation Damage and Debris

Fracturing Treatment
Polymer Concentrated within Proppant-Pack
Filter Cake
Proppant Suspended in Fluid
Fracture Extension - Proppant Placement
Proppant Placed - Pumping Halted - Fracture Closure

Fracturing Demonstration

Hydraulic Fracturing: Surface Use Concerns

12
Fracturing in Horizontal Wells
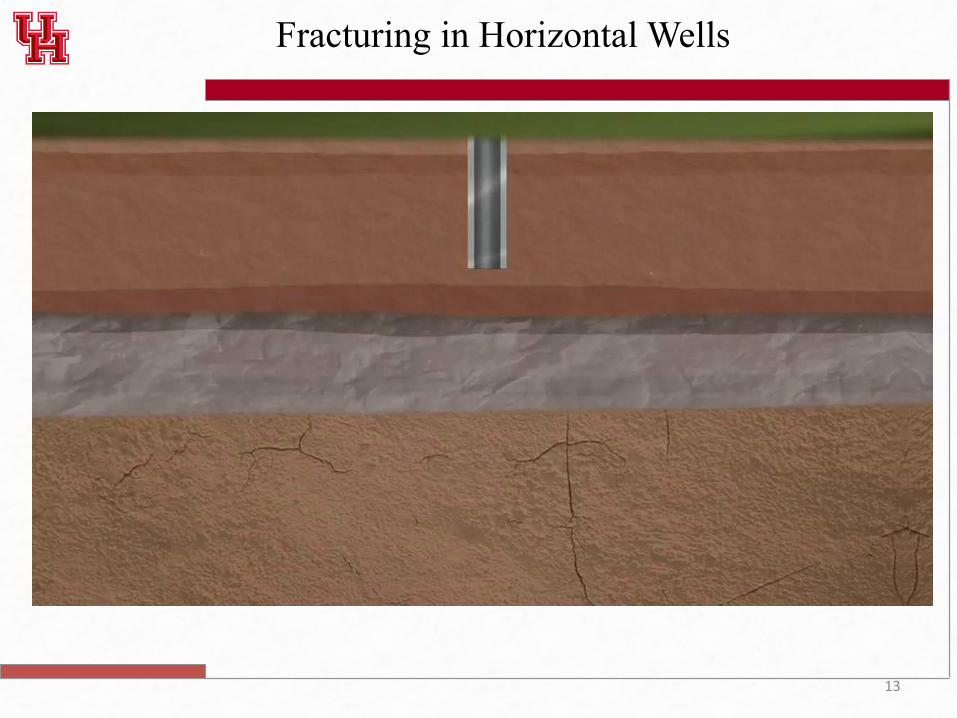
13
Fracturing in Horizontal Wells
14
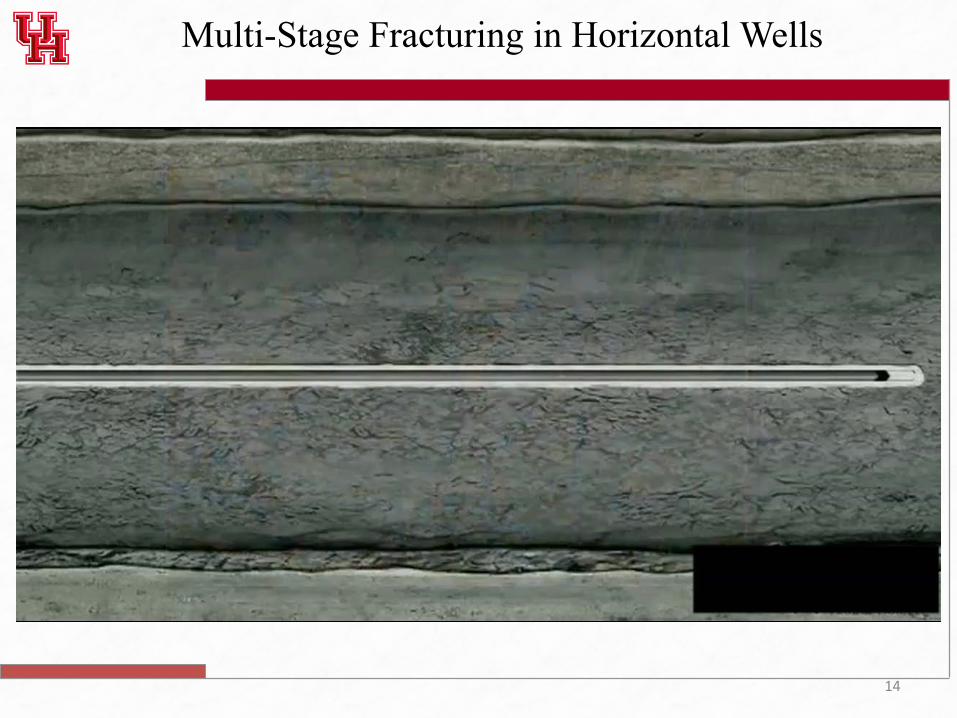
Multi-Stage Fracturing in Horizontal Wells

15
Separator Units and Storage Units
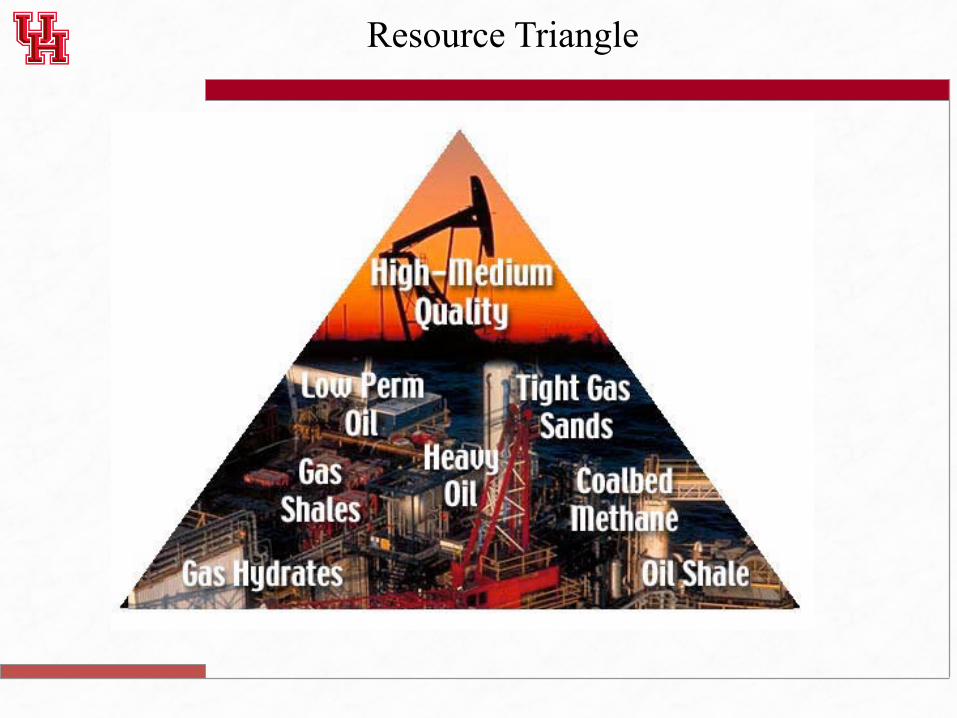
Resource Triangle

North America Gas Shale Basins

18
Sources of Energy
U.S. Energy Information Administration | Annual Energy Outlook 2015 15
Energy consumption by primary fuel
penetration and saturation in the buildings sectors. As a result, MEL and nonelectric miscellaneous uses are difficult targets for federal efficiency standards.25
Penetration of grid-connected distributed generation continues to grow as both equipment and non-equipment costs decline, slowing delivered electricity demand growth in both residential and commercial buildings. In the AEO2015 Reference case, solar photovoltaic (PV) capacity in the residential sector grows by an average of about 30%/year from 2013 through 2016, compared with 9%/year for commercial sector PV, driven by the recent popularity of third-party leasing and other innovative financing options and tax credits. Following expiration of the 30% federal investment tax credit at the end of 2016, the average annual growth of PV capacity in residential and commercial buildings slows to about 6% in both sectors through 2040.Natural gas CHP capacity in the commercial sector grows by an average of 9%/year from 2013 to 2040 in the Reference case and shows little variation across the alternative cases. Although natural gas prices are lower in the High Oil and Gas Resource case than in the Reference case, lower electricity prices limit the attractiveness of commercial CHP relative to purchased electricity.
Energy consumption by primary fuelTotal primary energy consumption grows in the AEO2015 Reference case by 8.6 quadrillion Btu (8.9%), from 97.1 quadrillion Btu in 2013 to 105.7 quadrillion Btu in 2040 (Figure 18). Most of the growth is in consumption of natural gas and renewable energy. Consumption of petroleum products across all sectors in 2040 is unchanged from 2013 levels, as motor gasoline consumption in the transportation sector declines as a result of a 70% increase in the average efficiency of on-road light-duty vehicles (LDVs), to 37 mpg in 2040, which more than offsets projected growth in vehicle miles traveled (VMT). Total motor gasoline consumption in the transportation sector is about 3.4 quadrillion Btu (1.8 million barrels per day (bbl/d)) lower in 2040 than in 2013, and total petroleum consumption in the transportation sector is about 1.6 quadrillion Btu (0.9 million bbl/d) lower in 2040 than in 2013.U.S. consumption of petroleum and other liquids, which totaled 35.9 quadrillion Btu (19.0 million bbl/d) in 2013, increases to 37.1 quadrillion Btu (19.6 million bbl/d) in 2020, then declines to 36.2 quadrillion Btu (19.3 million bbl/d) in
25 Navigant Consulting Inc. and Leidos—formerly SAIC, Analysis and Representation of Miscellaneous Electric Loads in NEMS, prepared for the U.S. Energy Information Administration (Washington, DC: May 2013), http://www.eia.gov/analysis/studies/demand/miscelectric/.
0 15 30 45 60
Computers and related equipment
Lighting
TVs and set-top boxes
Cooking
Refrigerators and freezers
Laundry and dishwashing
Water heating
Miscellaneous electric loadsand other end uses
Heating, cooling, and ventilation
20402013
Figure 16. Residential sector delivered energy intensity for selected end uses in the Reference case, 2013 and 2040 (million Btu per household per year)
Cooking
Office equipment: non-PC
Office equipment: PCs
Refrigeration
Water heating
Lighting
Miscellaneous electric loadsand other end uses
Heating, cooling, and ventilation
0 10 20 30 40 50
20132040
Figure 17. Commercial sector delivered energy intensity for selected end uses in the Reference case, 2013 and 2040 (thousand Btu per square foot per year)
0
20
40
60
80
100
120
1980 1990 2000 2013 2020 2030 2040
2013 ProjectionsHistory
Natural gas
RenewablesLiquid biofuels
Nuclear
Coal
Petroleum and other liquids
27%
8%
18%
8%1%
36%
29%
10%
18%
8%1%
33%
1990
23%
7%23%
7%
40%
Figure 18. Primary energy consumption by fuel in the Reference case, 1980-2040 (quadrillion Btu)
Source: EIA Annual Energy Outlook 2015
19
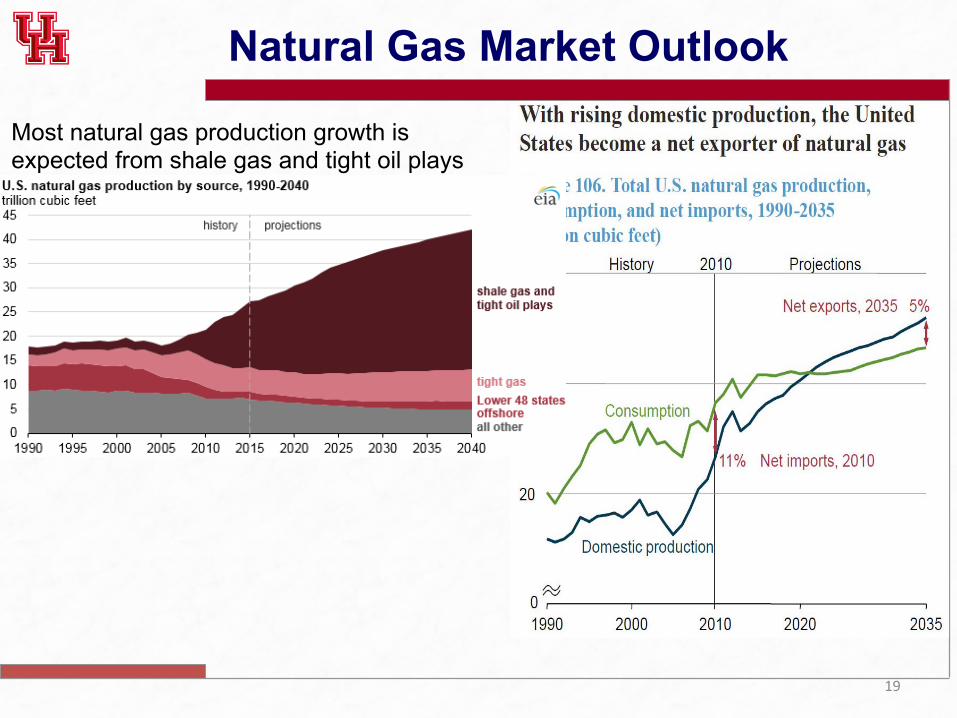
Natural Gas Market Outlook
Most natural gas production growth is expected from shale gas and tight oil plays
20
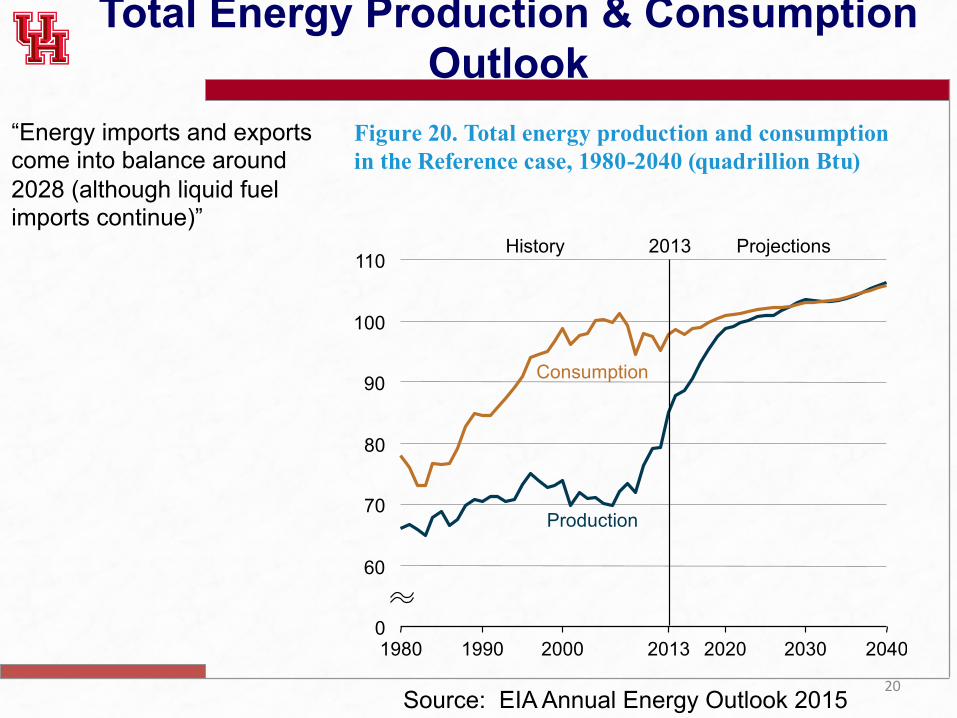
Total Energy Production & Consumption Outlook
“Energy imports and exports come into balance around 2028 (although liquid fuel imports continue)”
U.S. Energy Information Administration | Annual Energy Outlook 2015 17
Energy production, imports, and exports
Increasing energy efficiency reduces the energy intensity of many residential end uses between 2013 and 2040. Total energy consumption for space heating is 4.2 quadrillion Btu in 2040, 1.7 quadrillion Btu (57%) lower than it was in 2013, despite a 23% increase in the number of households and an 11% increase in the average size (square feet) of a household. Energy use for lighting is 0.8 quadrillion Btu in 2040, 1.0 quadrillion Btu lower than it was in 2013 reflecting a 57% decline in energy use despite an increase in lighting services. Energy use for computers and related equipment is 0.1 quadrillion Btu, 0.2 quadrillion Btu lower than it was in 2013. Improved efficiency also reduces delivered energy use in the transportation sector from 27.0 quadrillion Btu in 2013 to 26.5 quadrillion Btu in 2040, by 0.5 quadrillion Btu, as motor gasoline consumption declines by 3.4 quadrillion Btu. The result is an average annual reduction in energy use per capita of 0.4%/year from 2013 through 2040 and an average annual decline in energy use per 2009 dollar of GDP of 2.0%/year. As renewable fuels and natural gas account for larger shares of total energy consumption, carbon intensity (CO2 emissions per unit of GDP) declines by 2.3%/year from 2013 to 2040.Macroeconomic growth has the largest impact on energy intensity among the AEO2015 alternative cases. Real GDP grows by an average of 1.8%/year from 2013 to 2040 in the Low Economic Growth case, and population grows by an average of 0.6%/year over the same period. Even though energy use increases only slightly (growing by 0.9 quadrillion Btu from 2013 to 2040) because GDP growth is lower than in the other cases, energy intensity as measured in relationship to GDP declines the least—an average rate of 1.8% per year from 2013 to 2040. However, the same case shows the largest decline in energy use per person, averaging 0.5%/year from 2013 to 2040. In the High Economic Growth case, real GDP increases at an average annual rate of 2.9%/year, population grows at an average annual rate of 0.8%/year, and energy use increases at an average annual rate of 0.7%/year from 2013 to 2040. As a result, the energy intensity of GDP declines at a slightly higher rate than in the Reference case, while the decline in energy use per person is slower than in the Reference case.
Energy production, imports, and exportsNet U.S. imports of energy declined from 30% of total energy consumption in 2005 to 13% in 2013, as a result of strong growth in domestic oil and dry natural gas production from tight formations and slow growth of total energy consumption. The decline in net energy imports is projected to continue at a slower rate in the AEO2015 Reference case, with energy imports and exports coming into balance around 2028 (although liquid fuel imports continue, at a reduced level, throughout the Reference case). From 2035 to 2040, energy exports account for about 23% of total annual U.S. energy production in the Reference case (Figure 20). Economic growth has a major influence on U.S. energy consumption, imports, and exports. In the High Economic Growth case, the United States remains a net energy importer through 2040, with net imports equal to about 3% of consumption in 2040. In the Low Economic Growth case, the United States becomes a net exporter of energy in 2022, with energy exports equal to 4% of total domestic energy production in 2040.Changes in the world oil price affect both consumption and production, but in opposite directions from the effects of changes in U.S. economic growth. Higher world oil prices place downward pressure on consumption while making domestic production more profitable. In the Low Oil Price case, with lower domestic production and higher U.S. energy consumption, the United States remains a net energy importer, with imports increasing every year from 2033 to 2040 and net imports equal to 9% of total domestic energy
0
0.5
1.0
1.5
2.0
1980 1990 2000 2013 2020 2030 2040
2013 ProjectionsHistory
Energy per dollar
Energy per capita
Emissions per dollar
Figure 19. Energy use per capita and per 2009 dollar of gross domestic product, and carbon dioxide emissions per 2009 dollar of gross domestic product, in the Reference case, 1980-2040 (index, 2005 = 1.0)
0
60
70
80
90
100
110
1980 1990 2000 2013 2020 2030 2040
2013 ProjectionsHistory
Consumption
Production
Figure 20. Total energy production and consumption in the Reference case, 1980-2040 (quadrillion Btu)
Source: EIA Annual Energy Outlook 2015

Major Texas Oil and Gas Fields
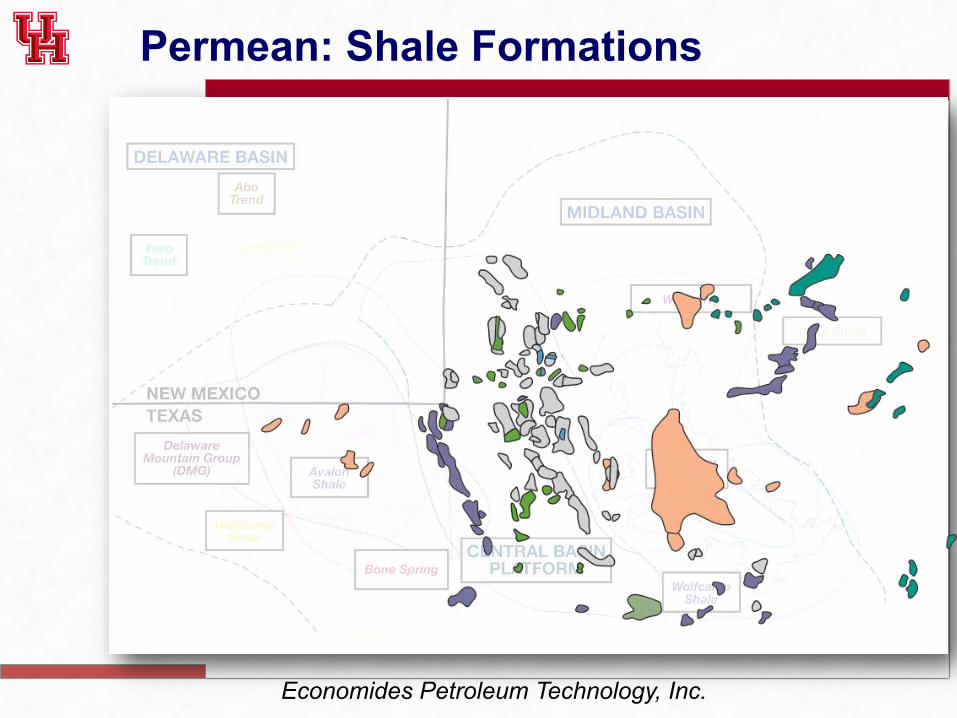
Permean: Shale Formations
Economides Petroleum Technology, Inc.

Permian: Conventional and Shale
Economides Petroleum Technology, Inc.

Permian: Conventional and Shale
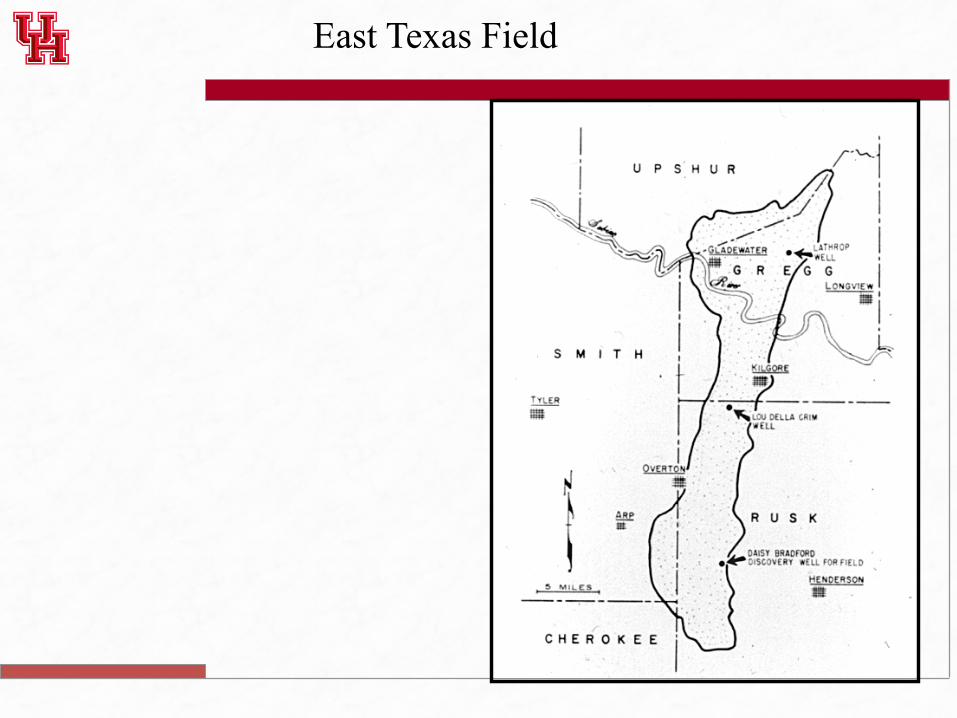
East Texas Field

28
Reservoir Dynamics
1. Dissolved Gas Drive
2. Gas Cap Drive
3. Water Drive
Public Policy is best promoted when: 1. Production is maintained at a controlled rate 2. Proper location of wells

Gas Cap / Water Drive

Figure 6-7. Very large but non-artesian associated aquifer-edge water drive reservoir.
Water Drive

Reservoir Dynamics

Permeability
• Abilityofarocktotransmitfluid
– Unitsareinlengthsquared(sq.feet,sq.meters,etc.)
– Sincethoseunitswillresultinsmallnumbers,millidarcies(md)arethestandardunitforpermeability

Permeability

Permeability

35
Secondary Recovery Dynamics
1. Injection of gas or water is used to drive oil away from injection well and towards the producing stripper well
2. Enhanced Oil Recovery involves either thermal processes; carbon dioxide flooding; or chemical flooding.
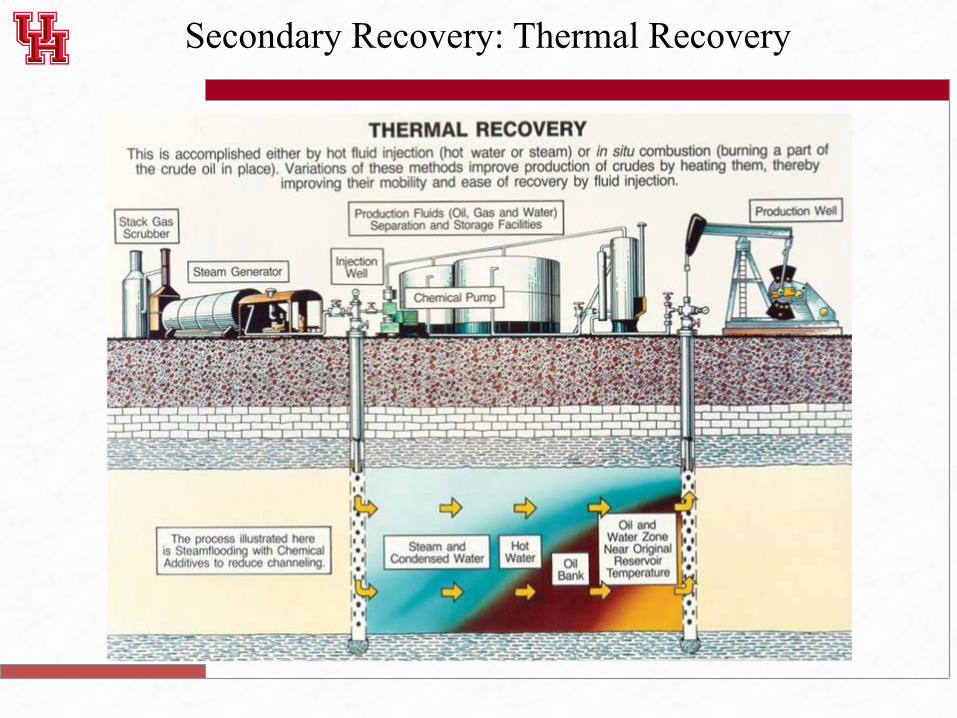
Secondary Recovery: Thermal Recovery

Secondary Recovery: CO2 Injection

Secondary Recovery: Water Flush

39
The Mineral Estate “Bundle” consists of the following Attributes or Incidents: 1. Right to use the surface
§ Surface Easement: defined by common law accommodation doctrine, or express language in deed and some statutes
§ Mineral Estate is dominate 2. Right to develop
§ Mineral Estate is a cost-bearing interest § Incur the cost of self-developing
3. Right to alienate or convey (lease) § The Executive Right: the right to execute an oil and gas lease § The right comes with duties to non-executives
4. Right to share in lease benefits
§ Bonus § Delay Rentals § Shut-in Royalties § Land-owner’s Royalty (fractional amount of production or proceeds from sale of production)
Mineral Estate

40
Example: Jill conveys an undivided ½ mineral interest to Jack but reserves all executive rights in Blackacre to herself. Blackacre Title: Jill owns the surface and an undivided ½ mineral interest and all of the executive rights. Jack owns an undivided ½ non-executive mineral interest that is called a non-participating mineral interest. Jack cannot lease or develop Blackacre, but Jack is entitled to ½ of the mineral estate attributes from leasing of the mineral estate.
Mineral Estate: Creation of a Non-Participating Mineral Interest

41
Non-Participating Royalty Interest 1. Cost free interest 2. No mineral estate attributes (e.g., cannot lease and cannot receive lease benefits) 3. NPRI owner entitled to share of production or proceeds from sale of production 4. NPRI is a vested real property interest in Texas, so there is no Rule of Perpetuities issue with creating this
interest.
Example (1): Jill conveys to Jack a 1/16th royalty interest in Blackacre. Blackacre Title: Jill owns the surface and all of the minerals. Jack owns a 1/16th NPRI. Jill’s mineral estate is burdened by the NPRI. Consequently, when the minerals are leased or otherwise developed, Jack is entitled to 1/16th of the oil and gas or proceeds from the sale of the oil and gas free of cost (or “off the top”). Example (2): Jill conveys to Jack “1/2 of the royalty reserved in any lease on Blackacre.” Blackacre Title: Jill owns the surface and all of the minerals. Jill’s mineral estate is burdened by the NPRI. However, this time, when Jill executes an oil and gas lease, Jack is entitled to 1/2 of the royalty reserved in the oil and gas lease. Thus, if Jill executed a lease that reserved for the landowner a 1/8th royalty, then Jack is entitled to ½ of that 1/8th royalty or in other words is entitled to 1/16th of all royalties (i.e., ½ * 1/8th royalty ).
Mineral Estate: Creation of a Non-Participating Royalty Interest

42
Landowner Royalty: This royalty is created in an oil and gas lease. The benefits are reserved to the lessor. It has the same attributes as the general royalty interest in that it represents a cost free percentage of production or proceeds from the sale of production (i.e., it is paid “off the top”).
Example (1): Jill executes an oil and gas lease with Humble Oil Company and reserves a 1/8th landowner’s royalty interest in Blackacre. Blackacre Title:
• Humble Oil Company: Owns a Fee Simple Determinable in the mineral estate. The FSD is a possessory estate in all of the minerals covered by the lease. Humble Oil Company’s estate lasts “so long as oil and gas are produced in paying quantities.” The leasehold interest held by the lessee (Humble Oil Company) is also referred to as the working interest because the lessee is the person that generally takes the executive right to work or operate the property.
• Jill: Jill owns a landowner’s royalty that entitles her to 1/8th percentage of production or proceeds from the sale of production free of all cost (“off the top”). Jill also owns a Possibility of Reverter. A The possibility of Reverter is a vested non-possessory estate in all of the minerals conveyed by the lease that entitles Jill to all of the mineral estate when the lease ends (i.e., when the FSD expires). Because the possibility of reverter is a vested property right, it does not create a Rules Against Perpetuity issue.
Mineral Estate: Creation of a Land-Owner Royalties
43
Assignment: Total or partial transfer of lease. In this situation, the lessee generally reserves an Overriding Royalty Interest. An overriding royalty interest is a royalty that is carved out of the oil and gas lease. This royalty allows the royalty holder to a percentage of production or of the proceeds from the sale of production free of cost (“off the top”).
Example: Humble Oil Company assigns to grantee (geologist, oil service company, etc.) the right to 1/16th of all of the oil, gas, and other minerals produced in the lease.
Blackacre Title: Humble Oil Company has a fee simple determinable interest in all of the minerals. The landowner has a possibility of reverter and also may be entitled to a landowner’s royalty. The Humble Oil Company’s fee simple determinable interest is burdened by the landowner’s royalty and also is burdened by the overriding royalty).
Farmout: An agreement in which lessee agrees to assign the lessee’s interest to the farmee upon farmee’s completion of a “drill and earn” provision.
Conveyance of Lessee’s Interest in Mineral Estates
44
Example: Jack owns an undivided ½ interest in minerals under Blackacre and Jill owns the other undivided ½. Jack has ½ of bonus and Jill is entitled to ½ of bonus payments. Jill can lease her undivided ½ interest in Blackacre and Jack can lease his undivided ½ interest in Blackacre. Question: Can Jill lease without joinder of Jack? Yes, one co-tenant can lease without joinder of other cotenants, but Jill or her lessee then has a duty to account to Jack for ½ of the net profits (producer can deduct reasonable cost before accounting proportionately to the non-joined co-tenant).
Mineral Estate: Cotenants

45
Basics of Oil & Gas Lease p.5
Royalty Working Interest Bonus Delay Rentals Term of Lease (primary term) Royalties to be paid (historically 1/8th but not as much as 1/4th) Delay Rentals (paid up?) for privilege of deferring drilling

46
Rule of Capture: Barnard v. Monoghala Natural Gas
1. Facts
2. Discuss Policy Implications
Elizabeth & Daniel Barnard
66 Acres
James B. Barnard
156 Acres
35’
Dry Hole 1,350’
1,695’ or 8.12 acres
Monoghala (lessee)
337’

47
Rule of Capture: “the owner of a tract of land acquires title to the oil or gas which he produces from wells on his land, though part of the oil or gas may have migrated from adjoining lands. He may thus appropriate the oil and gas that have flowed from adjacent lands without the consent of the owner of those lands and without incurring liability to him for drainage.” This rule is followed in all producing states, whether they have adopted an “ownership in place” theory such as Texas has or have adopted a “non-ownership” approach such as Louisiana and California. The defense to the rule of capture is: the rule of capture. Thus there is a great incentive to drill wells to prevent another party from draining your property and to produce from such wells as rapidly as possible.
- Kramer & Martin, Pooling and Unitization,1 §2[1]
Rule of Capture: Barnard v. Monoghala Natural Gas

48
Rule of Capture:

In the tale, The Little Red Hen finds a grain of wheat, and asks for help from the other farmyard animals to plant it. However, no animal will volunteer to help her. At each further stage (harvest, threshing, milling the wheat into flour, and baking the flour into bread), the hen again asks for help from the other animals, but again she gets no assistance. Finally, the hen has completed her task, and asks who will help her eat the bread. This time, all the previous non-participants eagerly volunteer. However, she declines their help, stating that no one aided her in the preparation work, and eats it with her chicks, leaving none for anyone else. The moral of this story is that those who show no willingness to contribute to an end product do not deserve to enjoy the end product: "if a man does not work, let him not eat.
From Wikipedia
Rule of Capture: Little Red Hen

50
Rule of Capture:

51
Reservoir Dynamics
1. Dissolved Gas Drive
2. Gas Cap Drive
3. Water Drive
Public Policy is best promoted when: 1. Production is maintained at a controlled rate 2. Proper location of wells
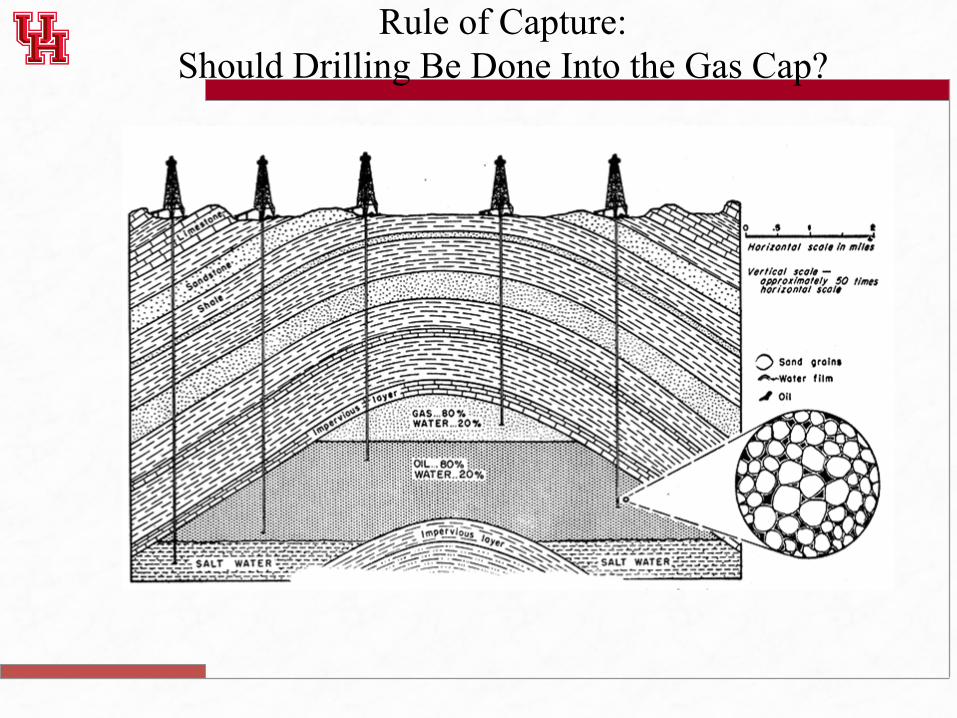
Rule of Capture: Should Drilling Be Done Into the Gas Cap?
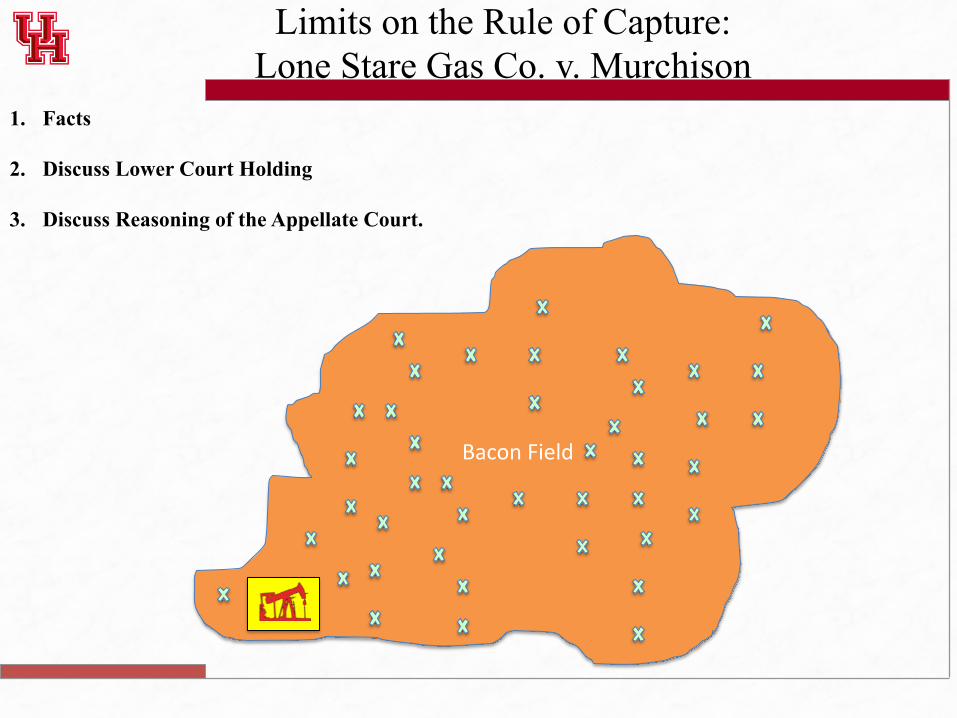
Limits on the Rule of Capture: Lone Stare Gas Co. v. Murchison
1. Facts
2. Discuss Lower Court Holding
3. Discuss Reasoning of the Appellate Court.
BaconField
54
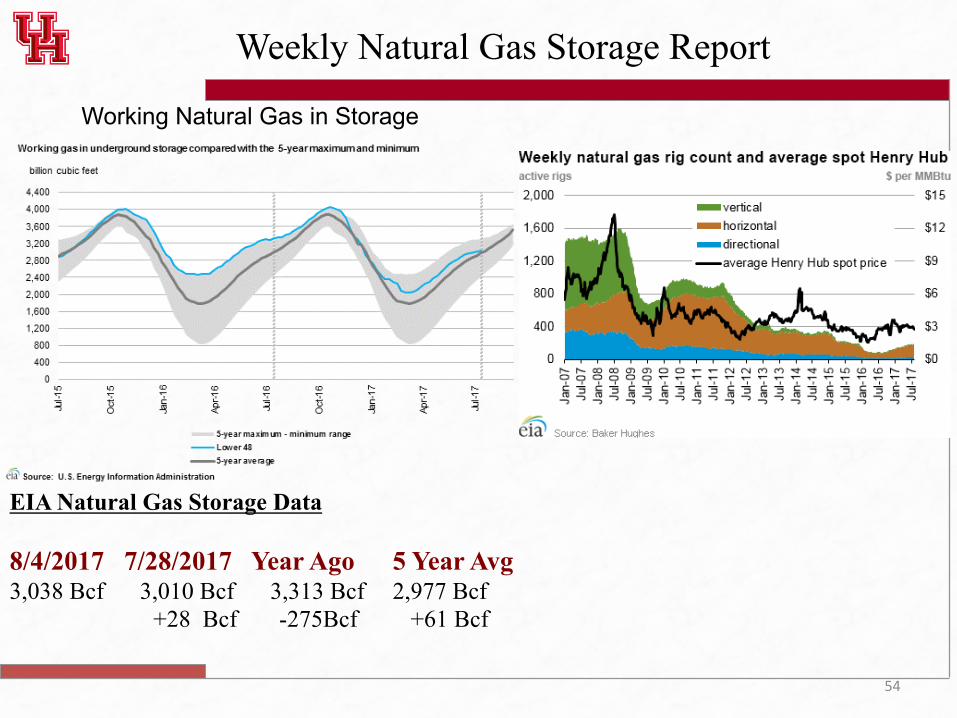
Weekly Natural Gas Storage Report
Working Natural Gas in Storage
EIA Natural Gas Storage Data 8/4/2017 7/28/2017 Year Ago 5 Year Avg 3,038 Bcf 3,010 Bcf 3,313 Bcf 2,977 Bcf
+28 Bcf -275Bcf +61 Bcf

55
Review Problem Page 1-14
1. Facts Diamond Jim West sells Blackacre to Exxon, reserving a 1/16 royalty on oil and gas produced from Blackacre. As the natural gas in the reservoir underlying Blackacre nears depletion, Exxon injects gas transported from a distant gas field into the reservoir. Some native gas remains in the reservoir. When Exxon withdrasws the gas from the reservoir, West demands a 1/16 royalty on this gas. Does Exxon owe West this 1/16 royalty?
2. Answer?
56
Limits on the Rule of Capture: Texas American Energy Corp. v. Citizens Fidelity
1. Facts
2. Discuss Hammons Holding
For the same ‘sound and logical reason, especially in light of advanced knowledge and scientific achievement in the oil and gas industry . . . ‘ this Court is of the opinion that it is time to limit Hammond and to now hold that natural gas once converted to personal property by extraction remains personal property notwithstanding its subsequent storage in underground reservoirs with confinement integrity.
3. Discuss Holding.
57
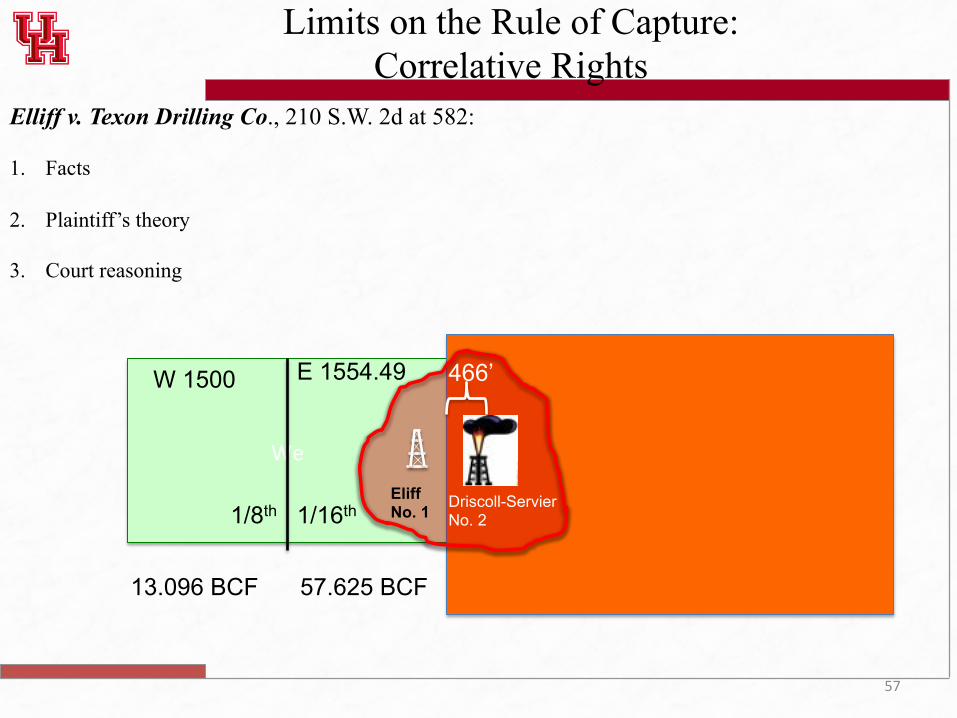
Limits on the Rule of Capture: Correlative Rights
Elliff v. Texon Drilling Co., 210 S.W. 2d at 582: 1. Facts
2. Plaintiff’s theory
3. Court reasoning
We
W 1500 E 1554.49
1/8th
1/16th
13.096 BCF 57.625 BCF
466’
Driscoll-Servier No. 2
Eliff No. 1
58
Limits on the Rule of Capture: Correlative Rights and Negligence
Elliff v. Texon Drilling Co., 210 S.W. 2d at 582: [N]otwithstanding the fact that oil and gas beneath the surface are subject both to capture and administrative regulation, the fundamental rule of absolute ownership of the minerals in place is not affected in our state. In recognition of such ownership, our courts, in decisions involving well-spacing regulations of our Railroad Commission, have frequently announced the sound view that each landowner should be afforded the opportunity to produce his fair share of the recoverable oil and gas beneath his land, which is but another way of recognizing the existence of correlative rights between the various landowners over a common reservoir of oil or gas. It must be conceded that under the law of capture there is no liability for reasonable and legitimate drainage from the common pool. The landowner is privileged to sink as many wells as he desires upon his tract of land and extract therefrom and appropriate all the oil and gas that he may produce, so long as he operates within the spirit and purpose of conservation statutes and orders of the Railroad Commission. These laws and regulations are designed to afford each owner a reasonable opportunity to produce his proportionate part of the oil and gas from the entire pool and to prevent operating practices injurious to the common reservoir. In this manner, if all operators exercise the same degree of skill and diligence, each owner will recover in most instances his fair share of the oil and gas. This reasonable opportunity to produce his fair share of the oil and gas is the landowner’s common law right under our theory of absolute ownership of the minerals in place. But from the very nature of this theory the right of each land holder is qualified, and is limited to legitimate operations. Each owner whose land overlies the basin has a like interest, and each must of necessity exercise his right with some regard to the rights of others. No owner should be permitted to carry on his operations in reckless or lawless irresponsibility, but must submit to such limitations as are necessary to enable each to get his own.
59
Limits on the Rule of Capture: Correlative Rights and Nusuance
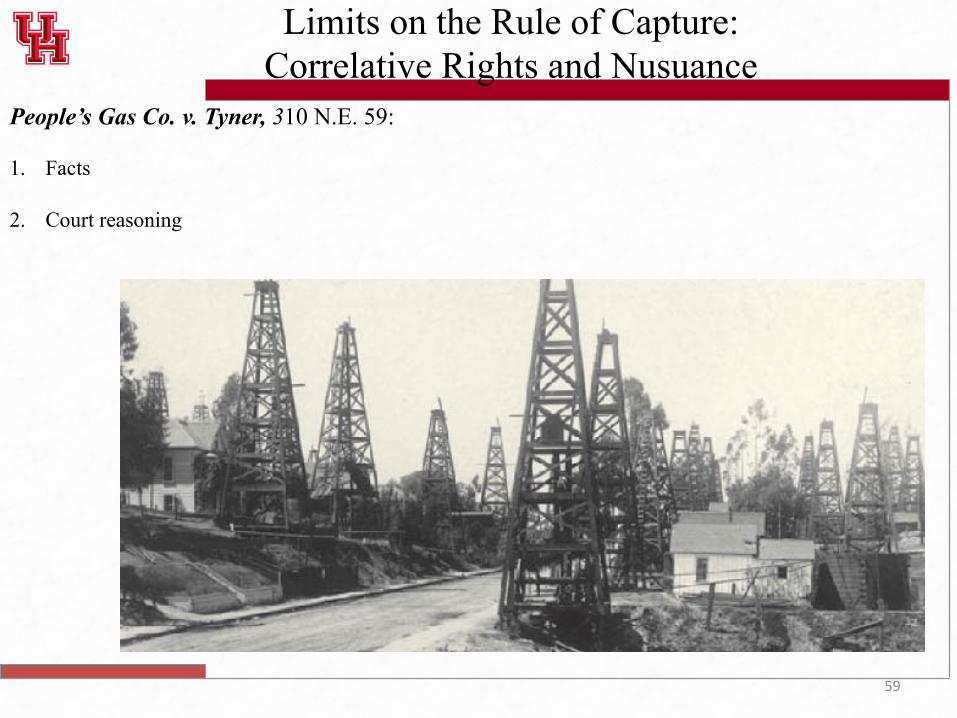
People’s Gas Co. v. Tyner, 310 N.E. 59: 1. Facts
2. Court reasoning

60
Limits on the Rule of Capture: Correlative Rights and Waste
United Carbon Co. v. Campbellsville Gas Co., 118 S.W. 2d 1110: 1. Facts
2. Court reasoning
61
Limits on the Rule of Capture: Correlative Rights and Illegal Production
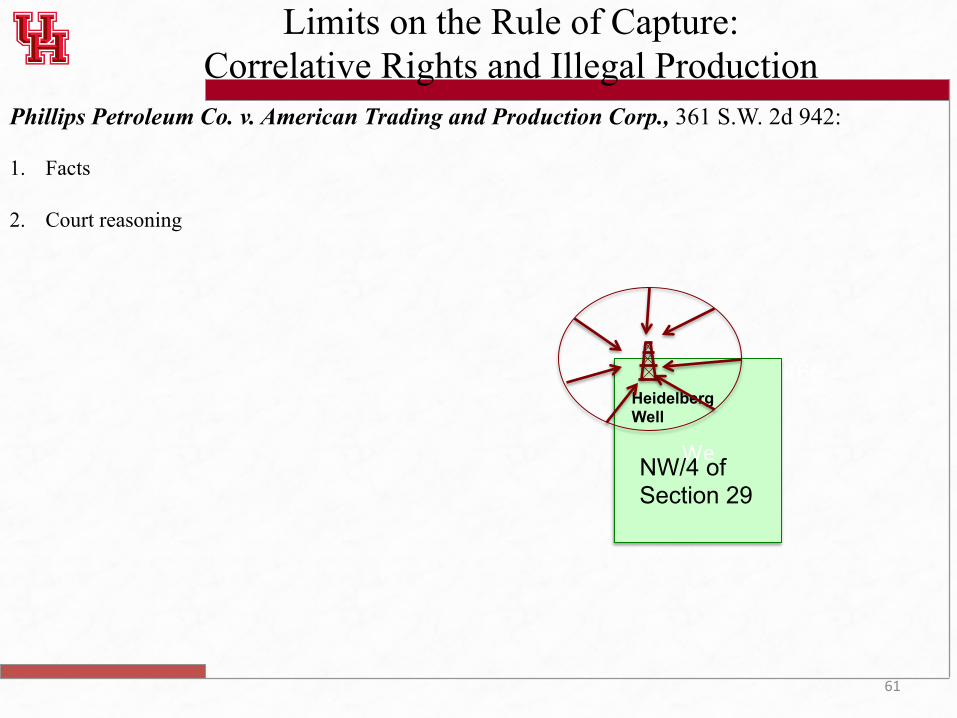
Phillips Petroleum Co. v. American Trading and Production Corp., 361 S.W. 2d 942: 1. Facts
2. Court reasoning
We
466’ Heidelberg Well
NW/4 of Section 29

62
Limits on the Rule of Capture: Correlative Rights and Illegal Production
Wronski v. Sun Oil Co., 279 N. W. 2d 564: 1. Facts
2. Court reasoning
Tract 1 (20 acres)
Tract 2 (20 acres)
Tract 6 (40 acres)
Koziara Wronski H.H. Winn Sun Oil as Lessee
Tract 7 (8 acres)
Tract 13 (40 acres)
Tract 8
Tract 12
Tract 9
Well 1-C
Wells 3 & 6
Columbus Section 3 Saline-Niagaran Formation Pool
¶ ¶

63
Limits on the Rule of Capture: Correlative Rights and Illegal Production
Tract 2 (20 acres) 100% Luecke
50% Luecke
Browning Oil is Lessee
Tract 3
Jennifer Mendoza Well 1
Austin Chalk Formation
Tract 1 (20 acres)
Weyand-Hays Unit Well 1
Browning Oil v. Luecke., 38 S.W. 3d 625: 1. Facts
2. Court reasoning: The better remedy is to allow the offended lessors to recover royalties as specified in the lease, compelling a determination of what portion can be attributed to their tracts with reasonable probability. The Lueckes are entitled to the royalties for which they contracted, no more and no less.

Horizontal Drainhole Displacement
Kick-Off Point
> <
> <
>
<
> <
Horizontal Drilling Deviated Drilling
Terminus
Correlative Interval
Penetration Point
A B C
Horizontal Well Diagram #1 (Overview of a Horizontal Well)
> <
> <
>
<
> <
> <
>
<
“Take-Points” (Perforations)
Unanswered Question: How Do we calculate production from a particular tract?