presentation from 2015 world water week in stockholmpresentation from 2015 world water week in...
TRANSCRIPT

© SIWI | siwi.org
Presentation from
2015 World Water
Week in Stockholm
www.worldwaterweek.org
© The authors, all rights reserved

The BoP
Market for
Drip Irrigation
World Water Week
August 2015


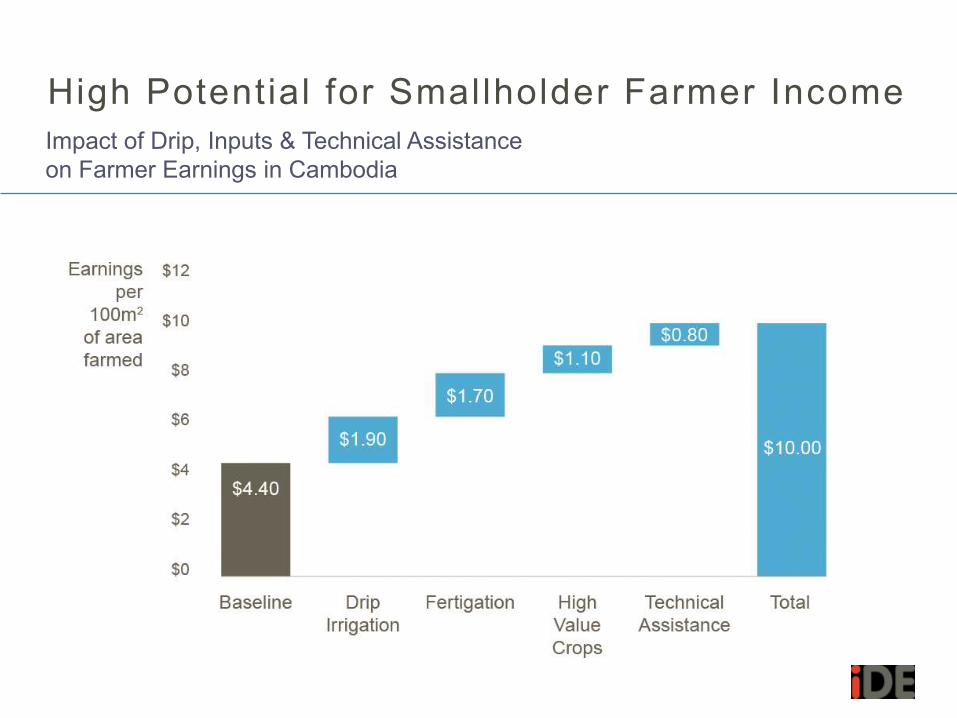
High Potential for Smallholder Farmer Income
Impact of Drip, Inputs & Technical Assistance
on Farmer Earnings in Cambodia

Irr igation
Area Equipped for Irrigation as a % of Agricultural Area

A Wealth of Information
Collected from the World’s Experts
Manufacturers
Distributors
iDE Senior Staff
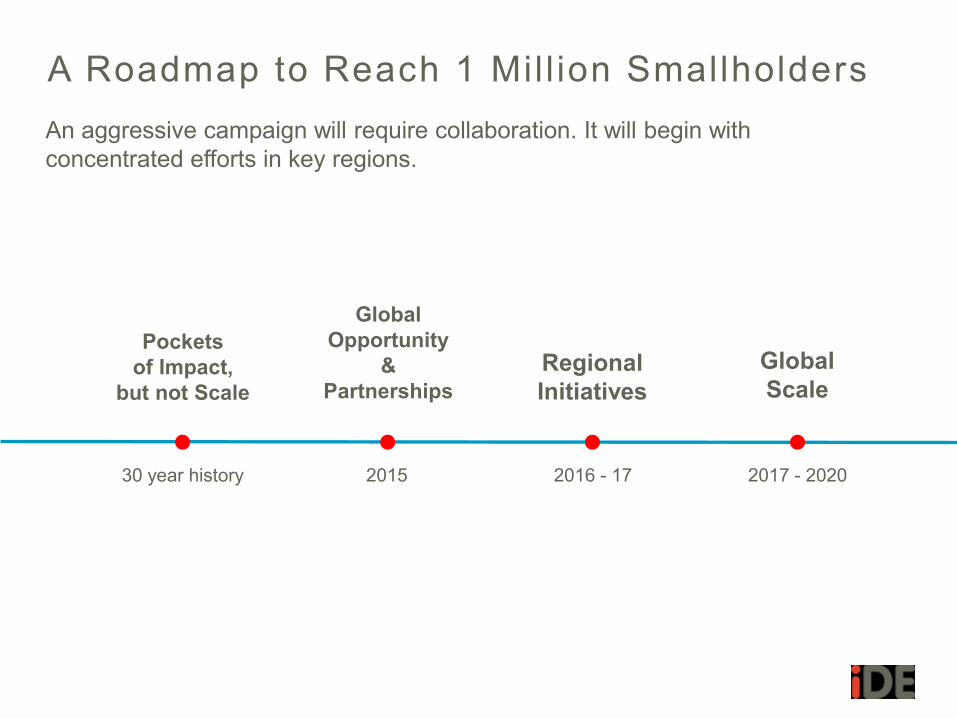
A Roadmap to Reach 1 Mil l ion Smallholders
An aggressive campaign will require collaboration. It will begin with
concentrated efforts in key regions.
Global
Opportunity
&
Partnerships
Regional
Initiatives
Global
Scale
2016 - 17 2017 - 20202015
Pockets
of Impact,
but not Scale
30 year history

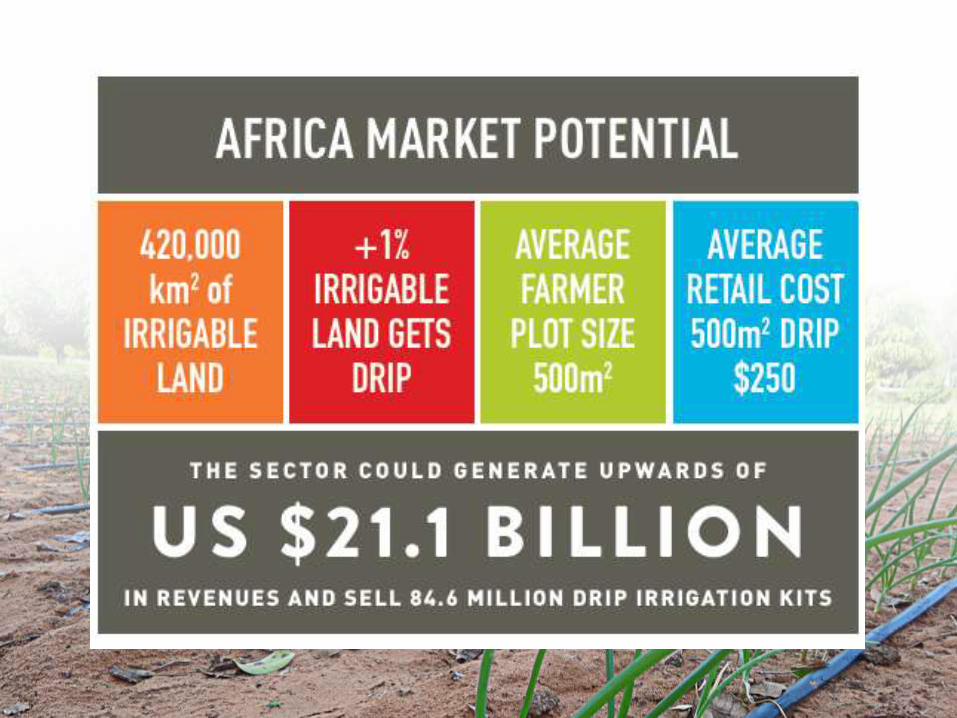
Our Question:
How can we unlock the global drip
BoP market opportunity?

We must start by analyzing the local value chain,
including technology, supply, agro-economics,
Market
Systems
Analysis
road improvements, cold chain storage,
and market access.
Insight:

We must also unleash
a new class of micro-entrepreneurs
5Ps:
Perception
Product
Price
Place
Promotion
who can make a profitable business
Insight:
of selling, training and providing services.

Smallholders rely on
Insight:
peer influence.
Smallholder Mindset
Market Research Data:
Top Perceptions that Influence Purchase Decisions
Perception

Strongest perceptions of
Insight:
drip are around time and water
Market Research Data:
Perceptions of the Benefits of Drip
savings, less about increase
Product
Benefits of Drip Not
Understood
in yield and crop quality.
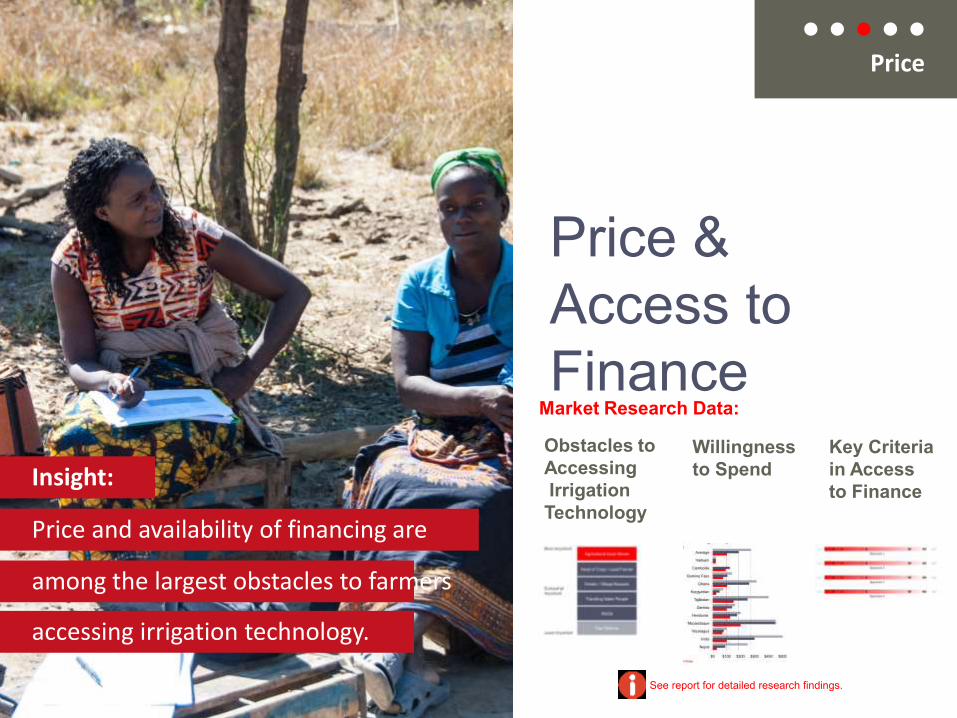
Price and availability of financing are
Insight:
among the largest obstacles to farmers
Price &
Access to
FinanceObstacles to
Accessing
Irrigation
Technology
accessing irrigation technology.
Willingness
to Spend
Key Criteria
in Access
to Finance
Market Research Data:
Price
See report for detailed research findings.

Price and availability of financing
Insight:
are among the largest obstacles to farmers
Obstacles to Accessing Irrigation Technology
accessing irrigation technology.
Market Research Data:
Price
Price & Access to Finance

Price and availability of financing
Insight:
are among the largest obstacles to farmers
Willingness To Spend
accessing irrigation technology.
Market Research Data:
Price
Price & Access to Finance

Price and availability of financing
Insight:
are among the largest obstacles to farmers
Key Criteria in Access to Finance
accessing irrigation technology.
Market Research Data:
Price
Price & Access to Finance

By leveraging agricultural input
Insight:
stores, we can increase the
Market Research Data:
Where Smallholders Shop
footprint of information and
Place
Distributing to Smallholders
products reaching smallholders.

Word-of-mouth and
Insight:
demonstration plots are the most
Market Research Data:
Channels That Deliver Influence
Promotion
effective promotional channels.
Influencing Smallholders
We need to share the burden of risk
Insight:
with micro-entrepreneurs
in a balanced way
so that everybody wins.
Scaling Drip
By Scaling
Micro-
entrepreneurs

Early adopters are good promoters of
Insights:
Changing
the mindset
majority don’t follow automatically
demonstration farms, but the early

Behaviour change is achieved best in groups:
Insights:
Women entrepreneur group of coffee cooperative for diversification

Smallholders
are different
Sources:
- CGAP, 2013.
- iDE Finance Paper, 2015.
Smallholder Segmentation
Noncommercial Smallholders
---------------------------300 Million Households
Subsistence Farming
Loose Value Chains---------------------------165 Million HouseholdsSurplus Sold in Informal
Markets
Tight Value Chains---------------------------35 Million Households
Contract Farming

Noncommercial Smallholders---------------------------------------------------
300 Million HouseholdsSubsistence Farming
Loans
Technical Assistance
NGOs, Governmental
Programs

Loose Value Chains---------------------------------------------------
165 Million HouseholdsSurplus Sold in Informal Markets
Loans Technical Assistance
Joint Liabilty Groups

Tight Value Chains---------------------------------------------------
35 Million HouseholdsContract Farming
Loans
Technical Assistance
Contract Farming